 Open Access Article
A core–brush 3D DNA nanostructure: the next generation of DNA nanomachine for ultrasensitive sensing and imaging of intracellular microRNA with rapid kinetics†
Lingqi
Kong
,
Beibei
Kou
,
Xiaolong
Zhang
,
Ding
Wang
,
Yali
Yuan
 ,
Ying
Zhuo
 ,
Yaqin
Chai
* and
Ruo
Yuan
 *
*
Key Laboratory of Luminescence Analysis and Molecular Sensing, Ministry of Education, College of Chemistry and Chemical Engineering, Southwest University, Chongqing 400715, PR China. E-mail: yuanruo@swu.edu.cn
First published on 22nd November 2021
Abstract
A highly loaded and integrated core–brush three-dimensional (3D) DNA nanostructure is constructed by programmatically assembling a locked DNA walking arm (DA) and hairpin substrate (HS) into a repetitive array along a well-designed DNA track generated by rolling circle amplification (RCA) and is applied as a 3D DNA nanomachine for rapid and sensitive intracellular microRNA (miRNA) imaging and sensing. Impressively, the homogeneous distribution of the DA and HS at a ratio of 1![[thin space (1/6-em)]](https://www.rsc.org/images/entities/char_2009.gif) :
:![[thin space (1/6-em)]](https://www.rsc.org/images/entities/char_2009.gif) 3 on the DNA track provides a specific walking range for the DA to avoid invalid and random self-walking and notably improve the executive ability of the core–brush 3D DNA nanomachine, which easily solves the major technical challenges of traditional Au-based 3D DNA nanomachines: low loading capacity and low executive efficiency. As a proof of concept, the interaction of miRNA with the 3D DNA nanomachine could initiate the autonomous and progressive operation of the DA to cleave the HS for ultrasensitive ECL detection of target miRNA-21 with a detection limit as low as 3.57 aM and rapid imaging in living cells within 15 min. Therefore, the proposed core–brush 3D DNA nanomachine could not only provide convincing evidence for sensitive detection and rapid visual imaging of biomarkers with tiny change, but also assist researchers in investigating the formation mechanism of tumors, improving their recovery rates and reducing correlative complications. This strategy might enrich the method to design a new generation of 3D DNA nanomachine and promote the development of clinical diagnosis, targeted therapy and prognosis monitoring.
3 on the DNA track provides a specific walking range for the DA to avoid invalid and random self-walking and notably improve the executive ability of the core–brush 3D DNA nanomachine, which easily solves the major technical challenges of traditional Au-based 3D DNA nanomachines: low loading capacity and low executive efficiency. As a proof of concept, the interaction of miRNA with the 3D DNA nanomachine could initiate the autonomous and progressive operation of the DA to cleave the HS for ultrasensitive ECL detection of target miRNA-21 with a detection limit as low as 3.57 aM and rapid imaging in living cells within 15 min. Therefore, the proposed core–brush 3D DNA nanomachine could not only provide convincing evidence for sensitive detection and rapid visual imaging of biomarkers with tiny change, but also assist researchers in investigating the formation mechanism of tumors, improving their recovery rates and reducing correlative complications. This strategy might enrich the method to design a new generation of 3D DNA nanomachine and promote the development of clinical diagnosis, targeted therapy and prognosis monitoring.
Introduction
In living systems, some highly complicated and hierarchical machines have evolved to perform significant biological processes with remarkable precision and efficiency.1–3 Inspired by natural ingenuity, diverse DNA-based nanodevices have been created to convert chemical energy into mechanical motion,4–8 holding great promise for intelligent drug delivery,9–12 disease diagnosis13–16 and biosensing analysis.17–20 Recently, three-dimensional (3D) DNA nanomachines based on gold nanoparticles (AuNPs)21–24 have attracted extensive attention due to their improved abilities in simulating complex biological operation compared with one-dimensional (1D)25,26 or two-dimensional (2D) DNA nanomachines.27,28 However, the limited amount of track and the disordered immobilization of the DNA components (DNA walker and substrate) with a heterogeneous nano (Au)-bio (DNA) interface resulted in the low loading capacity of DNA components and the invalid movement of the DNA walker, further restricting the whole executive ability and efficiency of the Au-based 3D DNA nanomachines. On account of these disadvantages, it has long been a challenging goal to develop a new type of 3D DNA nanomachine that could not only greatly enhance the loading capacity of the DNA components in an orderly manner, but also significantly improve the executive ability and efficiency.Herein, a core–brush 3D DNA nanomachine with highly loaded and integrated properties was developed for intracellular microRNA (miRNA) imaging and ultrasensitive sensing with rapid kinetics (Scheme 1). Firstly, the extremely long DNA track cross-linked on a magnetic nanobead (MNB) was generated by rolling circle amplification (RCA), in which the locked DNAzyme walking arm (DA) and electrochemiluminescent signal tag Rubpy (Ru) labeled hairpin substrate (HS) at a ratio of 1![[thin space (1/6-em)]](https://www.rsc.org/images/entities/char_2009.gif) :
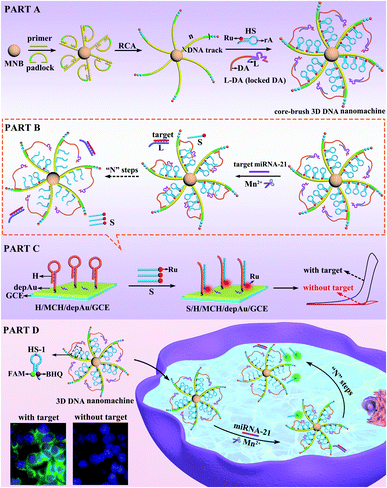
:![[thin space (1/6-em)]](https://www.rsc.org/images/entities/char_2009.gif) 3 were orderly assembled into the DNA track with a repetitive array to construct the core–brush 3D DNA nanomachine (PART A). According to PART B, once the target miRNA-21 was introduced into the 3D DNA nanomachine, the hybridization of miRNA-21 with a locking strand (L) via strand–displacement reaction could release the active DA from the locked DA (L-DA) to hybridize with the adjacent HS. Fueled by the DNAzyme-induced ribonucleotide hydrolysis, the HS was then cleaved by the active DA in the presence of cofactor Mn2+ to release the Ru-labelled segment (S). When S was captured by the DNA hairpin (H) onto a gold nanoparticle-assembled glassy carbon electrode (depAu/GCE) through the Au–S bond, a highly intense ECL signal was generated for ultrasensitive detection of miRNA-21 with a detection limit as low as 3.57 aM (PART C). Impressively, when the DA and HS-1 labelled with a fluorophore (FAM) and quencher (BHQ) were used to assemble our core–brush 3D DNA nanomachine (PART D), the intracellular miRNA-21 could activate autonomous motions of the DA to cleave the HS and release the FAM-labelled segment away from BHQ in the presence of the cofactor Mn2+, leading to the quick fluorescence recovery of FAM within 15 min for sensitive imaging of low-abundance target miRNA-21. Compared with the limited amount of track in the Au-based 3D DNA nanomachine, the core–brush 3D DNA nanomachine not only provided a specific walking range for the DA to avoid inactive and stochastic self-walking, but also greatly increased the loading capacity and local concentrations of DNA components to significantly enhance the executive efficiency of the core–brush 3D DNA nanomachine. Thus, this strategy gives impetus to exploit high-performance 3D DNA nanomachines for specific biological applications in complex cellular environments, such as biodiagnostics and bioanalysis.
3 were orderly assembled into the DNA track with a repetitive array to construct the core–brush 3D DNA nanomachine (PART A). According to PART B, once the target miRNA-21 was introduced into the 3D DNA nanomachine, the hybridization of miRNA-21 with a locking strand (L) via strand–displacement reaction could release the active DA from the locked DA (L-DA) to hybridize with the adjacent HS. Fueled by the DNAzyme-induced ribonucleotide hydrolysis, the HS was then cleaved by the active DA in the presence of cofactor Mn2+ to release the Ru-labelled segment (S). When S was captured by the DNA hairpin (H) onto a gold nanoparticle-assembled glassy carbon electrode (depAu/GCE) through the Au–S bond, a highly intense ECL signal was generated for ultrasensitive detection of miRNA-21 with a detection limit as low as 3.57 aM (PART C). Impressively, when the DA and HS-1 labelled with a fluorophore (FAM) and quencher (BHQ) were used to assemble our core–brush 3D DNA nanomachine (PART D), the intracellular miRNA-21 could activate autonomous motions of the DA to cleave the HS and release the FAM-labelled segment away from BHQ in the presence of the cofactor Mn2+, leading to the quick fluorescence recovery of FAM within 15 min for sensitive imaging of low-abundance target miRNA-21. Compared with the limited amount of track in the Au-based 3D DNA nanomachine, the core–brush 3D DNA nanomachine not only provided a specific walking range for the DA to avoid inactive and stochastic self-walking, but also greatly increased the loading capacity and local concentrations of DNA components to significantly enhance the executive efficiency of the core–brush 3D DNA nanomachine. Thus, this strategy gives impetus to exploit high-performance 3D DNA nanomachines for specific biological applications in complex cellular environments, such as biodiagnostics and bioanalysis.
Results and discussion
Characterization analysis of the core–brush 3D DNA nanomachine
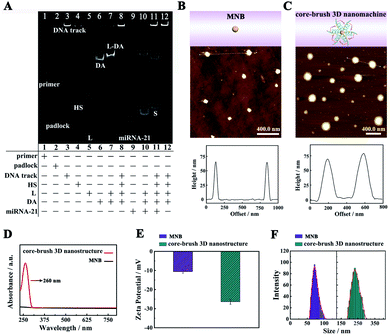
Polyacrylamide gel electrophoresis (PAGE) was employed to estimate the construction of the core–brush 3D DNA nanomachine. According to Fig. 1A, lane 1 and lane 2 displayed the primer and padlock. Then, a bright band with quite low mobility on the top of lane 3 suggested that a long DNA track was acquired successfully by a RCA reaction. Lane 4, lane 5, and lane 6 corresponded to the HS, L and DA, respectively. A bright single band of the L-DA was clearly observed in lane 7 with lower mobility, indicating that the DA could be effectively deactivated by L. A bright top band was observed in lane 8, which means that the L-DA and HS were successfully assembled onto the DNA track. The mixture of target miRNA-21 and L-DA represented two clear bands in lane 10. The lower band was the hybrid product of target miRNA-21 (lane 9) and L, implying that the hybridization of miRNA-21 with L could effectively release the DA from the L-DA via the strand–displacement reaction. Lane 11 and lane 12 illustrated the PAGE results for the proposed core–brush 3D DNA nanomachine with and without target miRNA-21. The bright band of abundant S was clearly observed at the bottom band of lane 11, but not in lane 12, which demonstrated that miRNA-21 could active the proposed 3D DNA nanomachine to generate numerous S.Then, we also employed atomic force microscopy (AFM), UV-vis spectroscopy, zeta potential analysis and dynamic light scattering (DLS) to verify the formation of the core–brush 3D DNA nanomachine. According to Fig. 1B and S1A,† the AFM characterization of the MNB core exhibited relatively smooth surfaces with a height of 66 nm approximately. After the accomplishment of the core–brush 3D DNA nanomachine, the apparent DNA brushes were observed on the surface of the core (Fig. 1C and S1B†) with an obvious increase in the height (70 nm). Likewise, the MNB core did not have any peak in the UV-vis absorption spectra (Fig. 1D, black line). Accompanied by the successful construction of the core–brush 3D DNA nanomachine, a very distinct characteristic deoxynucleotide absorption peak located at 260 nm was observed (Fig. 1D, red line). Moreover, the core–brush 3D DNA nanomachine possessed a decreased zeta potential of −26.41 mV compared with the MNB core of −10.57 mV owing to the negative charges of the DNA (Fig. 1E). As illustrated in Fig. 1F, the hydrodynamic diameter of the MNB core and core–brush 3D DNA nanomachine measured by DLS were around 68.5 nm and 233 nm, respectively. The hydrodynamic diameter of the core–brush 3D DNA nanomachine was bigger than the actual size owing to the formation of a hydrogen bond between the hydroxyl of H2O and DNA. The remarkable comparisons of the above results suggested successful formation of the proposed core–brush 3D DNA nanomachine.
Execution efficiency of the designed core–brush 3D DNA nanomachine
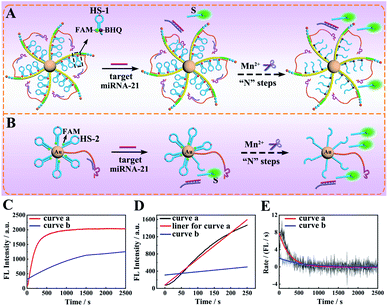
To study the execution efficiency of the designed core–brush 3D DNA nanomachine (Fig. 2A) in contrast with the conventional 3D DNA nanomachine based gold nanoparticles (AuNPs) (Fig. 2B), we used fluorophore (FAM) and quencher (BHQ)-labeled HS-1 or FAM-labeled HS-2 to construct the proposed 3D DNA nanomachine and Au-based DNA nanomachine, respectively. In the presence of the cofactor Mn2+, the target miRNA-21 could activate the DA to hybridize and cleave the HS for releasing the FAM-labelled segment (S) away from the quencher BHQ or AuNPs and obtaining the prominent fluorescence recovery of FAM. The real-time fluorescence of FAM for the proposed core–brush 3D DNA nanomachine showed a speedy fluorescence intensity growth and reached saturation about 900 s (Fig. 2C, curve a). In contrast, the typical Au-based 3D DNA nanomachine demonstrated a very slow fluorescence signal growth and the fluorescence saturation plateau did not appear within 2500 s (Fig. 2C, curve b). To calculate the initial rate of the DNA nanomachine, we verified the relationship between the fluorescence intensities and reaction time of the proposed 3D DNA nanomachine and the Au-based 3D DNA nanomachine. According to Fig. 3D, the fluorescence intensities shown the desirable linear relationships with the reaction time in the first 250 s. The regression equations of the proposed core–brush 3D DNA nanomachine (Fig. 2D, curve a and linear fit for curve a) and the Au-based 3D DNA nanomachine (Fig. 2D, curve b) were I = 6.064t + 77.98 and I = 0.7522t + 311.3, respectively. Based on the above results and related calculations, we found that the initial rate of our 3D DNA nanomachine (8.03 × 10⁻¹¹ M s−1) was more than 7-fold higher than that of the control Au-based 3D DNA nanomachine (1.11 × 10⁻¹¹ M s−1). Moreover, by first-order derivation of the real-time fluorescence increase curves of Fig. 2C, we could obtain the reaction rate curves of the DNA nanomachine as shown in Fig. 2E. The reaction rate of our designed 3D DNA nanomachine was extraordinarily high in the first 500 s and then became very low or even went to zero (Fig. 2E, curve a). In comparison, the reaction rate and the overall efficiency of the Au-based 3D DNA nanomachine were relatively low (Fig. 2E, curve b). Collectively, these results demonstrated that the core–brush 3D DNA nanomachine possessed obviously higher execution efficiency than the Au-based 3D DNA nanomachine on account of the high loading and integration of the DNA components in an orderly manner on the programmable DNA track.Feasibility investigation of the core–brush 3D DNA nanomachine
The core–brush 3D DNA nanomachine was composed of multiple components, and thus each component might have a potential impact on its overall executive efficiency. Firstly, we designed a control unassembled nanomachine that only contained a free DA and FAM and BHQ-labeled HS-1 at a ratio of 1![[thin space (1/6-em)]](https://www.rsc.org/images/entities/char_2009.gif) :
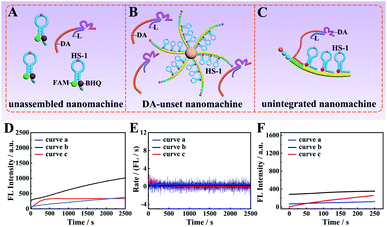
:![[thin space (1/6-em)]](https://www.rsc.org/images/entities/char_2009.gif) 3 to confirm that the DA tended to walk along the HS-1 immobilized on the DNA track rather than the scattered HS-1 in the solution (Fig. 3A). Then, to verify that the highly executive efficiency of the proposed 3D DNA nanomachine was due to the ordered array of the DA and HS-1 on the programmed DNA track, the second control by mixing scattered DA with HS-1@MNB was designed to construct the DA-unset nanomachine in Fig. 3B. In this manner, the specific walking range for each DA was uncertain. Moreover, to ensure that the intense growth of fluorescence intensity was due to the highly loaded and integrated mode of our designed 3D DNA nanomachine, a control unintegrated nanomachine that only included a single DNA track assembled with a DA and HS-1 at 1
3 to confirm that the DA tended to walk along the HS-1 immobilized on the DNA track rather than the scattered HS-1 in the solution (Fig. 3A). Then, to verify that the highly executive efficiency of the proposed 3D DNA nanomachine was due to the ordered array of the DA and HS-1 on the programmed DNA track, the second control by mixing scattered DA with HS-1@MNB was designed to construct the DA-unset nanomachine in Fig. 3B. In this manner, the specific walking range for each DA was uncertain. Moreover, to ensure that the intense growth of fluorescence intensity was due to the highly loaded and integrated mode of our designed 3D DNA nanomachine, a control unintegrated nanomachine that only included a single DNA track assembled with a DA and HS-1 at 1![[thin space (1/6-em)]](https://www.rsc.org/images/entities/char_2009.gif) :
:![[thin space (1/6-em)]](https://www.rsc.org/images/entities/char_2009.gif) 3 was further designed as shown in Fig. 3C. According to Fig. 3D, the fluorescence signal increase of the unassembled nanomachine (blue curve a) and the DA-unset nanomachine (black curve b) did not reach the saturation state in 2500 s. According to red curve c, although the unintegrated nanomachine reached reaction equilibrium quickly, its saturated fluorescence intensity was relatively weak. As depicted in Fig. 3E, the reaction rate of the unassembled nanomachine (curve a) and the DA-unset nanomachine (curve b) was extraordinarily low and even went to zero. Besides, the initial rate of the unintegrated nanomachine (8.60 × 10⁻¹¹ M s−1) was roughly close to that of our proposed 3D DNA nanomachine (Fig. 3F).
3 was further designed as shown in Fig. 3C. According to Fig. 3D, the fluorescence signal increase of the unassembled nanomachine (blue curve a) and the DA-unset nanomachine (black curve b) did not reach the saturation state in 2500 s. According to red curve c, although the unintegrated nanomachine reached reaction equilibrium quickly, its saturated fluorescence intensity was relatively weak. As depicted in Fig. 3E, the reaction rate of the unassembled nanomachine (curve a) and the DA-unset nanomachine (curve b) was extraordinarily low and even went to zero. Besides, the initial rate of the unintegrated nanomachine (8.60 × 10⁻¹¹ M s−1) was roughly close to that of our proposed 3D DNA nanomachine (Fig. 3F).
These results might be explained by effective collision theory that the reactants have to collide effectively with each other to make the reaction occur, and the concentrations of the reactants DA and HS-1 are proportional to the collision frequency. In the control unassembled nanomachine, the effective local concentrations of the DA and HS-1 were lower than that of being assembled together on the programmable DNA track, leading to low collision frequency and further decreasing the reaction efficiency. This result suggested that the programmable DNA track was a critical component to improve the effective local concentrations of reactants and further enhance the executive ability of the DNA walking nanomachine. Then, we thought that the chaotic reaction of scattered DA and HS-1 in the DA-unset nanomachine would reduce the utilization of DNA molecular components due to the uncertain walking range for each DA. In this manner, some DA-unset nanomachines might not hybridized with scattered DA, so these machines would not be in the operating state. Therefore, orderly assembling the DA and HS-1 into the programmable DNA track was the key to improving the utilization of DNA components. Furthermore, we also found that the saturated fluorescence intensity of the unintegrated nanomachine was weaker than that of our core–brush 3D DNA nanomachine. This result suggested that the highly integrated mode might greatly increase the effective local concentrations to further enhance the total fluorescence intensity. In principle, by comparing with the above control DNA nanomachines, our 3D DNA nanomachine possessed higher loading capacity and excellent executive efficiency, which gave impetus to ultrasensitive detection and rapid imaging of specific miRNA in cancer cells.
Application of the 3D DNA nanomachine for sensitive detection of miRNA-21
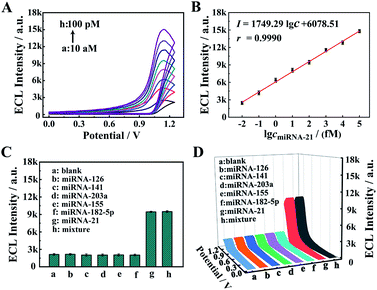
The proposed core–brush 3D DNA nanomachine was employed to construct an electrochemiluminescence (ECL) biosensing system for sensitive detection of miRNA-21. To verify the analytical performance of the sensing platform based on the proposed 3D DNA nanomachine, diverse concentrations of miRNA-21 were tested under the optimized experimental conditions (Fig. S2 and S3†). According to Fig. 4A, the ECL intensity gradually increased with incremental concentrations of miRNA-21 throughout the tested range (10 aM to 100 pM). As presented in Fig. 4B, the calibration plot demonstrated an excellent linear relationship between the ECL response and the logarithm of the miRNA-21 concentration. And its regression equation was I = 1749.29![[thin space (1/6-em)]](https://www.rsc.org/images/entities/char_2009.gif) lg
lg![[thin space (1/6-em)]](https://www.rsc.org/images/entities/char_2009.gif) cmiRNA-21 + 6078.51 with a correlation coefficient of 0.9990 and detection limit of 3.57 aM (S/N = 3). Moreover, compared with other methods for miRNA detection (Table S2†), the proposed strategy possessed a remarkably wider linear range and extremely lower detection limit, which manifested that the proposed core–brush 3D DNA nanomachine has potential applications in ultrasensitive biomarker detection and metrology.
cmiRNA-21 + 6078.51 with a correlation coefficient of 0.9990 and detection limit of 3.57 aM (S/N = 3). Moreover, compared with other methods for miRNA detection (Table S2†), the proposed strategy possessed a remarkably wider linear range and extremely lower detection limit, which manifested that the proposed core–brush 3D DNA nanomachine has potential applications in ultrasensitive biomarker detection and metrology.
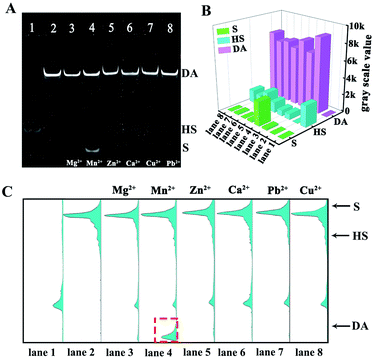
To validate the specificity of our proposed 3D DNA nanomachine for sensitive detection of miRNA-21, a series of interfering agents containing miRNA-126, miRNA-141, miRNA-203a, miRNA-155 and miRNA-182-5p were introduced as interference tests. According to Fig. 4C and D, the ECL intensity of interfering agents (10 pM) was almost negligible as the blank one. In contrast, the mixture containing target miRNA-21 was similar to that of miRNA-21 (100 fM), exhibiting an obvious ECL intensity. Meanwhile, the proposed biosensor also showed excellent selectivity for mismatched miRNA-21 (Fig. S7†). Next, the selectivity of our strategy based on Mn2+-dependent DNAzyme was also monitored by PAGE. As demonstrated in Fig. 5A, lane 1 represents the HS, lane 2 represents the DA, and lanes 3–8 represent the cleavage of the HS by the DA in the presence of Mg2+, Mn2+, Zn2+, Ca2+, Cu2+ and Pb2+ as alternative cofactors, respectively. As expected, the most obvious band of cleavage products (S) appeared in lane 4, indicating that Mn2+ was the best cofactor to truncate S from the DA. The above results clearly demonstrate the high selectivity of our proposed 3D DNA nanomachine. Meanwhile, the gray scale intensity of the PAGE bands was analyzed by Image J. The highest gray scale value of S and the most obvious band of S were observed in lane 4 of Fig. 5B and C with the cofactor Mn2+, which were consistent with the results of gel electrophoresis. Furthermore, the proposed biosensing platform also presented outstanding stability and repeatability selectivity (Fig. S8†).
Rapid and sensitive imaging of miRNA-21 in living cells
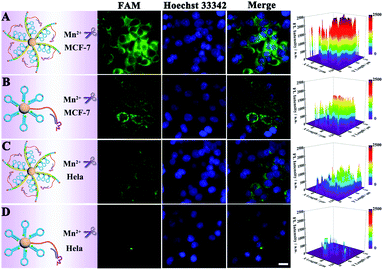
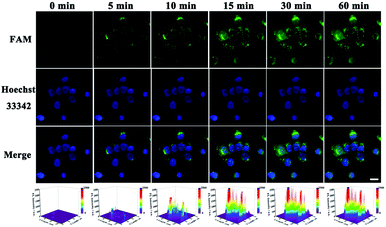
At first, endocytosis inhibition experiments and MTT assays were implemented to reveal the uptake mechanism of our nanomachine (Fig. S9†) and demonstrate the low cytotoxicity of our strategy (Fig. S10†), respectively. Then, MCF-7 cells and HeLa cells were used to evaluate the imaging ability of the developed core–brush 3D DNA nanomachine for intracellular miRNA-21. As presented in Fig. 6A, MCF-7 cells, with high miRNA-21 expression, showed remarkably strong fluorescence with the cultivation of the core–brush 3D DNA nanomachine. Meanwhile, fluorescence that was obviously distinguishable from the background could be observed inside HeLa cells with a low miRNA-21 expression level (Fig. 6C). By contrast, the intracellular fluorescence intensity of MCF-7 cells cultured with the conventional Au-based 3D DNA nanomachine was distinctly weaker than that of with the proposed 3D DNA nanomachine (Fig. 6B). Especially for HeLa cells, only a low intracellular fluorescence intensity was noticed with the cultivation of the traditional Au-based 3D DNA nanomachine (Fig. 6D). Thus, compared with the conventional Au-based 3D DNA nanomachine, the proposed core–brush 3D DNA nanomachine could not only make it possible to image low-expressed miRNA-21 with higher sensitivity, but also offer a general strategy for accurate imaging in living cells with higher specificity. Moreover, we also used the miRNA-21 mimic and inhibitor to further verify the specific discrimination of intracellular miRNA-21 by the core–brush 3D DNA nanomachine (Fig. S11†). We believe that the proposed core–brush 3D DNA nanomachine could provide an attractive way for sensitive imaging of intracellular specific miRNA in low abundance, which could contribute to study the biological processes and mechanisms within the cell system and its application in early diagnosis and treatment of diseases.Furthermore, real-time imaging of MCF-7 cells cultured with the proposed 3D DNA nanomachine at different incubation time points within 60 min is tracked in Fig. 7. Impressively, the brightest fluorescence was observed in about 15 min and no obvious fluorescence growth was noticed within 60 min, indicating that the visualization of intracellular miRNA-21 was achieved within 15 min with the proposed core–brush 3D DNA nanomachine, which was noticeably faster than those of previously reported nanomachines (Table 1). These results confirmed that the rapid imaging strategy based on the proposed 3D DNA nanomachine might offer great potential for rapid point-of-care medical devices and early detection of cancer in clinical practices.
| Method | Detection target | Saturation time | Ref. |
|---|---|---|---|
| Integrated smart nanodevice | miRNA-21 | 300 min | 29 |
| ATP-powered DNA nanomachine | miRNA-21 | 80 min | 30 |
| Au NR dimer-UCNP core–satellite nanostructures | miRNA-21 | 480 min | 31 |
| MicroRNA-initiated DNAzyme motor | miRNA-10b | 60 min | 22 |
| Entropy-driven DNA nanomachine | miRNA-21 | 300 min | 32 |
| Enzyme-free molecular catalytic device | miRNA-155 | 240 min | 33 |
| Core–brush 3D DNA nanomachine | miRNA-21 | 15 min | This work |
Conclusions
In summary, we presented a core–brush 3D DNA nanomachine by innovatively assembling DNA components (DA and HS) into a repetitive array on a programmable DNA track. Compared with traditional Au-based 3D DNA nanomachines, our strategy had the following combined advantages. First, the DNA track generated by a RCA reaction was well-designed to homogeneously arrange DNA components, which not only ensured a specific walking range for the DA to prevent stochastic and invalid movement, but also avoided the discorded nano-bio interface of Au/DNA in the Au-based 3D DNA nanomachine. Second, the highly integrated 3D DNA nanomachine possessed an enhanced loading capacity and movement efficiency due to the organized and high local concentration of DNA components. Third, as practical applications, the proposed 3D DNA nanomachine was successfully applied for rapid and sensitive detection and imaging of intracellular specific miRNA, which could help us explore its biological functions in tumor differentiation and proliferation as well as potential drug screening in early disease diagnosis.Data availability
The data that support the findings of this study are available in the ESI.†Author contributions
L. K. and R. Y. developed the concept and design of the project. L. K. performed experiments. All authors contributed to the analysis and the interpretation of the results. The manuscript was written by L. K. and revised by Y. C. and R. Y. All authors have given approval for the final version of the manuscript.Conflicts of interest
There are no conflicts to declare.Acknowledgements
This work was financially supported by the NNSF of China (21974108, 21775124 and 21675129) and the Fundamental Research Funds for the Central Universities (XDJK2019B022), China.References
- A. G. Tsai, D. R. Glass, M. Juntilla, F. J. Hartmann, J. S. Oak, S. Fernandez-Pol, R. S. Ohgami and S. C. Bendall, Nat. Med., 2020, 26, 408–417 CrossRef CAS PubMed.
- A. J. Thubagere, W. Li, R. F. Johnson, Z. Chen, S. Doroudi, Y. L. Lee, G. Izatt, S. Wittman, N. Srinivas, D. Woods, E. Winfree and L. Qian, Science, 2017, 357, eaan6558 CrossRef PubMed.
- C. Jung, P. B. Allen and A. D. Ellington, Nat. Nanotechnol., 2016, 11, 157–163 CrossRef CAS PubMed.
- E. Kopperger, J. List, S. Madhira, F. Rothfischer, D. C. Lamb and F. C. Simmel, Science, 2018, 359, 296 CrossRef CAS PubMed.
- Q. Li, L. Liu, D. Mao, Y. Yu, W. Li, X. Zhao and C. Mao, J. Am. Chem. Soc., 2020, 142, 665–668 CrossRef CAS PubMed.
- J. Valero, N. Pal, S. Dhakal, N. G. Walter and M. Famulok, Nat. Nanotechnol., 2018, 13, 496–503 CrossRef CAS PubMed.
- J. Chao, J. Wang, F. X. Ouyang, E. Kopperger, H. Liu, Q. Li, J. Shi, L. Wang and J. Hu, Nat. Mater., 2019, 18, 273–279 CrossRef CAS PubMed.
- C. Ouyang, S. Zhang, C. Xue, X. Yu, H. Xu, Z. Wang, Y. Lu and Z. S. Wu, J. Am. Chem. Soc., 2020, 142, 1265–1277 CrossRef CAS PubMed.
- Y. Zhang, X. B. Zhang, Y. Y. Li, Y. L. He, Y. Liu and H. X. Ju, Chem. Sci., 2020, 11, 6289–6296 RSC.
- C. Xue, S. X. Zhang, C. H. Ouyang, D. Chang, B. J. Salena, Y. F. Li and Z. S. Wu, Angew. Chem., Int. Ed., 2018, 57, 9739–9743 CrossRef CAS PubMed.
- J. Jiang, P. Zhang, Y. M. Nie, K. F. Peng, Y. Zhuo, Y. Q. Chai and R. Yuan, Chem. Sci., 2020, 11, 2193–2199 RSC.
- S. Zhang, C. Chen, C. Xue, D. Chang, H. Xu, B. J. Salena, Y. Li and Z. S. Wu, Angew. Chem., Int. Ed., 2020, 59, 14584–14592 CrossRef CAS PubMed.
- J. Zhang, M. He, C. Nie, M. He, Q. Pan, C. Liu, Y. Hu, T. Chen and X. Chu, Chem. Sci., 2020, 11, 7092–7101 RSC.
- M. Raveendran, A. J. Lee, R. Sharma, C. Wälti and P. Actis, Nat. Commun., 2020, 11, 4384 CrossRef CAS PubMed.
- S. Yue, X. Song, W. Song and S. Bi, Chem. Sci., 2019, 10, 1651–1658 RSC.
- J. Zhao, H. Chu, Y. Zhao, Y. Lu and L. Li, J. Am. Chem. Soc., 2019, 141, 7056–7706 CrossRef CAS PubMed.
- H. Zhang, X. Xu and W. Jiang, Chem. Sci., 2020, 11, 7415–7423 RSC.
- Z. Zhou, J. D. Brennan and Y. Li, Angew. Chem., Int. Ed., 2020, 59, 10401–10405 CrossRef CAS PubMed.
- P. Zhang, J. Jiang, R. Yuan, Y. Zhuo and Y. Q. Chai, J. Am. Chem. Soc., 2018, 140, 9361–9364 CrossRef CAS PubMed.
- M. S. Xiao, K. Zou, L. Li, L. H. Wang, Y. Tian, C. H. Fan and H. Pei, Angew. Chem., Int. Ed., 2019, 58, 15448–15454 CrossRef CAS PubMed.
- M. M. Lv, J. W. Liu, R. Yu and J. H. Jiang, Chem. Sci., 2020, 11, 10361–10366 RSC.
- H. Peng, X. F. Li, H. Zhang and X. C. Le, Nat. Commun., 2017, 8, 14378 CrossRef PubMed.
- P. Q. Ma, Q. Huang, H. D. Li, B. C. Yin and B. C. Ye, J. Am. Chem. Soc., 2020, 142, 3851–3861 CrossRef CAS PubMed.
- Y. Li, G. A. Wang, S. D. Mason, X. Yang, Z. Yu, Y. Tang and F. Li, Chem. Sci., 2018, 9, 6434–6439 RSC.
- P. K. Lat, C. W. Schultz, H. Z. Yu and D. Sen, Angew. Chem., Int. Ed., 2021, 60, 8722–8727 CrossRef CAS PubMed.
- Q. Wei, J. Huang, J. Li, J. Wang, X. Yang, J. Liu and K. Wang, Chem. Sci., 2018, 9, 7802–7808 RSC.
- T. E. Tomov, R. Tsukanov, Y. Glick, Y. Berger, M. Liber, D. Avrahami, D. Gerber and E. Nir, ACS Nano, 2017, 11, 400 CrossRef PubMed.
- J. Valero and M. Famulok, Angew. Chem., Int. Ed., 2020, 59, 16366–16370 CrossRef CAS PubMed.
- P. He, W. Han, C. Bi, W. Song, S. Niu, H. Zhou and X. Zhang, ACS Nano, 2021, 15, 6961–6976 CrossRef CAS PubMed.
- P. Q. Ma, C. P. Liang, H. H. Zhang, B. C. Yin and B. C. Ye, Chem. Sci., 2018, 9, 3299–3304 RSC.
- W. Ma, P. Fu, M. Sun, L. Xu, H. Kuang and C. Xu, J. Am. Chem. Soc., 2017, 139, 11752–11759 CrossRef CAS PubMed.
- C. P. Liang, P. Q. Ma, H. Liu, X. G. Guo, B. Yin and B. C. Ye, Angew. Chem., Int. Ed., 2017, 56, 9077 CrossRef CAS PubMed.
- S. Yue, X. Song, W. Song and S. Bi, Chem. Sci., 2019, 10, 1651–1658 RSC.
Footnote |
| † Electronic supplementary information (ESI) available: Experimental section and related experimental data. See DOI: 10.1039/d1sc04571g |
| This journal is © The Royal Society of Chemistry 2021 |

