 Open Access Article
N–H⋯X interactions stabilize intra-residue C5 hydrogen bonded conformations in heterocyclic α-amino acid derivatives†
Venkateswara Rao
Mundlapati‡§
 a,
Zeynab
Imani‡
 b,
Viola C.
D'mello¶
a,
Valérie
Brenner
 a,
Eric
Gloaguen
 a,
Jean-Pierre
Baltaze
 b,
Sylvie
Robin
 bc,
Michel
Mons
 *a and
David J.
Aitken
 *b
*b
aUniversité Paris-Saclay, CEA, CNRS, LIDYL, 91191 Gif-sur-Yvette, France. E-mail: michel.mons@cea.fr
bUniversité Paris-Saclay, CNRS, ICMMO, 91405 Orsay, France. E-mail: david.aitken@universite-paris-saclay.fr
cUniversité de Paris, Faculté de Pharmacie, 75006 Paris, France
First published on 22nd October 2021
Abstract
Nature makes extensive and elaborate use of hydrogen bonding to assemble and stabilize biomolecular structures. The shapes of peptides and proteins rely significantly on N–H⋯O![[double bond, length as m-dash]](https://www.rsc.org/images/entities/char_e001.gif) C interactions, which are the linchpins of turns, sheets and helices. The C5 H-bond, in which a single residue provides both donor and acceptor, is generally considered too weak to force the backbone to adopt extended structures. Exploiting the synergy between gas phase (experimental and quantum chemistry) and solution spectroscopies to decipher IR spectroscopic data, this work demonstrates that the extended C5-based conformation in 4-membered ring heterocyclic α-amino acid derivatives is significantly stabilized by the formation of an N–H⋯X H-bond. In this synergic system the strength of the C5 interaction remains constant while the N–H⋯X H-bond strength, and thereby the support provided by it, varies with the heteroatom.
C interactions, which are the linchpins of turns, sheets and helices. The C5 H-bond, in which a single residue provides both donor and acceptor, is generally considered too weak to force the backbone to adopt extended structures. Exploiting the synergy between gas phase (experimental and quantum chemistry) and solution spectroscopies to decipher IR spectroscopic data, this work demonstrates that the extended C5-based conformation in 4-membered ring heterocyclic α-amino acid derivatives is significantly stabilized by the formation of an N–H⋯X H-bond. In this synergic system the strength of the C5 interaction remains constant while the N–H⋯X H-bond strength, and thereby the support provided by it, varies with the heteroatom.
Introduction
The concept of the hydrogen bond (H-bond) and its role in governing the behaviour of matter have fascinated scientists for over a hundred years.1–3 Nature uses H-bonds exquisitely to organize and modulate intermolecular interactions and to assemble biomolecular architectures, empowering them with precise functions.4,5 In peptides and proteins, ubiquitous backbone N–H⋯O![[double bond, length as m-dash]](https://www.rsc.org/images/entities/char_e001.gif) C H-bond interactions play a key role in stabilizing secondary structures such as helices, sheets and turns;6,7 accompanied by other types of non-covalent interactions,8–13 they contribute to an elaborate interplay of the forces that stabilize peptide and protein structure.
C H-bond interactions play a key role in stabilizing secondary structures such as helices, sheets and turns;6,7 accompanied by other types of non-covalent interactions,8–13 they contribute to an elaborate interplay of the forces that stabilize peptide and protein structure.
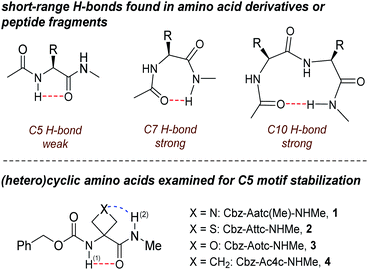
In this area, one of the most enigmatic phenomena is the intra-residue interaction between the N–H and C![[double bond, length as m-dash]](https://www.rsc.org/images/entities/char_e001.gif) O dipoles known as the C5 H-bond.14 Pioneering studies15–21 and salutary subsequent work22–24 on model compounds suggested that this weak interaction succumbs easily to C7 or C10 H-bonds which stabilize folded structures in solution (Fig. 1). The directionality of the C5 H-bond along the backbone is opposite to that of C7 and C10 H-bonds and also to that of the classical α-helix. Successive C5 interactions form the basis of the so-called 2.05-helix,25 which is adopted by very few synthetic peptides that rely essentially on steric constraints to do so.26 While long overlooked as a significant structural feature in proteins, C5 interactions were recently shown to be quite widespread in proteins, implicating ∼5% of all residues and contributing to conformational stability, notably in the case of amyloid β-sheets.27 Further insight into the nature of the C5 H-bond and the factors which stabilize it is clearly desirable.
O dipoles known as the C5 H-bond.14 Pioneering studies15–21 and salutary subsequent work22–24 on model compounds suggested that this weak interaction succumbs easily to C7 or C10 H-bonds which stabilize folded structures in solution (Fig. 1). The directionality of the C5 H-bond along the backbone is opposite to that of C7 and C10 H-bonds and also to that of the classical α-helix. Successive C5 interactions form the basis of the so-called 2.05-helix,25 which is adopted by very few synthetic peptides that rely essentially on steric constraints to do so.26 While long overlooked as a significant structural feature in proteins, C5 interactions were recently shown to be quite widespread in proteins, implicating ∼5% of all residues and contributing to conformational stability, notably in the case of amyloid β-sheets.27 Further insight into the nature of the C5 H-bond and the factors which stabilize it is clearly desirable.
Gas phase spectroscopic studies of a few amino acid derivatives have provided structural information on the C5 interaction28–32 but correlation with solution phase behaviour remains an experimental caveat. We recently combined theoretical calculations with gas and solution phase experiments to provide evidence that derivatives of 3-aminothietane-3-carboxylic acid can adopt a C5 H-bonded conformation stabilized by an N–H⋯S interaction.33 We now demonstrate the extent to which factors other than steric hindrance—specifically, the short-range N–H⋯X interactions in the heterocyclic α-amino acid derivatives 1–4 (Fig. 1)—may be influential in stabilizing C5 motifs, allowing them to be propitiously characterized in both gas phase and weakly polar solution, principally by IR spectroscopy.
Methodologies
Compounds 1–4 were prepared using standard synthetic methods (see ESI Section 1†). Solid samples were vaporized using laser-desorption to provide isolated molecules at a high temperature which were cooled down rapidly by adiabatic expansion, with two consequences.34,35 Firstly, interconversion between backbone families (which involves high energy barriers) no longer occurred, leaving a conformational distribution which was representative of the compound at an intermediate temperature (typically room temperature). Secondly, rotational and vibrational cooling within each backbone family funnelled the population to the most stable conformers.The conformers obtained in this way were characterized fastidiously using an arsenal of sophisticated laser methods,34,35 as follows. The sensitivity of the UV spectrum of the Cbz-cap to the molecular conformation allowed us to observe narrow UV spectral signatures in the origin region of the first ππ* transition of the phenyl group, providing a panorama of the conformational diversity. Taking advantage of this conformational selectivity, conformer-selective IR spectra in the NH stretch region were recorded by combining IR and UV absorptions in the same experiment (IR/UV double resonance spectroscopy). Comparison of these vibrationally resolved spectra with the theoretical IR spectra of low energy conformations allowed assignment of the observed conformers to specific conformations together with a precise description of their intramolecular H-bond interactions. (The theoretical strategy and procedures are described in detail in ESI Section 2.†) In this way, conformer-specific IR spectra of each compound 1–4 were obtained together with an estimate of their conformational population.
Results and discussion
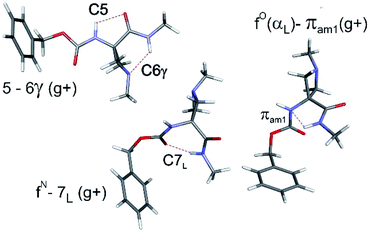
The conformational landscapes of the four compounds were first investigated theoretically (see details in ESI Section 2.3†). For each molecule, three backbone families (Fig. 2) were observed (see ESI Section 2.2†): (i) extended forms characterized by a C5–C6γ motif, similar to that observed previously for 2;33 (ii) folded forms stabilized by a C7 H-bond linking the two ends of the molecule and (iii) half-folded forms in which the amide NH is close to the carbamate NH—thus making a πamide interaction—with a perpendicular relative disposition of the two backbone CONH segments, thereby adopting an αL or αD configuration.The conformational landscape was enriched by three possible orientations of the Cbz cap (g+, g− and t) and two possible geometries of the carbamate group (cis and trans). The striking observation along the compound series was the large variation of the relative conformer stabilities with the variation of a single atom (Fig. 3). The extended forms appeared as the predominant conformations for 1 and 2, whereas the situation was less clear-cut for 3 and even more complex for 4, as extended forms were increasingly challenged by the C7 and α-families.
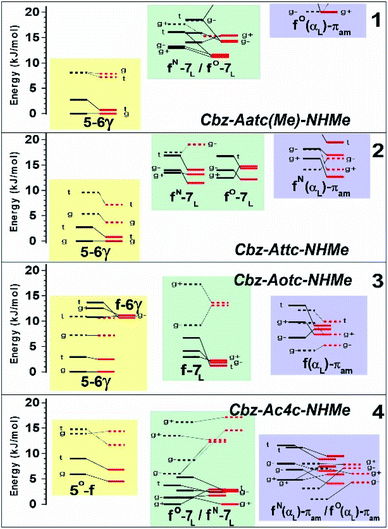 | ||
| Fig. 3 Gas phase energetic landscape of compounds 1–4, showing the relative stabilities of the three backbone families presented in Fig. 2: ΔH at 0 K (black lines) and ΔG at 300 K (red lines). Full (resp. dotted) lines indicate trans (resp. cis) conformation of the carbamate N-terminal cap. An extended version of the figure together with terminology details is provided in the ESI.† | ||
The near UV spectra recorded in the origin region of the first ππ* transition of compounds 1–3 (Fig. 4, left) were essentially composed of narrow lines: one intense band labelled A (yellow shade) and a weaker one, 15–18 cm−1 to the blue, labelled A1. In contrast, the spectrum of 4 exhibited numerous spectroscopic features, labelled A–D, most of them red-shifted relative to A bands of 1–3.
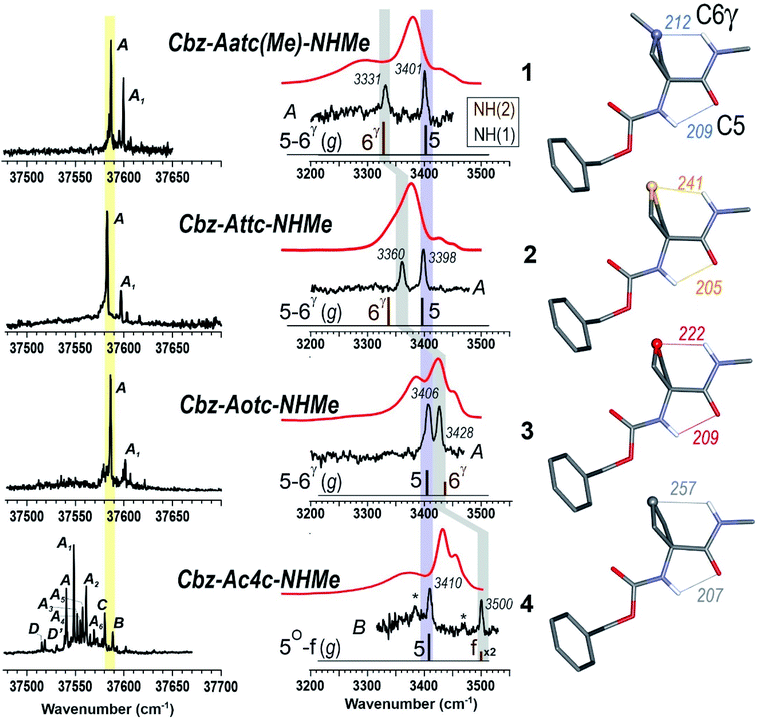 | ||
| Fig. 4 (left panel) Gas phase UV spectra of compounds 1–4, at the origin of the first ππ* transition of the phenyl ring. (centre panel) IR spectra (black), obtained on UV bands A (1–3) or B (4), and solution phase spectra (red) of compounds 1–4, compared to the theoretical IR spectrum (stick) obtained at the RI-B97 - D3(BJ-abc)/def2-TZVPPD level of theory. Asterisks in the IR spectrum of 4 indicate contributions of another conformer (see text and ESI Section S4.2†). The coloured bands indicate the spectral evolution of the C5 (in violet) and C6γ (in grey) H-bonds along the gas phase series. (right panel) Calculated lowest energy conformations of the extended form of the 1–4 compounds, obtained at the same level of theory. H-bonding distances are given in pm. | ||
The IR spectra recorded from the UV bands using the IR/UV double resonance procedure (Fig. 4, centre) enabled us to characterize the structures possessing these UV features. The IR spectra recorded for the conformational population of the UV A bands of 1–3 each showed two narrow IR NH stretch features: one, highlighted in violet, was found in the 3400 cm−1 range for all the compounds, while the other, highlighted in grey, was found at a frequency that varied significantly within the series. The same IR spectra were observed for the A1 bands of 1–3 (for details see ESI Section S4.1†), confirming their assignment to a vibronic band of the same conformer. In the case of 4, one weak UV band, labelled B, was located in the same spectral region as the A bands of 1–3 (Fig. 3, yellow shade on the UV spectrum) and gave rise to a related pattern with one intense band at 3410 cm−1 and a second band, weaker and strongly blue shifted, at 3500 cm−1. These observations suggested the presence of a common backbone structure within the series, albeit as only a minor conformation in 4.
Simulated IR spectra obtained for the most stable form of the C5–C6γ family along the compound series provided good agreement36 with the experimental spectra (Fig. 4, centre), allowing confident assignment to a C5–C6γ motif with a planar peptide backbone structure. The C5–C6γ motif is composed of (i) a C5 H-bond, whose NH stretch signature is barely dependent on the X atom acceptor (violet highlight in Fig. 4) and (ii) a C6γ bond (grey highlight) whose strength, in contrast, is strongly influenced by the nature of the X atom acceptor, with a red shift ranging from ∼170 cm−1 with X = N (1), weakening to ∼140 cm−1 with X = S (2), weakening further to ∼70 cm−1 with X = O (3), then vanishing in the absence of an acceptor (4). The variations of the strength of the NH⋯X interaction are more difficult to rationalize because of their multifactorial dependence, namely the four-membered ring size and shape (which depend upon the covalent radius of X), the ring flexibility, and the proton affinity of the X acceptor. In this context, it was not obvious that the best acceptor (an amine) would provide the strongest H-bond; in the event, the largest red shift observed in the series revealed this to be the case and the planar C5–C6γ motif was more stabilized in 1 than in the other compounds. It is intriguing to notice that the NH⋯X interactions present in these conformations are not optimal. The interaction distances (ESI Section 2.2†) found in 1 and 3, which are significantly larger than in other intra-peptide H-bonds or in non-covalently bound complexes,37 support the postulate that the limited flexibility of the four-membered ring hampers the formation of an optimal H-bond. In contrast, the NH⋯S distance in 2 is found to be shorter than in an intermolecular complex with optimum donor–acceptor approach geometry,33 again suggesting a strongly constrained H-bond, but in this case with compressed distance.
The conformations responsible for the UV spectroscopic features of compound 4 were determined from their IR/UV spectra (ESI Section 4.2†). Comparison of the experimental data with the most stable forms of each backbone family suggested the assignment of the A and C bands to a C7 folded backbone, and the D band to an α backbone configuration. Previously, quantum mechanical calculations had suggested that only the C7 conformation was accessible for a related derivative, Ac-Ac4c-NHMe.38
With the structural assignments in hand, information on gas-phase populations was forthcoming: the extended C5–C6γ form is the main conformer in 1–3, whereas the folded C7 form is predominant for 4 in the absence of an acceptor. This qualitatively confirms the theoretical energetic trends (Fig. 3) and it is compelling to explain the phenomenon as a direct result of the compatibility of the C5 interaction and C6γ H-bond, facilitated by the symmetrically disposed heteroatom in the γ-position of the side chain. The C6γ interaction specifically stabilizes the extended form over the C7 and α-folded structures, where no such supporting H-bonds can be formed.
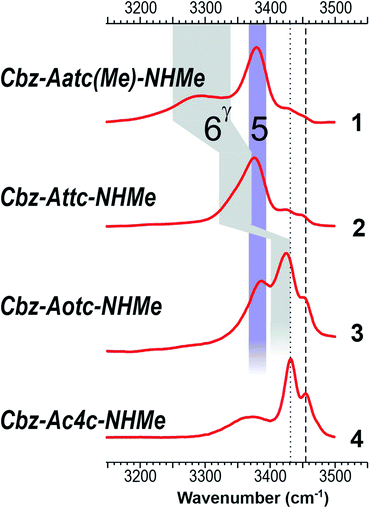
The low-polarity solution state IR absorption spectra of compounds 1–4 (10 mM chloroform solution) are shown in Fig. 5 (see also ESI Section S5.1†). Notwithstanding the lower spectral resolution, good overall correlation was observed with gas phase experimental and theoretical spectra of the lowest-energy conformations of 1–3 (Fig. 4), taking into account a slight (∼30 cm−1) red shift attributable to solvation. The IR spectrum of each compound 1–3 showed one broad band centred at around 3380 cm−1 which was assigned to NH(1) in a medium strength C5 interaction (violet band in Fig. 5). A similar NH frequency value was previously indicated for a C5 conformer in derivatives of 2-aminoisobutyric acid19–21 and diethylglycine.27 The present observations for 1–3, aided by further insights from theoretical gas phase studies (ESI Section S2.5†), suggest that this is the characteristic signature of a C5 interaction in α,α-disubstituted amino acid derivatives in solution. In agreement with the gas phase observations, the NH(2), implicated in a C6γ interaction of variable strength, gave rise to an absorption band of varying frequency (grey area in Fig. 5) ranging from 3290 cm−1 for 1, through 3350 cm−1 for 2, to 3425 cm−1 in 3.
For compound 3, the presence of an additional blue band appearing as a shoulder at around 3450 cm−1 indicated the presence of a second conformer with a free NH(2). The NH(1) vibration of this conformer was assumed to contribute to the larger band centred at 3425 cm−1 suggesting that it, likewise, was not involved in H-bonding.39 The lowest frequency band of 3 was slightly widened at around 3370 cm−1, hinting that a C7 H-bond implicating NH(2) might also be present, in which case the free NH(1) would contribute to the band at 3425 cm−1.
In contrast with the other three compounds, the IR spectrum of 4 was devoid of the 3380 cm−1 C5 band (Fig. 5). It comprised instead of a narrow band at 3430 cm−1 and a blue band at 3455 cm−1, assigned to free NH(1) and free NH(2) respectively. These are analogous to the minor bands observed for 3, but the non-H-bonded conformer is now more in evidence. A broad red band (3370 cm−1) was assigned to the NH(2) of a second conformer featuring a C7 H-bond, whose NH(1) would contribute to the 3430 cm−1 band. These data pointed to the presence of two conformers of 4, a C7 and a free (non-H-bonded) structure, and excluded the extended C5–C6γ family.
Collectively, these data show good agreement between the solution state behaviour and the population expectations derived from theoretical considerations (Fig. 3 and ESI Section 2.3†), whereby the extended C5–C6γ forms which dominate in 1 and 2 are challenged in 3 and supplanted in 4 by C7 and non-H-bonded conformations. The relative population depletion of the extended form of 3 in solution (compared to the gas phase) suggests better stabilization due to solvation of C7 and non-H-bonded forms. In this respect it was noteworthy that the calculated dipole moments of many of the gas phase C7 and α-type conformers were larger than those of the extended forms (ESI Section S2.6†). Finally, closer inspection of the IR spectra of 1 and 2 revealed that the high frequency spectral signatures of C7 and free forms (at 3430 and 3450 cm−1) were present, albeit with considerably lower intensity, testifying to a detectable population of these conformations.
1H NMR spectroscopy, which provides data that are an average of contributions from rapidly interconverting conformers, was used to corroborate the solution state behaviour (Fig. 6). In the spectra of compounds 1 and 2 (5 mM solutions in CDCl3) both the carbamate NH(1) signals (δ = 6.39 and 6.46 ppm resp.) and the amide NH(2) signals (δ = 8.16 and 7.98 ppm resp.) were deshielded, suggesting their implication in H-bonds. The deshielding is fully compatible with C5 H-bonding for the former and intramolecular N–H⋯X H-bonding for the latter. The spectrum of compound 3 showed more shielded NH(1) and NH(2) signals (δ = 5.92 and 6.85 ppm, resp.), consistent with the presence principally of a C5–C6γ conformer having a weaker C6γ interaction, accompanied by C7 and non-H-bonded conformers. The spectrum of compound 4 showed a well-shielded NH(1) signal and a partly-shielded NH(2) signal (δ = 5.29 and 6.60 ppm, resp.), compatible with the co-existence of C7 and non-H-bonded conformers.
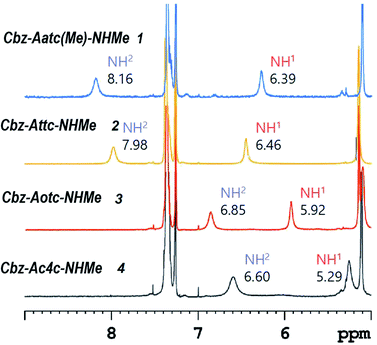 | ||
| Fig. 6 1H NMR spectra (in CDCl3) of compounds 1–4 showing resonances in the spectral window where the NH proton signals are located. | ||
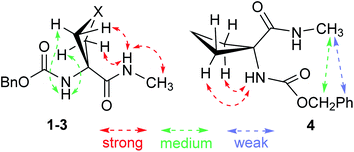
NOESY experiments (ESI Section S5.3†) conducted on both compounds 1 and 2 revealed correlations between each NH and each mutually proximal β-position proton pair (Fig. 7), in complete agreement with the predominance of extended C5–C6γ conformers for 1 and 2 in solution. NOESY correlation data obtained for 3 were analogous to those for 1 and 2, confirming a significant contribution from the C5–C6γ conformer (Fig. 7). NOESY correlations observed for compound 4 were quite different from those of 1–3 and were incompatible with a C5 interaction. While NH(1) correlated with the proximal β-position proton pair, this was no longer the case for NH(2). Unsurprisingly, the data were not compatible with the presence of a single conformer; this notwithstanding, modest correlations between the benzyl moiety and the methyl amide (Fig. 7) can be explained in terms of a contribution from a folded structure, such as a C7 conformer and/or an α-folded form.
Conclusions
In summary, this work demonstrates that the formation of a C6γ N–H⋯X H-bond provides a significant stabilizing effect on the extended forms based on an intra-residue C5 interaction in 4-membered heterocyclic amino acid derivatives, leading to prevalence of planar C5–C6γ conformers in both gas phase and low-polarity solution. The extent to which the C5 motif is stabilized varies commensurately with the strength of the C6γ interaction, providing a new paradigm for developing molecular tools and for supporting local structural features in peptides or peptidomimetics, with a modular strength that depends on the selected heteroatom.Data availability
The experimental datasets supporting this article have been uploaded as part of the ESI material.†Author contributions
VRM and ZI contributed equally. All authors have given approval to the final version of the manuscript. Conceptualization, funding acquisition: MM, DJA. Organic chemistry: synthesis ZI; characterization ZI, JPB; supervision SR, DJA. Gas phase: data acquisition: VRM, VD; modelling: VRM, VD, VB; analysis: VMR, VB, EG, MM; supervision: VB, EG, MM. Writing: original draft MM, DJA; review & editing: ZI, VRM, EG, VB, SR, MM, DJA.Conflicts of interest
There are no conflicts to declare.Acknowledgements
Support from the French National Research Agency (ANR; Grant ANR-17-CE29-0008 “TUNIFOLD-S”) and from the “Investissements d’Avenir” funding programmes (LabEx PALM; grant ANR-10-LABX-0039-PALM; DIRCOS) are acknowledged. This work was granted access to the HPC facility of [TGCC/CINES/IDRIS] under the Grant 2020-A0070807540 awarded by GENCI (Grand Equipement National de Calcul Intensif) and to the CCRT High Performance Computing (HPC) facility at CEA under the Grant CCRT2020-p606bren.Notes and references
- B. Gibb, Nat. Chem., 2020, 12, 665–667 CrossRef CAS PubMed.
- P. Goymer, Nat. Chem., 2012, 4, 863–864 CrossRef CAS PubMed.
- G. Gilli and P. Gilli, The Nature of the Hydrogen Bond. Outline of a Comprehensive Hydrogen Bond Theory, Oxford University Press, New-York, USA, 2009 Search PubMed.
- G. A. Jeffrey and W. Sänger, Hydrogen Bonding in Biological Structures, Springer-Verlag, Berlin, Germany, 1991 Search PubMed.
- C. L. Perrin and J. B. Nielson, Annu. Rev. Phys. Chem., 1997, 48, 511–544 CrossRef CAS PubMed.
- G. D. Rose, L. M. Gierasch and J. A. Smith, Adv. Protein Chem., 1985, 37, 1–109 CrossRef CAS PubMed.
- A. Karshikoff, Non-covalent Interactions in Proteins, Imperial College Press, London, UK, 2006 Search PubMed.
- R. W. Newberry and R. T. Raines, ACS Chem. Biol., 2019, 14, 1677–1686 CrossRef CAS PubMed.
- V. R. Mundlapati, D. K. Sahoo, S. Bhaumik, S. Jena, A. Chandrakar and H. S. Biswal, Angew. Chem., Int. Ed., 2018, 57, 16496–16500 CrossRef CAS PubMed.
- S. Horowitz and R. C. Trievel, J. Biol. Chem., 2012, 287, 41576–41582 CrossRef CAS PubMed.
- G. J. Bartlett, A. Choudhary, R. T. Raines and D. N. Woolfson, Nat. Chem. Biol., 2010, 6, 615–620 CrossRef CAS PubMed.
- E. A. Meyer, R. K. Castellano and F. Diederich, Angew. Chem., Int. Ed., 2003, 42, 1210–1250 CrossRef CAS PubMed.
- J. P. Gallivan and D. A. Dougherty, Proc. Natl. Acad. Sci. U. S. A., 1999, 96, 9459–9464 CrossRef CAS PubMed.
- C. Toniolo, Crit. Rev. Biochem., 1980, 9, 1–44 CrossRef CAS PubMed.
- M. Avignon, P. V. Huong, J. Lascombe, M. Marraud and J. Néel, Biopolymers, 1969, 8, 69–89 CrossRef CAS.
- M. T. Cung, M. Marraud and J. Néel, Anal. Chim., 1972, 7, 183–209 CAS.
- A. W. Burgess and H. A. Scheraga, Biopolymers, 1973, 12, 2177–2183 CrossRef CAS PubMed.
- G. Boussard, M. Marraud and J. Néel, J. Chim. Phys. Phys.-Chim. Biol., 1974, 71, 1081–1091 CrossRef CAS.
- A. Aubry, J. Protas, G. Boussard, M. Marraud and J. Néel, Biopolymers, 1978, 17, 1693–1711 CrossRef CAS.
- C. P. Rao, R. Nagaraj, C. N. R. Rao and P. Balaram, Biochemistry, 1980, 19, 425–431 CrossRef CAS PubMed.
- Y. Paterson, E. R. Stimson, D. J. Evans, S. J. Leach and H. A. Scheraga, Int. J. Pept. Protein Res., 1982, 20, 468–480 CrossRef CAS PubMed.
- R. R. Gardner and S. H. Gellman, J. Am. Chem. Soc., 1995, 117, 10411–10412 CrossRef CAS.
- M. A. Broda, B. Rzeszotarska, L. Smelka and M. Rospenk, J. Pept. Res., 1997, 50, 342–351 CrossRef CAS PubMed.
- J. H. Yang and S. H. Gellman, J. Am. Chem. Soc., 1998, 120, 9090–9091 CrossRef CAS.
- C. Peggion, A. Moretto, F. Formaggio, M. Crisma and C. Toniolo, Biopolymers, 2013, 100, 621–636 CrossRef CAS PubMed.
- M. Crisma, F. Formaggio, C. Alemán, J. Torras, C. Ramakrishnan, N. Kalmankar, P. Balaram and C. Toniolo, Pept. Sci., 2018, 110, e23100 CrossRef.
- R. W. Newberry and R. T. Raines, Nat. Chem. Biol., 2016, 12, 1084–1089 CrossRef CAS PubMed.
- B. C. Dian, A. Longarte, S. Mercier, D. A. Evans, D. J. Wales and T. S. Zwier, J. Chem. Phys., 2002, 117, 10688–10702 CrossRef CAS.
- Y. Loquais, E. Gloaguen, S. Habka, V. Vaquero-Vara, V. Brenner, B. Tardivel and M. Mons, J. Phys. Chem. A, 2015, 119, 5932–5941 CrossRef CAS PubMed.
- J. R. Gord, D. M. Hewett, A. O. Hernandez-Castillo, K. N. Blodgett, M. C. Rotondaro, A. Varuolo, M. A. Kubasik and T. S. Zwier, Phys. Chem. Chem. Phys., 2016, 18, 25512–25527 RSC.
- P. S. Walsh, J. C. Dean, C. McBurney, H. Kang, S. H. Gellman and T. S. Zwier, Phys. Chem. Chem. Phys., 2016, 18, 11306–11322 RSC.
- A. I. G. Florez, E. Mucha, D. S. Ahn, S. Gewinner, W. Schollkopf, K. Pagel and G. von Helden, Angew. Chem., Int. Ed., 2016, 55, 3295–3299 CrossRef PubMed.
- Z. Imani, V. R. Mundlapati, G. Goldsztejn, V. Brenner, E. Gloaguen, R. Guillot, J. P. Baltaze, K. Le Barbu-Debus, S. Robin, A. Zehnacker, M. Mons and D. J. Aitken, Chem. Sci., 2020, 11, 9191–9197 RSC.
- E. Gloaguen, M. Mons, K. Schwing and M. Gerhards, Chem. Rev., 2020, 120, 12490–12562 CrossRef CAS PubMed.
- V. R. Mundlapati, Z. Imani, G. Goldsztejn, E. Gloaguen, V. Brenner, K. Le Barbu-Debus, A. Zehnacker-Rentien, J. P. Baltaze, S. Robin, M. Mons and D. J. Aitken, Amino Acids, 2021, 53, 621–633 CrossRef CAS PubMed.
- An alternative modelling procedure used in this work and only available in compounds with simple caps, due to costly computation times (details in ESI, Section S2.4†), confirms these IR spectral features for all types of acceptors, including sulphur, by providing a better agreement than the earlier study (ref. 33).
- V. Brenner, E. Gloaguen and M. Mons, Phys. Chem. Chem. Phys., 2019, 21, 24601–24619 RSC.
- J. Casanovas, D. Zanuy, R. Nussinov and C. Alemán, Chem. Phys. Lett., 2006, 429, 558–562 CrossRef CAS.
- Conformer families identified as having two free NH motifs may include contributions from α-backbone type conformations such as those identified in gas phase, although these are not distinguished in solution state.
Footnotes |
| † Electronic supplementary information (ESI) available. See DOI: 10.1039/d1sc05014a |
| ‡ These authors contributed equally to this work. |
| § Current address: Université de Toulouse, CNRS, CNES; IRAP, 31028 Toulouse, France. |
| ¶ Current address: Graphene Research Labs, KIADB IT Park, Near Airport Bengaluru, 562149, India. |
| This journal is © The Royal Society of Chemistry 2021 |

