 Open Access Article
Creative Commons Attribution 3.0 Unported Licence
Boosting the oxygen evolution activity in non-stoichiometric praseodymium ferrite-based perovskites by A site substitution for alkaline electrolyser anodes†
Steve
Ward
 a,
Mark A.
Isaacs
 bc,
Gaurav
Gupta
 ad,
Mohamed
Mamlouk
a and
Stevin S.
Pramana
 *a
*a
aSchool of Engineering, Newcastle University, Newcastle upon Tyne, NE1 7RU, UK. E-mail: stevin.pramana@newcastle.ac.uk
bHarwellXPS, R92 Research Complex at Harwell, Rutherford Appleton Laboratories, Didcot, OX11 0QS, UK
cDepartment of Chemistry, University College London, London, WC1H 0AJ, UK
dDepartment of Engineering, Lancaster University, Lancaster, LA1 4YR, UK
First published on 20th October 2020
Abstract
Sustainable fossil fuel free systems are crucial for tackling climate change in the global energy market, and the identification and understanding of catalysts needed to build these systems plays a vital role in their development. ABO3−δ perovskite oxides have been observed to be potential replacement materials for the high-performing, but low ionic conducting and economically unfavourable Pt and IrO2 water splitting catalysts. In this work increased addition of Sr2+ aliovalent dopant ions into the crystal lattice of Pr1−xSrxFeO3−δ perovskites via A site substitution was seen to drastically improve the electrocatalytic activity of the oxygen evolution reaction (OER) in alkaline environments. The undoped PrFeO3−δ catalyst was not catalytically active up to 1.70 V against the reversible hydrogen electrode (RHE), whilst an onset potential of 1.62 V was observed for x = 0.5. Increased strontium content in Pr1−xSrxFeO3−δ was found to cause a reduction in the lattice parameters and crystal volume whilst retaining the orthorhombic Pbnm space group throughout all dopant levels, analysed using the Rietveld method. However, it was noted that the orthorhombic distortion was reduced as more Sr2+ replaced Pr3+. The mechanism for the increased electrocatalytic activity with increased strontium is due to the increasing concentration of oxygen vacancy (δ), leading to increased catalyst site availability, and the increased average oxidation state of Fe cations, consistent with the iodometric titration results. This results in shifting the average d shell eg electron filling further towards unity. X-ray photoelectron spectrum of the O 1s core level also shows the presence of lattice oxide and surface hydroxide/carbonate. This work shows promise in that using the more abundant and more economically friendly material of strontium allows for improved OER catalytic activity in otherwise inactive perovskite catalyst oxides.
1. Introduction
The increasing effects of climate change are fuelling a drive to develop environmentally friendly renewable energy technologies in order to facilitate a move away from fossil fuel dependency.1–5 Hydrogen, apart from being the most abundant element known in the universe, is an ideal fuel source for renewable energy applications. Hydrogen is known to have one of the highest relative specific energy constants (120 MJ kg−1) when compared to fuels such as liquefied natural gas (54.4 MJ kg−1), propane (49.6 MJ kg−1), automotive gasoline (46.4 MJ kg−1), and ethanol (29.6 MJ kg−1).6 Therefore, the development of technologies that facilitate clean hydrogen generation is an important step in clean energy development.Water is one of the most abundant resources on the planet, is environmentally neutral, and is a good source of hydrogen. The electrochemical splitting of water into hydrogen and oxygen using electrolysers is a key technology in the development of clean energy, with the oxygen evolution reaction (OER) and the hydrogen evolution reaction (HER) taking place at the anode and cathode respectively. However, although water may be an abundant source of hydrogen, the splitting reaction is rate limited by the kinetically sluggish nature of the oxygen evolution reaction.7–9 This sluggishness has led to energy efficiency rates of as low as 53%.10–13 Hence, one of the keys to practical hydrogen production lies in overcoming the sluggishness of the OER.
Current state-of-the-art catalysts employed in the electrochemical splitting of water are the noble metal oxides IrO2 and RuO2 for the anodic half-cell reaction (eqn (1)), for the OER in alkaline solutions.7,13 These materials are some of the highest performing anodes, requiring overpotentials of around 470 mV to achieve a current density of 10 mA cm−2 in 0.1 M KOH electrolyte.13–15 These materials however, are in low abundance, demonstrate poor ionic conductivity of oxygen species leading to high internal resistance manifesting as a limitation to the reaction rate, and utilise high cost materials. It is for this reason that there is a drive to replace these materials with high performing and more economically sustainable materials.
Perovskite oxides with the formula ABO3−δ (A = rare earth metal and B = transition metal), synthesised using various routes,16–20 have been well researched as potential alkaline electrolyser anodes due to their relatively low cost, high mixed ion–electron conductivity and high surface oxygen exchange coefficient.21,22 Perovskite oxides are suitable OER catalysts as the materials can overcome certain barriers when facilitating the complex oxidation reaction. The slow nature of the 4-electron oxidation process per mole of oxygen at the catalyst surface in alkaline media (eqn (1)7,23,24) has been suggested by Rossmeisl et al. to be directly related to the binding strength of oxygen intermediates with the transition metal catalyst surface. More specifically, catalysts that form strong bonds with oxygen are limited by HOO* formation, whereas catalysts which form weak bonds with oxygen are limited by the O* formation, where * indicates an active catalyst surface site.25 This is represented as a volcano type relationship between oxygen-bonding strength and catalytic activity. Suntivich et al. expanded on this theory, discovering an activity descriptor for catalytic activity relating to the filling of the transition metal higher energy d shell eg σ* antibonding orbital, with an eg filling of single unit occupancy giving the highest oxygen species to transition metal catalyst interaction in octahedral complexes.7,26
| 4OH− → O2 + 2H2O + 4e− | (1) |
The understanding of the filling of the transition metal d shell eg σ* antibonding orbital, and the interaction with the 2p π bonding orbital of the oxygen species has led to developments of first row transition metal based perovskite oxide catalysts such as Ba0.5Sr0.5Co0.8Fe0.2O3−δ,27–29 LaNiO3−δ,30–32 and LaFeO3−δ![[thin space (1/6-em)]](https://www.rsc.org/images/entities/char_2009.gif) 33 for use as electrolyser anodes. Perovskite oxide materials have even been shown to have a comparable OER performance with IrO2 catalysts.34–36
33 for use as electrolyser anodes. Perovskite oxide materials have even been shown to have a comparable OER performance with IrO2 catalysts.34–36
Perovskite oxides also offer considerable control over their crystal structure with relatively small variations to the synthesis process. The exact science behind how tuning the crystal structure of a perovskite to orchestrate higher catalytic activity is often overlooked in the literature. However, a full understanding of how tuning simple perovskite oxides is critical in the design of more complex catalytic systems and could hold the key to unlocking feasible noble metal free OER catalysts. One such structural tuning is the introduction of oxygen vacancies within the lattice, thought to increase the OER catalytic activity.37–43
Doping perovskite oxide A sites through the substitution of a trivalent rare earth (RE) metal by a divalent alkaline earth (AE) metal will cause a charge imbalance throughout the material. This imbalance is rectified by the introduction of oxygen vacancies and/or increasing the oxidation state of the transition metals in order to retain overall charge neutrality. In the case of strontium doped praseodymium ferrites (PSFO, Pr1−xSrxFeO3−δ), increased strontium concentration (x) leads to increased oxygen vacancy concentration (δ).44 The proposed mechanism for oxygen vacancy (V) manufacture arising from substituting RE3+ with AE2+ denoted by the Kröger–Vink notation is shown in eqn (2).
 | (2) |
Electrolyte selection is important in electrolyser systems. In order to lessen high overpotentials due to the electrolyte, the water splitting reaction is best carried out under strongly acidic or alkaline conditions due to the lower solution resistance provided via the higher availability of ions contained in these solutions.47 In order to avoid pH gradients from forming due to the high pH, the electrodes are separated by an ion conducting membrane in electrolyser setups.48 In acidic media, transition metal oxides are associated with energy loss due to corrosion and high overpotentials at the anode.25,49–52 Therefore, in order to extend the lifetime of the catalyst and to reduce overpotentials, alkaline environments are preferential when utilising transition metal based catalysts, which will allow for a replacement of noble metal based systems, increasing economic and environmental viability.
In this paper we investigate the effects of different doping levels of strontium into praseodymium ferrite oxide perovskite structures on the crystal structure, surface electronic states and the electrochemical performance, specifically of the oxygen evolution reaction.
2. Experimental methods
2.1. Material synthesis
Pr1−xSrxFeO3−δ (x = 0, 0.1, 0.2, 0.3, 0.4, 0.5) powders were prepared by mixing stoichiometric amounts of Pr(NO3)3·6H2O (99.9% Alfa Aesar), Sr(NO3)2 (99%, Alfa Aesar), and Fe(NO3)3·9H2O (min. 98%, Alfa Aesar) in deionised water to give an overall concentration of 0.02 M Pr1−xSrxFeO3−δ. Citric acid monohydrate (min. 99.5%, Alfa Aesar) was added as a chelating agent with a molar ratio of 1![[thin space (1/6-em)]](https://www.rsc.org/images/entities/char_2009.gif) :
:![[thin space (1/6-em)]](https://www.rsc.org/images/entities/char_2009.gif) 10 metal to citrate complex. The solution was stirred overnight and then slowly heated until a gel-like substance had formed. This gel was then transferred to an alumina crucible before sintering in a muffle furnace at 800 °C for 6 hours under static air, with a heating rate of 2 °C min−1.
10 metal to citrate complex. The solution was stirred overnight and then slowly heated until a gel-like substance had formed. This gel was then transferred to an alumina crucible before sintering in a muffle furnace at 800 °C for 6 hours under static air, with a heating rate of 2 °C min−1.
2.2. Characterisation methods
The crystallinity of the powders was analysed using laboratory powder X-ray diffraction, using a PANalytical X'Pert Pro MPD, fitted with an X'Celerator detector. The diffraction patterns were acquired by irradiating powder samples with Cu Kα X-ray radiation (λaverage = 1.5418 Å). The samples were scanned over a range of 5–120° in 2θ with a step size of 0.0334° and nominal time-per-step of around 6 seconds. Fixed divergence and anti-scatter slits of ½° and 1° respectively were used together with a beam mask of 10 mm. The resulting diffraction patterns were refined using the Rietveld method of least squares53 using TOPAS-Academic V6.54,55 The starting model used the Pbnm space group with the atomic positions of undoped PrFeO3−δ (ICSD code 27274),56 with the Sr dopant sharing the Pr crystallographic site. Fundamental parameter peak shape profile57 and X-ray form factors of Pr3+, Sr2+, Fe3+ and O2− were used. For each data set, the Chebyshev polynomial and 1/x background, a zero error, unit cell parameters, scale factors, and crystal size/strain were refined sequentially. The sum of occupancies of Pr3+ and Sr2+ was constrained to unity. Isotropic temperature displacement factors for all atoms were refined independently. The cation positions were refined, followed by the oxygen positions.The oxygen content of the perovskite oxides was calculated from the oxidation state of iron, which was determined by iodometric titration. ∼20 mg of perovskite powder was dissolved in 20 ml of hydrochloric acid (12 M) by continuous stirring in a nitrogen gas flushed flask. An excess of 0.1 M KI was added once the powder had fully dissolved. 0.005 M Na2S2O3 solution was used to titrate against the iodine generated. A 1% starch solution, as an indicator, was added towards the end of titration.
The electrocatalytic activity of Pr1−xSrxFeO3−δ perovskite oxides for the oxygen evolution reaction was measured in a three-electrode cell setup. Perovskite inks were prepared by mixing 2 mg of perovskite catalyst, 0.4 ml deionised H2O, 0.1 ml propan-2-ol, and 60 μl of Nafion 117 (5% w/v). Homogeneous mixing was assured by ultrasonicating the ink for at least 20 minutes. 3 μl of the ink was drop cast onto a 3 mm diameter gold electrode (99.95% purity, Alvatek). 10.7 μg of catalyst was loaded onto the electrode. Cyclic voltammetry (CV), electrical impedance spectroscopy (EIS), and chronoamperometry measurements were carried out in a glass cell using an Ag/AgCl leakless electrode and platinum mesh as reference and counter electrodes respectively. A solution of nitrogen saturated 0.1 M KOH (Alfa Aesar, 99.98%) in deionised water was used as the electrolyte.58–60 The Ag/AgCl reference electrode was calibrated against the reversible hydrogen electrode (RHE) in the same electrolyte solution giving a conversion value of ERHE = EAg/AgCl + 0.98 V. Potential and currents were applied and measured respectively using a Gamry Interface 5000E potentiostat. Cyclic voltammetry experiments were carried out in a range of 1.30–1.80 VRHE, using a scan rate of 5 mV s−1. 3 cycles were measured after activating the material by running chronoamperometry at 1.70 VRHE for 30 minutes. To account for resistances arising from the electrolyte solution, and internal connections, ohmic drop (iR) compensation was applied to the CV data post testing using resistance data gathered from EIS measurements. All current densities were normalised through the area of the electrode (0.07 cm2). EIS scans were recorded from 105 to 10−1 Hz at 1.70 VRHE. The performance of the material as a catalyst at electrolyser anodes was tested using a 300 μm thick titanium fibre felt gas diffusion layer (GDL, Bekaert S.A. Fibre Technologies) with a 78% porosity using 20 μm thick titanium fibres used as a support for the PSFO material. The mesh was cut into an area of 2 cm2. The anode was prepared by spraying the catalyst material directly onto the titanium mesh. The spray consisted of 10 wt% polystyrene-b-poly (ethylene/butylene)-b-polystyrene base ionomer, made with polymer synthesis as outlined by Gupta et al.,61 with 2 mg cm−2 loading of the PSFO perovskite samples, with a small amount of 5 wt% polytetrafluoroethylene (PTFE) binder.
The cathode for the hydrogen evolution reaction (HER) was constructed using a non-wet proofed carbon GDL with a microporous layer (MPL, Freudenberg), cut into a 13 mm diameter circle. For the HER catalyst, 0.4 mg cm−2 20 wt% Pt on carbon was used. The catalyst ink contained 20 wt% Pt on carbon, 28 wt% ionomer, 5 wt% PTFE binder, and propan-2-ol. This was sprayed directly onto the carbon GDL/MPL paper.
The radiation grafted anion exchange membrane (AEM) was synthesised also according to Gupta et al.,61 using a low-density polyethylene (LDPE) with vinylbenzyl chloride (VBC) as the graft monomer. 0.1 M NaOH was used as the electrolyte. EIS and CV scans were measured at 20 °C, 40 °C, 60 °C, and 80 °C.
X-ray photoelectron spectroscopy (XPS) analysis was performed using a Kratos Axis SUPRA XPS fitted with a monochromated Al Kα X-ray source (1486.7 eV), a spherical sector analyser, 3 multichannel resistive plates, and 128 channel delay line detectors. Ultraviolet photoelectron spectroscopy (UPS) measurements were performed using a He(I) lamp (21.22 eV) and an emission current of 25 mA. All spectra were recorded at 150 W and a spot size of 700 μm × 300 μm. Survey scans were recorded at a pass energy of 160 eV, and high-resolution scans recorded at a pass energy of 20 eV. UPS scans were recorded with a pass energy of 5 eV. Electronic charge neutralization was achieved using an electron flood gun. The parameters used for the filament current, charge balance, and filament bias were 0.27 A, 3.3 V, and 3.8 V respectively. All sample data were recorded at a pressure below 10−9 Torr and room temperature. Data was analysed using CasaXPS v2.3.19PR1.0. Peaks were fit with a Shirley background prior to component analysis. Lineshapes of LA (1.53243) were used to fit components. Charge calibration was achieved using adventitious carbon at 284.8 eV.
3. Results and discussion
3.1. Crystal structure
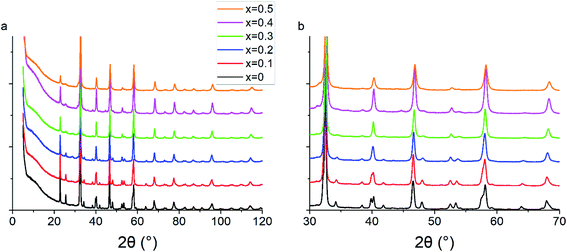
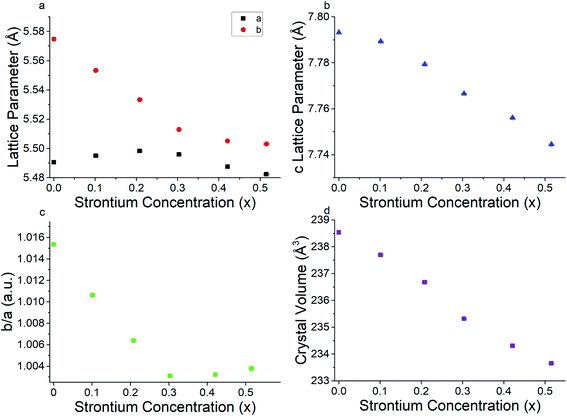
Powder X-ray diffraction patterns for all PSFO samples indicate pure perovskite phase with minimal secondary impurity phases within the detection limit of the XRD instrument (Fig. 1). The x = 0.4 and x = 0.5 material have a small amount (<3 wt%) of the Pr2FeO4+δ Ruddlesden–Popper phase present. The Rietveld fits of the XRD patterns together with the Bragg markers for both perovskite and Ruddlesden–Popper phases are collated in Fig. S1–S6.† As the concentration of the divalent strontium species (Sr2+) increases, the peaks shift towards a higher 2θ value which results in the contraction of the perovskite lattice parameters (Fig. 2a and b) but the overall crystal structure retains the orthorhombic Pbnm space group, as is consistent with the literature studies of similar materials.62 As highlighted in Fig. 1b, the number of Bragg reflections decreases as x increases. It is clearly observed at 2θ = 40.2, 47.9 and 53.4° where the peak splits are less apparent. This indicates the reduction of the orthorhombic distortion, leading to a higher degree of crystal symmetry indicated by the ratio of b/a lattice parameters approaching unity with increased Sr2+ (Fig. 2c).44,63,64 This reduction of orthorhombic distortion leading closer to an ideal cubic perovskite increases the electrical conductivity of the material.65 This is explained by a wider charge carrier bandwidth and overlap between the Fe 3d and O 2p orbitals, which is due to the changes in the buckling angle of the Fe–O–Fe bonds, and the bond lengths of the Fe–O environment.66,67The contraction of lattice parameters and crystal volume as strontium doping increases is shown in Fig. 2. Overall, the a lattice parameter stayed at 5.48 to 5.49 Å, whereas the b and c lattice parameters decreased in line with increasing Sr2+ content. The overall crystal volume of the perovskite decreased with increased addition of Sr2+. Despite the larger ionic size of Sr2+ (1.31 Å, in 9-coordination)68 occupying the Pr3+ site (1.179 Å), the decreasing trend of the unit cell volume can be explained by an increasing average oxidation state of Fe, obtained from the iodometric titration, and as a result, a decrease in the coordination number of Fe–O, from 6 to 5, due to a higher oxygen vacancy content. This is consistent with a slight shift of the X-ray photoelectron spectrum towards a lower binding energy of Fe 2p as x increases, which will be explained in the next section. Lattice parameters and crystal volume are shown in Table 1. The reduction of the crystal lattice volume as Sr2+ doping concentration increases is consistent with what has been observed in similar perovskite oxide materials.69,70
| Sr2+ concentration (x) | a lattice parameter (Å) | b lattice parameter (Å) | c lattice parameter (Å) | Crystal volume (Å3) |
|---|---|---|---|---|
| 0 | 5.4905 (2) | 5.5748 (2) | 7.7932 (2) | 238.54 (1) |
| 0.101 (6) | 5.4950 (2) | 5.5533 (2) | 7.7893 (3) | 237.69 (2) |
| 0.208 (6) | 5.4983 (3) | 5.5333 (3) | 7.7793 (4) | 236.68 (2) |
| 0.303 (6) | 5.4959 (4) | 5.5130 (5) | 7.7666 (6) | 235.32 (3) |
| 0.421 (5) | 5.4875 (5) | 5.5051 (3) | 7.7561 (6) | 234.30 (3) |
| 0.515 (7) | 5.4824 (6) | 5.5031 (9) | 7.7445 (9) | 233.65 (5) |
Bond valence sum (BVS) analysis71 which gives an estimation of the bond strength in ionic compounds, was calculated taking into consideration the oxygen vacancy concentration determined by iodometric titration using eqn (3).
 | (3) |
| Sr2+ concentration (x) | Average total bond length (Å) | Average axial bond length (Å) | Average equatorial bond length (Å) | Bond valence sum of Fe |
|---|---|---|---|---|
| 0 | 2.010 (2) | 2.012 (2) | 2.009 (4) | 2.99 (2) |
| 0.101 (6) | 2.002 (3) | 1.996 (2) | 2.005 (5) | 2.99 (3) |
| 0.208 (6) | 1.989 (4) | 1.972 (3) | 1.999 (6) | 3.11 (4) |
| 0.303 (6) | 1.977 (5) | 1.971 (4) | 1.979 (8) | 3.15 (5) |
| 0.421 (5) | 1.966 (7) | 1.958 (4) | 1.970 (10) | 3.19 (7) |
| 0.515 (7) | 1.962 (7) | 1.976 (4) | 1.955 (10) | 3.19 (7) |
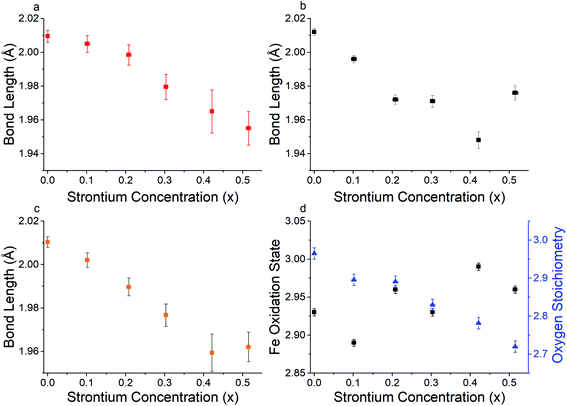
Interestingly, Fig. 3a and b indicate that for lower Sr2+ concentration (x = 0–0.2) it is the axial Fe–O bonds that appear to have a higher contribution to the reduction in the average overall bond length, whereas for Sr2+ concentrations of 0.3–0.5 the equatorial bond lengths have a greater contribution. This observation is worthy of note, but the reasoning behind this change is beyond the scope of this investigation. In line with what is hypothesised in eqn (2), Fig. 3d shows that as Sr2+ concentration increases, so does the concentration of oxygen vacancies. The reduction of the oxygen stoichiometry (3 − δ) whilst retaining the Pbnm space group was thought to lead to higher active sites of the B site Fe catalyst surface throughout the crystal lattice to the oxygen species to be oxidised, leading to an increase in OER catalytic activity.
The presence of Fe4+ was ruled out in this system as this was not observed in either the iodometric titration or the XPS measurements. The higher overall oxidation state will lead to a d shell degenerate eg orbital filling closer to unity, which as previously discussed7,26 will lead to higher OER catalyst activity. This combined with the increased availability of the transition metal species through vacancies in the oxygen site were hypothesised to be the reason behind the increase in the OER electrocatalytic performance of the higher Sr2+ doped PSFO material. This increase in the oxidation state is in good agreement with the recent literature regarding studies of the perovskite oxide La1−xSrxFeO3−δ for OER catalysis, where Fe oxidation states as high as +4 have been observed in high Sr2+ doping concentrations through X-ray absorption spectroscopy of the Fe L2,3 edge.73,74 This increase of the overall oxidation state will induce changes in the electronic properties of the material, with increasing oxidation states affecting the density of states (DOS) near the Fermi level, thus altering the binding strength between the Fe 3d and oxygen species 2p orbitals which as previously discussed is in line with the activity descriptor set out by Suntivich et al.58,75
3.2. Surface electronic structure and chemistry
The binding energies (BE) obtained from XPS were corrected by calibrating the scans so that the dominant low binding energy C 1s peak was at 284.8 eV. High resolution scans of Pr 3d in Fig. 4a show a common lineshape characteristic of Pr3+.76Fig. 4a shows two distinct typical peaks at around 933 and 953 eV, which are attributed to Pr 3d5/2 and Pr 3d3/2 respectively.77,78 The difference of ∼20 eV is consistent with the literature values for the spin orbital splitting of the 3d5/2 and 3d3/2 praseodymium orbitals.76,79 Unfortunately, the determination between Pr +3 and +4 is challenging due to the complex nature of final state effects in such systems. For example, it has been reported76,79 that a satellite peak at 967 eV, arising from 3d4f1 final states, is exclusive of Pr4+ from studies of PrO2, which is absent in the scans presented in Fig. 4a. This could indicate that the praseodymium is present in a +3 oxidation state as would be expected in ABO3−δ perovskite oxides. However, there is overlap between this satellite peak and the oxygen O KLL Auger peak (∼973 eV) which makes satellite peak determination difficult.80 However, careful analysis of the Pr 3d5/2 lineshape and high energy final state effects afford an appropriate methodology for praseodymium oxidation state determination. Analysis of the 3d5/2 photoemission reveals the presence of one photoemission peak (m) and one shake-down satellite (s) at lower binding energy arising from well screened 4f3 final states. The ratio between these two peaks varies between Pr3+ and Pr4+, with Pr2O3 reporting a higher ratio of m![[thin space (1/6-em)]](https://www.rsc.org/images/entities/char_2009.gif) :
:![[thin space (1/6-em)]](https://www.rsc.org/images/entities/char_2009.gif) s than PrO2.76 Deconvolution of our experimental data reports a constant m
s than PrO2.76 Deconvolution of our experimental data reports a constant m![[thin space (1/6-em)]](https://www.rsc.org/images/entities/char_2009.gif) :
:![[thin space (1/6-em)]](https://www.rsc.org/images/entities/char_2009.gif) s ratio of 3.05 ± 0.05 a.u. which is consistent with the theoretically determined ratio for Pr3+.81
s ratio of 3.05 ± 0.05 a.u. which is consistent with the theoretically determined ratio for Pr3+.81
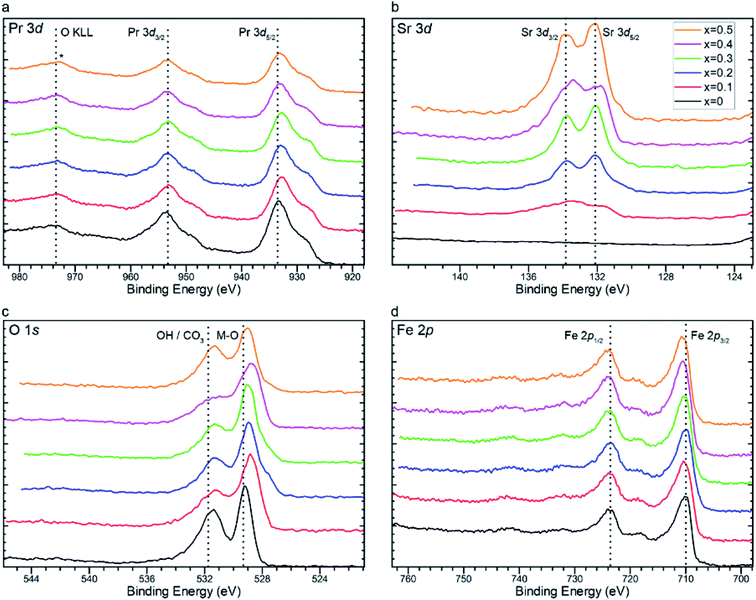 | ||
| Fig. 4 X-ray photoelectron spectra of (a) Pr 3d, (b) Sr 3d, (c) O 1s, and (d) Fe 2p core orbitals of Pr1−xSrxFeO3−δ (x = 0, 0.1, 0.2, 0.3, 0.4, and 0.5). | ||
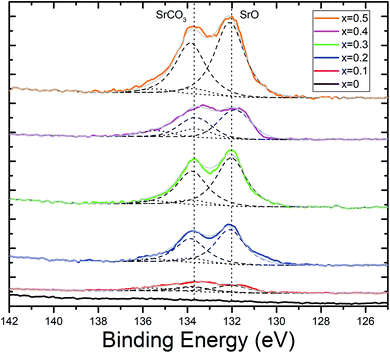
As the value for x increases, praseodymium is replaced with strontium. As expected, intensities of the peaks found in photoelectron scans of the Sr 3d core orbital increase with increasing values of x (Fig. 4b). Peak models were fit using an Sr 3d doublet separation of 1.76 eV and defining two species, SrO at 132 eV and SrCO3 at 133.8 eV (Fig. 5).82 It was determined that as the strontium content increased in the perovskite, the ratio between SrO and SrCO3 also increased in favour of the oxide with the exception of x = 0.4, which reported an anomalous quantity of carbonate in relation to the rest of the series. It is of note that no carbonate species was detected within detection limits of the XRD scans. This is indicative that the carbonate species is located mainly at the surface of the catalyst which will play a critical role in blocking the surface catalytic reaction.83 It is reasoned that this carbonate interference is the primary factor in explaining the anomalous electrochemical result seen for the x = 0.4 material, which is further elaborated in the next section. This performance was replicated in experimental repeats which suggests that the Pr0.6Sr0.4FeO3−δ (x = 0.4) is prone to carbonate formation at this specific stoichiometry. The mechanism behind this specific carbonate formation is unclear, especially as this phenomenon is not seen in the surrounding stoichiometries (x = 0.3 and 0.5), which presents an opportunity for future study.
The presence of both oxide and carbonate environments is further confirmed from O 1s scans (Fig. 4c), where there are two distinct peaks. Contributions from the lattice oxide at 528 eV are accompanied by contributions at a higher binding energy of around 531 eV, which is attributed to a mixed contribution of hydroxide and/or carbonate environments, with the deconvoluted scans presented in Fig. S7.† Unfortunately, the binding energies of hydroxide and carbonate environments are very close together and therefore difficult to distinguish from each other from the O 1s spectra.84
Fig. 4d shows Fe 2p spectra across the series. The lineshape is characteristic of Fe(III) and was fit using a model developed via a combination of hematite (α-Fe2O3) reference material and the work of Grosvenor et al.85 From these fits we can see an increase in binding energy of the principle photoemission rising from 709.7 eV (x = 0) to 710 eV (x = 0.5), indicating an increased localised charge (>δ+) among the iron centres. The shift in the Fe 2p core orbital towards a higher binding energy with increased Sr2+ content is consistent with the iodometric titration results.
Ultraviolet photoelectron spectroscopy was used to determine the workfunction for each of the perovskite catalysts. The workfunction decreased as the concentration of Sr2+ cations increased on the A site of the perovskite lattice (Fig. S8a and b†). This decrease is related to the energy requirement to ionise the perovskite lattice, or to move electrons throughout the material. The increased electron movement within the crystal lattice will aid in the increased electrocatalytic performance, as discussed in the next section.
3.3. Electrochemistry
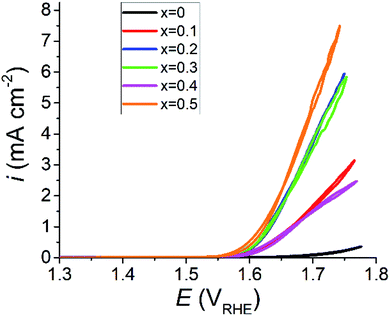
Cyclic voltammetry (CV) and electrochemical impedance spectroscopy (EIS) scan results are in line with what is suggested by the changes in crystal structure. Material with a higher Sr2+ concentration demonstrated considerably higher electrochemical performance than that of unaltered PrFeO3−δ. iR corrected CV plots for the PSFO series are presented in Fig. 6. The undoped PrFeO3−δ catalyst is still OER inactive up to 1.70 V against the reversible hydrogen electrode (RHE).The oxygen vacancies in the Sr2+ doped PSFO catalysts play a crucial role in the increase in the oxygen evolution electrocatalytic activity. When a vacancy is introduced to the oxygen site of the crystal lattice, the coordination number of the Fe–O is reduced from 6 to 5. The 5 coordinated Fe–O unit will have a greater availability of the Fe 3d orbital with the 2p orbital of the adsorbing OH− species, creating an intermediate OH−–FeO5 octahedral unit. The overlap between the Fe 3d and O 2p orbitals leads to increased catalytic activity as discussed in previous sections.86 The concentration of lattice oxygen vacancies increases with Sr2+ concentration (Fig. 3d), allowing for more of this OH−–FeO5 octahedral unit to be present at one time in the catalyst, explaining the high performance seen in the x = 0.5 catalyst. The improved OER performance of perovskite oxide catalysts through oxygen vacancy creation via A site doping is also observed in similar systems, which show comparable performance to the PSFO catalysts documented in this study.35,73,74,87,88Fig. 6 shows iR corrected CV scans where the maximum current density response comes from the x = 0.5 sample. Table 3 shows the OER performance of similar rare earth single perovskite oxides in alkaline media, compared with the x = 0.5 material from this study.
There is an anomalous result in the cyclic voltammogram for x = 0.4 (Fig. 6). This can be explained by the high concentration of carbonate present in the sample as determined by X-ray photoelectron spectroscopy (Fig. 4c and 5). Increased carbonate concentration can impair the performance of the OER catalytic reaction. The effects of the carbonate species on the catalyst are twofold. The carbonate interferes with the electrolyte by depleting charge carrying hydroxyl ions, lowering the overall conductivity of the electrolyte solution. The formed carbonates may also precipitate within the electrode, potentially blocking catalyst active sites, whilst also reducing the hydrophobicity of the electrode backing layer which can lead to structural degradation and electrode flooding.83
The onset potential for the OER, taken as the potential required to generate 1 mA cm−2 of the current response, reduced in line with Sr2+ concentration, except for x = 0.4. The onset potential for the doped samples ranges from 1.67 VRHE (overpotential, η = 440 mV) for x = 0.1 to 1.62 VRHE (η = 390 mV) for x = 0.5. The improved performance with regard to the onset potential is a great success of this material design as the undoped PrFeO3−δ (x = 0) material did not produce a current response of 1 mA cm−2 even at a potential of 1.70 VRHE in half-cell testing. Lowering onset potentials is a critical metric in designing materials for electrolyser anodes due to the cost factor and durability associated with long-term operation of electrolyser systems.
Fig. S9† illustrates chronoamperometry results for the PSFO catalyst series measured at 1.70 VRHE in 0.1 M KOH for 30 minutes. As with the other electrochemical testing, the Pr0.5Sr0.5FeO3−δ (x = 0.5) material elicited the highest performance with regard to current density and showed good stability over the chronoamperometry testing conditions. The ‘steps’ seen in the chronoamperometry measurements are most likely the result of an insulating layer of oxygen gas bubbles forming on the electrode surface reducing the current density, before the bubbles are released and contact between the electrolyte and electrode is restored. From this testing it can be seen that Sr2+ incorporation into the perovskite structure does not seem to cause any negative effects relating to material stability.
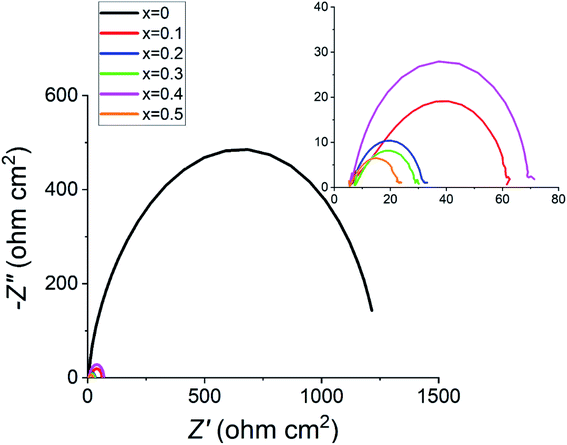
Fig. 7 highlights the huge difference in the electrical impedance response between the undoped sample with the doped ones, with the highest doped x = 0.5 material having the lowest polarisation resistance, Rp. These measurements were taken at 1.70 VRHE as this is in the active electrochemical region as shown in Fig. 6. All tested materials showed a semi-circle behaviour, with similar values for the total ohmic resistance, Rs.
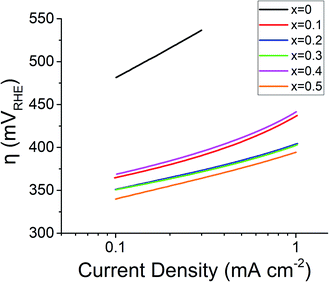
The undoped PrFeO3−δ has a Tafel slope of ∼108 mV dec−1, when compared to around 50 mV dec−1 for the doped catalyst perovskite oxides (Fig. 8). The 60 mV dec−1 shift is indicative of a possible change in the rate limiting reaction. The 4-electron OER reaction per mole of oxygen consists of 4 reactions (eqn (4)–(7)) on the transition metal surface (M), each of which can act as the rate determining step,
| M + OH− ↔ MOH + e− | (4) |
| MOH + OH− ↔ MO + H2O + e− | (5) |
| MO + 2OH− ↔ MOO− + H2O + e− | (6) |
| MOO− ↔ M + O2 + e− | (7) |
Kinetic simulations undertaken by Shinagawa et al. (2015) determined that for electrocatalysis of the oxygen evolution reaction where the Tafel slope is around 120 mV dec−1, as is the case for the x = 0 material, the reaction is rate limited by the formation of the metal oxide bond (eqn (4)). The reductive tendency in the Tafel slope is seen when Sr2+ is introduced to the unit cell tends towards the OER rate limiting step to be shifted to the formation of the peroxide bond on the metal surface (eqn (6)), or the desorption of O2 from the metal surface (eqn (7)).93 The Tafel slope values seen in this study are consistent with those found in the literature for similar perovskite materials.30,94–96
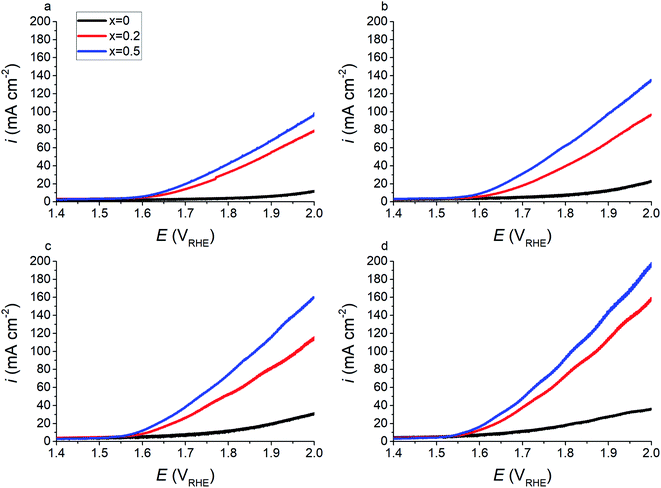
Fig. 9 shows forward cyclic voltammetry measurements for x = 0, 0.2, and 0.5 at 20 °C, 40 °C, 60 °C, and 80 °C in the full cell configuration. As expected, the current response of the material increases with increased temperatures. Electrolyser tests confirm electrochemical results from half-cell testing (Fig. 6), in that the addition of Sr2+ cations increases the electrocatalytic performance of the PSFO catalysts with regards to the oxygen evolution reaction. At an operating temperature of 80 °C the overpotential (η) required to elicit a current response of 10 mA cm−2 is 442 mV, 353 mV, and 335 mV for x = 0, 0.2, and 0.5 respectively; and for 150 mA cm−2 the overpotential required is 752 mV and 680 mV for x = 0.2 and 0.5 respectively.
4. Conclusions
Praseodymium strontium ferrite perovskite oxides with the formula of Pr1−xSrxFeO3−δ (x = 0, 0.1, 0.2, 0.3, 0.4, and 0.5) have been successfully synthesised by the wet chemistry citrate sol gel method, and have demonstrated increased OER electrocatalytic activity for higher values of x. The mechanism behind the increased activity due to the addition of Sr2+via A site substitution of Pr3+ to the perovskite lattice is attributed to increased oxygen vacancy concentration allowing for a higher availability of the B site transition metal catalyst surface and a shift in the average oxidation state of the B site iron ion leading to a d shell eg electron orbital filling closer to the well-defined activity descriptor of unity, all of which allows for higher electron–ion conductivity and catalyst activity. This improvement is especially impressive as the undoped PrFeO3−δ (x = 0) material was demonstrated to be essentially inactive towards oxygen evolution at 1.70 VRHE in 0.1 M KOH electrolyte in 3 electrode setups, and requiring relatively high overpotentials and operating temperatures in order to start becoming active in electrolyser cells, compared to the performance of the A site doped material. This relatively small change to the stoichiometry of the material, whilst retaining the crystal structure of perovskites, demonstrates how the OER performance can be further enhanced with the implementation of more environmentally and economically attractive materials.Author's contributions
S. W. and S. S. P. conceived and designed this work. S. W. performed the XRD experiments and analysed the crystal structure of materials. S. W., G. G. and M. M. performed the electrical measurements and analysis of the results. M. A. I. performed the X-ray photoelectron spectroscopy and ultraviolet photoelectron spectroscopy measurements and analyses. All authors co-wrote and reviewed the manuscript.Conflicts of interest
There are no conflicts of interest to declare.Acknowledgements
S. S. P. acknowledges the start-up financial support from the School of Engineering, Newcastle University. S. W. thanks EPSRC for his DTP studentship.References
- M. S. Dresselhaus and I. L. Thomas, Nature, 2001, 414, 332–337 CrossRef CAS
.
-
G. Boyle, Renewable Energy, Oxford University Press and the Open University, Oxford, 2004 Search PubMed
.
- R. Subbaraman, D. Tripkovic, K.-C. Chang, D. Strmcnik, A. P. Paulikas, P. Hirunsit, M. Chan, J. Greeley, V. Stamenkovic and N. M. Markovic, Nat. Mater., 2012, 11, 550–557 CrossRef CAS
.
- I. Dincer, Renewable Sustainable Energy Rev., 2000, 4, 157–175 CrossRef
.
- M. Liserre, T. Sauter and J. Y. Hung, IEEE Trans. Ind. Electron., 2010, 4, 18–37 Search PubMed
.
- M. Ni, M. K. H. Leung, K. Sumathy and D. Y. C. Leung, Int. J. Hydrogen Energy, 2006, 31, 1401–1412 CrossRef CAS
.
- J. Suntivich, K. J. May, H. A. Gasteiger, J. B. Goodenough and Y. Shao-Horn, Science, 2011, 334, 1383–1385 CrossRef CAS
.
- J. Masud, S. Umapathi, N. Ashokaan and M. Nath, J. Mater. Chem. A, 2016, 4, 9750–9754 RSC
.
- P. T. Babar, A. C. Lokhande, M. G. Gang, B. S. Pawar, S. M. Pawar and J. H. Kim, J. Ind. Eng. Chem., 2018, 60, 493–497 CrossRef CAS
.
- I. C. Man, H.-Y. Su, F. Calle-Vallejo, H. A. Hansen, J. I. Martínez, N. G. Inoglu, J. Kitchin, T. F. Jaramillo, J. K. Nørskov and J. Rossmeisl, ChemCatChem, 2011, 3, 1159–1165 CrossRef CAS
.
- J. Nieminen, I. Dincer and G. Naterer, Int. J. Hydrogen Energy, 2010, 35, 10842–10850 CrossRef CAS
.
- H. Dau, C. Limberg, T. Reier, M. Risch, S. Roggan and P. Strasser, ChemCatChem, 2010, 2, 724–761 CrossRef CAS
.
- Y. Lee, J. Suntivich, K. J. May, E. E. Perry and Y. Shao-Horn, J. Phys. Chem. Lett., 2012, 3, 399–404 CrossRef CAS
.
- W. Tian, C. Wang, R. Chen, Z. Cai, D. Zhou, Y. Hao, Y. Chang, N. Han, Y. Li, J. Liu, F. Wang, W. Liu, H. Duan and X. Sun, RSC Adv., 2018, 8, 26004–26010 RSC
.
- L. Giordano, B. Han, M. Risch, W. T. Hong, R. R. Rao, K. A. Stoerzinger and Y. Shao-Horn, Catal. Today, 2016, 262, 2–10 CrossRef CAS
.
- C. Chen, J. Cheng, S. Yu, L. Che and Z. Meng, J. Cryst. Growth, 2006, 291, 135–139 CrossRef CAS
.
- Y. Mao, S. Banerjee and S. S. Wong, J. Am. Chem. Soc., 2003, 125, 15718–15719 CrossRef CAS
.
- Y. Mao, S. Banerjee and S. S. Wong, Chem. Commun., 2003, 408–409 RSC
.
- D. D. Athayde, D. F. Souza, A. M. A. Silva, D. Vasconcelos, E. H. M. Nunes, J. C. Diniz da Costa and W. L. Vasconcelos, Ceram. Int., 2016, 42, 6555–6571 CrossRef CAS
.
- P. Cousin and R. A. Ross, Mater. Sci. Eng., A, 1990, 130, 119–125 CrossRef
.
- J. A. Kilner, R. A. De Souza and I. C. Fullarton, Solid State Ionics, 1996, 86–88, 703–709 CrossRef CAS
.
- R. A. De Souza and J. A. Kilner, Solid State Ionics, 1999, 126, 153–161 CrossRef CAS
.
- M. W. Kanan and D. G. Nocera, Science, 2008, 321, 1072–1075 CrossRef CAS
.
- Y. Zhao, J. R. Swierk, J. D. Megiatto, B. Sherman, W. J. Youngblood, D. Qin, D. M. Lentz, A. L. Moore, T. A. Moore, D. Gust and T. E. Mallouk, Proc. Natl. Acad. Sci. U. S. A., 2012, 109, 15612–15616 CrossRef CAS
.
- J. Rossmeisl, Z. W. Qu, H. Zhu, G. J. Kroes and J. K. Nørskov, J. Electroanal. Chem., 2007, 607, 83–89 CrossRef CAS
.
- K. J. May, C. E. Carlton, K. A. Stoerzinger, M. Risch, J. Suntivich, Y.-L. Lee, A. Grimaud and Y. Shao-Horn, J. Phys. Chem. Lett., 2012, 3, 3264–3270 CrossRef CAS
.
- J.-I. Jung, M. Risch, S. Park, M. G. Kim, G. Nam, H.-Y. Jeong, Y. Shao-Horn and J. Cho, Energy Environ. Sci., 2016, 9, 176–183 RSC
.
- C. Jin, X. Cao, F. Lu, Z. Yang and R. Yang, Int. J. Hydrogen Energy, 2013, 38, 10389–10393 CrossRef CAS
.
- J.-I. Jung, H. Y. Jeong, J.-S. Lee, M. G. Kim and J. Cho, Angew. Chem., Int. Ed., 2014, 126, 4670–4674 CrossRef
.
- W. G. Hardin, D. A. Slanac, X. Wang, S. Dai, K. P. Johnston and K. J. Stevenson, J. Phys. Chem. Lett., 2013, 4, 1254–1259 CrossRef CAS
.
- M. Bursell, M. Pirjamali and Y. Kiros, Electrochim. Acta, 2002, 47, 1651–1660 CrossRef CAS
.
- J. R. Petrie, V. R. Cooper, J. W. Freeland, T. L. Meyer, Z. Zhang, D. A. Lutterman and H. N. Lee, J. Am. Chem. Soc., 2016, 138, 2488–2491 CrossRef CAS
.
- Y. Zhu, W. Zhou, J. Yu, Y. Chen, M. Liu and Z. Shao, Chem. Mater., 2016, 28, 1691–1697 CrossRef CAS
.
- J. I. Jung, M. Risch, S. Park, M. G. Kim, G. Nam, H. Y. Jeong, Y. Shao-Horn and J. Cho, Energy Environ. Sci., 2016, 9, 176 RSC
.
- C.-F. Chen, G. King, R. M. Dickerson, P. A. Papin, S. Gupta, W. R. Kellogg and G. Wu, Nano Energy, 2015, 13, 423–432 CrossRef CAS
.
- E. Fabbri, M. Nachtegaal, T. Binninger, X. Cheng, B.-J. Kim, J. Durst, F. Bozza, T. Graule, R. Schäublin, L. Wiles, M. Pertoso, N. Danilovic, K. E. Ayers and T. J. Schmidt, Nat. Mater., 2017, 16, 925–931 CrossRef CAS
.
- S. Raabe, D. Mierwaldt, J. Ciston, M. Uijttewaal, H. Stein, J. Hoffmann, Y. Zhu, P. Blöchl and C. Jooss, Adv. Funct. Mater., 2012, 22, 3378–3388 CrossRef CAS
.
- X. Xu, C. Su, W. Zhou, Y. Zhu, Y. Chen and Z. Shao, Adv. Sci., 2016, 3, 1500187 CrossRef
.
- S. K. Tiwari, S. P. Singh and R. N. Singh, J. Electrochem. Soc., 1996, 143, 1505–1510 CrossRef CAS
.
- K.-N. Jung, J.-H. Jung, W. B. Im, S. Yoon, K.-H. Shin and J.-W. Lee, ACS Appl. Mater. Interfaces, 2013, 5, 9902–9907 CrossRef CAS
.
- W. Zhou, M. Zhao, F. Liang, S. C. Smith and Z. Zhu, Mater. Horiz., 2015, 2, 495–501 RSC
.
- R. N. Singh and B. Lal, Int. J. Hydrogen Energy, 2002, 27, 45–55 CrossRef CAS
.
- E. M. Garcia, H. A. Tarôco, T. Matencio, R. Z. Domingues and J. A. F. dos Santos, Int. J. Hydrogen Energy, 2012, 37, 6400–6406 CrossRef CAS
.
- H. W. Brinks, H. Fjellvåg, A. Kjekshus and B. C. Hauback, J. Solid State Chem., 2000, 150, 233–249 CrossRef CAS
.
- K. Zhu, T. Wu, M. Li, R. Lu, X. Zhu and W. Yang, J. Mater. Chem. A, 2017, 5, 19836–19845 RSC
.
- V. Antonucci, A. Di Blasi, V. Baglio, R. Ornelas, F. Matteucci, J. Ledesma-Garcia, L. G. Arriaga and A. S. Aricò, Electrochim. Acta, 2008, 53, 7350–7356 CrossRef CAS
.
- J. Luo, J.-H. Im, M. T. Mayer, M. Schreier, M. K. Nazeeruddin, N.-G. Park, S. D. Tilley, H. J. Fan and M. Grätzel, Science, 2014, 345, 1593–1596 CrossRef CAS
.
- E. A. Hernández-Pagán, N. M. Vargas-Barbosa, T. Wang, Y. Zhao, E. S. Smotkin and T. E. Mallouk, Energy Environ. Sci., 2012, 5, 7582–7589 RSC
.
- K. Zeng and D. Zhang, Prog. Energy Combust. Sci., 2010, 36, 307–326 CrossRef CAS
.
- N.-T. Suen, S.-F. Hung, Q. Quan, N. Zhang, Y.-J. Xu and H. M. Chen, Chem. Soc. Rev., 2017, 46, 337–365 RSC
.
- S. Jung, C. C. L. McCrory, I. M. Ferrer, J. C. Peters and T. F. Jaramillo, J. Mater. Chem. A, 2016, 4, 3068–3076 RSC
.
-
R. L. Doyle and M. E. G. Lyons, in Photoelectrochemical Solar Fuel Production: From Basic Principles to Advanced Devices, Springer International Publishing, Cham, 2016, pp. 41–104 Search PubMed
.
- H. M. Rietveld, J. Appl. Crystallogr., 1969, 2, 65–71 CrossRef CAS
.
- G. W. Stinton and J. S. O. Evans, J. Appl. Crystallogr., 2007, 40, 87–95 CrossRef CAS
.
-
R. E. Dinnebier, A. Leineweber and J. S. Evans, Rietveld Refinement: Practical Powder Diffraction Pattern Analysis Using TOPAS, Walter de Gruyter GmbH & Co KG, Berlin, 2018 Search PubMed
.
- M. Marezio, J. P. Remeika and P. D. Dernier, Acta Crystallogr., Sect. B: Struct. Crystallogr. Cryst. Chem., 1970, 26, 2008–2022 CrossRef CAS
.
- R. W. Cheary and A. Coelho, J. Appl. Crystallogr., 1992, 25, 109–121 CrossRef CAS
.
- J. Suntivich, H. A. Gasteiger, N. Yabuuchi, H. Nakanishi, J. B. Goodenough and Y. Shao-Horn, Nat. Chem., 2011, 3, 546–550 CrossRef CAS
.
- C. Jin, X. Cao, L. Zhang, C. Zhang and R. Yang, J. Power Sources, 2013, 241, 225–230 CrossRef CAS
.
- X. Rong, J. Parolin and A. M. Kolpak, ACS Catal., 2016, 6, 1153–1158 CrossRef CAS
.
- G. Gupta, K. Scott and M. Mamlouk, J. Power Sources, 2018, 375, 387–396 CrossRef CAS
.
- L. Qiu, T. Ichikawa, A. Hirano, N. Imanishi and Y. Takeda, Solid State Ionics, 2003, 158, 55–65 CrossRef CAS
.
- V. P. Kumar, Y. S. Reddy, P. Kistaiah and C. V. Reddy, Int. J. Mod. Phys. B, 2012, 26, 1250174 CrossRef
.
- J. W. Stevenson, T. R. Armstrong, R. D. Carneim, L. R. Pederson and W. J. Weber, J. Electrochem. Soc., 1996, 143, 2722–2729 CrossRef CAS
.
- P. Li, S. Ouyang, G. Xi, T. Kako and J. Ye, J. Phys. Chem. C, 2012, 116, 7621–7628 CrossRef CAS
.
- Z. Chen, T. A. Tyson, K. H. Ahn, Z. Zhong and J. Hu, J. Magn. Magn. Mater., 2010, 322, 3049–3052 CrossRef CAS
.
- K. T. Lee and A. Manthiram, J. Electrochem. Soc., 2005, 152, A197–A204 CrossRef CAS
.
- R. D. Shannon, Acta Crystallogr., Sect. A: Cryst. Phys., Diffr., Theor. Gen. Crystallogr., 1976, 32, 751–767 CrossRef
.
- K. Vidal, L. M. Rodríguez-Martínez, L. Ortega-San-Martín, E. Díez-Linaza, M. L. Nó, T. Rojo, A. Laresgoiti and M. I. Arriortua, Solid State Ionics, 2007, 178, 1310–1316 CrossRef CAS
.
- X. Cui, S. Li and X. Zhu, Mater. Lett., 2014, 130, 267–270 CrossRef CAS
.
-
I. D. Brown, The Chemical Bond in Inorganic Chemistry: The Bond Valence Model, Oxford University Press, Oxford, 2016 Search PubMed
.
- J. L. Tallon, Phys. C, 1990, 168, 85–90 CrossRef CAS
.
- S. She, J. Yu, W. Tang, Y. Zhu, Y. Chen, J. Sunarso, W. Zhou and Z. Shao, ACS Appl. Mater. Interfaces, 2018, 10, 11715–11721 CrossRef CAS
.
- Z. Shen, Y. Zhuang, W. Li, X. Huang, F. E. Oropeza, E. J. M. Hensen, J. P. Hofmann, M. Cui, A. Tadich, D. Qi, J. Cheng, J. Li and K. H. L. Zhang, J. Mater. Chem. A, 2020, 8, 4407–4415 RSC
.
- A. Grimaud, A. Demortière, M. Saubanère, W. Dachraoui, M. Duchamp, M.-L. Doublet and J.-M. Tarascon, Nat. Energy, 2016, 2, 16189 CrossRef
.
- S. Lütkehoff, M. Neumann and A. Ślebarski, Phys. Rev. B: Condens. Matter Mater. Phys., 1995, 52, 13808–13811 CrossRef
.
- Y. Zhang, K. Han, X. Yin, Z. Fang, Z. Xu and W. Zhu, J. Cryst. Growth, 2009, 311, 3883–3888 CrossRef CAS
.
- L. Yan, R. Yu, G. Liu and X. Xing, Scr. Mater., 2008, 58, 707–710 CrossRef CAS
.
- A. Bianconi, A. Kotani, K. Okada, R. Giorgi, A. Gargano, A. Marcelli and T. Miyahara, Phys. Rev. B: Condens. Matter Mater. Phys., 1988, 38, 3433–3437 CrossRef CAS
.
- F. H. Aragón, I. Gonzalez, J. A. H. Coaquira, P. Hidalgo, H. F. Brito, J. D. Ardisson, W. A. A. Macedo and P. C. Morais, J. Phys. Chem. C, 2015, 119, 8711–8717 CrossRef
.
- H. Ogasawara, A. Kotani, R. Potze, G. A. Sawatzky and B. T. Thole, Phys. Rev. B: Condens. Matter Mater. Phys., 1991, 44, 5465–5469 CrossRef CAS
.
- M. I. Sosulnikov and Y. A. Teterin, J. Electron Spectrosc. Relat. Phenom., 1992, 59, 111–126 CrossRef CAS
.
- M. S. Naughton, F. R. Brushett and P. J. A. Kenis, J. Power Sources, 2011, 196, 1762–1768 CrossRef CAS
.
- P. Nachimuthu, Y. J. Kim, S. V. N. T. Kuchibhatla, Z. Q. Yu, W. Jiang, M. H. Engelhard, V. Shutthanandan, J. Szanyi and S. Thevuthasan, J. Phys. Chem. C, 2009, 113, 14324–14328 CrossRef CAS
.
- A. P. Grosvenor, B. A. Kobe, M. C. Biesinger and N. S. McIntyre, Surf. Interface Anal., 2004, 36, 1564–1574 CrossRef CAS
.
- J. Kim, X. Yin, K.-C. Tsao, S. Fang and H. Yang, J. Am. Chem. Soc., 2014, 136, 14646–14649 CrossRef CAS
.
- M. Islam, M.-G. Jeong, I.-H. Oh, K.-W. Nam and H.-G. Jung, J. Ind. Eng. Chem., 2020, 85, 94–101 CrossRef CAS
.
- J. Bak, H. Bin Bae and S.-Y. Chung, Nat. Commun., 2019, 10, 2713 CrossRef
.
- Z. Li, L. Lv, J. Wang, X. Ao, Y. Ruan, D. Zha, G. Hong, Q. Wu, Y. Lan, C. Wang, J. Jiang and M. Liu, Nano Energy, 2018, 47, 199–209 CrossRef CAS
.
- A. Ashok, A. Kumar, J. Ponraj, S. A. Mansour and F. Tarlochan, Catal. Today, 2020 DOI:10.1016/j.cattod.2020.05.065
.
- K. Nishio, S. Molla, T. Okugaki, S. Nakanishi, I. Nitta and Y. Kotani, J. Power Sources, 2015, 298, 236–240 CrossRef CAS
.
- J. Kim, X. Chen, P.-C. Shih and H. Yang, ACS Sustainable Chem. Eng., 2017, 5, 10910–10917 CrossRef CAS
.
- T. Shinagawa, A. T. Garcia-Esparza and K. Takanabe, Sci. Rep., 2015, 5, 13801 CrossRef
.
- D. U. Lee, P. Xu, Z. P. Cano, A. G. Kashkooli, M. G. Park and Z. Chen, J. Mater. Chem. A, 2016, 4, 7107–7134 RSC
.
- K. Lopez, G. Park, H. J. Sun, J. C. An, S. Eom and J. Shim, J. Appl. Electrochem., 2015, 45, 313–323 CrossRef CAS
.
- M. Risch, A. Grimaud, K. J. May, K. A. Stoerzinger, T. J. Chen, A. N. Mansour and Y. Shao-Horn, J. Phys. Chem. C, 2013, 117, 8628 CrossRef CAS
.
Footnote |
| † Electronic supplementary information (ESI) available. CCDC 2000160–2000165. For ESI and crystallographic data in CIF or other electronic format see DOI: 10.1039/d0se01278e |
| This journal is © The Royal Society of Chemistry 2021 |

