Boosting the sodium storage of the 1T/2H MoS2@SnO2 heterostructure via a fast surface redox reaction†
Dayong
Gui
,
Zhijie
Wei
,
Jian
Chen
,
Liwei
Yan
,
Jun
Li
,
Peixin
Zhang
 and
Chenyang
Zhao
 *
*
College of Chemistry and Environmental Engineering, Shenzhen University, Shenzhen 518071, China. E-mail: cyzhao@szu.edu.cn
First published on 7th December 2020
Abstract
The sluggish kinetics and large volume expansion arising from the large ionic radius of Na+ remain elusive weaknesses of sodium ion batteries (SIBs). Here, we report a transition from bulk diffusion to surface-dominant pseudocapacitive charge storage by nanoscaling and heterostructuring, which enables fast and stable charge storage kinetics for SIBs. An electronic attraction induced self-assembly strategy was developed for the synthesis of the 1T/2H MoS2@SnO2 heterostructure. Ultrasmall SnO2 nanoparticles with a low crystallinity were uniformly distributed on the basal plane of MoS2. The intercalated SnO2 serves as an interfacial pillar to restrict the restacking of MoS2 nanosheets, whereas dual-phase 1T/2H MoS2 provides a continuous network for efficient charge transfer and restrains the aggregation of NaxSn. As a result, the 1T/2H MoS2@SnO2 heterostructure exhibits a higher specific capacity (626 mA h g−1 at 0.1 A g−1), and superior cycling and rate capabilities (262 mA h g−1 at 2 A g−1 for 500 cycles) compared to the raw MoS2 and 2H MoS2@SnO2 counterparts. Electrochemical kinetics analyses reveal that the charge transfer kinetics are boosted by the synergistic effect between the 1T/2H MoS2 and SnO2 nanoparticles. Quantitative examination into the origin demonstrated that the Na+ storage is dominated by the fast surface redox reaction, which endows the heterostructure with a durable high rate capability.
Introduction
Currently, lithium-ion batteries (LIBs) dominate in the field of consumer electronics owing to their inherent superiorities such as high energy density and long cycle life.1–4 The limited reserves of lithium, however, cannot meet the increasing global demand for portable energy storage. As a homologous element to lithium, sodium has similar physical and chemical properties to those of lithium and is abundant on the earth. Therefore, sodium-ion batteries (SIBs) are considered to be the most suitable alternatives to LIBs, especially for large-scale energy storage.5,6 Compared to Li+, however, Na+ possesses a larger ionic radius (1.02 Å for Na+vs. 0.76 Å for Li+) and higher redox potentials (0.33 V vs. Li+/Li), which result in a high energy barrier and sluggish reaction kinetics for Na+ insertion and diffusion.7,8 For instance, the commercial LIB anode, graphite, is almost inactive for sodium storage. So far, the development of SIBs lags far behind that of the LIBs. The key issue is the lack of high-performance anode materials with a highly reversable capacity and long cycle life.Alloying-type materials are suggested as promising anodes for SIBs because of their considerably higher theoretical capacities and low operating potentials. Among them, tin oxide (SnO2) is environmentally friendly and rich in resources, and thus has attracted significant attention. SnO2 can uptake 7.75 Na+ per formula in the full sodiation state (Na15Sn4), which gives an initial specific capacity as high as 782 mA h g−1.9–11
| SnO2 + 4Na+ + 4e− → Sn + 2Na2O | (1) |
| 4Sn + 15Na+ + 15e− ↔ Na15Sn4 | (2) |
However, SnO2 suffers from a large volume expansion (∼400%) during the alloying–dealloying process. This continuous volumetric change induces mechanical stress inside the SnO2 particles, and ultimately leads to structural failure and pulverization.12 Additionally, owing to the large ionic radius of Na+, the diffusion of Na+ within the SnO2 lattice is restricted, resulting in a significant loss of capacity at high current densities. Downsizing the SnO2 particle size to the nanoscale (less than 10 nm) is an effective strategy to accommodate the volume expansion and mitigate mechanical stress. Furthermore, the ultrasmall size of the nanoparticle reduces the diffusion length of Na+ and improves the rate capability.13,14 So far, carbon materials have been extensively studied as a crucial component to confine the particle size of SnO2 and accommodate the volumetric change.15,16 However, the addition of carbon reduces the specific capacity of the anode and the particle size of SnO2 can only be reduced to 10 nm because of their poor compatibility.
Two-dimensional (2D) nanomaterials have been reported to exhibit a surface-dominant phenomena owing to their unique structural features.17–20 Molybdenum disulfide (MoS2), a transition metal dichalcogenide, possesses a 2D layered structure, similar to that of graphite. The S–Mo–S trilayers are held together through weak van der Waals forces with an interlayer distance of 0.62 nm. These structural features allow storage of multiple charges through the intercalation and/or conversion reactions.21,22 Moreover, the MoS2 monolayer exhibits a high Young's modulus of 230 GPa.23 This inherent strong mechanical strength makes MoS2 nanosheets flexible and they can accommodate the large volumetric change of metal oxides such as SnO2.24 However, the basal plane of MoS2 has a lack of active sites for the decoration of SnO2. Furthermore, the bare MoS2 nanosheets tend to restack during the charge/discharge process, leading to a decay in the electrochemical activity.
With the aim of overcoming the weaknesses of any single component, in this work, we report a charge-induced self-assembly strategy to fabricate a 1T/2H MoS2@SnO2 heterostructure to synergistically enhance the charge transfer kinetics for sodium storage. In order to effectively restrict the particle size of SnO2, the MoS2 nanosheets were first activated by chemical exfoliation. The Sn2+ was then absorbed on the negatively charged MoS2 nanosheets and converted in situ to SnO2. Owing to the abundant absorption sites, SnO2 particles with a low crystallinity and ultrasmall particle size were obtained, which served as interfacial linkers to connect MoS2 nanosheets and prevent their restacking. The dual-phase 1T/2H MoS2 nanosheets, on the other hand, served as the substrate and buffered the volume change of SnO2. The MoS2 nanosheets combined with ultrasmall SnO2 particles provide fast surface redox sites, which boosts the charge transfer kinetics and leads to the transition from bulk diffusion to pseudocapacitive charge storage, as revealed by quantitative analysis. As a result, the 1T/2H MoS2@SnO2 exhibits a high reversible capacity (626 mA h g−1 at 0.1 A g−1) and excellent high-rate durability (262.2 mA h g−1 after 500 cycles at 2 A g−1) when applied as the anode for SIBs.
Experimental section
Preparation of the exfoliated MoS2
The MoS2 was exfoliated through a lithium intercalation–exfoliation method that has been reported previously.25 Typically, 0.5 g MoS2 powder was immerged in 5 ml n-butyllithium solution (1.6 M in n-hexane) and stirred for 3 d in a glovebox. The Li-intercalated MoS2 (LixMoS2) was then centrifuged and washed with hexane several times to remove the redundant butyllithium and organic residues. The obtained LixMoS2 was exfoliated in 200 ml deionized water with the assistance of ultrasonication. The exfoliated MoS2 nanosheets were isolated by centrifugation and re-dispersed in 100 ml ethyl alcohol and kept in reserve.Preparation of 1T/2H MoS2@SnO2 heterostructure
Typically, 0.5 g SnCl2·2H2O was dissolved in 20 ml ethyl alcohol. The solution was added dropwise into the MoS2 suspension with gentle stirring overnight. The precipitate (Sn2+ intercalated MoS2) was centrifuged and washed with ethyl alcohol several times to remove the residual Sn2+. After drying at 100 °C in an oven, the product obtained was mixed with graphene with a mass ratio of 10![[thin space (1/6-em)]](https://www.rsc.org/images/entities/char_2009.gif) :
:![[thin space (1/6-em)]](https://www.rsc.org/images/entities/char_2009.gif) 1, followed by grinding in an agate mortar for 20 min. The final product was denoted as 1T/2H MoS2@SnO2. For comparison, the 2H MoS2@SnO2 was also prepared using the same procedure except that the precipitate obtained was further annealed at 300 °C for 3 h under an argon atmosphere.
1, followed by grinding in an agate mortar for 20 min. The final product was denoted as 1T/2H MoS2@SnO2. For comparison, the 2H MoS2@SnO2 was also prepared using the same procedure except that the precipitate obtained was further annealed at 300 °C for 3 h under an argon atmosphere.
Material characterization
The crystal structures of the samples were investigated by X-ray diffraction (XRD, PANalytical, Empyrean) with Cu-Kα radiation at a scanning rate of 0.02° s−1. Raman spectra were obtained on a Raman spectrometer (Renishaw, inVia) with a 532 nm diode-pumped solid-state laser. The morphology of the samples was investigated using field-emission scanning electron microscopy (FE-SEM, JSM-7800F) and high resolution transmission electron microscopy (HRTEM, FEI Tecnai G2 F30). The chemical compositions and surface element states were studied using X-ray photoelectron spectroscopy (XPS, Thermo Fisher Scientific) with an Al Kα X-ray source (1486.6 eV). Thermogravimetric analysis (TGA) was conducted on a thermogravimetric analyser (NETZSCH, STA409PC) between room temperature and 1000 °C in air with a heating rate of 10 °C min−1.Electrochemical measurements
First, 1T/2H MoS2@SnO2, acetylene black and polyvinylidene fluoride (PVDF) were stirred to give a slurry with a mass ratio of 8![[thin space (1/6-em)]](https://www.rsc.org/images/entities/char_2009.gif) :
:![[thin space (1/6-em)]](https://www.rsc.org/images/entities/char_2009.gif) 1
1![[thin space (1/6-em)]](https://www.rsc.org/images/entities/char_2009.gif) :
:![[thin space (1/6-em)]](https://www.rsc.org/images/entities/char_2009.gif) 1 in N-methyl-2-pyrrolidone (NMP). The resultant slurry was cast onto copper foil, and dried in a vacuum oven at 100 °C overnight. Subsequently, the electrodes were punched into 12 mm diameter disks, and the mass loading of the active material was about 1.2 mg. The CR2032 coin-type cells were assembled in an argon-filled glovebox (MBraun, Inc.) with a H2O and O2 content of less than 0.1 ppm. 1 M NaPF6 in ethylene carbonate/dimethyl carbonate (EC/DEC = 1
1 in N-methyl-2-pyrrolidone (NMP). The resultant slurry was cast onto copper foil, and dried in a vacuum oven at 100 °C overnight. Subsequently, the electrodes were punched into 12 mm diameter disks, and the mass loading of the active material was about 1.2 mg. The CR2032 coin-type cells were assembled in an argon-filled glovebox (MBraun, Inc.) with a H2O and O2 content of less than 0.1 ppm. 1 M NaPF6 in ethylene carbonate/dimethyl carbonate (EC/DEC = 1![[thin space (1/6-em)]](https://www.rsc.org/images/entities/char_2009.gif) :
:![[thin space (1/6-em)]](https://www.rsc.org/images/entities/char_2009.gif) 1 vol%) with 5 vol% fluoroethylene carbonate (FEC) as an additive was used as the electrolyte. Home-made Na foils were used as the counter electrode and the commercial Celgard 2500 film was employed as the separator. The fresh cells were tested between 0.01 and 3.0 V (vs. Na+/Na) via a multichannel Land battery testing system. Cyclic voltammetry (CV) tests were conducted on an IVIUMNSTAT electrochemical workstation between 0.01 and 3.0 V versus Na+/Na with the stated scan rates. The electrochemical impedance spectrum (EIS) was measured at the open circuit potential with an amplitude of 10 mV over the frequency range of 100 kHz to 10 mHz. For the full-cell test, commercial Na3V2(PO4)3 (NVP) was used as the cathode. The cell was cycled between 0.5 and 3.5 V at 0.5 A g−1. The capacity was calculated based on the weight of the anode.
1 vol%) with 5 vol% fluoroethylene carbonate (FEC) as an additive was used as the electrolyte. Home-made Na foils were used as the counter electrode and the commercial Celgard 2500 film was employed as the separator. The fresh cells were tested between 0.01 and 3.0 V (vs. Na+/Na) via a multichannel Land battery testing system. Cyclic voltammetry (CV) tests were conducted on an IVIUMNSTAT electrochemical workstation between 0.01 and 3.0 V versus Na+/Na with the stated scan rates. The electrochemical impedance spectrum (EIS) was measured at the open circuit potential with an amplitude of 10 mV over the frequency range of 100 kHz to 10 mHz. For the full-cell test, commercial Na3V2(PO4)3 (NVP) was used as the cathode. The cell was cycled between 0.5 and 3.5 V at 0.5 A g−1. The capacity was calculated based on the weight of the anode.
Results and discussion
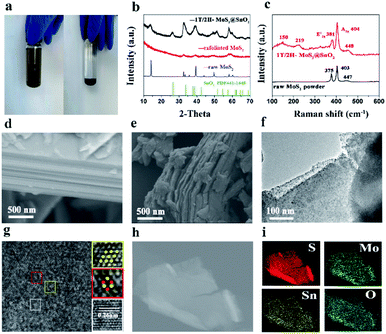
The 1T/2H MoS2@SnO2 was prepared through a charge-induced self-assembly strategy. The synthesis procedure is illustrated in Fig. 1a. First, bulk MoS2 was chemically exfoliated to activate the surface sites on the basal plane. The Li ions were intercalated into the van der Waals gap of MoS2 owing to its weak interlayer interaction, causing an expansion of the interlayer spacing. Meanwhile, the thermodynamically stable 2H-MoS2 underwent a first-stage phase transition to the metastable 1T phase accompanied by the sliding and ordering of the S–Mo–S layers (Fig. 1b).25 Once in contact with water, the intercalated Li was oxidized and the H2 produced pushed the MoS2 layers apart, forming a tawny suspension of the MoS2 monolayers (Fig. 2a). The exfoliated MoS2 nanosheets were negatively charged owing to the electron transfer between butyllithium and MoS2.26,27 As a result, the suspension was stable over a week without restacking. The ethyl alcohol solution of SnCl2 was then added dropwise. The positively charged Sn2+ was absorbed on the basal plane of MoS2 owing to the electrostatic attraction. This neutralization of the surface charges caused a flocculation of the suspension (Fig. 2a). Post-treatment, the SnO2 nanoparticles that were formed in situ were anchored on the surface of the MoS2 nanosheets, forming the 1T/2H MoS2@SnO2 heterostructure.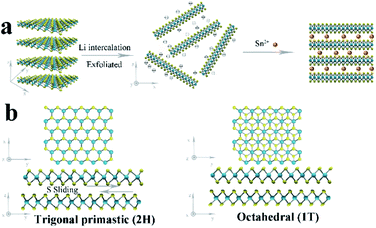 | ||
| Fig. 1 (a) Schematic illustration of the charge-induced self-assembly process for 1T/2H MoS2@SnO2. (b) Crystal structures and phase transition of 2H to 1T MoS2 from the top and side views. | ||
The self-assembly process and formation of the 1T/2H MoS2@SnO2 heterostructure was monitored by XRD. As shown in Fig. 2b, the XRD pattern of raw MoS2 exhibits distinct peaks at 14.4°, 32.7°, 39.6°, 49.8° and 58.4°, corresponding to the (002), (100), (103), (105) and (110) planes of hexagonal 2H MoS2, respectively. All of the peaks disappeared after the Li+ intercalation and exfoliation, indicating the formation of single-layered MoS2. The randomly arranged MoS2 single-layers converted to an order pillared structure when the Sn2+ was added, as reflected by the two peaks that emerged at 6.5° and 12.5° which correspond to the (001) and (002) reflections of SnxMoS2, respectively (Fig. S1†). The XRD pattern of SnxMoS2 is similar to that of LixMoS2, indicating the existence of a water bilayer.27,28 During the drying process, Sn2+ was in situ hydrolysed and oxidized to SnO2, as confirmed by the following TEM and XPS results. The MoS2 monolayers were rearranged to nanosheets as a result of the removal of the absorbed Sn2+. The (002) peak shifts to a lower angle compared to that of raw 2H MoS2, indicating an expansion of the interlayer distance. This expansion increases the surface defective sites and is beneficial for the insertion and diffusion of Na+.25 Moreover, the peak intensities of MoS2 are also sharply decreased compared with that of raw MoS2. This could be ascribed to the decoration of SnO2 on the surface of MoS2, which hinders its restacking during the self-assembly process. The existence of SnO2 is also confirmed by XRD. The diffraction peak at 26.6° corresponds to the (110) crystal planes of SnO2 (PDF#41-1445), while the other characteristic peaks of SnO2 are not well distinguished. The crystallinity and size of SnO2 are extremely restricted as a result of the abundant active sites on MoS2. It is reported that a decrease in the crystallinity of SnO2 reduces the energy barrier for Na+ diffusion and is beneficial for sodium storage of SnO2 owing to its intrinsically isotropic nature.29
The Raman spectra of raw MoS2 and 1T/2H MoS2@SnO2 are shown in Fig. 2c. Typical in-plane (E12g) and out-of-plane (A1g) vibration peaks of MoS2 are observed for both samples. For the 1T/2H MoS2@SnO2, two additional peaks appear at 150 and 219 cm−1, which correspond to the J1 and J2 mode of 1T MoS2, respectively.22,30 The peak position of E12g shifts from 375 to 381 cm−1, indicating the few-layered structure of the MoS2 substrate.31 Therefore, the Raman results confirm the existence of the 1T/2H MoS2 nanosheets. The J1 and J2 modes disappear after calcination, showing a phase transformation from 1T to 2H (Fig. S2†). The morphology of 1T/2H MoS2@SnO2 was studied using FESEM. As shown in Fig. 2d and S3,† the raw MoS2 shows an inherent flat surface and orderly stacked layer structure, while the MoS2 nanosheets become wrinkled and their size is significantly reduced after the exfoliation and self-assembly process. However, the typical layered-structure is still maintained as can be seen from the cross-section view (Fig. 2e). The microstructure of the 1T/2H MoS2@SnO2 was further examined using TEM. Fig. 2f shows a typical image of 1T/2H MoS2@SnO2 with approximately two layers. Owing to the abundant absorption sites on the exfoliated MoS2, numerous SnO2 nanoparticles (dark spots) are homogeneously dispersed on the MoS2 nanosheets without agglomeration. The size of the SnO2 was successfully confined to 5–10 nm. The ultrasmall size of SnO2 ensures sufficient contact with the electrolyte and shortens the diffusion length of Na+, which increases the activity of the surface redox storage of Na+.12 The HRTEM image (Fig. 2g) reveals the tight contact between SnO2 nanoparticles and the MoS2 substrate. The abundant hetero-interface created may act as active sites for fast Na+ storage.32 Two different atomic arrangements, the honeycomb and parallelogram, can be observed, corresponding to the 2H and 1T polymorphs of MoS2, respectively. The lattice fringe with d = 0.26 nm corresponds to the (101) plane of rutile SnO2. For comparison, the XRD pattern and structure of the 2H.
MoS2@SnO2 are shown in Fig. S4.† As indicated from the XRD pattern, the MoS2 nanosheets restack together and the interlayer distance shrinks to 0.62 nm. Compared to 1T/2H MoS2@SnO2, SnO2 with a high crystallinity is found on the surface of MoS2. The SnO2 nanoparticles move and cluster together to minimize the surface energy under heat, causing a phase separation from the MoS2 substrate. The lattice fringes were measured and found to be 0.26 and 0.34 nm, corresponding to the (101) and (110) planes of the SnO2, respectively. The energy dispersive X-ray (EDX) and elemental mapping analyses of the 1H/MoS2@SnO2 are shown in Fig. 2h and i and S5.† Elements of S, Mo, Sn and O were detected, which were uniformly distributed throughout the sample. The weight percentages of SnO2 in 1T/2H MoS2@SnO2 were determined by TGA (Fig. S6†). The mass ratio of SnO2, MoS2 and graphene is around 6![[thin space (1/6-em)]](https://www.rsc.org/images/entities/char_2009.gif) :
:![[thin space (1/6-em)]](https://www.rsc.org/images/entities/char_2009.gif) 4
4![[thin space (1/6-em)]](https://www.rsc.org/images/entities/char_2009.gif) :
:![[thin space (1/6-em)]](https://www.rsc.org/images/entities/char_2009.gif) 1.
1.
XPS analysis was then conducted to further investigate the compositions and binding states of each element. Fig. 3a shows the survey spectrum of the 1T/2H MoS2@SnO2. Five elements of C, O, Mo, S and Sn were detected without impurities, which is consistent with the EDS results. Fig. 3b–d shows the high resolution XPS spectra of Sn 3d, Mo 3d and S 2p, respectively. Two peaks corresponding to the 3d5/2 and 3d3/2 of Sn4+ were observed at around 487.1 and 495.2 eV, showing the Sn atoms are in the form of SnO2.12,29 In the Mo 3d region, both the 2H and 1T phases of MoS2 can be identified. The binding energies of Mo 3d5/2 and 3d3/2 of the 1T phase are 231.1 and 228.1 eV respectively, which are approximately 1.2 eV lower than their 2H counterparts. The XPS S 2p spectrum of 1T/2H MoS2@SnO2 is shown in Fig. 3d. Similarly, the peaks located at 161.2 and 162.2 eV can be assigned to the S 2p3/2 and S 2p1/2 of 1T MoS2 respectively, while the binding energies of S2− in the 2H phase are 0.8 eV higher.27,33,34 According to the XPS peak deconvolution, the relative fraction of 1T phase in 1T/2H MoS2@SnO2 is 53.4%. As the 1T phase MoS2 is 107 times more conductive than the 2H phase, the retained metallic 1T phase greatly enhances the conductivity of the composites.17,30,35 In contrast, the XPS spectrum of 2H MoS2@SnO2 is shown in Fig. S7.† Only two peaks located at 229.3 and 232.3 eV are observed in the Mo 3d region, corresponding to the Mo 3d5/2 and 3d3/2 of the 2H phase, respectively.
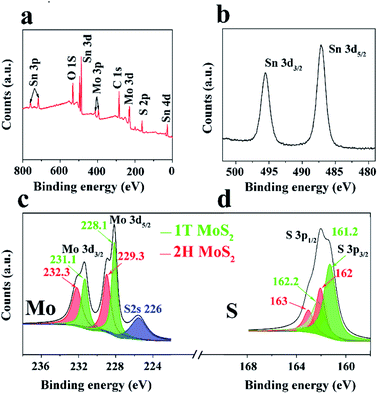 | ||
| Fig. 3 (a) XPS survey spectrum, high resolution XPS spectra of (b) Sn 3d, (c) Mo 3d, and (d) S 2p of 1T/2H MoS2@SnO2. | ||
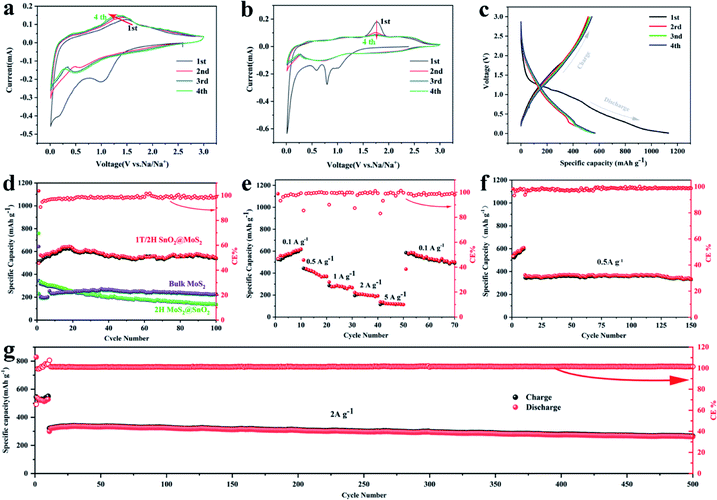
The electrochemical performances of the 1T/2H MoS2@SnO2 as an anode material for SIBs were then investigated. The CV test was first conducted to gain a deep insight into the sodiation/desodiation mechanism of the 1T/2H MoS2@SnO2 (Fig. 4a). In the cathodic process, the reduction peak at about 1.02 V is attributed to the reduction of SnO2 to Sn and the formation of a solid electrolyte interphase (SEI).36,37 The peak at 0.55 V corresponds to the conversion reaction of MoS2 to Na2S/Mo, while the peak below 0.5 V represents the multistep alloying of Sn with Na+ that forms NaxSn. During the anodic scan, a broad oxidation peak ranging from 0.25 to 0.65 V can be assigned to the stepwise de-alloying reactions of NaxSn,36,38 while the peak that emerges at 1.6 V is attributed to the desodiation process of Na2S. The oxidized peak at 1.6 V gradually shifts to a lower potential in the subsequent cycles, indicating the reduced polarization owing to the enhanced interfacial activity and electron transport kinetics. The CV curves are almost coincident after the first cycle, showing an excellent cycling stability. In contrast, two sharp cathodic peaks appear at around 0.79 and 0.59 V for 2H MoS2@SnO2 and bulk MoS2, which correspond to the intercalation of Na+ into the band gap of MoS2, accompanied by a phase change from 2H to 1T (Fig. 4b and S8†).39,40 The absence of a peak at 0.79 V for 1T/2H MoS2@SnO2 indicates the reduced diffusion kinetics of Na+ owing to the expanded interlayer spacing and the existence of the 1T phase. In the anodic process, a higher oxidation peak of 1.76 V is observed for 2H MoS2@SnO2, indicating high polarization. The charge–discharge reactions of bulk MoS2 are not stabilized, even after five cycles, further elucidating the synergistic effect between the MoS2 nanosheets and SnO2 nanoparticles on the electrochemical properties. Furthermore, compared with raw MoS2 and 2H MoS2@SnO2, the CV curves of 1T/2H MoS2@SnO2 show an inconspicuous conversion and broadening of the peaks. This can be attributed to its surface dominant nature that results from the small particle size and tight contact in the hetero-interface.29 The charge/discharge profiles of 1T/2H MoS2@SnO2 for the first four cycles are shown in Fig. 4c. No obvious potential plateau can be observed, which is consistent with the CV results.
The electrochemical performances of the 1T/2H MoS2@SnO2 are shown in Fig. 4d–g. The specific capacities of 1T/2H MoS2@SnO2 in the first discharge/charge are 1130/516 mA h g−1, respectively. The large capacity loss mainly comes from the irreversible reaction between SnO2 to Sn, the formation of the SEI layer and the conversion between MoS2 and Mo/Na2S.12,41 In subsequent cycles, the coulombic efficiency (CE) quickly stabilizes to approximately 100%. A maximum reversible capacity of 626 mA h g−1 is reached at the 20th cycle, which could be attributed to the activation of the heterostructure during cycling. The reversible capacity is maintained above 537 mA h g−1 at the 100th cycle, which is superior to that of raw MoS2, 2H MoS2@SnO2 and exfoliated MoS2 (Fig. 4d and S9†), demonstrating the synergistic effect between the ultrasmall SnO2 nanoparticles and dual-phased MoS2 nanosheets. For the raw MoS2, a very low initial reversible capacity of 231 mA h g−1 was obtained with a CE of 35.9% due to the low electrical conductivity of 2H MoS2, while the 2H MoS2@SnO2 delivers an initial reversible capacity of 335 mA h g−1 with a CE of 45.4%. However, the capacity of 2H MoS2@SnO2 quickly decays to 138 mA h g−1 after 100 cycles, which could be ascribed to the aggregation of SnO2, the phase transition of the 1T to 2H phase and the restacking of the MoS2 layers. The relative concentrated SnO2 causes a drastic local volume expansion and a higher barrier at the SnO2 and 2H MoS2 interface, causing sluggish Na+ transport. In addition, the 1T/2H MoS2@SnO2 exhibits an excellent rate capability (Fig. 4e). The reversible capacities at 0.1, 0.5, 1, 2, and 5 A g−1 are 525, 444, 287, 195 and 114 mA h g−1, respectively. When the current density rebounds to 0.1 A g−1, a highly reversible capacity of 586 mA h g−1 is obtained, indicating a robust structure for sodium storage. The high-rate cycling performance of 1T/2H MoS2@SnO2 is presented in Fig. 4f and g. In the initial ten cycles, a low current density of 0.05 A g−1 is applied to generate a dense stable SEI film. The current density is then switched to 0.5 A g−1 or 2 A g−1. The high reversible capacity of 262 mA h g−1 is retained after 500 cycles at 2 A g−1 with a capacity retention of 81.8%, showing an excellent high-rate stability. To further verify the durability and high rate behaviour, the structural evolution of 1T/2H MoS2@SnO2 during cycling was characterised using FE-SEM (Fig. S10†) and TEM (Fig. 5). Fig. 5a and b shows the morphology of 1T/2H MoS2@SnO2 at different resolutions after the first cycle. The crystal lattice becomes indistinct owing to the formation of the SEI layer and the nano-size effect. The Sn nanoparticles, as indicated by the yellow cycles, are uniformly distributed on the substrate without agglomeration. Notably, an imperceptible lattice fringe of SnO2 also appears, which may come from the oxidation of Sn during the repeated washing and drying processes. The elemental mapping shows good dispersion of Mo, S, Sn and O (Fig. 5c). After 10 cycles, the morphology is maintained and found to be almost the same (Fig. 5d–f), illustrating the excellent structural stability of the electrode. The electrochemical performance of T/2H MoS2@SnO2 was compared with those of previously reported state-of-the-art anode materials, such as dual phase MoS2, 1T MoS2 and some other hybrid composites.18,36,42–45 As shown in Table S1,† the superior performances of the 1T/2H MoS2@SnO2 demonstrate the importance of the synergistic effect between SnO2 and MoS2.
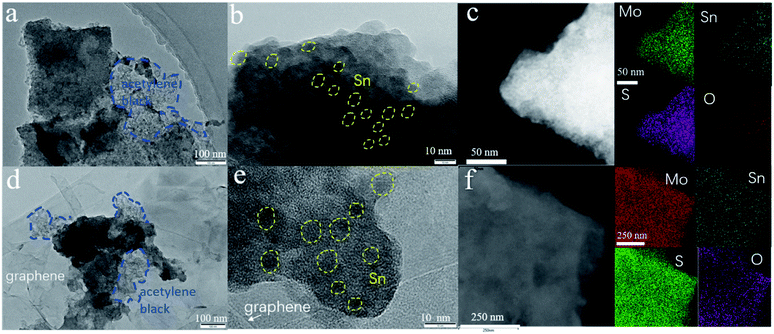 | ||
| Fig. 5 TEM images and the corresponding elemental mappings of the anodes after (a)–(c) the first and (d)–(f) the 10th cycle. | ||
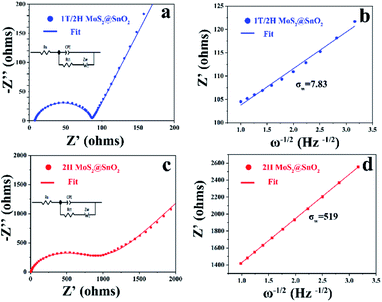
To validate the advantages of the heterostructure, the reaction kinetics of 1T/2H MoS2@SnO2 were first investigated using EIS. As shown in Fig. 6, both 1T/2H MoS2@SnO2 and 2H MoS2@SnO2 exhibit similar impedance patterns. The compressed semicircle in the high and medium frequency region corresponds to the charge transfer impedance (Rct) at the electrode–electrolyte interface, while the straight line in the low-frequency region is associated with Warburg behaviour, which originates from the diffusion of Na+ in the electrode. Obviously, the 1T/2H MoS2@SnO2 has a much lower Rct (87 Ω) compared to 2H MoS2@SnO2 (593 Ω), showing the enhanced charge storage kinetics of the heterostructure. The apparent Na+ transfer coefficient was then calculated based on the following equations:29,46
| DNa+ = R2T2/2n4F4σw2A2C2 | (3) |
| Z′ = R + σwω−1/2 | (4) |
![[thin space (1/6-em)]](https://www.rsc.org/images/entities/char_2009.gif) 485 C mol−1), the surface area of the electrode (1.13 cm2), the Na+ concentration in the electrode material (1 M) and the Warburg coefficient, respectively. As the σw is the slope of the real part of the impedance (Z′) as a function of the inverse square root of the angular frequency (ω−1/2), the apparent sodium diffusion coefficient of 1T/2H MoS2@SnO2 was then calculated and found to be 2.4 × 10⁻¹⁶ cm2 s−1, which is approximately 104 times higher than that of 2H MoS2@SnO2. These enhanced charge transfer kinetics highlight the synergistic effects between the dual phased 1T/2H MoS2 nanosheets and well-dispersed SnO2 nanoparticles.
485 C mol−1), the surface area of the electrode (1.13 cm2), the Na+ concentration in the electrode material (1 M) and the Warburg coefficient, respectively. As the σw is the slope of the real part of the impedance (Z′) as a function of the inverse square root of the angular frequency (ω−1/2), the apparent sodium diffusion coefficient of 1T/2H MoS2@SnO2 was then calculated and found to be 2.4 × 10⁻¹⁶ cm2 s−1, which is approximately 104 times higher than that of 2H MoS2@SnO2. These enhanced charge transfer kinetics highlight the synergistic effects between the dual phased 1T/2H MoS2 nanosheets and well-dispersed SnO2 nanoparticles.
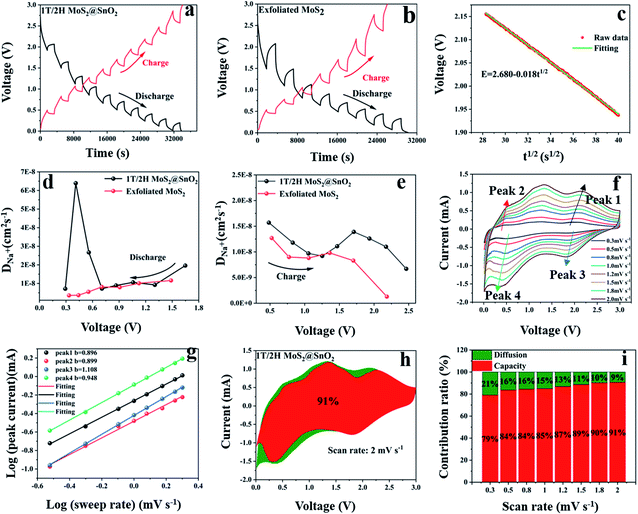
The galvanostatic intermittent titration technique (GITT) test was then performed to evaluate the change in the Na+ diffusion coefficient during sodiation/desodiation to gain a thorough insight into the dynamic Na+ storage behaviour of 1T/2H MoS2@SnO2.4,47 The test was carried out with a pulse current of 0.1 A g−1 and a time interval of 30 min after 10 cycles. Typical GITT curves of the 1T/2H MoS2@SnO2 and the exfoliated MoS2 are shown in Fig. 7a and b. The V and t1/2 show a good linear relationship (Fig. 7c). As a result, the equation can be simplified by introducing Fick's law (t = L2/2D):
 | (5) |
| i(v) = k1v + k2v1/2 | (6) |
Considering the impressive performance in half-cells, the practical application of the 1T/2H MoS2@SnO2 electrode in a Na+ full cell was further confirmed by pairing it with a commercial NVP cathode. The XRD pattern and SEM image of the NVP are shown in Fig. S12.† The anode was first pre-sodiated at 0.1 A g−1 using Na foil as a counter electrode. The mass ratio of the cathode and anode was confined at 5![[thin space (1/6-em)]](https://www.rsc.org/images/entities/char_2009.gif) :
:![[thin space (1/6-em)]](https://www.rsc.org/images/entities/char_2009.gif) 1. The full cell delivers a high reversible capacity of 313 mA h g−1 in the first cycle. The reversible capacity of 248 mA h g−1 can be maintained after 30 cycles at 0.5 A g−1 (Fig. S13b†). The slight fading observed may be caused by the large internal resistance of the 2032-type cell. The charge–discharge curves of the 1st, 10th and 30th cycles are shown in Fig. S13c.† The 1T/2H MoS2@SnO2//NVP Na+ full cell can light a small lamp, further demonstrating the practicability of the 1T/2H MoS2@SnO2 anode for sodium storage (Fig. S13d†).
1. The full cell delivers a high reversible capacity of 313 mA h g−1 in the first cycle. The reversible capacity of 248 mA h g−1 can be maintained after 30 cycles at 0.5 A g−1 (Fig. S13b†). The slight fading observed may be caused by the large internal resistance of the 2032-type cell. The charge–discharge curves of the 1st, 10th and 30th cycles are shown in Fig. S13c.† The 1T/2H MoS2@SnO2//NVP Na+ full cell can light a small lamp, further demonstrating the practicability of the 1T/2H MoS2@SnO2 anode for sodium storage (Fig. S13d†).
Conclusions
In summary, a 1T/2H MoS2@SnO2 heterostructure was successfully prepared via a surface charge-induced self-assembly process and used as an anode in SIBs. By measuring the electrokinetic parameters, we observed a transition from sluggish diffusion to the fast surface redox storage of Na+, which originates from the synergistic effects between dual phased 1T/2H MoS2 nanosheets and well-dispersed SnO2 nanoparticles. As a result, the 1T/2H MoS2@SnO2 delivers an improved cycling stability and superior rate capability compared to that of raw MoS2 and 2H MoS2@SnO2. The reversible capacity of 1T/2H MoS2@SnO2 remains at 537 mA h g−1 after 100 cycles at 0.1 A g−1 and 262 mA h g−1 after 500 cycles at a high rate of 2 A g−1. This surface-dominant phenomenon provides a promising strategy for optimizing the structure and properties of SIBs.Conflicts of interest
There are no conflicts to declare.Acknowledgements
The authors are grateful for financial support from the National Natural Science Foundation of China (51904191), and the Natural Science Foundation of Guangdong province (2018A030310499).Notes and references
- M. Armand and J. M. Tarascon, Nature, 2008, 451, 652–657 CrossRef CAS PubMed
.
- M. D. Slater, D. Kim, E. Lee and C. S. Johnson, Adv. Funct. Mater., 2013, 23, 947–958 CrossRef CAS
.
- B. L. Ellis and L. F. Nazar, Curr. Opin. Colloid Interface Sci., 2012, 16, 168–177 CAS
.
- Y. Wang, Y. Zhang, J. Shi, A. Pan, F. Jiang, S. Liang and G. Cao, J. Mater. Chem. A, 2018, 6, 18286–18292 RSC
.
- J. Wang, C. Luo, T. Gao, A. Langrock, A. C. Mignerey and C. Wang, Small, 2015, 11, 473–481 CrossRef CAS
.
- X. Xie, T. Makaryan, M. Zhao, K. L. Van Aken, Y. Gogotsi and G. Wang, Adv. Energy Mater., 2016, 6, 1502161 CrossRef
.
- C. Zhao, J. Kong, X. Yao, X. Tang, Y. Dong, S. L. Phua and X. Lu, ACS Appl. Mater. Interfaces, 2014, 6, 6392–6398 CrossRef CAS
.
- Z. Hu, Q. Liu, S. L. Chou and S. X. Dou, Adv. Mater., 2017, 29, 1700606 CrossRef PubMed
.
- L. D. Ellis, T. D. Hatchard and M. N. Obrovac, J. Electrochem. Soc., 2012, 159, A1801–A1805 CrossRef CAS
.
- G. Wang, J. Feng, L. Dong, X. Li and D. Li, Appl. Surf. Sci., 2017, 396, 269–277 CrossRef CAS
.
- S. M. Jung, D. W. Kim and H. Y. Jung, J. Mater. Chem. A, 2020, 8, 8244–8254 RSC
.
- H. Wang, Q. Wu, Y. Wang, X. Wang, L. Wu, S. Song and H. Zhang, Adv. Energy Mater., 2019, 9, 1802993 CrossRef
.
- Y. Liu, N. Zhang, L. Jiao and J. Chen, Adv. Mater., 2015, 27, 6702–6707 CrossRef CAS
.
- Y. N. Sun, M. Goktas, L. Zhao, P. Adelhelm and B. H. Han, J. Colloid Interface Sci., 2020, 572, 122–132 CrossRef CAS
.
- M. Wang, X. Wang, Z. Yao, W. Tang, X. Xia, C. Gu and J. Tu, ACS Appl. Mater. Interfaces, 2019, 11, 24198–24204 CrossRef CAS PubMed
.
- W. Chen, K. Song, L. Mi, X. Feng, J. Zhang, S. Cui and C. Liu, J. Mater. Chem. A, 2017, 5, 10027–10038 RSC
.
- X. Geng, Y. Jiao, Y. Han, A. Mukhopadhyay, L. Yang and H. Zhu, Adv. Funct. Mater., 2017, 27, 1702998 CrossRef
.
- D. Sun, D. Huang, H. Wang, G. Xu, X. Zhang, R. Zhang, Y. Tang, D. Abd Ei-Hady, W. Alshitari, A. Saad Al-Bogami, K. Amine and M. Shao, Nano Energy, 2019, 61, 361–369 CrossRef CAS
.
- Y. Tang, Z. Zhao, Y. Wang, Y. Dong, Y. Liu, X. Wang and J. Qiu, ACS Appl. Mater. Interfaces, 2016, 8, 32324–32332 CrossRef CAS PubMed
.
- Q. Su, X. Cao, T. Yu, X. Kong, Y. Wang, J. Chen, J. Lin, X. Xie, S. Liang and A. Pan, J. Mater. Chem. A, 2019, 7, 22871–22878 RSC
.
- X. Zhao, S. Ning, W. Fu, S. J. Pennycook and K. P. Loh, Adv. Mater., 2018, 30, 1802397 CrossRef PubMed
.
- W. Tang, X. Wang, D. Xie, X. Xia, C. Gu and J. Tu, J. Mater. Chem. A, 2018, 6, 18318–18324 RSC
.
- B. Simone, B. Jacopo and K. Andras, ACS Nano, 2011, 5, 9703–9709 CrossRef
.
- Y. Chen, J. Lu, S. Wen, L. Lu and J. Xue, J. Mater. Chem. A, 2014, 2, 17857–17866 RSC
.
- C. Zhao, J. M. Ang, Z. Liu and X. Lu, Chem. Eng. J., 2017, 330, 462–469 CrossRef CAS
.
- Q. Li, Z. Yao, J. Wu, S. Mitra, S. Hao, T. S. Sahu, Y. Li, C. Wolverton and V. P. Dravid, Nano Energy, 2017, 38, 342–349 CrossRef CAS
.
- G. Eda, H. Yamaguchi, D. Voiry, T. Fujita, M. Chen and M. Chhowalla, Nano Lett., 2011, 11, 5111–5116 CrossRef CAS PubMed
.
- M. Kan, J. Y. Wang, X. W. Li, S. H. Zhang, Y. W. Li, Y. Kawazoe, Q. Sun and P. Jena, J. Phys. Chem. C, 2014, 118, 1515–1522 CrossRef CAS
.
- L. Fan, X. Li, B. Yan, J. Feng, D. Xiong, D. Li, L. Gu, Y. Wen, S. Lawes and X. Sun, Adv. Energy Mater., 2016, 6, 1502057 CrossRef
.
- L. Jiang, S. Zhang, S. A. Kulinich, X. Song, J. Zhu, X. Wang and H. Zeng, Mater. Res. Lett., 2015, 3, 177–183 CrossRef CAS
.
- C. Lee, H. Yan, L. E. Brus, T. F. Heinz, J. Hone and S. Ryu, ACS Nano, 2010, 4, 2695–2700 CrossRef CAS PubMed
.
- M. Li, Q. Deng, J. Wang, K. Jiang, Z. Hu and J. Chu, Nanoscale, 2018, 10, 741–751 RSC
.
- S. Wang, D. Zhang, B. Li, C. Zhang, Z. Du, H. Yin, X. Bi and S. Yang, Adv. Energy Mater., 2018, 8, 1801345 CrossRef
.
- S. Shi, Z. Sun and Y. H. Hu, J. Mater. Chem. A, 2018, 6, 23932–23977 RSC
.
- M. Acerce, D. Voiry and M. Chhowalla, Nat. Nanotechnol., 2015, 10, 313–318 CrossRef CAS
.
- Z. Chen, D. Yin and M. Zhang, Small, 2018, 14, 1703818 CrossRef PubMed
.
- H. Chen, J. He, G. Ke, L. Sun, J. Chen, Y. Li, X. Ren, L. Deng and P. Zhang, Nanoscale, 2019, 11, 16253–16261 RSC
.
- Y. Wang, Y. Lim, M. Park, S. Chou, J. H. Kim, H. Liu, S. Dou and Y. Kim, J. Mater. Chem. A, 2014, 2, 529–534 RSC
.
- Y. Li, Y. Liang, F. C. Robles Hernandez, H. Deog Yoo, Q. An and Y. Yao, Nano Energy, 2015, 15, 453–461 CrossRef CAS
.
- J. Wu, J. Liu, J. Cui, S. Yao, M. Ihsan-Ul-Haq, N. Mubarak, E. Quattrocchi, F. Ciucci and J.-K. Kim, J. Mater. Chem. A, 2020, 8, 2114–2122 RSC
.
- Y. Huang, Z. Wang, M. Guan, F. Wu and R. Chen, Adv. Mater., 2020, 32, 2003534 CrossRef CAS PubMed
.
- K. Yao, Z. Xu, Z. Li, X. Liu, X. Shen, L. Cao and J. Huang, ChemSusChem, 2018, 11, 2130–2137 CrossRef CAS PubMed
.
- D. Sun, D. Ye, P. Liu, Y. Tang, J. Guo, L. Wang and H. Wang, Adv. Energy Mater., 2018, 8, 1702383 CrossRef
.
- G. Jia, D. Chao, N. H. Tiep, Z. Zhang and H. J. Fan, Energy Storage Mater., 2018, 14, 136–142 CrossRef
.
- Z. Xu, K. Yao, Z. Li, L. Fu, H. Fu, J. Li, L. Cao and J. Huang, J. Mater. Chem. A, 2018, 6, 10535–10542 RSC
.
- K. Yao, Z. Xu, J. Huang, M. Ma, L. Fu, X. Shen, J. Li and M. Fu, Small, 2019, 15, 1805405 CrossRef PubMed
.
- H. J. Kwon, J. Y. Hwang, H. J. Shin, M. G. Jeong, K. Y. Chung, Y. K. Sun and H. G. Jung, Nano Lett., 2020, 20, 625–635 CrossRef CAS PubMed
.
Footnote |
| † Electronic supplementary information (ESI) available. See DOI: 10.1039/d0ta08711d |
| This journal is © The Royal Society of Chemistry 2021 |

