Interface photo-charge kinetics regulation by carbon dots for efficient hydrogen peroxide production†
Yi
Li
,
Yajie
Zhao
,
Haodong
Nie
,
Kaiqiang
Wei
,
Jingjing
Cao
,
Hui
Huang
 *,
Mingwang
Shao
 ,
Yang
Liu
* and
Zhenhui
Kang
 *
*
Institute of Functional Nano and Soft Materials (FUNSOM), Jiangsu Key Laboratory for Carbon-based Functional Materials and Devices, Soochow University, Suzhou, China. E-mail: zhkang@suda.edu.cn; yangl@suda.edu.cn; hhuang0618@suda.edu.cn
First published on 27th November 2020
Abstract
Hydrogen peroxide (H2O2) is a multi-functional chemical for a range of industries, but the present H2O2 production requires complex processes, and leads to environmental pollution, etc. Solar water-splitting is one of the potential avenues to combine H2O and O2 into H2O2 through a cheap and clean way. Most of the photocatalysts involve multiple components and interfaces to improve the catalytic activity and energy conversion efficiency. However, it is difficult to regulate the photo-charge kinetics between the multi-interface catalyst, which hinders the practical application of photocatalysts. Here, we report a SnS2/In2S3 type II heterostructure modified by carbon dots (SnS2/In2S3/CDs) to highly improve the stability of sulfides and realize generation of H2O2 by the oxygen reduction reaction (ORR). Notably, in situ transient photovoltage measurements (TPV) were carried out to analyze the charge transfer process among SnS2, In2S3 and CDs. The optimal SnS2/In2S3/CD composite (n(Sn):n(In) = 50%) displays a prominent H2O2 production rate of 1111.89 μmol h−1 g−1 without any sacrificial agent under the conditions of normal pressure and neutral solution (pH = 7). The quantum efficiency (QE) of H2O2 production was calculated to be 3.9% under light (λ = 535 nm), and the solar energy conversion efficiency (SCC) was up to 1.02%, which is the highest known production of H2O2 from sulfides as photocatalysts. Our work provides a new way to regulate the photo-charge kinetics of the multi-interface catalyst using CDs to achieve the extremely efficient production of H2O2 by photocatalytic water-splitting.
1. Introduction
Hydrogen peroxide (H2O2), as a multi-functional chemical, has been widely applied in lots of fields, such as chemical production, biomedicine, and water purification.1–3 However, H2O2 is still synthesized by anthraquinone oxidation or the direct synthesis from H2 and O2 in industry. These methods need vast energy investment, multiple steps and may carry the risk of explosion.4 One potential avenue is to combine solar water-splitting and oxygen to form H2O2.5 During the photocatalytic process, H2O can be oxidized to produce H2O2/O2 by photo-holes. H2O2 can be produced simultaneously via the two-electron reduction of O2 which is from air and produced by the catalyst.6–8Over the past decade, a range of oxide and organic photocatalysts were developed for H2O2 production, such as Pt/TiO2,9 Au/BiVO4,10 rGO/TiO2/CoPi,11 and ZIF-8/C3N4.12 Most of the photocatalysts involve multiple components and interfaces to improve the catalytic activity and energy conversion efficiency.13–18 Many multi-component and multi-interface catalysts have been proved to possess excellent photocatalytic performance compared to that of a single substance, such as heterojunctions, Z-schemes, co-catalysts, etc.19–25 However, it is difficult to regulate the photo-charge kinetics of the multi-interface catalyst, which seriously hinders the practical application of photocatalysts.26–29
Carbon dots (CDs), with a size of less than 10 nm, have become an attractive new material in the field of catalysis due to their abundant surface functional groups, unique electron storage ability, photoinduced electron transfer properties and efficient and stable reactive active centers.30–36 Herein, we report that the SnS2/In2S3/CD composite can achieve the production of H2O2 with high efficiency (1111.89 μmol h−1 g−1) and stability under visible light under the conditions of normal pressure and neutral solution (pH = 7) without any sacrificial agents. The quantum efficiency (QE) of this photocatalyst is up to 3.9% under a wavelength (λ) of 535 nm, which is the highest known production of H2O2 from sulfides as photocatalysts.15,27,37,38 In this system, CDs can store the electrons generated by SnS2 and In2S3, regulate the photo-charge kinetics in the multi-interface catalyst under visible light, and then further increase the electron–hole separation efficiency of SnS2/In2S3/CDs. On the other hand, CDs are the photo-active sites for the oxygen reduction reaction (ORR) to produce H2O2.14,39
2. Experimental
2.1 Synthesis of two-dimensional ultrathin SnS2
Two-dimensional SnS2 nanosheets were prepared through a one-step hydrothermal process. Briefly, 0.451 g (2 mmol) SnCl2·2H2O and 1.127 g (15 mmol) thioacetamide were mixed with 40 mL deionized water, and then stirred for 30 min. The mixture was heated up to 160 °C for 12 h and then the SnS2 was collected and dried at 80 °C for 12 h after being washed with ethanol and deionized water.2.2 Synthesis of three-dimensional In2S3
For comparison, three-dimensional In2S3 was also synthesized through a one-step hydrothermal route. Briefly, 0.382 g (1.0 mmol) In(NO3)3·4.5H2O and 0.363 g (3 mmol) L-cysteine were mixed with deionized water (60 mL) and stirred for 30 min. The mixture was heated at 180 °C for 12 h. The In2S3 was collected and dried at 80 °C for 12 h after being washed with ethanol and deionized water.2.3 Preparation of CDs
CDs were synthesized by the typical electrochemical method. Simply put, two graphite rods were placed in ultrapure water, and 30 V DC power was employed in the reaction. After 20 days of continuous stirring, the CD solution was acquired with a dark brown colour. After filtering the large size CDs through a three-layer filter paper device, the CD powder was obtained by freeze-drying.2.4 Synthesis of SnS2/In2S3/CDs
In our experiments, 0.382 g (1 mmol) In(NO3)3·4.5H2O, 0.363 g (3 mmol) L-cysteine, 0.09 g (0.5 mmol) SnS2, and 24 mg CDs were added to deionized water (60 mL) and stirred for 30 min. Then, the mixture was transferred into a Teflon-lined autoclave, which was heated for 12 h at 180 °C. Next, the SnS2/In2S3/CDs were collected and dried at 80 °C for 12 h after being washed with ethanol and deionized water. For the preparation of SnS2/In2S3/CDs, SnS2 and In2S3 with different amounts (n(Sn):n(In) = 10%, 30%, 40%, 50%, 60%, 70% and 100%) were added to the compound. The detailed characterization test and experiment of photocatalysis for SnS2/In2S3/CDs are included in the ESI.†3. Results and discussion
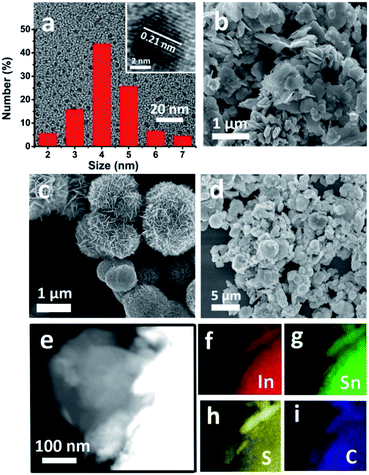
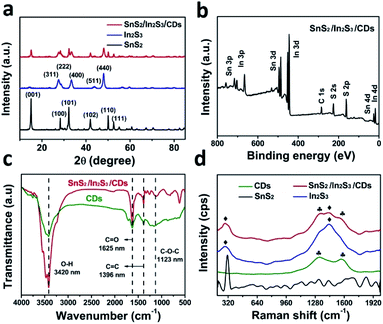
The morphology of SnS2/In2S3/CDs was characterized by using a scanning electron microscope (SEM) and transmission electron microscope (TEM). From Fig. 1a, the TEM image, HRTEM image and particle size distribution of monodisperse CDs were obtained, illustrating that CDs are particles with a diameter of 2–7 nm and lattice spacing of 0.21 nm, corresponding to the (100) crystal planes of graphitic carbon. From SEM images of SnS2 and In2S3 (Fig. 1b and c), it was found that SnS2 has a typical two-dimensional sheet structure with a size of 200 nm, and In2S3 has a three-dimensional spherical structure like a dandelion with a diameter of about 2 μm. The morphology and microstructure of the SnS2/In2S3/CD composite in Fig. 1d show that the two-dimensional lamellar SnS2 and the spherical structured In2S3 are tightly combined together. Fig. 1e–i show the elemental mapping images of SnS2/In2S3/CDs, where the Sn, In, S, C elements are evenly distributed.The crystal structures of SnS2, In2S3, and SnS2/In2S3/CDs were detected by X-ray diffraction (XRD). As shown in Fig. S1,† the relative intensity and peak position of SnS2 and In2S3 are consistent with the standard cards JCPDS No. 22-951 and JCPDS No. 65-459, respectively, indicating the successful synthesis of SnS2 and In2S3. In Fig. 2a, there are 6 distinct diffraction peaks of SnS2 at 2θ = 15, 32.2, 28.4, 41.2, 50, and 52.6°, which are attributed to (001), (101), (100), (102), (110) and (111) reflections, and the sharp diffraction peaks of In2S3 at 2θ = 27.5, 28.8, 33.4 and 47.98° correspond to (311), (222), (400), and (440) crystal planes. It is noteworthy that the composite material SnS2/In2S3/CDs has the characteristic peaks of both SnS2 and In2S3, indicating successful combination of SnS2 and In2S3. The important thing to note here is that XRD peaks of CDs cannot be measured in the XRD pattern of SnS2/In2S3/CDs because of the small number of CDs and the weak diffraction intensity of CDs in the composite.
The surface chemical and elemental states of SnS2, In2S3, and SnS2/In2S3/CDs were further studied using XPS technology. From the XPS full spectrum in Fig. 2b, it can be found that SnS2/In2S3/CDs contain three elements of In, Sn, and S. At the same time, the full spectrum of SnS2/In2S3/CDs can simultaneously identify the peaks of SnS2 and In2S3, indicating that SnS2 and In2S3 are combined successfully. The high-resolution XPS spectra of Sn 3d, In 3d, S 2p and C 1s for the SnS2/In2S3/CD composite are shown in Fig. S2a–d.† As depicted in Fig. S2a,† two peaks of SnS2/In2S3/CDs at 486.4 eV and 494.8 eV correspond to Sn 3d5/2 and Sn 3d3/2. Notably, the binding energies of Sn 3d5/2 and Sn 3d3/2 in SnS2/In2S3/CDs both show a 0.5 eV negative shift compared to that of SnS2, implying that SnS2 has got the electrons in the composite. Meanwhile, according to Fig. S2b,† the peaks of In 3d5/2 and In 3d3/2 in SnS2/In2S3/CDs (452.3 eV and 444.7 eV) show a 0.3 eV positive shift compared to that of In2S3, indicating that In2S3 has lost the electrons in the composite. As depicted in Fig. S2c,† the S 2p3/2 and 2p1/2 in SnS2/In2S3/CDs correspond to 161.4 eV and 162.6 eV, respectively. Besides, the C 1s spectrum of the SnS2/In2S3/CDs composite (Fig. S2d†) centered at 288.7 eV, 285.8 eV, and 284.5 eV can be attributed to the C![[double bond, length as m-dash]](https://www.rsc.org/images/entities/char_e001.gif) O, C–O, and C–C of CDs. As displayed in Fig. 2c, the FTIR spectrum proves the combination of SnS2/In2S3 and CDs. The peaks at 3433 cm−1, 1631 cm−1, 1384 cm−1 and 1331 cm−1 of SnS2/In2S3/CDs belong to the stretching vibrational peaks of the O–H, C
O, C–O, and C–C of CDs. As displayed in Fig. 2c, the FTIR spectrum proves the combination of SnS2/In2S3 and CDs. The peaks at 3433 cm−1, 1631 cm−1, 1384 cm−1 and 1331 cm−1 of SnS2/In2S3/CDs belong to the stretching vibrational peaks of the O–H, C![[double bond, length as m-dash]](https://www.rsc.org/images/entities/char_e001.gif) O, C
O, C![[double bond, length as m-dash]](https://www.rsc.org/images/entities/char_e001.gif) C, and C–O–C bonds in the CDs, respectively.33 Besides, in Fig. 2d, the peaks at 1329 cm−1 and 1567 cm−1 of SnS2/In2S3/CDs belong to the CDs and the peaks at 288 cm−1 and 1433 cm−1 of SnS2/In2S3/CDs belong to the In2S3, indicating that Raman spectra further confirm the combination of SnS2, In2S3, and CDs.
C, and C–O–C bonds in the CDs, respectively.33 Besides, in Fig. 2d, the peaks at 1329 cm−1 and 1567 cm−1 of SnS2/In2S3/CDs belong to the CDs and the peaks at 288 cm−1 and 1433 cm−1 of SnS2/In2S3/CDs belong to the In2S3, indicating that Raman spectra further confirm the combination of SnS2, In2S3, and CDs.
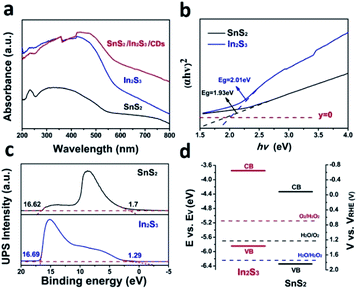
Fig. 3a shows a typical absorption range in the 420–800 nm region of SnS2, In2S3, SnS2/In2S3/CDs, indicating that the CDs can obviously enhance the visible light absorption capacity of SnS2/In2S3/CDs. As depicted in Fig. 3b, the band gaps of SnS2 and In2S3 are 1.93 eV and 2.01 eV, respectively. Furthermore, the valence bands of SnS2 and In2S3 can be determined by ultraviolet photoelectron spectroscopy (UPS). As shown in Fig. 3c, the valence bands (VB) of SnS2 and In2S3 were calculated to be 1.84 V and 1.36 V, respectively, while the conduction band (CB) values of SnS2 and In2S3 were also calculated to be −0.09 V and −0.65 V (the specific calculation method is in S1†). According to Fig. 3d, the band gap structures of SnS2 and In2S3 can be derived from the positions of the CB and VB, suggesting that SnS2 and In2S3 both meet the requirements of photocatalytic water splitting.
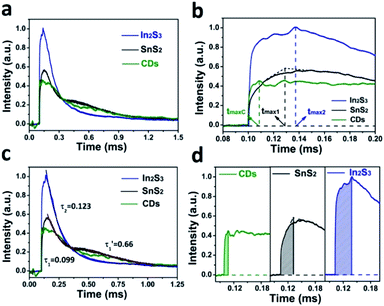
In Fig. 4a, the TPV overall diagrams of SnS2, In2S3 and CDs are displayed. As shown in Fig. 4b, the charge extraction process of CDs (tmaxc) is the fastest compared to that of SnS2 and In2S3, indicating that CDs have the fastest electron transmission capacity. Meanwhile, because it is easier for the lamellar structure of SnS2 to transmit electrons than the three-dimensional spherical structure of In2S3, the charge extraction process of SnS2 (tmax1) is faster than that of In2S3 (tmax2). According to Fig. 4c, the time attenuation constants of SnS2 can be divided into two sections, namely (0.099) and (0.66), because the electron transport between the layers of SnS2 can decrease the recombination rate of carriers. In contrast, the time attenuation constant of In2S3 was (0.123), suggesting that In2S3 has only a period of attenuation and the overall electron–hole recombination rate is faster compared to SnS2. As displayed in Fig. 4d, the maximum charge extraction efficiency of In2S3 is greater than that of SnS2 and CDs, suggesting that the main source of electrons and holes in the photocatalysis of SnS2/In2S3/CDs is In2S3.
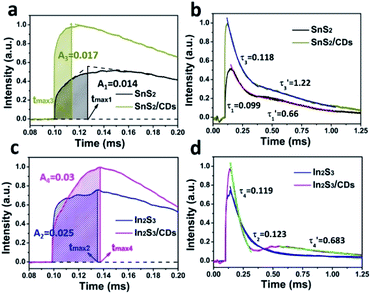
As shown in Fig. 5a, the charge extraction process of SnS2/CDs (tmax3) is faster than that of SnS2 (tmax1), indicating that CDs can increase the rate of charge transport in layer-to-layer of SnS2. Meanwhile, the maximum charge extraction efficiency of SnS2/CDs (0.017) is greater compared to SnS2 (0.014), suggesting that CDs can promote the separation of carriers of SnS2. In Fig. 5b, the time attenuation constants of SnS2/CDs are (0.118) and (1.22), respectively. And (0.118) > (0.099), (1.22) > (0.66) mean that CDs can slow down the recombination rate of carriers from the angle of time attenuation constants. As depicted in Fig. 5c, the charge extraction process of In2S3 (tmax2) is a little faster than that of In2S3/CDs (tmax4), indicating that CDs slightly delay the transport rate of charges due to the charge storage function of CDs. Similarly, the maximum charge extraction efficiency of In2S3/CDs (0.03) is bigger than that of In2S3 (0.025), suggesting that CDs can promote the separation of carriers of In2S3. In Fig. 5d, the time attenuation constants of In2S3/CDs are (0.119) and (0.683), respectively. The second stage of time attenuation is caused by the secondary discharge process of CDs as good charge acceptors and donors.
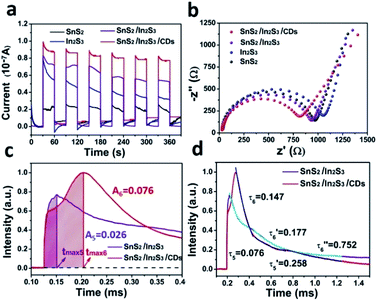
In Fig. 6a, the i–t curve was used to evaluate the photocurrent response capability under six light-on and light-off cycles for SnS2/In2S3/CDs, SnS2/In2S3, In2S3, and SnS2. Generally, the response intensity of photocurrent is closely related to photo-charge. Obviously, the photocurrent intensity of In2S3 is significantly stronger than that of SnS2, indicating that In2S3 is mainly providing photogenerated charge in the photocatalytic process of SnS2/In2S3/CDs, which is consistent with the result of the maximum charge extraction efficiency of SnS2 and In2S3 in TPV. At the same time, the photocurrent intensity of SnS2/In2S3 is significantly stronger than that of SnS2 and In2S3, which proves that the heterojunction structure can increase the rate of photo-charge separation and the stability of sulfides. After adding CDs, the photocurrent intensity of SnS2/In2S3/CDs is further enhanced, suggesting that the CDs further enhance the charge separation efficiency and stability of sulfides based on heterojunctions.
Normally, a lower electron-transfer resistance inside the catalyst leads to a smaller semicircle arc in the EIS spectrum. As shown in Fig. 6b, SnS2/In2S3/CDs has the smallest arc radius because of the presence of heterojunctions and CDs, indicating that the photo-electrons of SnS2/In2S3/CDs have faster electron transmission capacity than that of SnS2, In2S3 and SnS2/In2S3. Meanwhile, the semicircle diameter of SnS2 is smaller than that of In2S3, suggesting that it is easier for the two-dimensional lamellar structure of SnS2 to transmit electrons than that of In2S3. As depicted in Fig. 6c, the charge extraction process of SnS2/In2S3 (tmax5) is faster than that of SnS2/In2S3/CDs (tmax6), indicating that the CDs are good electron donors and acceptors in SnS2/In2S3/CDs. The continuous storage and release of electrons by the CDs during the electron transport process slow down the charge extraction rate. Meanwhile, the maximum charge extraction efficiency of SnS2/In2S3/CDs (0.076) is 2.92 times that of SnS2/In2S3 (0.026), suggesting that the addition of CDs can greatly promote the separation efficiency of carriers in SnS2/In2S3/CDs. As shown in Fig. S4b and d,† the time attenuation constants of SnS2/In2S3 are (0.076) and (0.258), respectively. And (0.076) < (0.099), (0.258) > (0.123) mean that after the formation of heterojunction between SnS2 and In2S3, the electron–hole recombination rate of SnS2 is accelerated and the electron–hole recombination rate of In2S3 is slowed down due to constant transfer of electrons from In2S3 to SnS2. In Fig. 6d, the time attenuation constants of SnS2/In2S3/CDs can be divided into three sections, namely (0.147), (0.177) and (0.752). And (0.076) is less than (0.147) and (0.258) is greater than (0.177) which illustrates that the addition of CDs slows down the electron–hole recombination rate of SnS2 because of the ability of CDs to store electrons in the layers of SnS2, and the CDs also decrease the electron–hole recombination rate of In2S3 due to the secondary discharge process of CDs.
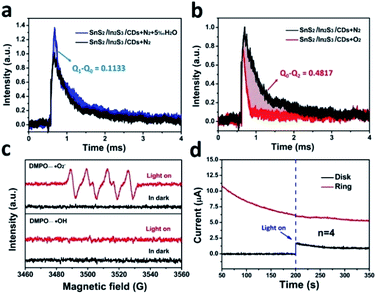
The in situ TPV test was performed in different atmospheres shown in Fig. 7a and b. By integrating the curve of the in situ TPV, the amount of charge consumed during the oxidation and reduction reactions can be calculated. In the ACN solution with a N2-saturated atmosphere, the charge generated by SnS2/In2S3/CDs during light excitation and eventually consumed by the entire circuit was defined as Q0. In the 5 vol‰ water/ACN (v/v) solution saturated with N2, H2O consumed charge as a water oxidation reaction (WOR), and the remaining charge was consumed by the entire circuit, which was defined as Q1. Likewise, in the ACN solution saturated with O2, O2 as the ORR reactant consumes part of the charge, and the remaining charge was consumed by the entire circuit, which was defined as Q2. As depicted in Fig. 7a, the SnS2/In2S3/CDs displayed a higher photovoltage in the 5 vol‰ water/ACN (v/v) solution saturated with N2, illustrating that H2O consumed the charge of Q1 − Q0 (0.1133) in the WOR. According to Fig. 7b, SnS2/In2S3/CDs consumed a lot of charge under the conditions of an O2-saturated atmosphere, and the amount of charge consumed by the ORR is Q0 − Q2 (0.4817). Therefore, the ratio of (Q1 − Q0) and (Q0 − Q2) is the number of charges required for the SnS2/In2S3/CDs to undergo the WOR and ORR. The half reaction rate ratio λ is 4.25 (0.4817/0.1133). At the same time, using the electrochemical test method in S6,† the oxygen evolution reaction (OER) rate constant k1 (9.31 × 10⁻⁹) is also slower than that of the ORR rate constant k2 (1.2 × 10⁻⁸), which is consistent with the results obtained by the in situ TPV (the specific calculation method is in S7†).40 Besides, as displayed in Fig. 7c, the EPR spectra of SnS2/In2S3/CDs support the existence of ˙O2− without the presence of ˙OH, suggesting that the ORR is the only way for H2O2 production by photocatalytic water splitting. In Fig. 7d, the electron transfer number of SnS2/In2S3/CDs in the photocatalytic process can be calculated to be about 4, indicating that water is oxidized by photo-holes into O2 instead of H2O2 during the photocatalytic reaction of SnS2/In2S3/CDs.
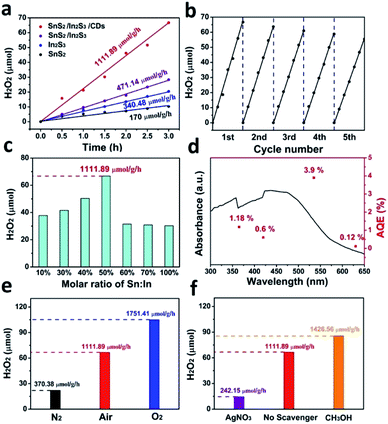
Fig. 8a shows the H2O2 generation rate with various catalysts. The production rate of SnS2/In2S3/CDs was calculated to be 1111.89 μmol h−1 g−1, while that of SnS2/In2S3 was 471.14 μmol h−1 g−1, that of In2S3 was 340.48 μmol h−1 g−1, and that of SnS2 was 170 μmol h−1 g−1 in a 3 h reaction. SnS2/In2S3/CDs exhibits the optimal photocatalytic ability, and the H2O2 production rate is 6.5 and 3.3 fold higher than that of pure SnS2 and In2S3. The heterojunction formed by SnS2 and In2S3 facilitates the separation of carriers, while the addition of CDs not only improves the light capture ability of the photocatalyst, as good electron acceptors and donors but also further facilitates the separation of carriers. As displayed in Fig. 8b, the catalyst exhibits excellent stability for five cycles with each cycle being performed for 3 h, indicating that the heterojunction structure and CDs enhance the stability of SnS2/In2S3/CDs. As depicted in Fig. 8c, the effects of different molar ratios of Sn and In of the composite on the photocatalytic reaction were also explored. Clearly, the optimal content of molar ratios of Sn and In is 50%, and the optimal SnS2/In2S3/CDs displays the highest photocatalytic activity with the H2O2 evolution rate of 1111.89 μmol h−1 g−1. The QE as a function of the absorption spectrum of SnS2/In2S3/CDs is displayed in Fig. 8d, and is calculated to be 3.9% at the irradiation wavelength of 535 nm for 3 h (20 mg catalyst in 15 mL H2O, the detailed calculations are displayed in S2†).
As shown in Fig. 8e, the photocatalytic performance experiments of SnS2/In2S3/CDs were performed under N2, O2, or air atmosphere conditions. It can be seen that the H2O2 produced by N2 saturation (370.38 μmol g−1 h−1) was not completely inhibited and H2O2 produced by O2 saturation (1751.41 μmol g−1 h−1) showed an obvious increase compared with air conditions (1111.89 μmol g−1 h−1), suggesting that oxygen is involved in the production of hydrogen peroxide from SnS2/In2S3/CDs and the O2 source of H2O2 produced by SnS2/In2S3/CDs is composed of two parts from the air and the SnS2/In2S3/CD WOR. Meanwhile, we have observed the dependence of kinetics on the concentration of O2 in Fig. S5.† It shows that the H2O2 production of SnS2/In2S3/CDs is related to Po2, and with the increase of the reactant concentration, the rate of H2O2 generation gradually increases until it approaches the limit value which is caused by the limited number of active sites for the SnS2/In2S3/CDs to adsorb and reduce O2 when Po2 is large enough. As depicted in Fig. S6,† before the detection of H2O2, we have detected the generation of H2 using a GC-7900. There is no H2 produced when SnS2/In2S3/CDs was used as a photocatalyst under a N2 or air atmosphere, indicating that SnS2/In2S3/CDs only produces H2O2 even under a N2 atmosphere. As shown in Fig. 8f, the photocatalytic performance of SnS2/In2S3/CDs was displayed with different scavengers (AgNO3/no scavenger/CH3OH). AgNO3 solution as an electron sacrificial agent (242.15 μmol g−1 h−1) and CH3OH solution as a hole sacrificial agent (1426.56 μmol g−1 h−1) were added into the system also to verify the mechanism of hydrogen peroxide production by SnS2/In2S3/CDs compared with the system without a scavenger (1111.89 μmol g−1 h−1), suggesting that electrons are involved in the reaction process of SnS2/In2S3/CDs producing hydrogen peroxide. These are consistent with the mechanism process by which SnS2/In2S3/CDs produces H2O2.
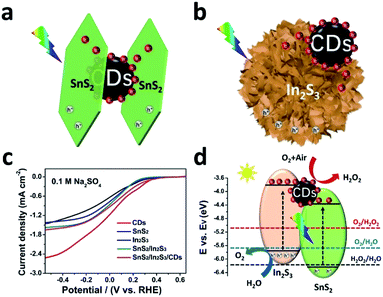
The mechanism of the photocatalytic reaction based on SnS2/In2S3/CDs is depicted in Fig. 9. The charge transfer process between SnS2 and CDs under the irradiation of visible light indicates that the electrons generated by SnS2 will transfer to the CDs and enhance the electron transport process between the layers of SnS2 (Fig. 9a). Similarly, the charge transfer process between In2S3 and CDs is displayed in Fig. 9b, suggesting that the electrons produced by In2S3 will also be transferred to the CDs and stored on the CDs for secondary discharge during the catalysis process. As shown in Fig. 9c, CDs display a more positive onset potential and a higher diffusion-limited current density compared with other sulfides, suggesting that CDs are the active sites in SnS2/In2S3/CDs for the ORR due to its strong ORR process.41,42
As depicted in Fig. 9d, when the SnS2/In2S3/CDs was irradiated with visible light, SnS2 and In2S3 will generate electron–hole pairs, respectively. And the electrons generated by SnS2 and In2S3 will be transferred to the CDs to undergo reduction reaction with O2 to produce H2O2. On the other hand, water will oxidize with holes on In2S3 to produce O2. The WOR can further provide O2 for ORR. In brief, the CDs in the multi-interface SnS2/In2S3/CDs act as both the electron carriers of SnS2 and In2S3 and the active centres of the ORR. The charge regulation of the CDs on the multi-interface further increases the efficiency of carrier separation between SnS2 and In2S3. Meanwhile, it also prevents the damage of H2O2 to sulfides and greatly enhances the stability of sulfides.
Note that, CDs have adjustable characteristics in composition, size and surface functional groups, and their electronic structure and surface functional groups can be adjusted by further doping as well as further surface modification. There is plenty of room to achieve CDs to regulate photo-charge kinetics in multi-interfaces for efficient photocatalyst design.
4. Conclusions
The SnS2/In2S3/CDs composite was prepared by a facile two-step hydrothermal treatment. The as-prepared photocatalyst displays superior activity with a yield of 1111.89 μmol h−1 g−1 and stability for H2O2 production without any sacrificial agent under the conditions of normal pressure and neutral solution (pH = 7). The QE value of the sole production of H2O2 was 3.9% at 535 nm and the SCC efficiency was determined to be 1.02%, which is the highest known production of H2O2 from sulfides as photocatalysts. In particular, the dual-functions of CDs contribute to the improved performance. CDs can not only store the electrons generated by SnS2 and In2S3 under visible light to increase the electron–hole separation efficiency of SnS2/In2S3/CDs, but also provide the active sites for SnS2/In2S3/CDs to undergo the ORR reaction for producing H2O2. This work provides a creative way to regulate the kinetics of photo-induced charges in the multi-interface catalyst by combining CDs and then to achieve efficient production of H2O2 at normal pressure.Conflicts of interest
There are no conflicts to declare.Acknowledgements
This work is supported by the National MCF Energy R&D Program (2018YFE0306105), National Key Research and Development Project of China (2020YFA0406104), the Innovative Research Group Project of the National Natural Science Foundation of China (51821002), the National Natural Science Foundation of China (51725204, 21771132, 51972216 and 52041202), the Natural Science Foundation of Jiangsu Province (BK20190041), the Key-Area Research and Development Program of GuangDong Province (2019B010933001), the Collaborative Innovation Center of Suzhou Nano Science & Technology, the Priority Academic Program Development of Jiangsu Higher Education Institutions (PAPD), and the 111 Project.Notes and references
- G.-h. Moon, M. Fujitsuka, S. Kim, T. Majima, X. Wang and W. Choi, ACS Catal., 2017, 7, 2886–2895 CrossRef.
- A. T. Murray, S. Voskian, M. Schreier, T. A. Hatton and Y. Surendranath, Joule, 2019, 3, 2942–2954 CrossRef.
- P. Zhang, Y. Tong, Y. Liu, J. J. M. Vequizo, H. Sun, C. Yang, A. Yamakata, F. Fan, W. Lin, X. Wang and W. Choi, Angew. Chem., Int. Ed., 2020, 59, 16209–16217 CrossRef PubMed.
- C. Xia, Y. Xia, P. Zhu, L. Fan and H. Wang, Science, 2019, 366, 226–231 CrossRef PubMed.
- W. Fan, B. Zhang, X. Wang, W. Ma, D. Li, Z. Wang, M. Dupuis, J. Shi, S. Liao and C. Li, Energy Environ. Sci., 2020, 13, 238–245 RSC.
- Y. Shiraishi, T. Takii, T. Hagi, S. Mori, Y. Kofuji, Y. Kitagawa, S. Tanaka, S. Ichikawa and T. Hirai, Nat. Mater., 2019, 18, 985–993 CrossRef PubMed.
- W.-C. Hou and Y.-S. Wang, ACS Sustainable Chem. Eng., 2017, 5, 2994–3001 CrossRef.
- S. Hu, Sustainable Energy Fuels, 2019, 3, 101–114 RSC.
- L. Wang, S. Cao, K. Guo, Z. Wu, Z. Ma and L. Piao, Chin. J. Catal., 2019, 40, 470–475 CrossRef CAS.
- H. Hirakawa, S. Shiota, Y. Shiraishi, H. Sakamoto, S. Ichikawa and T. Hirai, ACS Catal., 2016, 6, 4976–4982 CrossRef CAS.
- G.-h. Moon, W. Kim, A. D. Bokare, N.-e. Sung and W. Choi, Energy Environ. Sci., 2014, 7, 4023–4028 RSC.
- Y. Zhao, Y. Liu, J. Cao, H. Wang, M. Shao, H. Huang, Y. Liu and Z. Kang, Appl. Catal., B, 2020, 278, 119289 CrossRef.
- A. K. Dutta, S. K. Maji, D. N. Srivastava, A. Mondal, P. Biswas, P. Paul and B. Adhikary, ACS Appl. Mater. Interfaces, 2012, 4, 1919–1927 CrossRef PubMed.
- Y. Fu, C. Zhu, C. Liu, M. Zhang, H. Wang, W. Shi, H. Huang, Y. Liu and Z. Kang, Appl. Catal., B, 2018, 226, 295–302 CrossRef.
- H. Song, L. Wei, C. Chen, C. Wen and F. Han, J. Catal., 2019, 376, 198–208 CrossRef.
- S. Jana and A. Mondal, ACS Appl. Mater. Interfaces, 2014, 6, 15832–15840 CrossRef PubMed.
- H. Gu, Y. Yang, J. Tian and G. Shi, ACS Appl. Mater. Interfaces, 2013, 5, 6762–6768 CrossRef.
- K. Li, Z. Huang, X. Zeng, B. Huang, S. Gao and J. Lu, ACS Appl. Mater. Interfaces, 2017, 9, 11577–11586 CrossRef CAS PubMed.
- J. Liu, J. Ke, Y. Li, B. Liu, L. Wang, H. Xiao and S. Wang, Appl. Catal., B, 2018, 236, 396–403 CrossRef CAS.
- M. Han, H. Wang, S. Zhao, L. Hu, H. Huang and Y. Liu, Inorg. Chem. Front., 2017, 4, 1691–1696 RSC.
- Y. Qin, H. Li, J. Lu, Y. Feng, F. Meng, C. Ma, Y. Yan and M. Meng, Appl. Catal., B, 2020, 277, 119254 CrossRef.
- W. Zhao, C. Liang, B. Wang and S. Xing, ACS Appl. Mater. Interfaces, 2017, 9, 41927–41936 CrossRef CAS.
- Y. C. Zhang, Z. N. Du, K. W. Li, M. Zhang and D. D. Dionysiou, ACS Appl. Mater. Interfaces, 2011, 3, 1528–1537 CrossRef PubMed.
- J. C. Wang, H. C. Yao, Z. Y. Fan, L. Zhang, J. S. Wang, S. Q. Zang and Z. J. Li, ACS Appl. Mater. Interfaces, 2016, 8, 3765–3775 CrossRef.
- K. Chu, Y. P. Liu, Y. B. Li, Y. L. Guo and Y. Tian, ACS Appl. Mater. Interfaces, 2020, 12, 7081–7090 CrossRef CAS.
- Y. Chen, X. Wang, M. Lao, K. Rui, X. Zheng, H. Yu, J. Ma, S. X. Dou and W. Sun, Nano Energy, 2019, 64, 103918 CrossRef CAS.
- J. Xu, Z. Chen, H. Zhang, G. Lin, H. Lin, X. Wang and J. Long, Sci. Bull., 2017, 62, 610–618 CrossRef CAS.
- J. Cao, H. Wang, Y. Zhao, Y. Liu, Q. Wu, H. Huang, M. Shao, Y. Liu and Z. Kang, J. Mater. Chem. A, 2020, 8, 3701–3707 RSC.
- X. Wu, C. Zhu, L. Wang, S. Guo, Y. Zhang, H. Li, H. Huang, Y. Liu, J. Tang and Z. Kang, ACS Catal., 2017, 7, 1637–1645 CrossRef CAS.
- C. Zhu, C. Liu, Y. Zhou, Y. Fu, S. Guo, H. Li, S. Zhao, H. Huang, Y. Liu and Z. Kang, Appl. Catal., B, 2017, 216, 114–121 CrossRef CAS.
- W. Shi, F. Guo, C. Zhu, H. Wang, H. Li, H. Huang, Y. Liu and Z. Kang, J. Mater. Chem. A, 2017, 5, 19800–19807 RSC.
- Y. Fu, C. a. Liu, M. Zhang, C. Zhu, H. Li, H. Wang, Y. Song, H. Huang, Y. Liu and Z. Kang, Adv. Energy Mater., 2018, 8, 1802525 CrossRef.
- H. Ming, Z. Ma, Y. Liu, K. Pan, H. Yu, F. Wang and Z. Kang, Dalton Trans., 2012, 41, 9526–9531 RSC.
- M. Zhang, H. Wang, B. Wang, Y. Ma, H. Huang, Y. Liu, M. Shao, B. Yao and Z. Kang, Small, 2019, 15, e1901512 CrossRef.
- W. Shi, F. Guo, M. Han, S. Yuan, W. Guan, H. Li, H. Huang, Y. Liu and Z. Kang, J. Mater. Chem. B, 2017, 5, 3293–3299 RSC.
- J. Liu, Y. Liu, N. Liu, Y. Han, X. Zhang, H. Huang, Y. Lifshitz, S. T. Lee, J. Zhong and Z. Kang, Science, 2015, 347, 970–974 CrossRef CAS.
- H.-i. Kim, O. S. Kwon, S. Kim, W. Choi and J.-H. Kim, Energy Environ. Sci., 2016, 9, 1063–1073 RSC.
- S. Thakur, T. Kshetri, N. H. Kim and J. H. Lee, J. Catal., 2017, 345, 78–86 CrossRef CAS.
- Y. Liu, Y. Zhao, Y. Sun, J. Cao, H. Wang, X. Wang, H. Huang, M. Shao, Y. Liu and Z. Kang, Appl. Catal., B, 2020, 270, 118875 CrossRef CAS.
- L. Zhu, Q. Cai, F. Liao, M. Sheng, B. Wu and M. Shao, Electrochem. Commun., 2015, 52, 29–33 CrossRef CAS.
- J. Zhang, Z. Zhao, Z. Xia and L. Dai, Nat. Nanotechnol., 2015, 10, 444–452 CrossRef CAS.
- Y. Zheng, Y. Jiao, L. Ge, M. Jaroniec and S. Z. Qiao, Angew. Chem., Int. Ed., 2013, 52, 3110–3116 CrossRef CAS.
Footnote |
| † Electronic supplementary information (ESI) available. See DOI: 10.1039/d0ta10231h |
| This journal is © The Royal Society of Chemistry 2021 |

![[thin space (1/6-em)]](https://www.rsc.org/images/entities/char_2009.gif) :
: