Dihydroxybenzene isomers electrochemical sensor based on activated carbon sensitive material activated by mechanochemistry and low-dosage phosphoric acid
Xuan
Yang
a,
Chenlu
He
a,
Yu
Lin
b,
Yijuan
Qiu
a,
Pengfei
Li
c,
Yandan
Chen
 a,
Biao
Huang
 *a and
Xinyu
Zheng
 *b
*b
aCollege of Material Engineering, Fujian Agriculture and Forestry University, Fuzhou, Fujian 350002, China. E-mail: fjhuangbiao@hotmail.com
bCollege of Life Science, Fujian Agriculture and Forestry University, Fuzhou, Fujian 350002, China. E-mail: zhengxinyu0621@sina.com
cGuangxi Key Laboratory of Chemistry and Engineering of Forest Products, Guangxi Collaborative Innovation Center for Chemistry and Engineering of Forest Products, Guangxi University for Nationalities, Nanning 530006, China
First published on 24th November 2021
Abstract
A dihydroxybenzene isomers electrochemical sensor based on bamboo activated carbon (MCPBAC) sensitive material activated by mechanochemistry and low-dosage phosphoric acid was fabricated in this work. The sensor, modified by MCPBAC with GCE, can significantly distinguish and sensitively measure hydroquinone (HQ) and catechol (CC). The MCPBAC exhibits a well-developed porous structure, high specific surface area, and good electrical conductivity. Using differential pulse voltammetry (DPV), wide linear ranges for both HQ and CC are 0.6–600 μM, with low detection limits (S/N = 3) for both of 0.2 μM. The dihydroxybenzene isomers electrochemical sensor has wide application prospects in the determination of trace HQ and CC in environmental water.
1. Introduction
Activated carbon (AC) is widely used in the fields of food, agriculture, the chemical industry, and medicine due to its unique specific surface area, well-developed internal pore structure, and high physicochemical stability as well as rich surface functional groups.1–5 At present, the phosphoric acid (H3PO4) activation method is one of the most commonly used methods for preparing AC, which has been industrialized and mass-produced for nearly 40 years in China.6 Nevertheless, the preparation process of AC by the H3PO4 method has problems, such as a large amount of activator, high energy consumption, and expensive production costs.7 How to reduce the amount of activator and develop high-quality H3PO4 activated carbon has aroused widespread interest among industry researchers. During the H3PO4 process of the activated carbon method, H3PO4 can gradually penetrate into the structure of plants by catalyzing the hydrolysis of high polysaccharides from plant fiber. Not only is the concentration of H3PO4 required to be high, but sometimes strong acids such as sulfuric acid are also needed to achieve the purpose of swelling the fibers in the crystalline area.8–10 However, low-dosage H3PO4 has a weak swelling ability, and it is challenging preparing activated carbon with developed pores and good adsorption performance.Mechanochemistry combines mechanical with chemical phenomena on the molecular scale, including phase transitions, size reduction, and chemical bond breaking.11,12 Among them, ball milling is an excellent mechanochemical method, which has the advantages of simplicity, environmental protection, and economy.13,14 In the process of ball milling, because the molecular bonds are broken and the internal energy of the substance is increased, the system is in a chemically active state, leading to the occurrence of catalyzing and exciting chemical reactions.15 Therefore, low-dosage H3PO4 activation combined with the mechanochemical method is used to allow low-dosage H3PO4 to enter the plant cell (fiber) effectively under the action of mechanical force.16 During high-energy ball milling, the instantaneous high temperature dramatically increases the H3PO4 concentration in the plant fiber, which effectively promotes the emergence of plant fiber swelling. Chen et al. have reported that compared with the traditional H3PO4 method, mechanochemical assisted H3PO4 activation prepared activated carbon has a higher specific surface area and well-developed pores.17 Temperature is an essential factor that affects the degree of graphitization of activated carbon and thus its electrical conductivity.18 The use of low-dosage H3PO4, supplemented by a mechanical method to treat plant fibers and then carbonization under high-temperature conditions, is expected to obtain activated carbon with high specific surface area and good electrical conductivity.
Hydroquinone (HQ) and catechol (CC) are mainly used in developing agents, anthraquinone dyes, azo dyes, rubber anti-aging agents and monomer polymer inhibitors, food stabilizers and coating antioxidants, petroleum anticoagulants, synthesis of ammonia using catalysts, and so on.19 The use of HQ and CC is inevitable but, unfortunately, these two isomers are not easy to separate because of their high stability. In addition, they are highly toxic substances and often simultaneously exist in environmental pollutants, making it particularly important to monitor trace amounts of HQ and CC. Compared with other analytical methods, electrochemical analysis has attracted much interest with its high sensitivity and excellent selectivity.20 However, in the conventional electrochemistry method, it is usually challenging to detect CC and HQ simultaneously because of their close redox potentials at most unmodified electrode surfaces.21 Therefore, research and development into novel materials with excellent conductivity is indispensable for the simultaneous detection of CC and HQ.
To resolve this problem, some functional materials, such as graphene, metal–organic frameworks (MOFs), carbon nanotubes, and metal/metal oxides, have been used to modify electrodes for the simultaneous determination of CC and HQ.22–25 Compared with them, AC has attracted great interest due to its unique properties: for example, low-cost precursors, and simple and environmentally friendly preparation process. So, the present work describes a facile, green, and environmentally friendly pathway for the preparation of high-performance activated carbon based on the synergistic effect of mechanochemistry and low-dosage H3PO4. Subsequently, the surface of a glassy carbon electrode (GCE) was coated with AC to construct an AC/GCE for the simultaneous measurement of dihydroxybenzene isomers.
2. Experimental section
2.1 Reagents and apparatus
A surface analyzer (ASAP 2020, Micromeritics, USA) was equipped to analyze the pore structure of various carbon materials. The relevant parameters could be acquired by N2-adsorption/desorption isotherms. XRD (Philips-FEI, Netherlands, Cu Kα resource), Raman spectrometry (Renishaw Invia, UK, excitation wavelength at 514 nm), SEM (NOVA Nano SEM 230, USA), and XPS (ESCALAB 250Xi Thermo Scientific, USA, Al Kα resource) were carried out to obtain the phase structure, ordered structure, morphology and chemical compositions of the prepared carbons. CHI660E (Shanghai, China) was applied to explore the electrochemical behaviors of dihydroxybenzene isomers in a three-electrode system. The system contains working electrodes such as GCE and modified glassy carbon electrodes (BAC/GCE, PBAC/GCE, and MCPBAC/GCE), a reference electrode (Ag/AgCl, 3 M KCl) and an auxiliary electrode (platinum foil). The diameter of the working electrodes was 3 mm.HQ, CC, and phosphoric acid (H3PO4, 85%) were procured from Sigma Aldrich. The other chemicals used in this study were analytically pure and the experimental water used was distilled water. Bamboo powder was obtained from Fuzhou, Fujian province.
2.2 Preparation of MCPBAC
Briefly, the bamboo powder was first sifted and desiccated for 24 h at 100 °C. Then, 15 g of bamboo powder and 5 wt% H3PO4 (0.88 g) were immersed evenly, impregnated for 2 h, and transferred to an oven for drying at 120 °C, maintained for 6 h. Soon afterward, the mixture and ZrO2 balls according to a mass ratio of 1![[thin space (1/6-em)]](https://www.rsc.org/images/entities/char_2009.gif) :
:![[thin space (1/6-em)]](https://www.rsc.org/images/entities/char_2009.gif) 15 were subjected to milling, and stirred at 400 rpm for 1 h. After milling, the balls were removed from the sample, and the resulting mixture was placed in a muffle furnace in an N2 atmosphere with a heating rate of 5 °C min−1 to 950 °C and pyrolyzed for 4 h. Finally, the resulting material was washed with distilled water until neutral pH was achieved and dried at 110 °C overnight: denoted MCPBAC. As controls, samples of carbonized bamboo powder at 950 °C (marked as BAC) with the same synthesis conditions and samples without mechanochemical treatment (marked as PBAC) were also produced in parallel.
15 were subjected to milling, and stirred at 400 rpm for 1 h. After milling, the balls were removed from the sample, and the resulting mixture was placed in a muffle furnace in an N2 atmosphere with a heating rate of 5 °C min−1 to 950 °C and pyrolyzed for 4 h. Finally, the resulting material was washed with distilled water until neutral pH was achieved and dried at 110 °C overnight: denoted MCPBAC. As controls, samples of carbonized bamboo powder at 950 °C (marked as BAC) with the same synthesis conditions and samples without mechanochemical treatment (marked as PBAC) were also produced in parallel.
2.3 Preparation of MCPBAC/GCE
An appropriate amount of MCPBAC was dispersed in ethanol and sonicated for 30 minutes to form a uniform 1 g mL−1 suspension. 5 μL of the suspension was dropped on a pre-polished GCE surface and dried under an infrared lamp. The modified electrode was named MCPBAC/GCE.2.4 Electrochemical measurements
The electrochemical characterization and determination of the two analytes were performed by cyclic voltammetry (CV), differential pulse voltammetry (DPV), and electrochemical impedance spectroscopy (EIS) methods. The potential scan ranges of CV and DPV were 0.2–1 V and 0–0.8 V, respectively. The frequency of the EIS experiment was 0.01–10 kHz, and the amplitude voltage was 5 mV.3. Results and discussion
3.1 Characterization of activated carbon samples
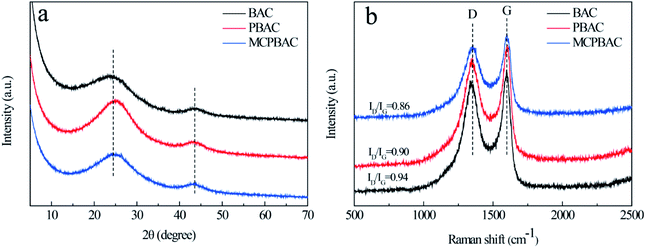
XRD and Raman spectroscopy were used to study the crystal structure of the materials. As can be seen from Fig. 1a, the three samples show two broadened diffraction peaks, which are centered at around 23° and 43°, assigned to the (002) and (100) crystallographic planes of carbon, showing their dominant features of amorphous carbon. The Raman spectra of the obtained samples are given in Fig. 1b. The D band (1350 cm−1) and G band (1546 cm−1), representing the disordered graphite structure and graphitic conjugated structure, can be observed clearly in the figure.26,27 Therefore, the ratio of relative intensity (ID/IG) represents the degree of disorder of graphitic carbon. The ID/IG values of BAC, PBAC and MCPBAC are 0.94, 0.90, and 0.86, respectively. The ID/IG value of PBAC is lower than that of BAC, because low-dosage H3PO4 cannot only etch the carbon framework and form more micropores, but also creates an ordered structure. Furthermore, the incorporation of heteroatoms into carbon atoms can increase the degree of defects on the surface of carbon, thus providing more active sites and improving the conductivity of carbon materials.28 In particular, the ball-milled carbon materials of the MCPBAC sample show a good degree of graphitization compared to PBAC, which is attributed to the production of graphitic structures at the edges.29N2 adsorption–desorption isotherms and pore size distributions for the BAC, PBAC, and MCPBAC samples are provided in Fig. 2 and all the parameters are summarized in Table 1. As shown in Fig. 2a, the three samples display a combination of type I and IV curves, suggesting that BAC, PBAC, and MCPBAC consist of micropore and mesopore characteristics according to the IUPAC classification.30 Notably, all the isotherms show a steep rise in the relatively low-pressure range, indicating the existence of a rich microporous structure in the three samples. The hysteresis loop of the three samples at a relative pressure between 0.4 and 0.85 shows the presence of some mesopores. Moreover, the almost vertical tail at high relative pressure (0.9–1.0) demonstrates the macroporous structure. The pore size distribution of the three samples is shown in Fig. 2b, with pore size distributions in the range of 0.4–4.0 nm and 20–50 nm. It can be concluded from Table 1 that the MCPBAC sample has higher values of SBET and total pore volume compared with BAC or PBAC, indicating that the combined activation (low-dosage H3PO4) of ball milling and the post-pyrolyzing effect can significantly increase the surface area and pore volume.31 The MCPBAC sample possesses a high SBET and a large total pore volume of 1617.54 m2 g−1 and 0.92 cm3 g−1, respectively. The phenomenon shows the synergistic effects of H3PO4 catalysis and ball milling, which significantly accelerate the plant cell swelling and chemical bond breakage, and finally form an activated carbon with a well-developed pore structure. Consequently, a high surface area and a hierarchical porous structure and a large volume definitely guarantee efficiency and convenience for enhancing the reaction area of the electrode and the diffusion channel of the analytes.
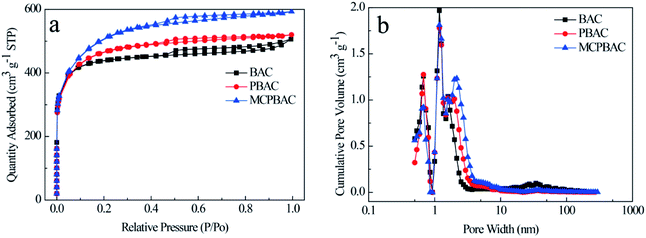 | ||
| Fig. 2 (a) N2 adsorption–desorption isotherms and (b) DFT pore size distribution of activated carbon samples. | ||
| Sample code | SBET (m2 g−1) | Total pore volume (cm3 g−1) | Micropore volume (cm3 g−1) | Mesopore volume (cm3 g−1) | Average pore diameter (nm)< |
|---|---|---|---|---|---|
| BAC | 1342.28 | 0.78 | 0.52 | 0.26 | 2.33 |
| PBAC | 1447.27 | 0.80 | 0.43 | 0.37 | 2.22 |
| MCPBAC | 1617.54 | 0.92 | 0.32 | 0.60 | 2.26 |
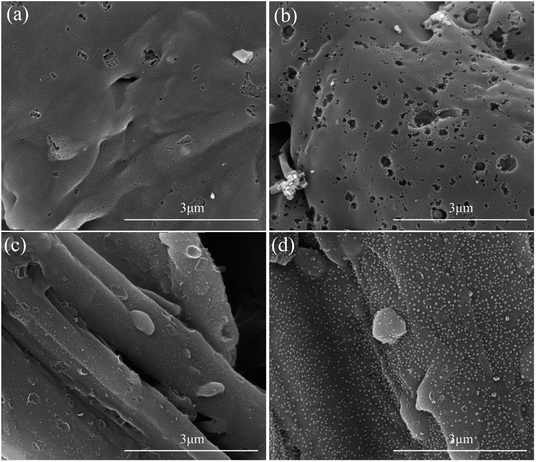
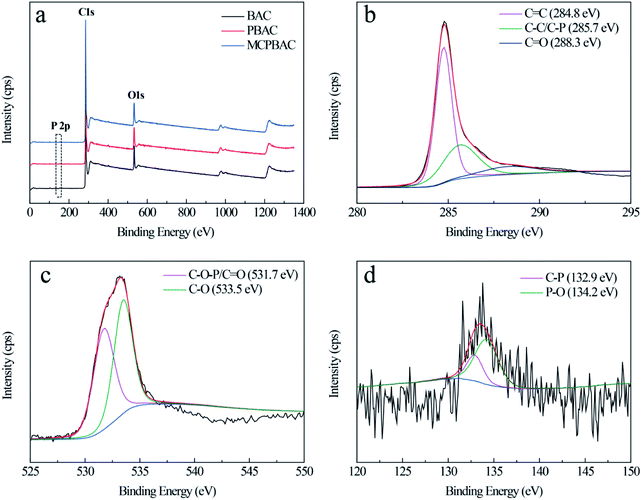
As can be seen from the SEM images in Fig. 3, the BAC sample is relatively smooth and without an obvious pore structure. With the H3PO4 activation effect, the PBAC sample has irregular wormhole structures. With the synergistic effect of mechanochemistry and low-dosage H3PO4, the MCPBAC sample shows an abundant and evenly distributed pore structure. Such a porous structure is beneficial to facilitating the adsorption of HQ and CC. XPS analysis was used for the surface chemical structures and components of the three samples (Fig. 4a). Obviously, the three strong signals identified at around 134.4, 284.8, and 533.3 eV were assigned to P 2p, C 1s, and O 1s peaks, respectively. The relative contents of C, P, and O can be found in Table 2. Compared with the BAC sample, the relative content of C and P for the PBAC sample increases, which may be related to low-dosage H3PO4. Simultaneously, H3PO4 may infiltrate into the plant fiber (bamboo powder) with a significant expansion of the plant fiber to form a phosphorous precursor, which can inhibit the formation of tar and protect the carbon skeleton.32 It should be noted that the P content of the MCPBAC sample is higher than that of the PBAC sample, suggesting that the shear force and friction force promote the movement of H3PO4 evenly into the plant fiber and P can easily enter into active sites, under the synergistic effect of mechanochemistry.
| Sample code | C (at%) | O (at%) | P (at%) |
|---|---|---|---|
| BAC | 89.52 | 10.34 | 0.14 |
| PBAC | 90.46 | 9.37 | 0.17 |
| MCPBAC | 88.4 | 11.4 | 0.2 |
The high-resolution spectrum for C 1s of the MCPBAC sample in Fig. 4b exhibits three peaks centered at 284.8, 285.7, and 288.3 eV, associated with the C![[double bond, length as m-dash]](https://www.rsc.org/images/entities/char_e001.gif) C, C–C/C–P, and C
C, C–C/C–P, and C![[double bond, length as m-dash]](https://www.rsc.org/images/entities/char_e001.gif) O peaks, respectively.33,34 The O 1s spectrum can be separated into two peaks at 531.7 and 533.5 eV, owing to C
O peaks, respectively.33,34 The O 1s spectrum can be separated into two peaks at 531.7 and 533.5 eV, owing to C![[double bond, length as m-dash]](https://www.rsc.org/images/entities/char_e001.gif) O/C–O–P and C–O, respectively.35 The high-resolution P 2p spectrum shows two peaks at 132.9 and 134.2 eV, corresponding to P–C and P–O.36 These results reflect the fact that most of the O and P functionalities on the MCPBAC sample surface, along with the porous structure with high surface area, demonstrate that MCPBAC is a considerable modifier of the electrode for electrochemistry.
O/C–O–P and C–O, respectively.35 The high-resolution P 2p spectrum shows two peaks at 132.9 and 134.2 eV, corresponding to P–C and P–O.36 These results reflect the fact that most of the O and P functionalities on the MCPBAC sample surface, along with the porous structure with high surface area, demonstrate that MCPBAC is a considerable modifier of the electrode for electrochemistry.
3.2 Electrochemical behaviors of dihydroxybenzene isomers on different electrode surfaces
The effects of mechanochemical and H3PO4 activation on the basic electrochemical performance of GCE, BAC/GCE, PBAC/GCE, and MCPBAC/GCE were studied in 5 mM [Fe(CN)6]4−/3− solution. As depicted in Fig. 5a, the redox peak separation (ΔEP) of [Fe(CN)6]4−/3− on MCPBAC/GCE is lower than that on the GCE, BAC/GCE, or PBAC/GCE. Conversely, the peak current of the [Fe(CN)6]4−/3− probe is higher. These results demonstrate that MCPBAC can facilitate the electron migration of [Fe(CN)6]4−/3− on the electrode/surface. The electroactive surface areas of the modified electrodes were calculated using the Randles–Sevcik equation:37| ipa = 2.69 × 10⁵n3/2AD1/2c0v1/2 | (1) |
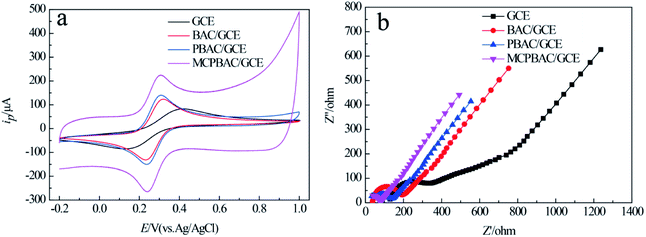 | ||
| Fig. 5 CVs (a) and EIS curves (b) of GCE, BAC/GCE, PBAC/GCE and MCPBAC/GCE in 5.0 mM K3Fe(CN)6/K4Fe(CN)6 solution containing 0.5 M KCl. Amplitude: 5 mV; frequency range: 0.01 Hz to 10 kHz. | ||
The electroactive surface areas for MCPBAC/GCE, PBAC/GCE, BAC/GCE and GCE are 0.19, 0.12, 0.10 and 0.07 cm2, respectively. This larger active surface area of MCPBAC/GCE will promote the electrocatalytic performance of MCPBAC/GCE. EIS was performed to estimate the electrode–electrolyte interface properties of GCE, BAC/GCE, PBAC/GCE, and MCPBAC/GCE, as shown in Fig. 5b. Compared with GCE, BAC/GCE, and PBAC/GCE, MCPBAC/GCE has a smaller intercept with the real axis at high frequency and a smaller arc size, showing that it has excellent conductivity. This result also shows that MCPBAC/GCE has the best electrical conductivity. In comparison with the BAC and PBAC samples, the MCPBAC sample has a much larger specific surface area and higher degree of graphitization. So, the excellent electrochemical activity of MCPBAC may be owing to its large specific surface with abundant pores and excellent electrical conductivity.38 In addition, P doping may increase the number of active sites and deliver enhanced electrochemical activity.39
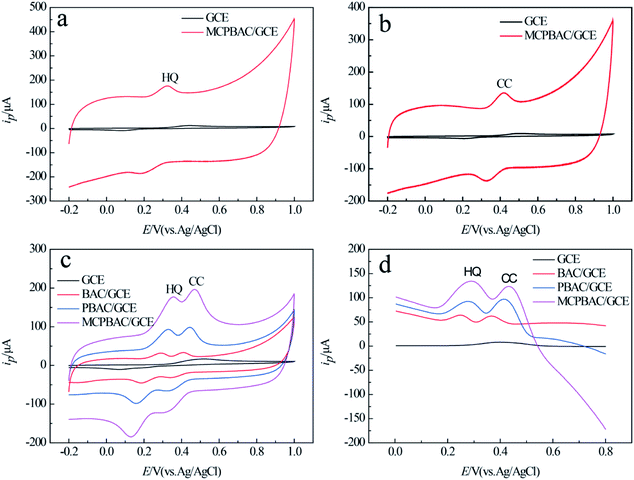
As shown in Fig. 6a and b, the anode peak currents of the two analytes on MCPBAC/GCE are 14.5 times and 12.7 times those on GCE, respectively. This shows that the two analytes have excellent electrochemical capability on MCPBAC/GCE. Fig. 6c displays the CV responses of different electrodes in a mixed solution of HQ and CC. As depicted in Fig. 6c, only one broad anode peak was noticed and GCE was unable to differentiate the two analytes. In contrast, the potentials of MCPBAC/GCE reveal two peaks at 0.358 V and 0.47 V for HQ and CC, respectively. The potential difference of the two analytes is 0.112 V, suggesting that MCPBAC/GCE can be effective in separating the two analytes. Simultaneously, compared with other modified electrodes, MCPBAC/GCE shows significant oxidation and reduction peaks. Fig. 6d shows the DPV responses of the electrochemical performance, where two detached anodic peaks for HQ and CC are centered at 0.288 V and 0.432 V for MCPBAC/GCE, respectively. Based on the current response of the two isomers, the DPV method is more sensitive than the CV method. Hence, MCPBAC/GCE integration with the DPV method has potential for the selective and simultaneous determination of the two isomers. The excellent electrochemical response can probably be ascribed to the synergistic effects of H3PO4 activation and ball milling. MCPBAC possesses not only a porous structure but also a large surface area. Furthermore, the presence of abundant hydroxyl and C–P active sites in MCPBAC accelerates the electron transfer rate and then HQ and CT can be easily adsorbed by or bonded with active electrons.40
3.3 Effects of scan rate, dropping amount and pH
The relationships between the scan rate and peak current/peak potential of the two analytes were examined at the MCPBAC/GCE by CV at various scan rates in mixed solutions of the two analytes (Fig. 7a). As the scanning rate increases, the anode peak potentials (Epa) of the two isomers move positively and the cathode peak potentials (Epc) move negatively. The potential changes between the anode peak and cathode peak increase. The faster the scan rates, the more significant the flux at the electrode surface. Therefore, it presents an internal resistance between the electrode and electrolyte interface, resulting in a shift in the redox peak potential of the two analytes. Meanwhile, both the anodic peak currents (Ipa) of the two analytes increase gradually with the square root of the scanning rate, as shown in Fig. 7a and b. These phenomena indicate that diffusion plays a decisive role in the electrode reaction process for the two analytes on the surface of MCPBAC/GCE.21,41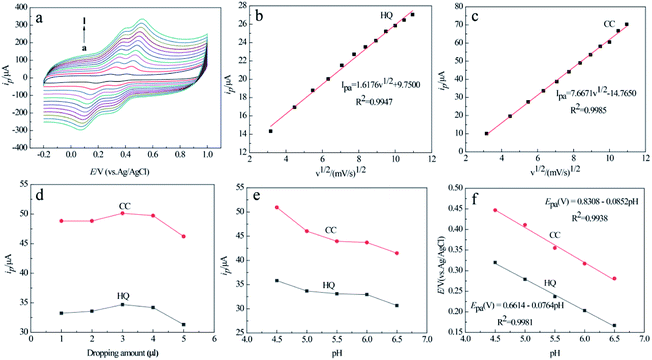 | ||
| Fig. 7 CVs of MCPBAC/GCE for various scan rates ranging from a → l: 10, 20, 30, 40, 50, 60, 70, 80, 90, 100, 110, 120 mV s−1 (a) and the corresponding plots of peak current vs. scan rate in (b and c). Effects of dropping amount (d) and pH (e) on anodic peak currents and anodic peak potentials (f) of HQ and CC. Dropping amounts: 1, 2, 3, 4, 5 μL; pH value: 4.5, 5.0, 5.5, 6.0, 6.5, respectively; concentration of HQ: 0.1 mM, concentration of CC: 0.1 mM; other electrochemical conditions are the same as in Fig. 6. | ||
The effect of dropping amount on the current response of the two isomers was monitored at MCPBAC/GCE by CV analysis in mixed solutions of the two analytes (Fig. 7d). The anode peak currents of the two analytes first rise and then fall with an increase in the dropping amounts. When the dropping amount is 3.0 μL, the peak currents of the two analytes reach a maximum. However, when the dropping amount exceeds 3.0 μL, they go down instead. With an increase in dropping amounts, the number of catalytically active sites on the surface of MCPBAC/GCE increases, increasing the peak currents. When the dropping amounts are too large, thick films can block the transmission of electrons, leading to a decline in the peak current. Therefore, the optimal dropping amount is selected as 3.0 μL.
Due to the weak acidity of the phenolic hydroxyl group, hydroxyl aromatic compounds often combine with protons to form quinone.42 Consequently, the pH value of the buffer solution is a significant factor for determining the peak current and potential of the two analytes. The relationships between solution pH and the response of the two analytes at the MCPBAC/GCE electrode were examined, as depicted in Fig. 7e. The peak currents of the two analytes gradually decrease with an increase in pH, and the maximum peak currents occur at pH 4.5. The phenomenon is due to MCPBAC/GCE being able to attract HQ and CC thanks to the effects of π–π conjugation and hydrogen bond forces.43 Under low pH conditions, the surface of the MCPBAC/GCE electrode was protonated. The surface protonation hinders the π–π conjugation between the MCPBAC/GCE surface and the phenolic hydroxyl of the two analytes, which shields the adsorption active sites and decreases the approach of the two analytes by clogging the entrances of the micropores.44 Moreover, as illustrated in Fig. 7f, the relation between Epa and pH can be expressed as Epa (V) = 0.6614–0.0764 pH (R2 = 0.9981) and Epa (V) = 0.8308–0.0852 pH (R2 = 0.9938) for the two analytes, respectively. It follows that protons are introduced in the redox process of the two analytes at MCPBAC/GCE.
3.4 Selective/simultaneous determination of HQ and CC
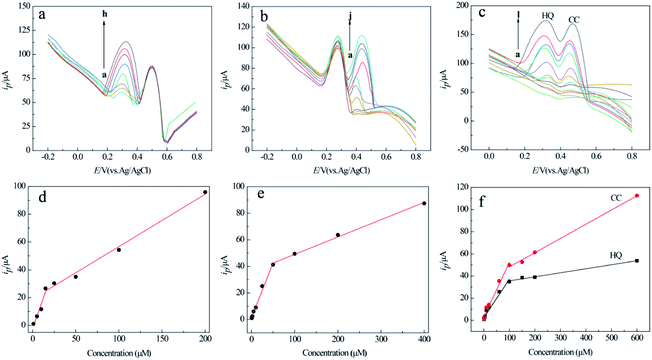
Under the optimized conditions, the selective and simultaneous determination of the two analytes at MCPBAC/GCE was examined by the DPV method. The selective determination of the two analytes in a mixed solution of the two compounds was studied by altering one analyte concentration, and holding the other analyte concentration constant. Fig. 8a–d demonstrate the linear relationship between the two analyte concentrations and their respective peak currents in HQ or CC solutions with a base concentration of 0.1 mM for HQ or CC. The linear regression equations among the peak currents with concentration are given in Table 3.Simultaneous determination of the two analytes was investigated via synchronously transforming the concentration of the two analytes in their mixed solution. The consequences are indicated in Fig. 8c and f, where the peak currents along with the concentration for the two analytes express two different linear responses in the low-concentration and high-concentration range. This result may be attributed to the bio-molecules that are adsorbed on the electrode surface in low-concentration ranges.45 The linear regression equations among peak currents with concentration are given in Table 4.
| Analyte | Linear range (μM) | Regression equations iP (μA), C (μM) | R 2 | Detection limit (μM) |
|---|---|---|---|---|
| HQ | 0.6–100 | i P = 0.3484C + 2.3174 | 0.9905 | 0.2 |
| 100–600 | i P = 0.0364C + 32 | 0.9909 | ||
| CC | 0.6–100 | i P = 0.494C + 2.8262 | 0.983 | 0.2 |
| 100–600 | i P = 0.1284 + 35.385 | 0.9972 |
The detection limits of the two isomers were both 0.2 μM at S/N = 3. These results are better than those previously researched in the literature (Table 5). This phenomenon reveals that simultaneous examination of the two analytes by MCPBAC/GCE can be realized with lower detection limits and higher sensitivity.
| Modified electrode | Linear range (μM) | Detection limit (μM) | Ref. | ||
|---|---|---|---|---|---|
| HQ | CC | HQ | CC | ||
| N-doped porous carbon/GCE | 1–120 | 1–200 | 1 | 1 | 46 |
| PIL-MCNs/CS/GCE | 10–350 | 10–400 | 1.39 | 0.62 | 47 |
| MIL-101(Cr)-rGO-2/CPE | 4–1000 | 10–1400 | 0.66 | 4 | 48 |
| CFG/GCE | 1–190 | 5–250 | 0.2 | 0.6 | 49 |
| NCNF/GCE | 1–400 | 1–400 | 0.3 | 0.4 | 50 |
| CNCs-RGO/GCE | 1–300 | 1–400 | 0.87 | 0.4 | 51 |
| MCPBAC/GCE | 0.6–100 | 0.6–100 | 0.2 | 0.2 | This work |
| 100–600 | 100–600 | ||||
Under optimal conditions, the repeatability of five different MCPBAC/GCE electrodes for the continuous determination of 0.1 mM HQ and 0.1 mM CC was studied. The RSDs of the peak currents were 2.8% (HQ) and 4.3% (CC). The stability of MCPBAC/GCE was also studied. MCPBAC/GCE was stored in 4 °C refrigerators for four weeks, and the peak currents retained 91.2% for HQ and 93.1% for CC of the initial values. It can be seen from the results of the final anti-interference experiment that the addition of 100-fold concentrations of Mg2+, K+, NO3−, and Cl−, and 30-fold concentrations of ascorbic acid, resorcin, p-nitrophenol, and phenol did not produce necessary interference (the variation in peak current < 5%) to the analyte measurement results. The above results showed that MCPBAC/GCE had very good stability, reproducibility and selectivity towards the determination of the two isomers.
To assess the practical application of MCPBAC/GCE, a lake water sample from Guanyin lake (Fujian Agriculture and Forestry University) was researched for quantitative analysis through the standard addition method. As can be discovered in Table 6, the recoveries are 90.43–97.36% and 90.21–96.03% for HQ and CC, respectively. These analyses demonstrate that MCPBAC/GCE shows practical applicability, repeatability, stability, and selectivity for the simultaneous determination of HQ and CC.
| Sample no. | Add (μmol L−1) | Found (μmol L−1) | Recovery (%) | RSD (%) | ||||
|---|---|---|---|---|---|---|---|---|
| HQ | CC | HQ | CC | HQ | CC | HQ | CC | |
| 1 | 1.0 | 1.0 | 0.9 | 0.9 | 90.43 | 90.21 | 4.6 | 4.2 |
| 2 | 90.0 | 90.0 | 87.3 | 85.4 | 97.36 | 94.80 | 1.7 | 1.5 |
| 3 | 110.0 | 110.0 | 106.9 | 106.6 | 97.16 | 96.03 | 3.1 | 3.3 |
| 4 | 500.0 | 500.0 | 465.8 | 475.6 | 93.15 | 95.32 | 3.7 | 3.8 |
4. Conclusions
In summary, the preparation process of MCPBAC is simple, green and environmentally protective. MCPBAC has good adsorption capacity for electrolytes and excellent conductivity, so that an MCPBAC/GCE sensor can realize the high resolution and sensitive determination of two kinds of pollutants in environmental water samples. The sensor not only has good stability, but also has strong anti-interference ability. In addition, based on the excellent electrochemical performance of MCPBAC, it is expected to be used as the electrode material of a supercapacitor and expand its application in the field of new energy.Author contributions
Xuan Yang: writing – original draft, software. Chenlu He: data curation, methodology. Yu Lin: data curation, formal analysis. Yijuan Qiu: conceptualization, investigation. Pengfei Li: funding acquisition, resources. Yandan Chen: funding acquisition, project administration. Biao Huang: visualization, investigation, funding acquisition. Xinyu Zheng: writing – review & editing, methodology, validation.Conflicts of interest
The authors have no conflicts of interest to declare.Acknowledgements
This work was supported by the National Natural Science Foundation of China (No. 31770611, 31870561); Guangxi Collaborative Innovation Center for Chemistry and Engineering of Forest Products (No. GXFK2007).Notes and references
- S. Y. Lu, M. Jin, Y. Zhang, Y. B. Niu, J. C. Gao and C. M. Li, Adv. Energy Mater., 2018, 8, 1702545 CrossRef.
- W. S. Chai, J. Y. Cheun, P. S. Kumar, M. Mubashir, Z. Majeed, F. Banat, S.-H. Ho and P. L. Show, J. Cleaner Prod., 2021, 126589 CrossRef CAS.
- Y. Wang, C. Peng, E. Padilla-Ortega, A. Robledo-Cabrera and A. López-Valdivieso, J. Environ. Chem. Eng., 2020, 8, 104031 CrossRef CAS.
- C. Yang, Y. Wang, H. Fan, G. de Falco, S. Yang, J. Shangguan and T. J. Bandosz, Appl. Catal., B, 2020, 266, 118674 CrossRef CAS.
- A. Wang, K. Sun, R. Xu, Y. Sun and J. Jiang, J. Cleaner Prod., 2021, 283, 125385 CrossRef CAS.
- Z. Lu, H. Zhang, A. Shahab, K. Zhang, H. Zeng, I. Nabi and H. Ullah, J. Cleaner Prod., 2021, 303, 127046 CrossRef CAS.
- W. C. Lim, C. Srinivasakannan and A. Al Shoaibi, J. Cleaner Prod., 2015, 102, 501–511 CrossRef CAS.
- S. Zuo, J. Yang, J. Liu and X. Cai, Fuel Process. Technol., 2009, 90, 994–1001 CrossRef CAS.
- S. Zuo, J. Liu, J. Yang and X. Cai, Carbon, 2009, 47, 3578–3580 CrossRef CAS.
- S. Zuo, J. Yang and J. Liu, Carbon, 2010, 48, 3293–3295 CrossRef CAS.
- Q. Lu, W. Lin, L. Tang, S. Wang, X. Chen and B. Huang, J. Mater. Sci., 2015, 50, 611–619 CrossRef CAS.
- Q. Lu, Z. Cai, F. Lin, L. Tang, S. Wang and B. Huang, ACS Sustainable Chem. Eng., 2016, 4, 2165–2172 CrossRef CAS.
- I. N. Egorov, S. Santra, D. S. Kopchuk, I. S. Kovalev, G. V. Zyryanov, A. Majee, B. C. Ranu, V. L. Rusinov and O. N. Chupakhin, Green Chem., 2020, 22, 302–315 RSC.
- F. Shen, X. Xiong, J. Fu, J. Yang, M. Qiu, X. Qi and D. C. Tsang, Renewable Sustainable Energy Rev., 2020, 130, 109944 CrossRef CAS.
- P. Satyamurthy, P. Jain, R. H. Balasubramanya and N. Vigneshwaran, Carbohydr. Polym., 2011, 83, 122–129 CrossRef CAS.
- N. Balahmar, A. C. Mitchell and R. Mokaya, Adv. Energy Mater., 2015, 5, 1500867 CrossRef.
- C. X. Chen, B. Huang, T. Li and G. F. Wu, BioResources, 2012, 7, 5109–5116 CAS.
- S. C. Hu, J. Cheng, W. P. Wang, G. T. Sun, L. L. Hu, M. Q. Zhu and X. H. Huang, Renewable Energy, 2021, 117, 82–94 CrossRef.
- J. Wang, J. Yang, P. Xu, H. Liu, L. Zhang, S. Zhang and L. Tian, Sens. Actuators, B, 2020, 306, 127590 CrossRef CAS.
- L. Huang, Y. Cao and D. Diao, Sens. Actuators, B, 2020, 305, 127495 CrossRef CAS.
- M. Velmurugan, N. Karikalan, S. M. Chen, Y. H. Cheng and C. Karuppiah, J. Colloid Interface Sci., 2017, 500, 54–62 CrossRef CAS PubMed.
- J. Gao, J. Fang, X. Ju, W. Zhu, X. Lin, S. Zhang, C. Ma and H. Song, ACS Appl. Mater. Interfaces, 2017, 9, 38802–38813 CrossRef CAS PubMed.
- Y. Yang, Q. Wang, W. Qiu, H. Guo and F. Gao, J. Phys. Chem. C, 2016, 120, 9794–9803 CrossRef CAS.
- H. Huang, Y. Chen, Z. Chen, J. Chen, Y. Hu and J. J. Zhu, J. Hazard. Mater., 2021, 416, 125895 CrossRef CAS PubMed.
- M. A. Prathap, B. Satpati and R. Srivastava, Sens. Actuators, B, 2013, 186, 67–77 CrossRef.
- K. Zou, Y. Deng, J. Chen, Y. Qian, Y. Yang, Y. Li and G. Chen, J. Power Sources, 2018, 378, 579–588 CrossRef CAS.
- T. Ouyang, K. Cheng, F. Yang, J. Jiang, J. Yan, K. Zhu, K. Ye, G. Wang, L. Zhou and D. Cao, Chem. Eng. J., 2018, 335, 638–646 CrossRef CAS.
- G. Lin, Q. Wang, X. Yang, Z. Cai, Y. Xiong and B. Huang, RSC Adv., 2020, 10, 17768–17776 RSC.
- X. Lin, Y. Liang, Z. Lu, H. Lou, X. Zhang, S. Liu, B. Zheng, R. Liu, R. Fu and D. Wu, ACS Sustainable Chem. Eng., 2017, 5, 8535–8540 CrossRef CAS.
- D. Wang, G. Fang, T. Xue, J. Ma and G. Geng, J. Power Sources, 2016, 307, 401–409 CrossRef CAS.
- R. Rajendiran, M. Nallal, K. H. Park, O. L. Li, H.-J. Kim and K. Prabakar, Electrochim. Acta, 2019, 317, 1–9 CrossRef CAS.
- L. Guanfeng, K. K. WU and B. Huang, Mater. Sci., 2018, 24, 362–366 Search PubMed.
- S. Xiong, J. Fan, Y. Wang, J. Zhu, J. Yu and Z. Hu, J. Mater. Chem. A, 2017, 5, 18242–18252 RSC.
- R. Li, Z. Wei and X. Gou, ACS Catal., 2015, 5, 4133–4142 CrossRef CAS.
- W. Yang, W. Yang, L. Kong, A. Song, X. Qin and G. Shao, Carbon, 2018, 127, 557–567 CrossRef CAS.
- J. Chen, H. Wei, H. Chen, W. Yao, H. Lin and S. Han, Electrochim. Acta, 2018, 271, 49–57 CrossRef CAS.
- N. Karikalan, R. Karthik, S.-M. Chen, M. Velmurugan and C. Karuppiah, J. Colloid Interface Sci., 2016, 483, 109–117 CrossRef CAS PubMed.
- X. Zheng, R. Fan, Y. Hu, H. Zhong, X. Yang, R. Lv, X. Yang and B. Huang, Mater. Chem. Phys., 2020, 242, 122525 CrossRef CAS.
- Y. Liu, R. Xie, X. Zou, J. Liu, Z. Wu, C. Peng and P. Zhao, J. Electrochem. Soc., 2021, 168, 017514 CrossRef CAS.
- R. Huang, D. Liao, S. Chen, J. Yu and X. Jiang, Sens. Actuators, B, 2020, 320, 128386 CrossRef CAS.
- L. Fan, X. Li and X. Kan, Electrochim. Acta, 2016, 213, 504–511 CrossRef CAS.
- H. Yin, Q. Ma, Y. Zhou, S. Ai and L. Zhu, Electrochim. Acta, 2010, 55, 7102–7108 CrossRef CAS.
- P. Peng, Y. H. Lang and X. M. Wang, Ecol. Eng., 2016, 90, 225–233 CrossRef.
- K. László, E. Tombácz and C. Novák, Colloids Surf., A, 2007, 306, 95–101 CrossRef.
- A. M. Oliveira-Brett, L. A. d. Silva and C. M. Brett, Langmuir, 2002, 18, 2326–2330 CrossRef CAS.
- M. Zhang, M. Li, W. Wu, J. Chen, X. Ma, Z. Zhang and S. Xiang, New J. Chem., 2019, 43, 3913–3920 RSC.
- Y. Song, Y. Zhang, J. Li, C. Tan and Y. Li, J. Electroanal. Chem., 2020, 865, 114157 CrossRef CAS.
- H. Wang, Q. Hu, Y. Meng, Z. Jin, Z. Fang, Q. Fu, W. Gao, L. Xu, Y. Song and F. Lu, J. Hazard. Mater., 2018, 353, 151–157 CrossRef CAS PubMed.
- Y. Li, S. Feng, Y. Zhong, Y. Li and S. Li, Electroanalysis, 2015, 27, 2221–2229 CrossRef CAS.
- J. Huang, X. Zhang, L. Zhou and T. You, Sens. Actuators, B, 2016, 224, 568–576 CrossRef CAS.
- Y. H. Huang, J. H. Chen, X. Sun, Z. B. Su, H. T. Xing, S. R. Hu, W. Weng, H. X. Guo, W. B. Wu and Y. San He, Sens. Actuators, B, 2015, 212, 165–173 CrossRef CAS.
| This journal is © The Royal Society of Chemistry 2022 |

