A ratiometric fluorescent sensor made of a terbium coordination polymer for the anthrax biomarker 2,6-dipicolinic acid with on-site detection assisted by a smartphone app†
Miao-Miao
Qiu
a,
Ke-Fu
Chen
b,
Qi-Rui
Liu
a,
Wei-Ni
Miao
c,
Bing
Liu
 *a and
Ling
Xu
 *c
*c
aCollege of Chemistry and Chemical Engineering, Shaanxi Key Laboratory of Chemical Additives for Industry, Shaanxi University of Science and Technology, Xi'an 710021, Shaanxi Province, P. R. China. E-mail: liubing@sust.edu.cn
bCollege of Information Engineering, Henan University of Science and Technology, Luoyang 471000, Henan Province, P. R. China
cKey Laboratory of Macromolecular Science of Shaanxi Province, Shaanxi Key Laboratory for Advanced Energy Devices, Shaanxi Engineering Laboratory for Advanced Energy Technology, School of Chemistry & Chemical Engineering, Shaanxi Normal University, Xi'an 710062, Shaanxi Province, P. R. China. E-mail: xuling@snnu.edu.cn
First published on 9th November 2021
Abstract
A ratiometric fluorescence sensor consisting of [Tb(NDBC)(COO)] (Tb-NDBC) shows high sensitivity and selectivity during DPA detection in natural lake water and human serum samples. A self-programmed smartphone app can calculate the DPA concentration by reading green values, realizing on-site DPA detection.
Introduction
Anthracnose is a severe infectious disease caused by the pathogen Bacillus anthracis, showing high biological threat and harm.1 Anthrax spores have very high resistance to the environment, including heat, drying, radiation, and chemical disinfectants. Anthrax has high fatality, infection rates, and a short time window for treatment.2,3 The mortality rate is up to 75% without effective treatment within 24 to 48 h if organisms inhale only 1 × 10⁴ anthrax spores. Therefore, the reliable analysis of hazardous anthrax spores in potentially contaminated soil, air, water and other suspicious items,4 especially by on-site detection, plays a vital role in avoiding possible loss. Many detection methods for anthrax spores, such as polymerase chain reaction, immunoassay, nucleic acid test, aptamer, peptide nucleic acid, gene sequencing, and fingerprint analysis, have drawbacks of high requirements in instruments and a detection environment of biosafety level II.5 This causes a lot of difficulties in applications of these detection methods in the laboratory and on-site detection.2,6-Dipicolinic acid (DPA) is a special component in anthrax spores, which cannot be found in other bacteria.6 DPA can be regarded as the biomarker of anthrax spores, whose detection effectively decreases the difficulty and risk in the detection of anthrax spores. Thus, a sensitive, rapid, reusable, portable and cost-effective DPA detection method is of significance in the fields of bio-terrorism, homeland security and environmental protection. The development of DPA detection methods has been carried out for decades, covering fluorescence, electrochemical assays, surface enhanced Raman spectroscopy, high-pressure liquid chromatography, mass spectrometry etc.7–10 However, sample preparation and time/cost consumption are holding back their applications. Among the spectral methods, fluorescence has the advantages of high sensitivity, high specificity, simplicity and low cost. Its sensitivity is 10–1000 times greater than absorbance measurement. It is highly valuable as a quantitative and qualitative analytical tool. Metal–organic frameworks (MOFs) or coordination polymers (CPs), especially lanthanide MOFs (Ln-MOFs),11–14 display the characteristics of high color purity, a narrow emission band, and long lifetime.15–17 The fluorescence of Ln-MOFs can be adjusted by the selection of metal centers and ligands. The luminescence process of Ln-MOFs contains an energy transfer from ligand antenna to lanthanide centers. This energy transfer can be disturbed by some substance, exhibiting specialized fluorescence changes to the substance, and thus realize the recognition of the substance.18 Ln-MOFs with dual-luminescence centers, integrating luminescent centers and chromophoric sensitizers in a single molecular system, show color tunability and self-calibration.19–21 With one center as the reference emission and the other as the working emission, dual central Ln-MOFs can achieve the ratiometric fluorescent detection of a specific object.
In the design of a ratiometric fluorescence sensor, the ligand plays a key role. As an energy antenna, the ligand can easily be excited at a certain energy level, and transfer the excited energy to target a lanthanide center. 2,6-Naphthalene dicarboxylic acid (H2NDBC) was selected as an organic linker with the naphthalene ring as the chromophore and two pairs of carboxylic groups to grasp the lanthanide centers. H2NDBC and the object of DPA have different impacts on the luminescent lanthanide center, resulting in different fluorescent responses to monitor the analysis of DPA.
Herein, H2NDBC reacted with Tb3+ under hydrothermal conditions to construct an Ln-MOF, [Tb(NDBC)(COO)] (Tb-NDBC). Tb-NDBC was characterized by single crystal X-ray diffraction, powder X-ray diffraction (PXRD), fluorescence, thermal gravimetric analysis (TGA), etc. The factors of solvents, response time, pH, and MOF dosage on DPA detection performance were explored and optimized. Sensitivity and selectivity tests demonstrated that Tb-NDBC was a ratiometric fluorescence sensor for DPA with high sensitivity and selectivity. Its detection performance behaves well in the detection environments of natural lake water and human serum. A paper-based sensor made of Tb-NDBC displayed visible emission color conversions. The green values (G) can be read by a self-programmed smartphone app and the calculated DPA concentration can be returned by an input linear equation, realizing digital visualized portable on-site DPA detection.
Experimental
Materials and methods
All chemicals were used as obtained from the manufacturer without further purification. Raw chemicals including Tb(NO3)3·6H2O (A.R.), NaOH (A.R.), HCl (A.R.), N,N-dimethylformamide (DMF) and absolute ethanol were purchased from Sinopharm Chemical Reagent Co., Ltd. (Shanghai, China). H2NDBC (A.R.), and DPA (A.R.) were received from Sigma-Aldrich (Shanghai, China). Benzoic acid (Ben), barbituric acid (Ba), asparagine (Asn), pyroglutamic acid (PGlu), glutamic acid (Glu), glucose (Glc), tryptophan (Trp), cysteine (Cys), arginine (Arg), histidine (His), lysine hydrochloride (Lys·HCl), methionine (Met), serine (Ser), and glycine (Gly) were purchased from Hanbo Co., Ltd. (Shenzhen, China). Deionized water was obtained from a VE-A water purifier (Hongsen Environmental Technology Co., Ltd., Shenzhen, China).PXRD data for Tb-NDBC was collected at ambient temperature on a Rigaku D/Max-3c (Japan) diffractometer (Cu-Kα1,2 X-radiation, λ1 = 1.540598 Å and λ2 = 1.544426 Å), equipped with an X'Celerator detector and a flat-plate sample holder in a Bragg–Brentano para-focusing optics configuration (40 kV, 15 mA). Intensity data was collected by the step counting method (the step being 0.02°) in continuous mode in the range 3° ≤ 2θ ≤ 60°. Fluorescence spectra were performed on a Hitachi F-7000 fluorescence spectrophotometer with the excitation and emission slits set at 10 nm. An Edinburgh FLS 920 fluorescence spectrophotometer with a 150 W microsecond pulsed lamp as the excitation source was employed to record the fluorescence lifetimes of Tb-NDBC powders with or without DPA at ambient temperature. TGA was carried out under an N2 atmosphere on an SDT Q600 V8.3 Build 101 instrument with a heating rate of 10 °C min−1 and an N2 flow rate of 20 cm3 min−1. The pH values of Tb-NDBC suspensions adjusted by NaOH or HCl solutions were measured on a FiveEasy™ pH meter (Mettler Toledo, Switzerland). The centrifugal separations were performed with a TGL-16c high-speed centrifuge.
Synthesis of [Tb(NDBC)(COO)]
0.20 mmol, 0.0906 g of Tb(NO3)3·6H2O and 0.60 mmol, 0.1297 g of H2NDBC were placed in a crystallisation vial placed in a 25 mL Teflon-lined stainless-steel autoclave and mixed with 5 mL of H2O and 5 mL of DMF. The mixture was kept in a furnace at 150 °C for 4 d, and then naturally cooled to ambient temperature. The colorless crystals were manually collected after cleaning with ethanol and dried at 60 °C for 4 h. Yield based on Tb: 0.0622 g, 74.56%.Crystal structure determination
Single crystals of Tb-NDBC were manually harvested from the crystallisation vials and mounted on Hampton Research CryoLoops using FOMBLIN Y perfluoropolyether vacuum oil with the help of a Stemi 2000 stereomicroscope equipped with Carl Zeiss lenses. Data was collected on a Bruker D8 Quest CCD diffractometer equipped with a graphite-monochromated Cu-Kα1,2 radiation source (λ1 = 1.540598 Å and λ2 = 1.544426 Å) at 120 K and reduced using the ω scan technique and the Bruker XSCANS program. The crystal structure of Tb-NDBC was solved by using direct methods with the SHELXL-2014/7 package of crystallographic software and refined using the full-matrix least-squares technique on F2.22 All non-hydrogen atoms were refined anisotropically and hydrogen atoms were located at geometrically calculated positions relative to their carrier atoms and refined with isotropic thermal parameters included in the final stage of the refinement.Crystallographic data (excluding structure factors) for Tb-NDBC reported in this paper have been deposited with the Cambridge Crystallographic Data Center (deposition CCDC number: 2090950).
Topology
According to A. F. Wells' topology definition23 and the MOF structural features, the [Tb2(COO)2] subunit and NDBC2− ligand were respectively simplified as 12- and 3-connecting nodes and the topological network of Tb-NDBC was calculated using the ADS program of the TOPOS 4.0 professional structure-topological program package.24Determination of DPA detection conditions
2 mg of Tb-NDBC was suspended in 2.7 mL of water at pH = 1–14 with 2 min of ultrasonic vibration; then their liquid fluorescence spectra were performed at ambient temperature as blank samples. To the aforementioned 2.7 mL Tb-NDBC suspensions, 0.3 mL of 1 mM DPA aqueous solution was dropped in and ultrasonically vibrated for 2 min and left standing for 5 min, whose liquid fluorescence was studied.
DPA detection
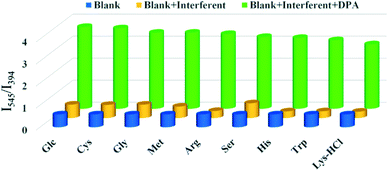
1.8 mg of Tb-NDBC was suspended in 2.4 mL of water with 2 min of ultrasonic vibration and the pH was adjusted to 7.35. 0.3 mL of 1 mM aqueous solutions of nine amino acids—Glc, Cys, Gly, MET, Arg, Ser, His, Trp and LYS·HCl—were dropped into the Tb-NDBC suspensions with 2 min of ultrasonic vibration and standing for 5 min. Their fluorescence spectra were characterized as contrast samples and Tb-NDBC suspension as the blank sample. 0.3 mL of 1 mM DPA solution was dropped into the above Tb-NDBC/amino acid suspensions with 2 min of ultrasonic vibration and standing for 5 min; then fluorescence measurements were performed.
![[thin space (1/6-em)]](https://www.rsc.org/images/entities/char_2009.gif) 000 rpm for 1 h. 2.7, 2.4, and 2.1 mL supernatants of human serum were extracted, and respectively mixed with 1.8 mg of Tb-NDBC in three test tubes. Then 0.3, 0.6, and 0.9 mL of 1 mM DPA solutions were dropped into the test tubes to get 100, 200, and 300 μM DPA, respectively, with 2 min of ultrasonic vibration and standing for 5 min. Photos were taken under 365 nm UV light. The fluorescence spectra of the samples were taken three times at ambient temperature.
000 rpm for 1 h. 2.7, 2.4, and 2.1 mL supernatants of human serum were extracted, and respectively mixed with 1.8 mg of Tb-NDBC in three test tubes. Then 0.3, 0.6, and 0.9 mL of 1 mM DPA solutions were dropped into the test tubes to get 100, 200, and 300 μM DPA, respectively, with 2 min of ultrasonic vibration and standing for 5 min. Photos were taken under 365 nm UV light. The fluorescence spectra of the samples were taken three times at ambient temperature.
Natural water was taken from the lake in Shaanxi University of Science and Technology. The lake water was pretreated by 20 min centrifugal separation at 10![[thin space (1/6-em)]](https://www.rsc.org/images/entities/char_2009.gif) 000 rpm, followed by filtration with 0.22 μm separating film to remove insoluble impurities. We performed similar processes to DPA detection in human serum except with lake water replacing the human serum, including sample preparation, fluorescence measurements and photography.
000 rpm, followed by filtration with 0.22 μm separating film to remove insoluble impurities. We performed similar processes to DPA detection in human serum except with lake water replacing the human serum, including sample preparation, fluorescence measurements and photography.
Results and discussion
Structural description
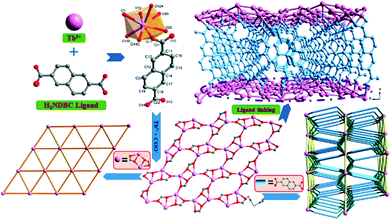
The hydrothermal reaction of Tb(NO3)3·6H2O with H2NDBC gave Tb-NDBC. Its single crystals were collected and analyzed with structural determination and refinement details, and selected bond distances and angles listed in the ESI† (Tables S1 and S2). The single crystal X-ray diffraction of Tb-NDBC indicates that the asymmetrical unit contains one Tb(III) center, one NDBC2− ligand, and one carboxylate anion (COO−). COO− comes from the decarboxylation reaction of H2NDBC at 150 °C. The decarboxylation of aromatic acids is relatively easy, because the aromatic ring as an electron-withdrawing group is conducive to the fracture of the C–C bond. Then the detached HCOO groups are deprotonated as COO− coordinating with metal centers.25,26 In this case, the Tb(III) center binds eight carboxylic oxygen atoms to shape a dodecahedron (Fig. 1). COO− adopts the μ3-bis-monocarboxylic bridging mode to bind three Tb(III) centers: each COO− chelates with one Tb(III) and links each other with O2 into a Tb2(COO)2 subunit (ESI,† Fig. S1); these Tb2(COO)2 subunits interconnect into 2D lattice-like layers along the bc-plane with the linkage of O1 (Fig. 1). The 2D layers were simplified into a topological hxl/Shubnikov (3,6) plane or {36·46·53} point symbol with Tb2(COO)2 subunits dummied by 6-connecting nodes. The two carboxylate groups in an NDBC2− ligand bridge three Tb2(COO)2 subunits (ESI,† Fig. S2): the carboxylate (O11–C17–O12) seizes two Tb(III) centers in the same Tb2(COO)2 subunit; the other carboxylate (O13–C18–O14) grasps two Tb(III) in two separate Tb2(COO)2 subunits. Based on this connection mode, the NDBC2− ligand bridges the neighboring 2D layers into a 3D framework (Fig. 1). To simplify the 3D framework, the [Tb2(COO)2] subunit and the NDBC2− ligand were dummied as 12- and 3-connecting nodes, respectively. The point symbol of 3D architecture was calculated as {310·416·521·616·72·8} for [Tb2(COO)2] and {3·4·5} for the NDBC2− ligand. Therefore, the overall topological structure of Tb-NDBC can be topologized as a 3,12-connected 2-nodal {3·4·5}2{310·416·521·616·72·8} network.Phase purity and thermal stability of Tb-NDBC
The phase purity of bulk Tb-NDBC was characterized by PXRD at ambient temperature. The experimental PXRD pattern of Tb-NDBC matches very well with the simulated one from the single crystal structure data. This indicates that the bulk Tb-NDBC sample was isolated with high phase purity (ESI,† Fig. S3).The thermal stability of Tb-NDBC was evaluated by TGA. Overall, Tb-NDBC shows high thermal stability. Its TG curve indicates that Tb-NDBC remains stable up to 297 °C (ESI,† Fig. S4). There are three major weight losses, as follows: 5.21% in 297–477 °C, 11.13% in 477–527 °C, and 23.75% in 527–651 °C. These major weight losses are attributed to the simultaneous loss of some COO− and NDBC2− ligands. The first two weight losses deviated from the calculated losses of COO− or NDBC2−, but the residual weight was 60.09%, close to the calculated 56.15% by assuming the residue to be Tb2O3.
Stabilities of Tb-NDBC in organic solvents and water, and at different pH levels
5 mg of Tb-NDBC was immersed in twelve kinds of organic solvents for 48 h: strong polar dimethyl sulfoxide (DMSO), N,N-dimethylformamide (DMF), dimethylacetamide (DMAC), mid-/weak polar acetonitrile, acetone, pyridine, chloroform, ethyl acetate, ethanol, tetrahydrofuran (THF), dichloromethane, and non-polar petroleum ether (ESI,† Fig. S5). As shown, Tb-NDBC in these solvents did not show any changes in PXRD, indicating the high stability of Tb-NDBC in organic solvents. Also, when 5 mg of Tb-NDBC was immersed in water for 1–24 h, and even if the immersion time was prolonged to 48 h, the PXRD patterns remained unchanged, showing the high water-stability of Tb-NDBC (ESI,† Fig. S6).To investigate the acid and alkali resistance of Tb-NDBC, 5 mg of Tb-NDBC was immersed in HCl or NaOH aqueous solutions with pH adjusted to 1–14 for 24 h (ESI,† Fig. S7). At pH = 1–13, the PXRD patterns of Tb-NDBC did not change; but at pH = 14, the XRD diffraction peak nearly disappeared. All the diffraction intensity of Tb-NDBC decreased greatly depending on the increase in pH, which is in accordance with the amorphization of the crystals. This also indicated that Tb-NDBC had higher resistance to acid than to alkali. For the following DPA detection, 0.3 mL of 1 mmol L−1 (mM) DPA aqueous solution was diluted to 3 mL, mixed with 5 mg of Tb-NDBC and kept for 48 h. The unchanged PXRD pattern suggests that the introduced DPA did not change the structure of Tb-NDBC (ESI,† Fig. S6). Overall, the high structural stability of Tb-NDBC in organic solvents, water with different pH, and DPA solution can be confirmed with the unchanged PXRD patterns.
Solid-state and liquid fluorescence spectra of Tb-NDBC
PXRD analyses have confirmed that Tb-NDBC is stable in water, whose solid-state and liquid fluorescence were characterized and compared to show the influence of water on the fluorescence.Tb-NDBC and free solid H2NDBC ligand were excited at 273 nm (ESI,† Fig. S8), whose solid-state emission spectra were recorded at ambient temperature (Fig. 2). H2NDBC emitted pale blue fluorescence with a broad emission at 406 nm, which can be assigned to the intraligand π to π* orbital transition.27 While Tb-NDBC featured emissions at 430 (broad and weak) and 545 nm (strong). However, no obvious emission color can be observed by the naked eye. The emission at 430 nm is related to the intraligand charge transfer (ILCT) of NDBC2− and that at 545 comes from the characteristic 5D4 → 7F5 transition of the Tb3+ cation.28–30 Comparing the emissions of free H2NDBC and Tb-NDBC, the emission from ILCT shifted from 406 to 430 nm because of the deprotonation of the carboxylic group by coordination. As Tb-NDBC came into contact with moisture, the 5D4 → 7F5 transition basically remained at 545 nm with stable emission intensity. The ILCT transition at 430 nm was differentiated into 469, 435 (broad, strong), 367, and 351 nm. When Tb-NDBC was immersed in water for 1 h, the emissions related to the ligand changed: those around 435 nm became weaker, but those at 394 nm became stronger. Water plays an important role in strengthening the emissions related to NDBC2−, but has negligible influence on the 5D4 → 7F5 transition at 545 nm. This supplies the possibility of regulating the intensity of the 5D4 → 7F5 transition, thus changing the emission color from blue to green, and realizing molecular recognition.
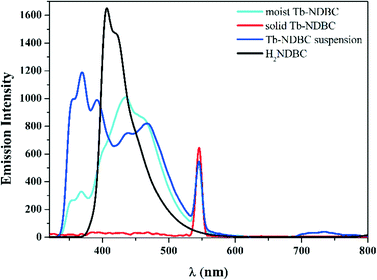 | ||
| Fig. 2 The solid-state and liquid emission spectra of Tb-NDBC and the free H2NDBC ligand excited at 273 nm and recorded at ambient temperature. | ||
Because of parity-forbidden f → f transitions, lanthanide metal centers will not show obvious fluorescent features upon direct excitation. They have to be sensitized by energy transfer from organic chromophores as the antennae.31–35 Herein, the NDBC2− ligand in Tb-NDBC as the antenna absorbs photons from excited UV light and transfers the excited electrons to Tb3+, thus sensitizing the characteristic emissions of Tb3+.
In general, the energy transfer from the ligand to lanthanide metal results in the emission quenching of ILCT. However, in our case, the emission at 394 nm still remains intense when in contact with water. The situation where Tb-NDBC could produce characteristic dual emissions of NDBC2− and Tb3+ inspired us with the possibility of composing a ratiometric fluorescence sensor with emission at 394 nm and the characteristic emission at 545 nm of Tb3+.
Considering the possible working environment, liquid fluorescence studies of Tb-NDBC in water were performed. 5 mg of Tb-NDBC was dispersed into 3 mL of water with 2 min of ultrasonic vibration in a cuvette. The Tb-NDBC suspension stood for 10 min and the liquid fluorescence was re-performed with photos taken under 365 nm UV light. The close fluorescence intensities of Tb-NDBC before and after 10 min show that it can retain enough stability to carry out liquid fluorescence detections (ESI,† Fig. S9).
Optimization of Tb-NDBC for detecting DPA
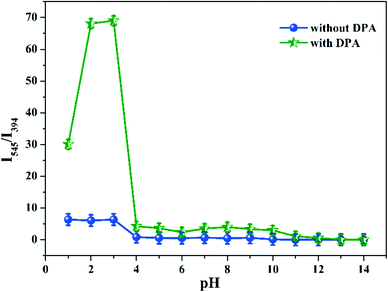
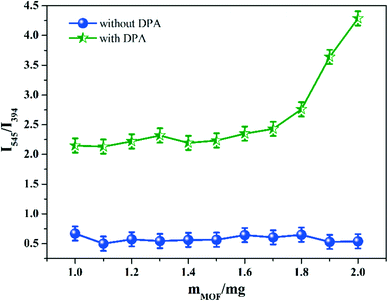
To achieve a ratiometric fluorescent sensor with high sensitivity and selectivity, the effects of response time, pH, and MOF dosage on the fluorescence responses of Tb-NDBC toward DPA were explored and optimized.The detection performance of Tb-NDBC
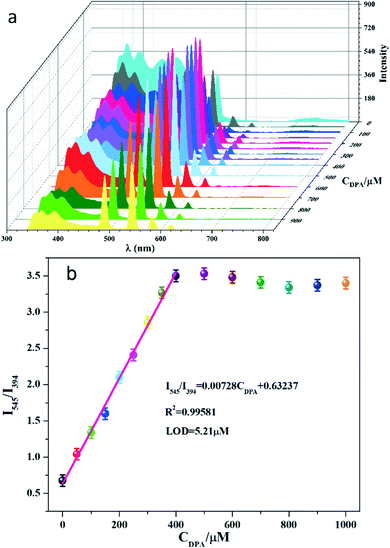 | ||
| Fig. 5 (a) The emission spectra of Tb-NDBC (λex = 273 nm) depending on CDPA ranging from 0 to 1000 μM recorded at ambient temperature. (b) A plot of I545/I394vs. CDPA. | ||
A comparison of detection performance between the presented Tb-NDBC and the reported sensors is summarized in Table S4 (ESI†). MOF-based sensors can be divided into MOF and doped MOF types. By comparing the LOD (5.21 μM) of Tb-NDBC with those MOF sensors, we find that 5.21 μM with a wide linear range of 0–400 μM is comparable to MOF sensors, such as Tb0.875Eu0.125-Hddb (0.8494 μM),38 [Eu0.1Tb0.9L(H2O)Cl] (0.248–2.277 μM, L = NDC2−, BPDC2−, and BDC2−),27 Eu/Tb(BTC) (1087 nM),39 [Tb0.43Eu1.57(1,4-phda)3(H2O)](H2O)2 (0.17 μM),40 and NH2-MOF-76(Eu) (3.8 μM).41 However, the LOD of 5.21 μM is much higher than those nM-level LODs of doped MOF sensors, such as the 14.7 nM of Tb3+/Eu3+@Ni-BTC,42 10 nM of EDTA–Eu3+,43 and 96 nM in GMP–Tb/Eu.44 This may be related to the surface difference, where the luminescence group is enriched on the surface by doping, making the fluorescence response more sensitive to the objects. This phenomenon also occurs in nanoplatform materials, including nanoparticles,45–48 carbon dots49–52 and quantum dots,53 with most of their LODs being nM-level, much lower than 5.21 μM (see the reports in Table S4†).
![[thin space (1/6-em)]](https://www.rsc.org/images/entities/char_2009.gif) 598 cm−1 based on calculation from the emission starting at 463 nm excited at 340 nm (ESI,† Fig. S18).54,55 Referring to Latva's rules, an optimal LMCT process for a Tb3+ needs ΔE = [E(T1) − E(5DJ)], which is located in 2500–4500 cm−1 for Tb3+ (5D4).56 In this case, ΔE between the T1 of the NDBC2− ligand (21
598 cm−1 based on calculation from the emission starting at 463 nm excited at 340 nm (ESI,† Fig. S18).54,55 Referring to Latva's rules, an optimal LMCT process for a Tb3+ needs ΔE = [E(T1) − E(5DJ)], which is located in 2500–4500 cm−1 for Tb3+ (5D4).56 In this case, ΔE between the T1 of the NDBC2− ligand (21![[thin space (1/6-em)]](https://www.rsc.org/images/entities/char_2009.gif) 598 cm−1) and 5D4 of Tb3+ (20
598 cm−1) and 5D4 of Tb3+ (20![[thin space (1/6-em)]](https://www.rsc.org/images/entities/char_2009.gif) 430 cm−1) is 1168 cm−1. ΔE is far from 2500–4500 cm−1, showing that the T1 of NDBC2− did not match the energy levels of Tb3+ (5D4) well. Therefore, the emission at 430 nm in Tb-NDBC still existed, hinting that the energy transfer efficiency is not high. The fluorescence of Tb-NDBC comprises the ligand transition and the ligand to Tb3+ transition, resulting in a combination of ILCT and the featured emission of Tb3+.
430 cm−1) is 1168 cm−1. ΔE is far from 2500–4500 cm−1, showing that the T1 of NDBC2− did not match the energy levels of Tb3+ (5D4) well. Therefore, the emission at 430 nm in Tb-NDBC still existed, hinting that the energy transfer efficiency is not high. The fluorescence of Tb-NDBC comprises the ligand transition and the ligand to Tb3+ transition, resulting in a combination of ILCT and the featured emission of Tb3+.
When DPA was added into the Tb-NDBC suspension, the emission intensity at 545 nm assigned to 5D4 → 7F5 (Tb3+) obviously increased. This increased emission can be interpreted as competition between DPA and the NDBC2− ligand. DPA can link to Tb3+ by weak bonds, thus constructing electron-transfer bridges with Tb3+. DPA has much higher energy transfer efficiency than the NDBC2− ligand. The T1 of DPA (3ππ*, 25![[thin space (1/6-em)]](https://www.rsc.org/images/entities/char_2009.gif) 510 cm−1) is 5080 cm−1 higher than the energy level of Tb3+. ΔE is slightly away from 2500 to 4500 cm−1, so DPA is more suitable for sensitizing Tb3+. Therefore, DPA partly replaces NDBC2− to sensitize Tb3+, leading to greatly increased I545 up to CDPA = 400 μM. As DPA fully replaces NDBC2−, I545 remains stable when CDPA > 400 μM. The fluorescence lifetimes (FLTs) of the excited state 5D4 → 7F6 (Tb3+) in Tb-NDBC with or without DPA were investigated (ESI,† Fig. S19 and S20). In the Tb-NDBC blank sample, FLT is only 0.036 μs, which can explain why no emission color can be seen. Comparing the FLTs in Tb-NDBC with and without DPA, the FLT of the excited state 5D4 → 7F6 (Tb3+) in Tb-NDBC with DPA is 171.91 μs, 4775 times that of the blank sample of 0.036 μs. FLT analysis supports the interpretation that DPA sensitizes Tb3+ more effectively than NDBC2− in ligand competition.
510 cm−1) is 5080 cm−1 higher than the energy level of Tb3+. ΔE is slightly away from 2500 to 4500 cm−1, so DPA is more suitable for sensitizing Tb3+. Therefore, DPA partly replaces NDBC2− to sensitize Tb3+, leading to greatly increased I545 up to CDPA = 400 μM. As DPA fully replaces NDBC2−, I545 remains stable when CDPA > 400 μM. The fluorescence lifetimes (FLTs) of the excited state 5D4 → 7F6 (Tb3+) in Tb-NDBC with or without DPA were investigated (ESI,† Fig. S19 and S20). In the Tb-NDBC blank sample, FLT is only 0.036 μs, which can explain why no emission color can be seen. Comparing the FLTs in Tb-NDBC with and without DPA, the FLT of the excited state 5D4 → 7F6 (Tb3+) in Tb-NDBC with DPA is 171.91 μs, 4775 times that of the blank sample of 0.036 μs. FLT analysis supports the interpretation that DPA sensitizes Tb3+ more effectively than NDBC2− in ligand competition.
Application of the DPA detection method
| C DPA,theor (μM) | I 545/I394 | Average CDPA,cal (μM) | Recovery (%) | RSD (%, n= 3) | ||
|---|---|---|---|---|---|---|
| 1 | 2 | 3 | ||||
| 100 | 1.39 | 1.389 | 1.36 | 102.65 | 102.65 | 1.24 |
| 200 | 2.12 | 2.10 | 2.13 | 203.89 | 101.94 | 0.72 |
| 300 | 2.85 | 2.82 | 2.80 | 300.96 | 100.32 | 0.89 |
![[thin space (1/6-em)]](https://www.rsc.org/images/entities/char_2009.gif) 000 rpm, followed by filtration with 0.22 μm separating film to remove insoluble impurities. The blank lake water with Tb-NDBC emitted bright blue fluorescence, showing that the components in lake water did not affect the luminescence of Tb-NDBC. DPA solutions of 100, 200 and 300 μM (CDPA,theor) were prepared with 0.3, 0.6, and 0.9 mL of 1 mM DPA aqueous solutions diluted with 2.7, 2.4 and 2.1 mL of lake water (pH = 7.35), respectively. Then 1.8 mg of Tb-NDBC was dispersed into the DPA solutions with 2 min of ultrasonic vibration and standing for 5 min. Their fluorescence spectra were characterized three times with I545/I394 determined (ESI,† Fig. S22). Their photos were taken under 365 nm UV light. The emission colors slowly turned green depending on CDPA. With similar data treatment to that in human serum, the CDPA,cal values and the recoveries were calculated and are shown in Table 2. With high accuracy, the recoveries covered a very small range of 98.12–102.76% and CDPA,cal had pretty close values to CDPA,cal: 98.12, 205.26, and 308.28 μM. All RSDs were less than 3%: 2.61, 0.98, and 0.72%. Tb-NDBC shows high accuracy and reliability for DPA detection in lake water.
000 rpm, followed by filtration with 0.22 μm separating film to remove insoluble impurities. The blank lake water with Tb-NDBC emitted bright blue fluorescence, showing that the components in lake water did not affect the luminescence of Tb-NDBC. DPA solutions of 100, 200 and 300 μM (CDPA,theor) were prepared with 0.3, 0.6, and 0.9 mL of 1 mM DPA aqueous solutions diluted with 2.7, 2.4 and 2.1 mL of lake water (pH = 7.35), respectively. Then 1.8 mg of Tb-NDBC was dispersed into the DPA solutions with 2 min of ultrasonic vibration and standing for 5 min. Their fluorescence spectra were characterized three times with I545/I394 determined (ESI,† Fig. S22). Their photos were taken under 365 nm UV light. The emission colors slowly turned green depending on CDPA. With similar data treatment to that in human serum, the CDPA,cal values and the recoveries were calculated and are shown in Table 2. With high accuracy, the recoveries covered a very small range of 98.12–102.76% and CDPA,cal had pretty close values to CDPA,cal: 98.12, 205.26, and 308.28 μM. All RSDs were less than 3%: 2.61, 0.98, and 0.72%. Tb-NDBC shows high accuracy and reliability for DPA detection in lake water.
| CDPA,theor (μM) | I 545/I394 | Average CDPA,cal (μM) | Recovery (%) | RSD (%, n = 3) | ||
|---|---|---|---|---|---|---|
| 1 | 2 | 3 | ||||
| 100 | 1.31 | 1.35 | 1.38 | 98.12 | 98.12 | 2.61 |
| 200 | 2.15 | 2.12 | 2.11 | 205.26 | 102.63 | 0.98 |
| 300 | 2.86 | 2.9 | 2.87 | 308.28 | 102.76 | 0.72 |
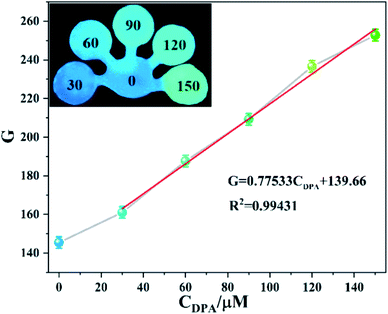
We used a photo of emission colors with CDPA ranging from 30 to 150 μM (the inset in Fig. 7) as the sample photo to see whether the app worked. Screen recording was utilized to watch the working process of the app. As seen, random selection of positions in the paper-based sensor gave a demonstration of the effectiveness of the app. It gave 26.23 for 30 μM, 58.48 for 60 μM, and 94.59 for 90 μM, 120.39 for 120 μM, and 148.76 for 150 μM. The close values suggest the reliability of our self-programmed smartphone app. The application of the app shows portable and accurate DPA detection on site.
Conclusions
In summary, H2NDBC reacted with Tb3+ to give Tb-NDBC, whose single crystal structure was solved, revealing that Tb-NDBC is a 3D framework topologized as a 3,12-connected 2-nodal {3·4·5}2{310·416·521·616·72·8} network. The phase purity of the bulk sample was confirmed via PXRD and TGA studies, showing that Tb-NDBC can retain thermal stability at ca. 300 °C. Tb-NDBC can also retain structural stability in twelve organic solvents, in HCl and NaOH solutions with pH values of 1–13, and in water for 48 h. The liquid fluorescence properties are related to the characteristic transitions of NDBC2− (ILCT) at around 394 and 435 nm and 5D4 → 7F5 at 545 nm for Tb3+. The fluorescence mechanism was interpreted based on LMCT from NDBC2− to Tb3+. The factors of response time, pH, and MOF dosage were explored and optimized as follows: response time = 5 min, pH =7.35, and MOF dosage = 1.8 mg.Sensitivity testing of Tb-NDBC for detecting DPA exhibited a linear equation of I545/I394 = 0.00728·CDPA + 0.63237 in the CDPA range of 0–400 μM with a LOD of 5.21 μM, much lower than the infectious dosage of 60 μM of the spores. A LOD of 5.21 μM is comparable to most reported MOF sensors, but higher than those LODs at the nM-level of nanoplatform materials. Fourteen organic compounds with similar functional groups—Ben, Ba, Asn, PGlu, Glu, Glc, Trp, Cys, Arg, His, Lys·HCl, Met, Ser, and Gly—were selected for comparison with DPA. Only DPA resulted in bright green emission, while the others emitted blue fluorescence. Furthermore, nine amino acids—Glc, Cys, Gly, MET, Arg, Ser, His, Trp and Lys·HCl—did not interfere with DPA detection. During the five cycles of DPA detection, I545/I394 basically remained unchanged. Overall, Tb-NDBC can be regarded as a quantitative ratiometric fluorescence sensor for DPA detection with high sensitivity and selectivity, a rapid response, and durability. The detection mechanism is based on competition between DPA and NDBC2−; DPA has a better energy match to Tb3+, and thus sensitizes Tb3+ more effectively through DPA forming electron-transfer bridges, achieving an emission color transition from blue to green. Applications of DPA detection based on Tb-NDBC in human serum and natural lake water samples were carried out with the standard addition method. In human serum, the calculated CDPA values were 102.65 μM at 100 μM, 203.89 μM at 200 μM, and 300.96 μM at 300 μM. The same phenomenon occurred in natural lake water, and the recoveries covered a very small range of 98.12–102.76%; the calculated CDPA values were pretty close to the theoretical CDPA values: 98.12 μM at 100 μM, 205.26 μM at 200 μM, and 308.28 μM at 300 μM. Tb-NDBC showed high accuracy and reliability in DPA detection in human serum and lake water.
For convenient DPA detection, a paper-based Tb-NDBC sensor was prepared, whose G values were recognized using a website. A linear equation between G and CDPA was found: G = 0.77533·CDPA + 139.66, with a LOD of 17.99 μM when CDPA was 30–150 μM. A self-programmed smartphone app was used to read G values from a photo of the paper-based sensor under 365 nm UV light, and CDPA was calculated according to the linear equation of the paper-based Tb-NDBC sensor. The closeness of the CDPA values returned from the self-programmed app and the values that were set suggests the reliability, portability, and accuracy of DPA detection on-site using Tb-NDBC.
Conflicts of interest
There are no conflicts to declare.Acknowledgements
The project was sponsored by Fundamental Research Funds for the Central Universities (GK202003032), Science and Technology Program of Xi'an (201805027YD5CG11(3)), the Natural Science Foundation of Shaanxi Province (2018JM2042), and National Undergraduate Innovation and Entrepreneurship Training Program (S202110708109).Notes and references
- P. F. Cannon, U. Damm, P. R. Johnston and B. S. Weir, Stud. Mycol., 2012, 73, 181 CrossRef CAS.
- M. Mock and A. Fouet, Annu. Rev. Microbiol., 2001, 55, 647 CrossRef CAS PubMed.
- N. Mytle, R. J. Hopkins, N. V. Malkevich, S. Basu, G. T. Meister, D. C. Sanford, J. E. Comer, K. E. Van Zandt, M. Al-Ibrahim, W. G. Kramer, C. Howard, N. Daczkowski, A. C. Chakrabarti, B. Ionin, G. S. Nabors and M. H. Skiadopoulos, Antimicrob. Agents Chemother., 2013, 57, 5684 CrossRef CAS.
- X. Guo, J. Li, M. Arabi, X. Wang, Y. Wang and L. Chen, ACS Sens., 2020, 5, 601 CrossRef CAS PubMed.
- J. H. Son, B. Cho, S. Hong, S. H. Lee, O. Hoxha, A. J. Haack and L. P. Lee, Light: Sci. Appl., 2015, 4, e280 CrossRef CAS.
- G. Hebert, S. Hart, T. A. Leski, A. Terray and Q. Lu, Anal. Chem., 2017, 89, 10296 CrossRef PubMed.
- D. P. Cowcher, Y. Xu and R. Goodacre, Anal. Chem., 2013, 85, 3297 CrossRef CAS PubMed.
- D. N. Wang, G. T. Carroll, N. J. Turro, J. T. Koberstein, P. Kovac, R. Saksena, R. Adamo, L. A. Herzenberg, L. A. Herzenberg and L. Steinman, Proteomics, 2007, 7, 180 CrossRef CAS PubMed.
- J. Hang, A. K. Sundaram, P. X. Zhu, D. R. Shelton, J. S. Karns, P. A. W. Martin, S. H. Li, P. Amstutz and C. M. Tang, J. Microbiol. Methods, 2008, 73, 242 CrossRef CAS.
- K. Luan, R. Q. Meng, C. F. Shan, J. Cao, J. G. Jia, W. S. Liu and Y. Tang, Anal. Chem., 2018, 90, 3600 CrossRef CAS PubMed.
- C. X. Duan, Y. Yu, J. Xiao, Y. Y. Li, P. F. Yang, F. Hu and H. X. Xi, Green Energy Environ., 2021, 6, 33 CrossRef.
- U. Ryu, S. Jee, P. C. Rao, J. Shin, C. Ko, M. Yoon, K. S. Park and K. M. Choi, Coord. Chem. Rev., 2021, 426, 213544 CrossRef CAS.
- W. H. Huang, Q. H. Li, D. Y. Yu, Y. H. Tang, D. Y. Lin, F. Wang and J. Zhang, Inorg. Chem., 2021, 60, 3074 CrossRef CAS.
- K. Zhong, R. F. Yang, W. Y. Zhang, Y. T. Yan, X. J. Guo, W. H. Huang and Y. Y. Wang, Inorg. Chem., 2020, 59, 3912 CrossRef CAS.
- Z. C. Hu, B. J. Deibert and J. Li, Chem. Soc. Rev., 2014, 43, 5815 RSC.
- Y. J. Cui, Y. F. Yue, G. D. Qian and B. L. Chen, Chem. Rev., 2012, 112, 1126 CrossRef CAS PubMed.
- B. Yan, Inorg. Chem. Front., 2021, 8, 201 RSC.
- T. Y. Sun, Y. B. Gao, Y. Y. Du, L. Zhou and X. Chen, Front. Chem., 2021, 8, 624592 CrossRef.
- Y. Q. Sun, Y. Cheng and X. B. Yin, Anal. Chem., 2021, 93, 3559 CrossRef CAS PubMed.
- E. J. Gao, S. Y. Wu, J. Wang, M. C. Zhu, Y. Zhang and V. P. Fedin, Adv. Opt. Mater., 2020, 8, 1901659 CrossRef CAS.
- S. Y. Wu, M. C. Zhu, Y. Zhang, M. Kosinova, V. P. Fedin and E. J. Gao, Chem. – Eur. J., 2020, 26, 3137 CrossRef CAS.
- G. M. Sheldrick, Acta Crystallogr., Sect. A: Found. Crystallogr., 2008, 64, 112 CrossRef CAS PubMed.
- A. F. Wells, Three-Dimensional Nets and Polyhedra, Wiley-Interscience, New York, 1977 Search PubMed.
- V. A. Blatov, Multipurpose crystallochemical analysis with the program package TOPOS, UCr CompComm Newsletter, 2006 Search PubMed.
- J. B. Dunn, M. L. Burns, S. E. Hunter and P. E. Savage, J. Supercrit. Fluids, 2003, 27, 263 CrossRef CAS.
- L. Artok and H. H. Schobert, J. Anal. Appl. Pyrolysis, 2000, 54, 215 CrossRef CAS.
- M. L. Shen, B. Liu, L. Xu and H. Jiao, J. Mater. Chem. C, 2020, 8, 4392 RSC.
- X. B. Chen, C. X. Qi, H. Li, J. Y. Ding, S. Yan, H. Lei, L. Xu and B. Liu, J. Solid State Chem., 2020, 281, 121030 CrossRef CAS.
- J. M. Zhou, H. H. Li, H. Zhang, H. M. Li, W. Shi and P. Cheng, Adv. Mater., 2015, 27, 7072 CrossRef CAS.
- M. J. Cable, J. P. Kirby, D. J. Levine, M. J. Manary, H. B. Gray and A. Ponce, J. Am. Chem. Soc., 2009, 131, 9562 CrossRef CAS.
- M. D. Allendorf, C. A. Bauer, R. K. Bhakta and R. J. T. Houk, Chem. Soc. Rev., 2009, 38, 1330 RSC.
- N. Gao, Y. F. Zhang, P. C. Huang, Z. H. Xiang, F. Y. Wu and L. Q. Mao, Anal. Chem., 2018, 90, 7004 CrossRef CAS PubMed.
- P. H. Wang, C. M. Yu, M. S. Wang and G. C. Guo, Dyes Pigm., 2021, 185, 108888 CrossRef.
- Y. F. Han, N. N. Zhang, M. S. Wang and G. C. Guo, J. Phys. Chem. C, 2020, 124, 27680 CrossRef.
- H. Liu, Z. X. Xie, J. Liu, Y. F. Han, Y. Q. Wei and G. C. Guo, Dyes Pigm., 2020, 181, 108441 CrossRef CAS.
- F. Bailey, S. Karp and L. Sacks, J. Bacteriol., 1965, 89, 984 CrossRef.
- W. K. Oh, Y. S. Jeong, J. Song and J. Jang, Biosens. Bioelectron., 2011, 29, 172 CrossRef CAS PubMed.
- X. B. Chen, C. X. Qi, Y. B. Xu, H. Li, L. Xu and B. Liu, J. Mater. Chem. C, 2020, 8, 17325 RSC.
- M. N. Wu, Y. X. Zhuang, J. B. Liu, W. W. Chen, X. Y. Li and R. J. Xie, Opt. Mater., 2020, 106, 110006 CrossRef CAS.
- J. Othong, J. Boonmak, F. Kielar, S. Hadsadee, S. Jungsuttiwong and S. Youngme, Sens. Actuators, B, 2020, 316, 128156 CrossRef CAS.
- D. Wu, Z. Zhang, X. W. Chen, L. K. Meng, C. G. Li, G. H. Li, X. B. Chen, Z. Shi and S. H. Feng, Chem. Commun., 2019, 55, 14918 RSC.
- H. Lei, C. X. Qi, X. B. Chen, T. Zhang, L. Xu and B. Liu, New J. Chem., 2019, 43, 18259 RSC.
- M. Donmez, H. A. Oktem and M. D. Yilmaz, Carbohydr. Polym., 2018, 180, 226 CrossRef CAS.
- N. Gao, Y. F. Zhang, P. C. Huang, Z. H. Xiang, F. Y. Wu and L. Q. Mao, Anal. Chem., 2018, 90, 7004 CrossRef CAS PubMed.
- Y. Jung, S. Kang, J. An, J. Jung and D. Kim, Dyes Pigm., 2020, 182, 108700 CrossRef CAS.
- T. M. Koo, M. J. Ko, B. C. Park, M. S. Kim and Y. K. Kim, J. Hazard. Mater., 2021, 408, 124870 CrossRef CAS.
- Y. Li, X. Li, D. Wang, C. Shen and M. Yang, Microchim. Acta, 2018, 185, 435 CrossRef PubMed.
- T. K. Naqvi, A. Bajpai, M. S. S. Bharati, M. M. Kulkarni, A. M. Siddiqui, V. R. Soma and P. K. Dwivedi, J. Hazard. Mater., 2021, 407, 124353 CrossRef CAS.
- L. F. Pang, H. Wu, M. X. Wei, X. F. Guo and H. Wang, Spectrochim. Acta, Part A, 2021, 244, 118872 CrossRef CAS.
- M. Rong, X. Deng, S. Chi, L. Huang, Y. Zhou, Y. Shen and X. Chen, Microchim. Acta, 2018, 185, 201 CrossRef.
- M. Rong, Y. Liang, D. Zhao, B. Chen, C. Pan, X. Deng, Y. Chen and J. He, Sens. Actuators, B, 2018, 265, 498 CrossRef CAS.
- J. Wang, D. Li, Y. Qiu, X. Liu, L. Huang, H. Wen and J. Hu, Talanta, 2020, 220, 121377 CrossRef CAS.
- M. Rong, X. Yang, L. Huang, S. Chi, Y. Zhou, Y. Shen, B. Chen, X. Deng and Z. Q. Liu, ACS Appl. Mater. Interfaces, 2019, 11, 2336 CrossRef CAS.
- R. Ramya, D. Sharma, S. Natarajan and M. L. P. Reddy, Inorg. Chem., 2012, 51, 8818 CrossRef.
- Z. Xia, Q. Wei, Q. Yang, C. Qiao, S. Chen, G. Xie, G. Zhang, C. Zhou and S. Gao, CrystEngComm, 2013, 15, 86 RSC.
- M. Latva, H. Takalo, V. M. Mukkala, C. Matachescu, J. C. Rodríguez Ubis and J. Kankare, J. Lumin., 1997, 75, 149 CrossRef CAS.
Footnote |
| † Electronic supplementary information (ESI) available: Structural information, a figure showing a Tb2(COO)2 subunit and the linkage mode among Tb2(COO)2 subunits, PXRD patterns of Tb-NDBC, Tb-NDBC in solvents and water at various pH values, and Gd-NDBC, TG curves, the excitation spectrum of Tb-NDBC, the response time plot of I545/I394vs. time for Tb-NDBC detecting DPA, emission spectra of Tb-NDBC at different pH levels, MOF dosage and interferents, ten sets of I545/I394 data for a blank sample, the durability of Tb-NDBC over five detection cycles, the phosphorescence spectrum of Gd-NDBC at 77 K, and fluorescence lifetimes of Tb3+ in Tb-NDC with/without DPA. CCDC 2090950. For ESI and crystallographic data in CIF or other electronic format see DOI: 10.1039/d1ce01256h |
| This journal is © The Royal Society of Chemistry 2022 |

