Two robust Zn(II)-organic frameworks as dual-functional fluorescent probes for efficient sensing of enrofloxacin and MnO4− anions†
Yu-Qiao
Su
a,
Ruo-Tong
Wang
a,
Olga A.
Blatova
 b,
Yong-Sheng
Shi
a and
Guang-Hua
Cui
 *a
*a
aCollege of Chemical Engineering, Hebei Key Laboratory for Environment Photocatalytic and Electrocatalytic Materials, North China University of Science and Technology, No. 21 Bohai Road, Caofeidian new-city, Tangshan, Hebei 063210, P. R. China. E-mail: tscghua@126.com; Fax: +86 315 8805462; Tel: +86 315 8805460
bSamara Center for Theoretical Materials Science (SCTMS), Samara State Technical University, Molodogvardeyskaya St. 244, 443100 Samara, Russian Federation
First published on 17th November 2021
Abstract
Selective detection of antibiotics and MnO4− is crucial for human health improvement and protecting the environment. Two stable Zn(II)-based metal–organic frameworks (MOFs) {[Zn6(L1)2(NDC)5(μ2-OH)2]·0.5H2O}n (1), and {[Zn(L2)(NDC)]·2H2O}n (2) (H2NDC = 1,4-naphthalenedicarboxylic acid, L1 = 1,5-bis(1-(pyridine-4-ylmethyl)-1H-benzo[d]imidazol-2-yl)pentane, L2 = 1,6-bis(1-(pyridine-4-ylmethyl)-1H-benzo[d]imidazol-2-yl)hexane) were successfully synthesized by adopting the mixed ligands approach. 1 is a rare 3D 3,5,6T23 framework based polynuclear complex group. 2 possesses a 2D sql layer. The two MOFs exhibit excellent chemical and thermal stability. The title compounds are promising dual-functional fluorescent sensors for detecting enrofloxacin/MnO4− anions with high selectivity and sensitivity (Ksv values toward enrofloxacin: 4.29 × 10⁶ L mol−1 for 1 and 4.59 × 10⁶ L mol−1 for 2 and toward MnO4−: 1.05 × 10⁴ for 1, 5.48 × 10³ L mol−1 for 2, respectively), which are the first observations of fluorescent MOFs for the sensing of enrofloxacin and MnO4− anions.
1. Introduction
Primary water pollutants, coming mainly from industry, animal husbandry, and household emissions, include heavy metal ions, inorganic oxyanions, organic contaminants, and antibiotics.1–3 Potassium permanganate is a commonly used oxidant in the laboratory and in industry, resulting in significant MnO4− anions in the discharged water.4–6 MnO4− residues may cause cancer and teratogenicity for humans and the death of aquatic organisms.7,8 Enrofloxacin, a quinolone antibiotic, is widely exploited for antiseptic infections in soft tissues and nervous systems caused by Gram-positive or Gram-negative bacteria.9–11 These residual antibiotics may significantly impact human well-being, including acute and chronic poisoning, cancer, and other side effects, and they can also seriously contaminate the environment, such as aquatic organisms, destroying terrestrial animals and increasing bacterial resistance.12–14 Dong et al. showed that antibiotic exposure induced the breakage of DNA in earthworms, changing their enzymatic activity.15 Similar phenomena occur in plants; for example, the chloroplastic and mitochondrial protein synthesis of two species of ferns were affected by residual antibiotics.16 Therefore, from environmental safety considerations, the development of sensitive and selective methods to detect enrofloxacin and MnO4− anions is imperative.Metal–organic frameworks (MOFs) have experienced immense development in recent decades due to their fascinating topological structures and potential applications in diverse fields.17–26 MOFs based d10 metal cations, especially Zn2+ and Cd2+ ions, which could reinforce radiative emissions due to the metal-to-ligand charge transfer process (MLCT), and act as excellent fluorescent probes,27–29 which show clear advantages in sensitivity, response time, and operability compared to traditional detection methods.30–33 However, the poor stability of MOFs in aqueous media usually restricts their sensing performance to a large extent for target contaminants. To date, only a few MOF-based sensors have been found that can sustain their stability in water or in humid conditions.34,35 Hence, regulation of the chemical stability of MOF-based sensors is an important challenge.
Motivated by the aspects above, 1,4-naphthalenedicarboxylic acid (H2NDC) and two nitrogen-containing auxiliary ligands (Scheme S1†) were chosen as mixed ligands to construct Zn-MOFs for the following reasons: (1) the rod-like H2NDC ligand features two carboxylate groups that can be readily deprotonated, and the naphthalene ring employs a high π-electron density that enables more effective energy transfer to present excellent fluorescence performance;36 (2) the flexible conformation of di(pyridylbenzimidazole) linkers can offer more possibilities for the construction of multidimensional topological frameworks;37 (3) due to the introduction of pyridine groups, the N-auxiliary ligands exhibit strongly coordination abilities and diverse supramolecular recognition sites.38,39 Herein, two fluorescent Zn-MOFs were designed and assembled, namely, {[Zn6(L1)2(NDC)5(μ2-OH)2]·0.5H2O}n (1), and {[Zn(L2)(NDC)]·2H2O}n (2) (L1 = 1,5-bis(1-(pyridine-4-ylmethyl)-1H-benzo[d]imidazol-2-yl)pentane, L2 = 1,6-bis(1-(pyridine-4-ylmethyl)-1H-benzo[d]imidazol-2-yl)hexane). 1 is the first representative of 3,5,6T23 topology in MOFs with polynuclear complex groups. The fluorescence sensing behaviors of 1–2 towards MnO4− anions and enrofloxacin (ENR) were investigated in detail, and the results indicate that 1–2 exhibit good sensing performance as chemosensors with high selectivity, stability, recyclability, and low detection limits.
2. Experimental
2.1. Synthesis of{[Zn6(L1)2(NDC)5(μ2-OH)2]·0.5H2O}n (1)
Zn(OAc)2·2H2O (43.9 mg, 0.2 mmol), H2NDC (43.2 mg, 0.2 mmol), L1 (48.7 mg, 0.1 mmol), NaOH (4 mL, 0.1 mol L−1) and H2O (10 mL) were sealed in a 25 mL Teflon-lined autoclave at 140 °C for 72 h. Colorless crystals of 1 were obtained in 41.1% yield (based on L1). Anal. calcd for C123H93N12O22.5Zn6 (Fw = 2491.44): C, 59.24; H, 3.73; N, 6.75. Found (%): C, 59.56; H, 4.08; N, 6.39. IR: 3336 w, 1645 s, 1603 w, 1575 s, 1557 s, 1456 s, 1441 m, 1362 s, 1259 m, 823 w, 744 m.2.2. Synthesis of {[Zn(L2)(NDC)]·2H2O}n (2)
The synthesis process of 2 is similar with complex 1 except that L2 replaces L1. Colorless crystals were obtained at a 35.2% yield (based on L2 ligands). Anal. calcd for C44H42N6O6Zn (Fw = 816.20): C, 64.75; H, 5.19; N, 10.30. Found (%): C, 65.08; H, 4.85; N, 10.69. IR: 3378 w, 1618 s, 1593 w, 1454 s, 1428 s, 1400 s, 1361 m, 1259 s, 1165 m, 873 w, 792 m.2.3. Sensing experiments
In the H2O suspensions system, fluorescence sensing tests of 1–2 were evaluated. The ground powder samples of 1 and 2 (4 mg) were added into 4 mL of water, respectively, forming suspensions in solutions by ultrasonic vibration for 30 min with sonication power 150 W by a KQ-300DE ultrasonic bath (40 kHz, Kunshan, China). The aqueous solutions of the potassium salt of the inorganic anions [KxM] (Mx− = NO3−, Cl−, Br−, I−, ClO3−, BrO3−, IO3−, CO32−, SO42−, HPO42−, H2PO4−, P2O74−, SCN−, OCN−, and MnO4−) were employed at a concentration of 0.02 mol L−1 for the qualitative and anti-interference experiments. Luminescence titration experiments were also performed by employing MnO4− anion solution and the luminescence emission spectra were tracked.As in the above method, 0.1 mmol L−1 antibiotic solutions were obtained by dissolving a certain amount of antibiotics in deionized water, including amoxicillin (AMX), ciprofloxacin (CIP), levofloxacin (LEV), metronidazole (MDZ), nitrofurantoin (NFT), nitrofurazone (NFZ), norfloxacin (NOR), ornidazole (ORN), pefloxacin (PEF), ronidazole (RNZ), sulfadiazine (SDZ), sulfamethazine (SMZ), sulfamethoxazole (SMX), and ENR, and the structural formulas of the selected antibiotics are depicted in Scheme S2.† Finally, the fluorescence quenching efficiency (Q) and Ksv value are calculated with eqn (1) and the Stern–Volmer eqn (2), respectively.
| Q = [(I0 − I)/I0] × 100% | (1) |
| I0/I = 1 + Ksv[M] | (2) |
3. Results and discussion
3.1. Crystal structure of {[Zn6(L1)2(NDC)5(μ2-OH)2]·0.5H2O}n (1)
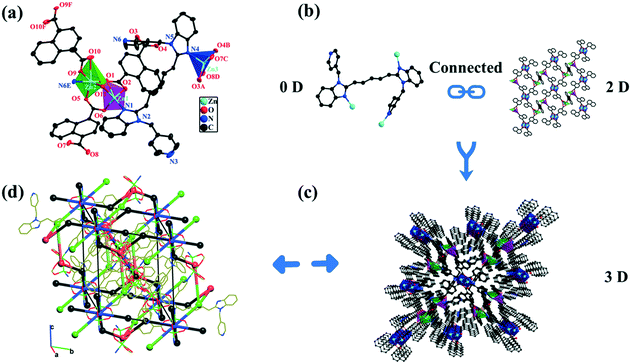
1 crystallizes in the triclinic system, space group Pī. The asymmetric unit of 1 is composed of three Zn2+ centers, two and a half NDC2− anions, one L1 ligand, one μ2-bridging coordination hydroxo group, and 0.25 free H2O (Fig. 1a). The five-coordinated Zn1 center (purple polyhedron) exhibits a distorted square pyramidal coordination geometry and is surrounded by four O atoms (O1, O2, O6, and O11) from two NDC2− anions and one μ2-bridging hydroxo group, one N atom (N1) from the L1 ligand (Fig. S1a†). The Zn2 center (green polyhedron) is six-coordinated by five O atoms (O1, O5, O9, O10, and O11) coming from three NDC2− anions and the μ2-bridging coordination hydroxo group, one N atom (N6E; symmetry code: E = 1 − x, 1 − y, 1 − z) involving a pyridine group in the L1 ligand. Interestingly, the Zn1 and Zn2 centers construct a [Zn2O7N2] secondary building unit (SBU). The Zn3 center (blue polyhedron) adopts an entirely different coordination environment compared with the Zn1 and Zn2 centers, and each Zn3 center is five-coordinated by four carboxylate O atoms (O3A, O4B, O7C, and O8D; A = −1 + x, y, z, B = 1 − x, 2 − y, 2 − z, C = −1 + x, 1 + y, z, D = 1 − x, 1 − y, 2 − z) coming from two NDC2− anions and one N atom (N4) involving one benzimidazole in the L1 ligand. The bond length ranges around these three Zn2+ centers (Zn1–O/N, Zn2–O/N, and Zn3–O/N) are 1.905(2)–1.995(2) Å, 1.996–2.261 Å, and 2.017–2.068 Å, respectively. The coordination angles around the Zn(II) centers are 37.73(6)–174.52(9)°. The Zn–O/N bond lengths and bond angles are consistent with the reported Zn(II)-MOFs (Table S2†).40The NDC2− anions in 1 present three different (κ1-κ1)-(κ1-κ1)-μ2, (κ1-κ1)-(κ1-κ1)-μ4 and (κ2-κ1)-(κ1-κ1)-μ4 coordination modes (Fig. S1b†), which link the adjacent Zn(II) centers to give a 2D [Zn(NDC)]n grid (Fig. 1b). Simultaneously, the L1 ligand in a (κ1)-(κ1)-(κ1)-(κ0)-μ3 fashion connects three Zn(II) centers. Ultimately, the adjacent 2D networks are further extended by L1 ligands to form a complicated 3D framework (Fig. 1c and S1c†). The topological analysis was performed by the ToposPro program package (Fig. 1d and S1d†).41 In the crystal structure of 1, the L1 ligands bridge three Zn centers, while the bridging role of the NDC2− ligands is different: two non-equivalent NDC2− coordinate four Zn2+, and the third non-equivalent NDC2− coordinates two Zn2+ in a chelate mode. The zinc centers are united in lantern dimers Z1 and Z2, one-third of which (Z1) is centrosymmetric with four carboxylate bridges, and two-thirds (Z2) of which are formed by two carboxylates and one hydroxo bridge. The resulting underlying net has three non-equivalent nodes Z1–Z3, which correspond to the centroids of two zinc dimers and the L1 ligand, in a ratio of 1![[thin space (1/6-em)]](https://www.rsc.org/images/entities/char_2009.gif) :
:![[thin space (1/6-em)]](https://www.rsc.org/images/entities/char_2009.gif) 2
2![[thin space (1/6-em)]](https://www.rsc.org/images/entities/char_2009.gif) :
:![[thin space (1/6-em)]](https://www.rsc.org/images/entities/char_2009.gif) 2. The NDC2− ligands correspond to the edges of the underlying net connecting the zinc dimers. The topology of the underlying network is known in the ToposPro TTD collection42 under the name 3,5,6T23, which indicates the coordination numbers of the Z1 (6), Z2 (5), and Z3 (3). The TopCryst service42 gives seven examples of metal–organic frameworks with the 3,5,6T23 underlying topology; however, 1 is the first representative of this topology, built with polynuclear (dimeric) complex groups.
2. The NDC2− ligands correspond to the edges of the underlying net connecting the zinc dimers. The topology of the underlying network is known in the ToposPro TTD collection42 under the name 3,5,6T23, which indicates the coordination numbers of the Z1 (6), Z2 (5), and Z3 (3). The TopCryst service42 gives seven examples of metal–organic frameworks with the 3,5,6T23 underlying topology; however, 1 is the first representative of this topology, built with polynuclear (dimeric) complex groups.
3.2. Crystal structure of {[Zn(L2)(NDC)]·2H2O}n (2)
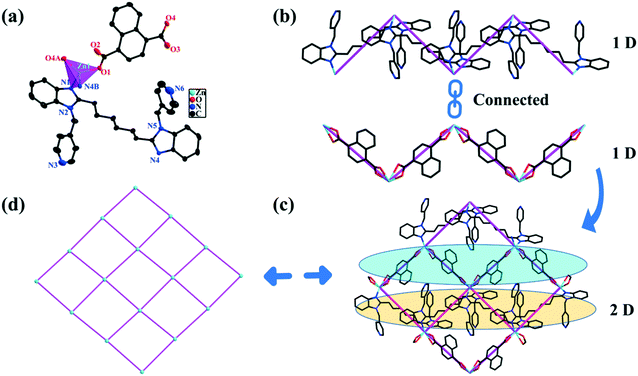
2 crystallizes in the monoclinic system with the P21/c space group. The structural unit of 2 includes one Zn2+ ion, one L2 ligand, one NDC2− anion, and two free water molecules (Fig. 2a). Each Zn2+ center displays a distorted tetrahedral coordination geometry structure (purple polyhedron) with two O atoms (O1 and O4A; symmetry code: A = x, 0.5 − y, 0.5 + z) from two distinct NDC2− anions and two N benzimidazole atoms from two L2 ligands (N1, N4B; symmetry code: B = x, 1.5 − y, 0.5 + z) (Fig. S2a†). The bond lengths of Zn–N are 2.057(2) and 2.074(2) Å; the Zn–O bond lengths are 1.965(2) and 1.983(2) Å. The bond angles range from 99.31(8)° to 125.54(8)° around the Zn2+ center. All the bond lengths and angles around the Zn2+ centers are in agreement with previously presented Zn(II) MOFs.40In 2, the L2 ligands display trans-conformation mode with a dihedral angle of 35.01(8)° between the two benzimidazole mean planes. The L2 ligands serve as μ2-bridging linkers connecting adjacent Zn2+ centers into a 1D zigzag [Zn(L2)]n linear chain, in which the distance of Zn1⋯Zn1 across the L2 ligand is 10.949(5) Å. In the meantime, two carboxyl groups of NDC2− ligands adopt the (κ1-κ1)-(κ1-κ1)-μ2 mode to bind the adjacent Zn2+ centers to obtain a 1D V-shape like [Zn(NDC)]n chain, spanning a Zn1⋯Zn1 distance of 11.377(9) Å (Fig. 2b). The two types of 1D linear chains cross-linked into a 2D (4,4) sheet by sharing identical Zn(II) centers, in which the sizes of tetranuclear rectangular windows consisting of two L2 ligands, two NDC2− ligands, and four Zn2+ metal centers are 10.949(6) Å × 11.337(9) Å (Fig. 2c and S2b†). The 2D tetragonal plane structure of 2 is a 4-connected sql layer, in which each Zn2+ acts as a 4-connected node (cyan sphere); NDC2− and L2 ligands act as 2-connectors (purple line) (Fig. 2d and S2c†).41
3.3. Chemical and thermal stability
Most reported MOFs exhibit inadequate thermal stability and water tolerance; consequently, the chemical or thermal stability of these MOFs should first be investigated.43 The powder X-ray diffraction (PXRD) patterns of 1–2 do not show obvious difference from the simulated ones, suggesting the high purity of the bulk samples (Fig. S3†). Furthermore, PXRD analysis of 1–2 in different pH aqueous solutions, hot water, cold water, etc., demonstrate their strong resistance to moisture and excellent pH stability (pH = 4–11 for 1 and pH = 3–12 for 2) (Fig. S4†).44–47 The thermogravimetric analyses (TGA) of 1–2 were also tested under an air atmosphere (Fig. S5†). From room temperature to 300 °C, the two TGA plots display steady plateaus, suggesting that the frameworks of 1–2 can remain stable up to 300 °C.48–51 Table S3† further displays the results of TGA for 1–2. After removing their water molecule, the PXRD patterns of the two Zn(II) MOFs also reveal their good thermal stability (Fig. S3†).3.4. Photoluminescence properties
The solid-state fluorescence properties of 1–2, the free L1, L2 ligands, and H2NDC were studied at ambient temperature. The maximum emission bands for free L1–L2 ligands and H2NDC are observed at 301, 304, and 490 nm, excited at 272, 272, and 339 nm, respectively (Fig. 3a dotted line). For 1–2, the maximum peaks are found at 400 and 380 nm (λex = 330 and 306 nm, respectively), which are red-shifted by 99 and 76 nm compared with free L1–L2 ligands and blue-shifted by 90 and 110 nm compared with the H2NDC ligand (Fig. 3a solid line). The CIE coordinates are calculated as (0.2016, 0.1728) and (0.1840, 0.0939) for 1/2, (0.1611, 0.0139), (0.1737, 0.0049) and (0.2117, 0.3539) for L1, L2, and H2NDC, respectively. These outcomes imply that the L1 and L2 ligands are far from the visible light region and H2NDC shows turquoise fluorescence. Simultaneously, 1 displays blue light emission, and 2 shows typical blue-violet luminescence (Fig. 3b).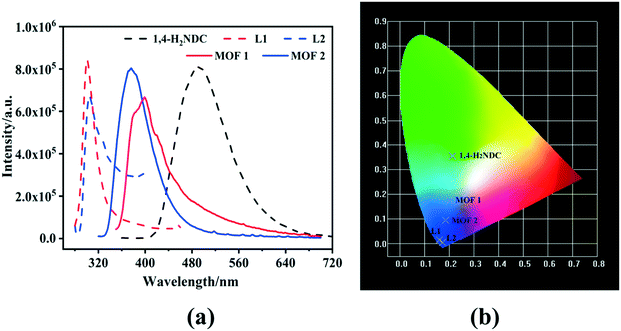 | ||
| Fig. 3 (a) Solid-state emission spectra of 1–2, free L1–L2, and H2NDC ligands at room temperature; (b) CIE diagram of 1–2, free L1, L2, and H2NDC ligands. | ||
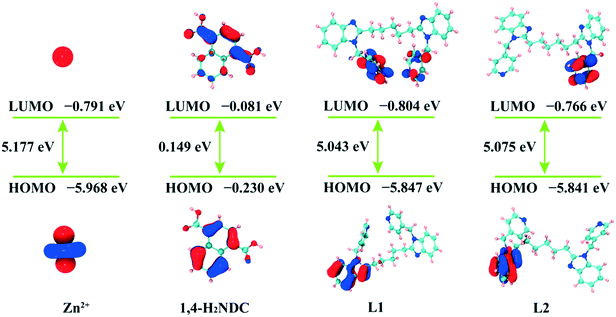
The red/blue-shifts in emissions for 1–2 may be correlated with the π* → π transition of organic ligands to metal coordination transformations.52–54 The lowest unoccupied molecular orbital (LUMO) energy for Zn(II) ion is −0.791 eV via density functional theory (DFT) procedures, and those of the counterparts ligands are calculated as well (−0.804 eV for L1, −0.766 eV for L2, and −0.081 eV for H2NDC) (Fig. 4).55 The results indicate that electrons may transfer from the carboxyl groups of H2NDC to Zn(II), causing blue-shifts, which can be summarized as ligand-to-metal charge transfer (LMCT).56,57 Moreover, the emission decay lifetimes of the two fluorescent materials are 0.750 μs for 1 and 0.979 μs for 2 (Fig. S6†).
3.5. Sensing of ENR by 1 and 2
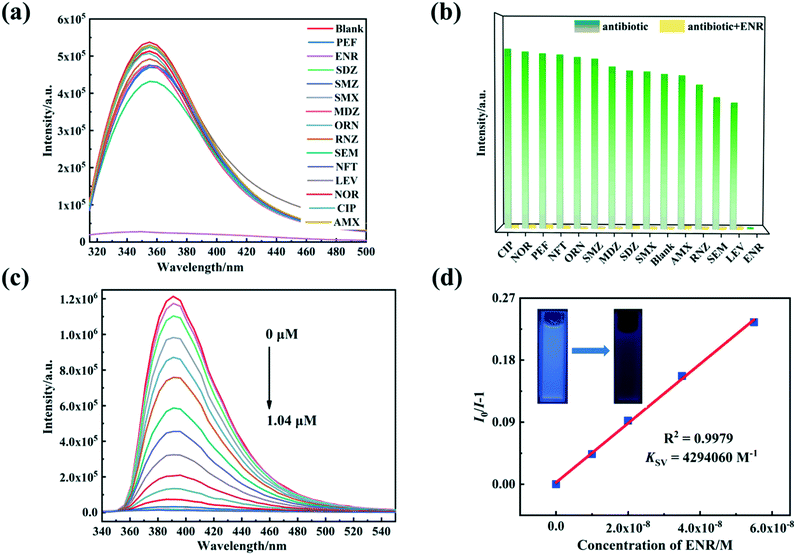
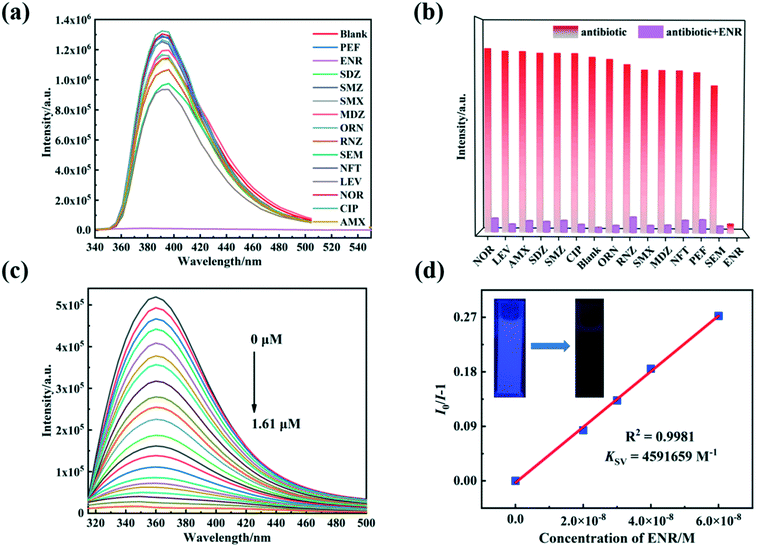
For the fluorescence detection of antibiotic molecules, 4 mg of 1/2 were separately scattered into 4 mL of aqueous antibiotic solutions and then subjected to ultrasound for 30 min to produce stable suspensions. Fluorescence emission intensities of 1–2 depend on various antibiotics. Mainly, ENR expresses apparent fluorescence quenching effects on the luminescence of 1/2, while other antibiotics only produce a little fluorescence enhancement or fluorescence quenching (Fig. 5a and 6a). When excited by 365 nm with a UV light, the suspensions of 1–2 with 0.25 μmol L−1 ENR transform the optical emission color from blue to dark blue, which allows the detection of ENR by the naked eye (inset Fig. 5d and 6d). To investigate selectivity for detecting ENR, anti-interference tests were executed in the presence of equal concentrations of other interfering antibiotics, and the results demonstrate that the other counterparts barely impact on the fluorescence responses of 1–2 toward ENR (Fig. 5b and 6b).Luminescence titration experiments were further conducted for 1–2 in different concentrations of ENR solution (Fig. 5c and 6c). With increasing ENR contents, 1–2 exhibit distinct luminescence quenching processes. The relationships were calculated between the quenching performances of 1–2 and ENR concentration (Fig. 5d, 6d and S7†). As a result, the best fit of I0/I and the concentration of ENR was established with the Stern–Volmer (S–V) equation I0/I = Ksv[ENR] + 1 (where [ENR] is the molar concentration of ENR).58 The experimental results show linear associations between luminescence quenching and ENR concentration (0–0.055 μmol L−1), similar to the Stern–Volmer (S–V) equation.59 The Ksv values by linear fitting of the plots were determined to be 4.29 × 10⁶ and 4.59 × 10⁶ L mol−1, suggesting substantial quenching efficiencies of 1–2 after the addition of ENR. Subsequently, the limits of detection (LOD) of ENR are 0.706 and 0.289 nmol L−1 for 1–2, respectively, using 3δ/k (where δ is a normal error and k is a slope according to the S−V equation).60 There were also further evaluations of the time-dependent fluorescence emission signals for 1–2@ENR (Fig. S8†). The emission intensities of 1 and 2 decrease dramatically after 30 s with the addition of ENR (0.25 μmol L−1). These results support that 1/2 can be as sensors for the sensing of ENR with excellent sensitivity (Table S4†).
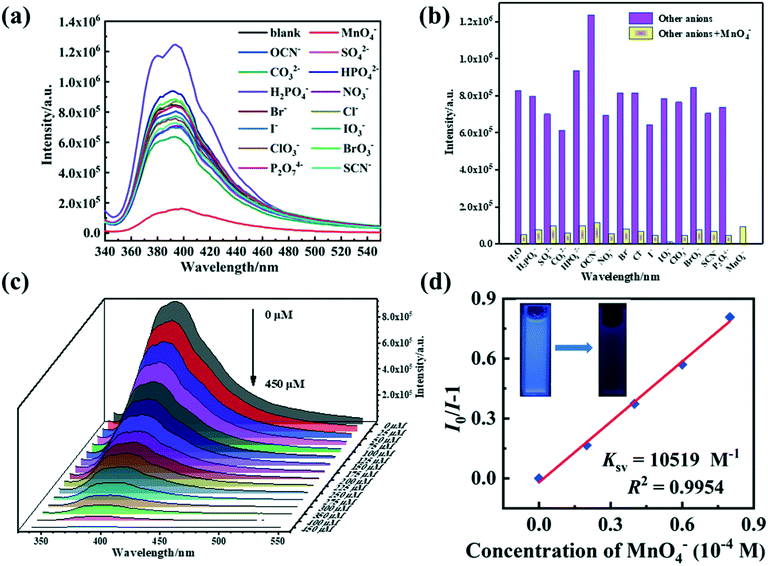
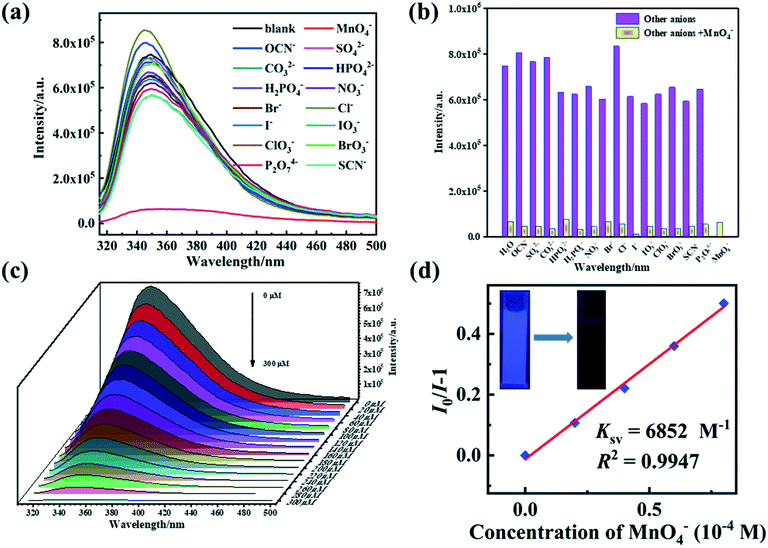
3.6. Sensing of MnO4− anions by 1 and 2
The fluorescence sensing properties of 1–2 were investigated to identify various inorganic anions in aqueous solutions. Ball-milled samples of 1–2 (4 mg) were suspended in 4 mL (H2O system) of [KxM] aqueous solutions (5 × 10⁻⁴ M) and then sonicated for approximately 30 min. In various anion solutions, the fluorescence spectra of 1–2 indicate various degrees of quenching (Fig. 7a and 8a). Only MnO4− anions display an intense quenching phenomenon for the two ternary Zn(II) MOFs, while other inorganic anions reveal limited quenching or enhancement behavior. More strikingly, the suspension of 1–2 with 3 × 10⁻³ mol L−1 MnO4− transformed the visual emission color from blue to dark blue when excited by 365 nm UV light (inset Fig. 7d and 8d). The introduction of interfering anions makes no difference to the MnO4−-induced fluorescence response, so, 1 and 2 has extreme selective discrimination ability for MnO4− anions (Fig. 7b and 8b).The quantitative fluorescent titration experiments of 1–2 show that the fluorescence intensities of the suspensions of two MOFs decrease steadily with an increase in the concentration of MnO4− anions (Fig. 7c and 8c). In general, S–V kinetic equations were used to account for the relationships between the concentration of MnO4− anions and the effects of the quenching process (Fig. 7d, 8d and S9†).61 The curves of [I0/I − 1] versus MnO4− anion concentration at low concentration stages show a linear association which is primarily due to static quenching.62 The Ksv values of 1–2 are calculated to be 1.05 × 10⁴ and 5.48 × 10³ L mol−1, and the LOD values are 0.288 and 0.242 μmol L−1 for 1/2, respectively. The fluorescence responses were further determined over time after 140 μmol L−1 of MnO4− anions were added. As shown in Fig. S10,† the measurement times for 1/2@MnO4− are 30 s. Compared with the previously reported MOF-based fluorescence probes for the detection of MnO4− anions, 1/2 are promising fluorescent probes with excellent sensitivity and selectivity (Table S5†).
3.7. Post-processing analysis
Reversibility experiments were performed to verify the recyclability of 1–2 for ENR and MnO4− anion sensing. 1–2 powders were immersed in the targeted species solutions for 24 h for fluorescence detection, which can be recovered by centrifugation, washing with water and ethanol, and air drying. After four cycles, the quenching performance of recovered 1–2 for ENR/ MnO4− anions is still obviously observed (Fig. S11†). After the cyclic tests, the PXRD spectra of 1–2 are compatible with those of the synthesized initial ones, meaning that the repeatability of 1–2 is good (Fig. S12†). In a word, the two Zn(II) MOFs are prospective sensors with high selectivity and sensitivity to detect ENR/MnO4− anions.633.8. Mechanism of luminescence quenching
Neither of the Zn(II) MOFs show apparent channel structures, so the ENR/MnO4− only can contact the surface portion of two Zn(II) MOFs (Table S6†).64 PXRD patterns of 1 and 2 after four cycles are in line with those of the primary ones, indicating that the structures of 1–2 do not change during the detection processes (Fig. S12†). Furthermore, UV-vis absorption spectra of ENR/MnO4− exhibit overlaps with the luminescence excitation peaks of 1/2, suggesting that the photon energy will be competitively absorbed between ENR/MnO4− and the Zn(II) MOF sensing systems (Fig. S13 and S14†). So, the photo-competitive absorption is the main reason for the luminescent quenching phenomenon of 1/2 by ENR/MnO4−.65–674. Conclusion
Two ternary Zn(II) MOFs were synthesized under hydrothermal conditions. The coordination modes of NDC2− and N-donor ligands significantly influence the MOF assembly processes. 1 and 2 as fluorescent sensors exhibit high selectivity and sensibility with low detection limits and good recyclability for detecting ENR and MnO4− anions in water media. The two Zn(II) MOFs can be applied as promising fluorescent probes to detect ENR and MnO4− oxyanions in aqueous solutions.Conflicts of interest
The authors have declared no conflict of interest.Acknowledgements
The project was supported by the Natural Science Foundation–Steel and Iron Foundation of Hebei Province (B2021209020). O. A. B. thanks the Ministry of Education and Science of the Russian Federation for financial support within grant No. 0778-2020-0005.References
- X. Liu, J. C. Steele and X. Z. Meng, Environ. Pollut., 2017, 223, 161–169 CrossRef CAS PubMed.
- Z. Hasan and S. H. Jhung, J. Hazard. Mater., 2015, 283, 329–339 CrossRef CAS PubMed.
- F. Y. Ge, G. H. Sun, L. Meng, S. S. Ren and H. G. Zheng, Cryst. Growth Des., 2019, 20, 1898–1904 CrossRef.
- J. R. Zhang, J. J. Lee, C. H. Su, M. J. Tsai, C. Y. Li and J. Y. Wu, Dalton Trans., 2020, 49, 14201–14215 RSC.
- S. Safaei, J. Wang and P. C. Junk, J. Solid State Chem., 2020, 294, 121762 CrossRef.
- Z. P. Dong, F. Zhao, L. Zhang, Z. L. Liu and Y. Q. Wang, New J. Chem., 2020, 44, 10239–10249 RSC.
- Y. Cao, Y. Zhang, L. W. Gu, X. M. Qin, H. Y. Li, H. D. Bian and F. P. Huang, New J. Chem., 2020, 44, 10681–10688 RSC.
- N. Abdollahi and A. Morsali, Anal. Chim. Acta, 2019, 1064, 119–125 CrossRef CAS PubMed.
- M. Locatelli, M. T. Ciavarella, D. Paolino, C. Celia, E. Fiscarelli, G. Ricciotti, A. Pompilio, G. D. Bonaventura, R. Grande, G. Zengin and L. D. Marzio, J. Chromatogr. A, 2015, 1419, 58–66 CrossRef CAS PubMed.
- Q. Zhang and Y. Ni, RSC Adv., 2017, 7, 39833–39841 RSC.
- Z. Cong, Z. Song, Y. Ma, M. Zhu, Y. Zhang, S. Wu and E. Gao, Chem. – Asian J., 2021, 16, 1773–1779 CrossRef CAS.
- Y. Hong, Y. Tan, Y. Meng, H. Yang, Y. Zhang, A. Warren, J. Li and X. Lin, Ecotoxicol. Environ. Saf., 2017, 144, 552–559 CrossRef CAS.
- S. Zhang, Y. Guo, Z. Yan, X. Sun and X. Zhang, Anal. Bioanal. Chem., 2015, 407, 8971–8977 CrossRef CAS PubMed.
- C. Y. Wang, C. C. Wang, X. W. Zhang, X. Y. Ren, B. Yu, P. Wang, Z. X. Zhao and H. Fu, Chin. Chem. Lett., 2021 DOI:10.1016/j.cclet.2021.08.095 , in press.
- L. Dong, J. Gao, X. Xie and Q. Zhou, Chemosphere, 2012, 89(1), 44–51 CrossRef CAS PubMed.
- L. Wei, H. Li and J. Lu, Environ. Pollut., 2021, 272, 115589 CrossRef CAS PubMed.
- P. R. Lakshmi, P. Nanjan, S. Kannan and S. Shanmugaraju, Coord. Chem. Rev., 2021, 435, 213793 CrossRef.
- M. Bagheri and M. Y. Masoomi, ACS Appl. Mater. Interfaces, 2020, 12, 4625–4631 CrossRef CAS.
- Z. Chen, H. Jiang, M. Li, M. O'Keeffe and M. Eddaoudi, Chem. Rev., 2020, 120, 8039–8065 CrossRef CAS PubMed.
- J. H. Qin, H. Zhang, P. Sun, Y. D. Huang, Q. Shen, X. G. Yang and L. F. Ma, Dalton Trans., 2020, 49, 17772–17778 RSC.
- J. H. Qin, P. Xu, Y. D. Huang, L. Y. Xiao, W. Lu, X. G. Yang, L. Ma and S. Q. Zang, Chem. Commun., 2021, 57, 8468–8471 RSC.
- H. Fu, N. Wang, J. Qin, M. Han, L. Ma and F. Wang, Chem. Commun., 2018, 54, 11645–11648 RSC.
- H. Fu, L. Yan, N. Wu, L. Ma and S. Zang, J. Mater. Chem. A, 2018, 6, 9183–9191 RSC.
- Y. Zhang, H. N. Tang, B. L. Li and B. Wu, Chin. J. Struct. Chem., 2021, 40, 595–602 CAS.
- L. L. Qian, Z. X. Wang, J. G. Ding, H. X. Tian, K. Li, B. L. Li and H. Y. Li, Dyes Pigm., 2020, 175, 108159 CrossRef CAS.
- G. P. Yang, X. X. Luo, Y. F. Liu, K. Li and X. L. Wu, ACS Appl. Mater. Interfaces, 2021, 13, 46902–46908 CrossRef CAS.
- W. P. Wang, H. L. Wang and B. L. Li, Chin. J. Struct. Chem., 2020, 39(10), 1835–1840 Search PubMed.
- A. Mukhopadhyay, S. Jindal, G. Savitha and J. N. Moorthy, Inorg. Chem., 2020, 59, 6202–6213 CrossRef CAS PubMed.
- J. X. Yang, X. Zhang, Y. Y. Qin and Y. G. Yao, Cryst. Growth Des., 2020, 20, 6366–6381 CrossRef CAS.
- Q. Q. Zhu, Q. S. Zhou, H. W. Zhang, W. W. Zhang, D. Q. Lu, M. T. Guo, Y. Yuan, F. Sun and H. He, Inorg. Chem., 2020, 59, 1323–1331 CrossRef CAS PubMed.
- Y. Mu, Y. Ran, B. Zhang, J. Du, C. Jiang and J. Du, Cryst. Growth Des., 2020, 20, 6030–6043 CrossRef CAS.
- L. Yu, Q. Zheng, H. Wang, C. Liu, X. Huang and Y. Xiao, Anal. Chem., 2020, 92, 1402–1408 CrossRef CAS PubMed.
- K. Zhu, R. Fan, X. Zheng, P. Wang, W. Chen, T. Sun, S. Gai, X. Zhou and Y. Yang, J. Mater. Chem. C, 2019, 7, 15057–15065 RSC.
- S. F. Zhou, B. B. Hao, T. Lin, C. X. Zhang and Q. L. Wang, Dalton Trans., 2020, 49, 14490–14496 RSC.
- Y. Yao, Y. Zhou, T. Zhu, T. Gao, H. Li and P. Yan, ACS Appl. Mater. Interfaces, 2020, 12, 15338–15347 CrossRef CAS.
- Y. S. Shi, Y. H. Li, G. H. Cui and G. Y. Dong, CrystEngComm, 2020, 22, 905–914 RSC.
- J. Ma, N. Xu, Y. Liu, Y. Wang, H. Li, G. Liu, X. Wang and J. Li, Inorg. Chem., 2020, 59, 15495–15503 CrossRef CAS PubMed.
- C. H. Liu, Q. L. Guan, X. D. Yang, F. Y. Bai, L. X. Sun and Y. H. Xing, Inorg. Chem., 2020, 59, 8081–8098 CrossRef CAS.
- Y. S. Shi, Q. Yu, J. W. Zhang and G. H. Cui, CrystEngComm, 2021, 23, 1604–1615 RSC.
- B. Qin, X. Zhang and J. Zhang, Cryst. Growth Des., 2020, 20, 5120–5128 CrossRef CAS.
- V. A. Blatov, A. P. Shevchenko and D. M. Proserpio, Cryst. Growth Des., 2014, 14, 3576–3586 CrossRef CAS.
- E. V. Alexandrov, A. P. Shevchenko and V. A. Blatov, Cryst. Growth Des., 2019, 19, 2604–2614 CrossRef CAS.
- Y. Zhao, X. Xu, L. Qiu, X. Kang, L. Wen and B. Zhang, ACS Appl. Mater. Interfaces, 2017, 9, 15164–15175 CrossRef CAS PubMed.
- B. Ashok, N. Hariram, S. Siengchin and A. V. Rajulu, J. Bioresour. Bioprod., 2020, 5, 180–185 CrossRef CAS.
- C. X. Zheng, S. L. Zhu, Y. Lu, C. T. Mei, X. W. Xu, Y. Y. Yue and J. Q. Han, J. For. Eng., 2020, 5, 93–100 Search PubMed.
- W. Tan, X. L. Hao, Q. W. Wang and R. X. Ou, J. For. Eng., 2020, 5, 97–103 Search PubMed.
- L. Zhu, Y. Gu and G. Wu, J. For. Eng., 2020, 5, 97–102 Search PubMed.
- M. N. Uddin, T. Ferdous, Z. Islam, M. S. Jahan and M. A. Quaiyyum, J. Bioresour. Bioprod., 2020, 5, 196–203 CrossRef CAS.
- Z. Chen, H. Gao, W. Li, S. Li, S. Liu and J. Li, J. For. Eng., 2020, 5, 1–12 CrossRef.
- S. Chen, S. Jiang and H. Jiang, J. Bioresour. Bioprod., 2020, 5, 238–247 CrossRef CAS.
- Y. Cao, X. Wang, Y. Li, D. Shen, Y. P. Dai, S. Z. Zhang and W. G. Zhang, J. For. Eng., 2020, 5, 109–115 Search PubMed.
- Z. Q. Liu, Y. Zhao, X. D. Zhang, Y. S. Kang, Q. Y. Lu, M. Azam, S. I. Al-Resayes and W. Y. Sun, Dalton Trans., 2017, 46, 13943–13951 RSC.
- J. Troyano, E. Zapata, J. Perles, P. Amo-Ochoa, V. Fernández-Moreira, J. I. Martínez, F. Zamora and S. Delgado, Inorg. Chem., 2019, 58, 3290–3301 CrossRef CAS PubMed.
- X. Zhou, Y. X. Shi, C. Cao, C. Y. Ni, Z. G. Ren, D. J. Young and J. P. Lang, Cryst. Growth Des., 2019, 19, 3518–3528 CrossRef CAS.
- A. Üngördü and N. Tezer, J. Mol. Graphics Modell., 2017, 74, 265–272 CrossRef PubMed.
- X. G. Yang, Z. M. Zhai, X. M. Lu, Y. Zhao, X. H. Chang and L. F. Ma, Dalton Trans., 2019, 48, 10785–10789 RSC.
- Y. Rachuri, B. Parmar, K. K. Bisht and E. Suresh, Dalton Trans., 2017, 46, 3623–3630 RSC.
- G. Liu, Y. Li, J. Chi, N. Xu, X. Wang, H. Lin, B. Chen and J. Li, Dalton Trans., 2019, 49, 737–749 RSC.
- Z. H. Jiao, X. L. Jiang, S. L. Hou, M. H. Tang and B. Zhao, Inorg. Chem., 2020, 59, 2171–2177 CrossRef CAS PubMed.
- Y. Ma, Y. Zhang, X. Li, P. Yang, J. Y. Yue, Y. Jiang and B. Tang, Anal. Chem., 2020, 92, 3722–3727 CrossRef CAS PubMed.
- G. Chakraborty, P. Das and S. K. Mandal, ACS Appl. Mater. Interfaces, 2020, 12, 11724–11736 CrossRef CAS PubMed.
- X. M. Yin, L. L. Gao, P. Li, R. Bu, W. J. Sun and E. Q. Gao, ACS Appl. Mater. Interfaces, 2019, 11, 47112–47120 CrossRef CAS PubMed.
- L. Guo, X. F. Zeng, J. H. Lan, J. Yun and D. P. Cao, ChemistrySelect, 2017, 2, 1041–1047 CrossRef CAS.
- F. J. Zhao, G. Zhang, Z. Ju, Y. X. Tan and D. Yuan, Inorg. Chem., 2020, 59, 3297–3303 CrossRef CAS PubMed.
- L. Wu, C. Huang, B. P. Emery, A. C. Sedgwick, S. D. Bull, X. P. He, H. Tian, J. Yoon, J. L. Sessler and T. D. James, Chem. Soc. Rev., 2020, 49, 5110–5139 RSC.
- M. Y. Fan, H. H. Yu, P. Fu, Z. M. Su, X. Li, X. L. Hu, F. W. Gao and Q. Q. Pan, Dyes Pigm., 2021, 185, 108834 CrossRef CAS.
- W. Jia, S. Ren, H. Xia, C. Zhang and J. Zhang, Sens. Actuators, B, 2020, 317, 128230 CrossRef CAS.
Footnote |
| † Electronic supplementary information (ESI) available. CCDC 2031240 and 2043939 contain the supplementary crystallographic data for 1–2. For ESI and crystallographic data in CIF or other electronic format see DOI: 10.1039/d1ce01447a |
| This journal is © The Royal Society of Chemistry 2022 |

