Electrochemical surface-enhanced Raman spectroscopy (EC-SERS): a tool for the identification of polyphenolic components in natural lake pigments†
M. M.
Eisnor
 a,
K. E. R.
McLeod
 a,
S.
Bindesri
a,
S. A.
Svoboda
b,
K. L.
Wustholz
c and
C. L.
Brosseau
a,
S.
Bindesri
a,
S. A.
Svoboda
b,
K. L.
Wustholz
c and
C. L.
Brosseau
 *a
*a
aDepartment of Chemistry, Saint Mary's University, Halifax, B3H 3C3, Nova Scotia, Canada. E-mail: christa.brosseau@smu.ca; Fax: +902 496-8104; Tel: +902 496-8175
bDepartment of Conservation, The Colonial Williamsburg Foundation, Williamsburg, Virginia, USA
cDepartment of Chemistry, William & Mary, Williamsburg, Virginia, USA
First published on 30th November 2021
Abstract
The identification of natural organic pigments is important for the conservation, preservation, and historical interpretation of artwork. Due to the fugitive nature of the natural dye components in pigments, their analysis can be complicated by issues such as low concentration and sample complexity. In addition, these pigments are exceedingly diverse, and often represent complex mixtures which are difficult to analyse without a separation step. A particularly challenging class of dyes is the natural yellow polyphenols (i.e. quercetin, rhamnetin, emodin, etc.). Several techniques have been used successfully for the identification of phenolic compounds in a complex mixture, but the majority of these methods require advanced instrumentation and one or more separation steps. In addition, these methods may lack the sensitivity needed to detect minute amounts of pigment remaining in faded artwork. As a result, there is a need for innovative methods of analysis which can be applied to the interpretation of artworks containing natural dyes. In this work, cost-effective screen printed electrodes (SPEs) modified with silver nanoparticles (AgNP) were used to amplify the electrochemical SERS response of phenolic compounds. In particular, application of a voltage to the SERS substrate allows for a fine-tuning of the SERS signal, and was successfully used to separately characterize dye components in two natural yellow lake pigments, Reseda Lake and Stil de Grain. To our knowledge, this work represents the first electrochemical surface-enhanced Raman spectroscopy (EC-SERS) study of polyphenolic dye mixtures, and is the first application of EC-SERS for natural pigment analysis. This work establishes EC-SERS as a useful technique for the identification of complex natural dyes which may find potential use in the cultural heritage realm.
Introduction
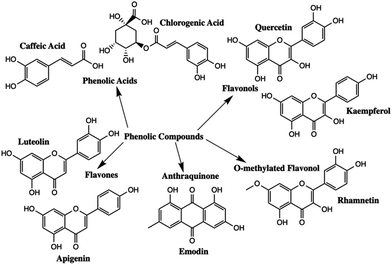
Polyphenolic compounds are one of the largest and most widespread groups of secondary plant metabolites, and are commonly found in many fruits and vegetables.1–5 Polyphenols have been of scientific interest because of their role in plant pigmentation, reproduction, and protection against predators and pathogens.1 In addition, phenolic compounds have antioxidant properties that exhibit a wide range of beneficial effects including antibacterial, antiviral, and anti-inflammatory properties.1,2,6 The two major subgroups of polyphenolic compounds are phenolic acids and flavonoids.7–9 The major types of polyphenolic compounds found in nature are summarized in Fig. 1.Different polyphenols have quite distinct chromophores which are responsible for the colour found in many natural dyes and pigments. Natural colourants have been used since antiquity for the colouring of food, leather, wool, silk, cotton and fur.10 Simultaneously, they were used to colour cosmetic products and to manufacture inks, watercolours and other artist's materials.10 Flavonoids are the main chromophores present in yellow pigments such as Reseda Lake and Stil de Grain. The main chromophores present in Reseda Lake, which is made from the weld plant (Reseda luteola), are apigenin and luteolin.11,12 Emodin, kaempferol, quercetin and rhamnetin are the primary chromophores present in Stil de Grain, a pigment made from buckthorn berries (Rhamnus cathartica).11
Various analyses have been conducted on natural dyes and pigments; however, the separation and identification of polyphenols present in artworks can be a significant analytical challenge. In particular, the differentiation of the various stereo and structural isomers is difficult.13 Other common limitations include the complex nature of the sample and that sampling from artwork is often extremely limited or not possible. In addition, complexation of chromophores with metal salts to produce lake pigments, and undesired interactions with other matrix components (i.e. the textile, binding media, fillers and extenders) can further complicate the analysis.14 Furthermore, exposure to light, air and humidity often leads to degradation of the chromophores.15 Indeed, when natural yellow dyes are present in an optical mixture, such as a green, the yellow dye may fade and the blue pigment will remain, resulting in an unnatural blue appearance for elements within paintings where the original intention was a green colour (leaves, grass, etc.).16
Raman spectroscopy is a powerful and promising technique for dye and pigment analysis in artworks.11,14,17–21 This spectroscopic technique, based on inelastic scattering of light, provides valuable molecular fingerprints, however a significant disadvantage is the very low number of photons that Raman scatter, making Raman spectroscopy an inherently weak method.20–23 Surface-enhanced Raman spectroscopy (SERS) is more advantageous compared to normal Raman spectroscopy because of its greatly increased Raman signal and significantly reduced fluorescence.24
In recent decades, SERS has proved useful for the identification of chromophores found in the various dyes and pigments used in art, including yellow lake pigments. Jurasekova et al. reported through their exploration of weld-dyed wool that certain flavonoids such as luteolin dominated the SERS signal when present in a mixture containing other chromophores such as apigenin.17 The Raman cross section of luteolin is larger than that of apigenin, and as such, it is the predominant species contributing to the SERS signal for the mixture.17 This is clearly a limitation when seeking to apply SERS analysis to a complex mixture containing multiple dyestuffs.
A notable challenge when analysing lake pigments in particular is that the chromophores are bound to a metal ion, such as calcium or aluminium, which is called a mordant. Thus, it is difficult for the chromophores to adsorb easily onto the metal SERS substrate, preventing an efficient SERS response for these molecules.14 Consequently, several ad hoc sample pre-treatments have been developed prior to SERS analysis to release the dye from the mordant.11,14,25 SERS experiments on lake pigments initially relied on extractions in strong acids or alkali.14 For example, Pozzi et al. reported that sulfuric and hydrochloric acids were successfully used for the SERS analysis of yellow dyes and lake pigments in oil paint.26 Mayhew et al. established a simple hydrolysis step using 1![[thin space (1/6-em)]](https://www.rsc.org/images/entities/char_2009.gif) :
:![[thin space (1/6-em)]](https://www.rsc.org/images/entities/char_2009.gif) 3 hydrochloric acid/methanol at room temperature that was effective in producing high-quality SERS spectra for commercially available Stil de Grain and Reseda Lake.11 Many other SERS analyses performed on several yellow dyes and lake pigments including in art samples have been reported in the literature.27–30 These contributions over the past two decades highlight a longstanding interest in the SERS analysis of yellow dyes within the conservation community and showcase the application of SERS to art historical objects, primarily textiles.
3 hydrochloric acid/methanol at room temperature that was effective in producing high-quality SERS spectra for commercially available Stil de Grain and Reseda Lake.11 Many other SERS analyses performed on several yellow dyes and lake pigments including in art samples have been reported in the literature.27–30 These contributions over the past two decades highlight a longstanding interest in the SERS analysis of yellow dyes within the conservation community and showcase the application of SERS to art historical objects, primarily textiles.
The usefulness and versatility of SERS for art conservation studies is demonstrated in many prior works and has been extensively featured in several review articles.14,30 Nevertheless, a common issue arises when investigating colourants; just one of the many components in the sample typically gives a dominant SERS response, while the other chromophores are not detected. Additionally, certain chromophores tend to be easier to identify such as the anthraquinone-based red dyes (alizarin, cochineal) compared to natural phenolic yellow colourants.11,31 Hence, a separation technique prior to the SERS analysis is often needed when studying complex dye mixtures. TLC-SERS has worked well for purple and red dyes such as alizarin and purpurin and in addition has been explored for yellow (non-flavonoid) dyes as well.32–34 However, existing approaches to integrate analyte separations with SERS require relatively large samples, which is problematic for analysis of cultural heritage objects.
Electrochemical surface-enhanced Raman spectroscopy (EC-SERS) combines electrochemistry and SERS wherein an electric potential is applied to the nanostructured working electrode in the presence of an electrolyte.21,24,35 Through variation of the applied voltage, the magnitude of the SERS signal can be enhanced via several avenues, including electrostatic interactions (surface charge for silver is less positive as the potential is stepped in the negative direction), reductive desorption of interfering matrix species at more negative potentials, and potential-induced re-orientation of the analyte which can result in an enhanced signal via application of the surface selection rules. In addition, variation of the electrode voltage results in variation of the Fermi level for the metal, which can increase charge transfer between the analyte and the metal surface, thus enhancing the chemical mechanism in SERS. In general, EC-SERS spectra are highly comparable to SERS spectra recorded on metallic colloids in the absence of applied voltage, except in cases where potential-dependent re-orientation of molecules is significant and highly evident in the EC-SERS spectra.
EC-SERS has many advantages, including being sensitive and selective, portable and cost-effective.21 By applying an electric potential to the surface of a substrate, the SERS signal for the analyte can be greatly enhanced, consequently improving the SERS intensity for various molecules, therefore making EC-SERS a very sensitive technique.36–39 Perhaps more importantly, by adjusting the potential of the SERS-active electrode, different components of a complex mixture can adhere to the surface of the electrode sequentially, thereby greatly improving the selectivity of SERS for complex mixtures. Selective adsorption of components in a mixture onto an electrified interface can occur due to differences in molecular charge, shape and functional groups. EC-SERS has previously been used to analyse other polyphenols such as p-coumaric and ferulic acid.40 In this work, Dendisová et al. showcased how application of a potential could change the adsorption mechanism of these compounds onto the surface of gold, silver and copper substrates.40
The goal of this current research was to develop a spectroelectrochemical tool for detection of polyphenols in yellow lake pigments. In this work, eight common polyphenolic dyes were characterized using EC-SERS, highlighting the applied potential at which their signal is maximized. This approach was then demonstrated on a mixture, and then expanded successfully to two yellow lake pigments, Reseda Lake and Stil de Grain. For both pigment samples, EC-SERS allowed for the detection of multiple different chromophores. To the best of our knowledge, this work represents the first EC-SERS investigation of polyphenolic yellow dyes and their mixtures.
Experimental
Reagents and solutions
All glassware was cleaned in an acid bath of 95-98% ACS grade sulfuric acid for several hours and rinsed thoroughly with Milli-Q ultra-pure water (>18.2 MΩ cm) prior to use. Ultra-pure water was also used to prepare all aqueous solutions. Reseda Lake and Stil de Grain lake pigments were purchased from Kremer Pigments (New York, USA). Polyphenol analytical standards of luteolin (95%), quercetin dehydrate (96%), caffeic acid (98%), chlorogenic acid (96%), emodin (96%), apigenin (95%), rhamnetin (98%), and kaempferol (96%) were purchased from Toronto Research Chemicals (TRC) Canada (Toronto, Ontario). All chemicals were used without further purification and all solutions were prepared using formic acid/methanol (5![[thin space (1/6-em)]](https://www.rsc.org/images/entities/char_2009.gif) :
:![[thin space (1/6-em)]](https://www.rsc.org/images/entities/char_2009.gif) 95%). Formic acid was purchased from Anachemia (Montreal, QC) and Fisher Scientific (Ottawa, Ontario). Methanol (99.9%) was purchased from Fisher Scientific (Ottawa, Ontario). AgNO3 (99.9999%), NaBH4 (≥96%), NaF (99%), and KCl (≥99%) were all purchased from Sigma Aldrich (St, Louis, MO, USA). Citric acid (>99%) was purchased from Alfa Aesar (Tewksbury, MA, USA) and sodium citrate from ACP (Montreal, Quebec). Carbon screen printed electrodes (SPEs) (15 × 61 × 0.36 mm) used to make substrates for EC-SERS were purchased from Pine Research Instrumentation (Durham, NC, USA). Argon (99.999%) was purchased from Air Liquide Canada Inc. (Montreal, Quebec, Canada).
95%). Formic acid was purchased from Anachemia (Montreal, QC) and Fisher Scientific (Ottawa, Ontario). Methanol (99.9%) was purchased from Fisher Scientific (Ottawa, Ontario). AgNO3 (99.9999%), NaBH4 (≥96%), NaF (99%), and KCl (≥99%) were all purchased from Sigma Aldrich (St, Louis, MO, USA). Citric acid (>99%) was purchased from Alfa Aesar (Tewksbury, MA, USA) and sodium citrate from ACP (Montreal, Quebec). Carbon screen printed electrodes (SPEs) (15 × 61 × 0.36 mm) used to make substrates for EC-SERS were purchased from Pine Research Instrumentation (Durham, NC, USA). Argon (99.999%) was purchased from Air Liquide Canada Inc. (Montreal, Quebec, Canada).
Silver nanoparticle (AgNP) synthesis
Silver colloids were prepared using a modified Lee and Meisel method as previously reported.38,41 Briefly, 1.0 mL of silver nitrate solution (0.1 M), 3.4 mL of aqueous sodium citrate (5%), and 0.6 mL of citric acid (0.17 M) were added into a 250 mL three-neck flat-bottom flask with 95.0 mL of water. In addition, 0.2 mL of freshly prepared sodium borohydride solution (0.1 mM) was then added into the above mixture at room temperature under magnetic stirring. The mixture was allowed to stand at room temperature for 1 min and then brought to boil under reflux within 20 minutes under magnetic stirring. After boiling for 1 hour, the colloidal suspension was allowed to cool to room temperature. Two 715 μL aliquots of the colloidal suspension were added to Eppendorf tubes, which were then centrifuged at 8000 rpm for 20 minutes (Labnet PRISM microcentrifuge, Edison, NJ, USA). The supernatant was then removed and discarded, and the remaining paste was put into one Eppendorf tube and centrifuged again. The final paste was adjusted to a volume of 50 μL with ultrapure water.Screen printed electrode modification
Once centrifugation was complete, the AgNPs were deposited onto the working electrode of commercially available screen-printed electrodes (SPEs). The carbon SPEs (15 mm × 61 mm × 0.36 mm) were purchased from Pine Research Instrumentation (Durham, NC, USA) and consisted of a silver/silver chloride (Ag/AgCl) reference electrode, a carbon counter electrode, and a rectangular (5 × 4 mm) carbon working electrode. These SPEs were functionalized by depositing three 5 μL layers of the concentrated silver nanoparticle (AgNP) suspension onto the working electrode surface. The electrodes were left to dry completely after deposition of each AgNP layer, and the final layer was allowed to dry completely prior to use.Preparation of polyphenol solutions
The concentrations of the individual polyphenol standards ranged from 250 to 2000 ppm. The weighed mass of the polyphenol compound was dissolved in a 5![[thin space (1/6-em)]](https://www.rsc.org/images/entities/char_2009.gif) :
:![[thin space (1/6-em)]](https://www.rsc.org/images/entities/char_2009.gif) 95% (v/v) formic acid/methanol to obtain a solution.
95% (v/v) formic acid/methanol to obtain a solution.
EC-SERS analysis of polyphenol solutions
As published in previous work, the modified screen printed electrodes were immersed in 0.5 M KCl for 30 minutes to remove citrate and were rinsed with ultra-pure water and dried prior to use.38 This is necessary as citrate is an interference on the AgNP surface, as it contributes to the spectral signature and blocks surface access. Since citrate is readily displaced by chloride on a silver surface, this treatment provides increased SERS sensitivity. 5.0 μL of the polyphenol standard solution was then deposited onto the modified electrode surface and allowed to air dry prior to spectroscopic studies. 0.1 M sodium fluoride electrolyte solution was purged with argon prior to measurement.EC-SERS analysis Reseda Lake model dye mixture
In order to mimic the dye composition of Reseda Lake, a mixture of apigenin and luteolin was prepared for analysis. To do this, 250 ppm solutions of apigenin and luteolin standards were prepared in 5![[thin space (1/6-em)]](https://www.rsc.org/images/entities/char_2009.gif) :
:![[thin space (1/6-em)]](https://www.rsc.org/images/entities/char_2009.gif) 95% (v/v) formic acid/methanol solution. 2.5 mL of each standard were then combined to obtain a final concentration of 125 ppm of each dye component. 5 μL of the resulting extract was applied to the SERS-active electrode and allowed to dry prior to measurement.
95% (v/v) formic acid/methanol solution. 2.5 mL of each standard were then combined to obtain a final concentration of 125 ppm of each dye component. 5 μL of the resulting extract was applied to the SERS-active electrode and allowed to dry prior to measurement.
EC-SERS analysis of Reseda Lake and Stil de Grain
In order to analyse complex yellow lake pigments containing multiple dye components, Reseda Lake and Stil de Grain were chosen as model systems. The extraction protocol reported by Mayhew et al. was used for this work.11 8.0 mg of Reseda lake and 2.0 mg of Stil de Grain pigment were weighed into individual Eppendorf tubes. 100–200 μL of 1![[thin space (1/6-em)]](https://www.rsc.org/images/entities/char_2009.gif) :
:![[thin space (1/6-em)]](https://www.rsc.org/images/entities/char_2009.gif) 3 HCl/Methanol solution was added to the tubes. The tubes were left for 30 minutes, after which the extract was filtered through a 0.20 μm syringe filter, and 5 μL of the resulting extract was applied to the SERS-active electrode and allowed to dry prior to measurement.
3 HCl/Methanol solution was added to the tubes. The tubes were left for 30 minutes, after which the extract was filtered through a 0.20 μm syringe filter, and 5 μL of the resulting extract was applied to the SERS-active electrode and allowed to dry prior to measurement.
Instrumentation
All EC-SERS measurements were collected using a DXR Smart Raman spectrometer equipped with 780 nm excitation wavelength (Thermo Fisher Scientific, Mississauga, ON, Canada). The spectrometer resolution is 3 cm−1 and it is equipped with an air-cooled charge coupled device (CCD) detector. The DXR Smart Raman spectrometer is connected to a Pine Research Instrumentation portable USB Wavenow potentiostat/galvanostat (Durham, NC, USA) to perform EC-SERS measurements using 0.1 M sodium fluoride as an electrolyte. The electrochemical software was Aftermath Data Organizer (version 1.2.4843) produced by Pine Research Instrumentation. The spectroelectrochemical cell consisted of a modified glass vial (2 × 4.5 × 0.6 cm). For EC-SERS, the applied potential ranged from 0.0 V to −1.0 V vs. Ag/AgCl in increments of 0.1 V for a time interval of 30 seconds. All potentials are vs. Ag/AgCl unless otherwise stated. All spectra were corrected for laser power and acquisition time for ease of comparison. Typical powers of 80 to 120 mW were used to maximize signal and minimize photodecomposition. EC-SERS measurements performed in this way take approximately one hour to complete. Data was analysed using Origin 9.0 software (OriginLab Corporation, Northampton, MA, USA).Results and discussion
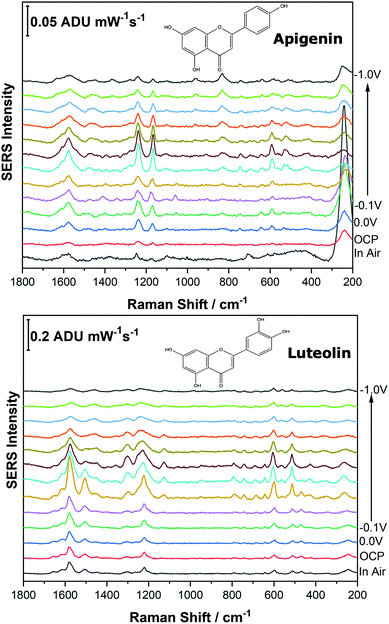
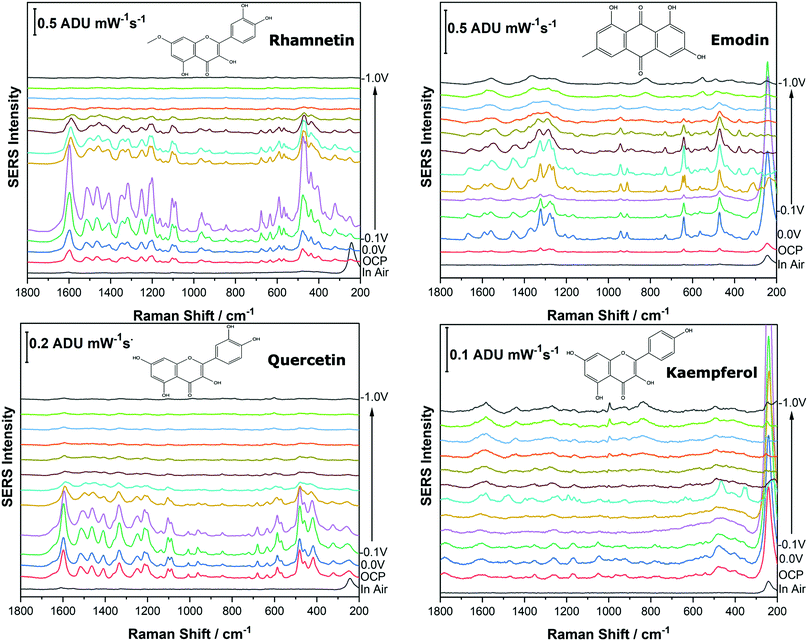
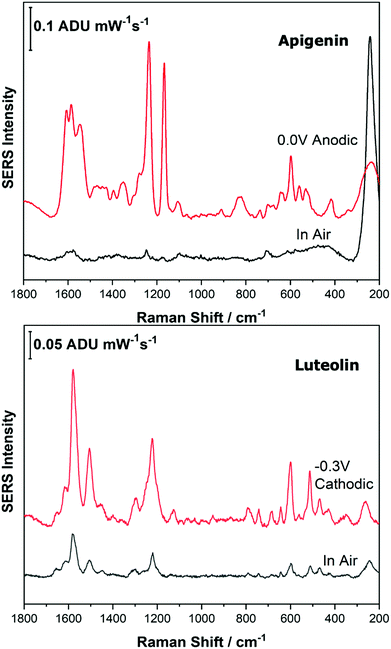
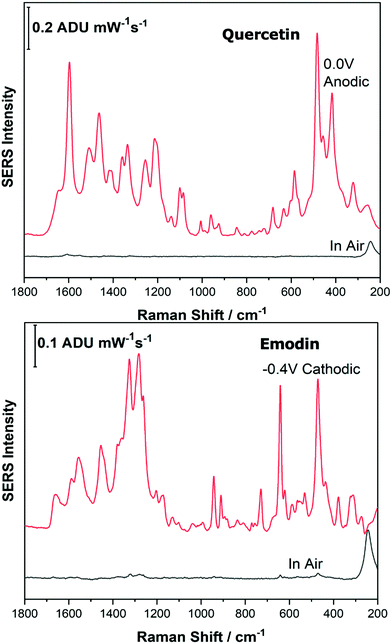
Before analysing the pigments of interest, it was crucial to analyse the known individual components present in Reseda Lake and Stil de Grain pigments. Eight polyphenols which included caffeic acid, chlorogenic acid, apigenin, luteolin, emodin, kaempferol, quercetin, rhamnetin were chosen, and EC-SERS spectra were obtained for all. For each case, 5 μL of the polyphenol standard solution was drop coated onto the modified SPE and allowed to dry prior to being placed into the spectroelectrochemical cell. Fig. 2 and 3 show the cathodic progression of 250 ppm apigenin and 2000 ppm luteolin (dye components of Reseda Lake), 500 ppm rhamnetin, 2000 ppm quercetin, 250 ppm emodin and 2000 ppm kaempferol (dye components of Stil de Grain) respectively, on the AgNP modified SPE to demonstrate the effect of applied potential on the SERS spectra. EC-SERS plots for caffeic acid and chlorogenic acid are provided in the ESI† (Fig. S-1). Table S-1 (ESI†) highlights the distinctive peaks for each dye investigated in this study.29,30,42–45 This data highlights how the spectral intensity and quality changes with the application of potential. The “in air” SERS signal represents a typical SERS signal that would be obtained in the absence of applied voltage (i.e. normal non-EC-SERS), and in most cases this “in air” spectrum is exceedingly weak, with the exception of luteolin. In some cases, once the electrolyte was added and the open circuit potential (OCP) spectrum was collected, the SERS signal was observed to be much stronger. This is likely due to the poor water solubility of these molecules, which allows for an enhanced interaction between the metal electrode surface and the molecule upon the addition of aqueous electrolyte.As the potential is stepped progressively towards −1.0 V, the SERS signal is observed to decrease in intensity for all molecules studied. Once the voltage is then stepped back in the anodic direction (data not shown), the SERS signal returns, indicating that the molecule remains close to the electrode surface after desorption, and re-adsorbs as the potential is stepped in the anodic direction. Fig. 4 and 5 compare the best EC-SERS signal with the “in air” signal for apigenin and luteolin, and quercetin and emodin, respectively. The EC-SERS spectra is a significant improvement over the “in air” spectrum obtained initially for these molecules, and this observation shows that EC-SERS has the potential to significantly improve upon the normal SERS spectra for all polyphenolic compounds investigated. Similar comparisons with the “in air” spectra are provided in the ESI,† for the other four polyphenols in this work (Fig. S2–S5).
The great improvement of the EC-SERS signal compared to the normal SERS signal for the polyphenol compounds is a result of several factors. In order to prepare the SERS electrodes for analysis, interfering citrate (the reducing agent and capping agent in the nanoparticle synthesis) is first removed through displacement with chloride anion. Consequently, the surface is covered in silver chloride, with the silver chloride stretching vibration at 240 cm−1 being the most prominent feature in the spectrum. This spectral feature disappears as the potential is stepped to more negative potentials where chloride desorption occurs. Desorption of the chloride likely allows the polyphenols better access to the surface of the electrode through electrostatic interactions. With a potential of zero charge (PZC) of −0.95 V, the silver metal surface becomes less positively charged as the potential is stepped in the negative (cathodic) direction, causing the negatively charged chloride ions to desorb from the surface at approximately −0.5 V. In addition, the peaks associated with the polyphenol compounds under investigation disappear or decrease in intensity considerably as the potential approaches −1.0 V. However, these compounds are still within the double layer region because when the potential is stepped back in the anodic direction, the SERS signal returns for these compounds.
EC-SERS analysis of a Reseda Lake model dye mixture
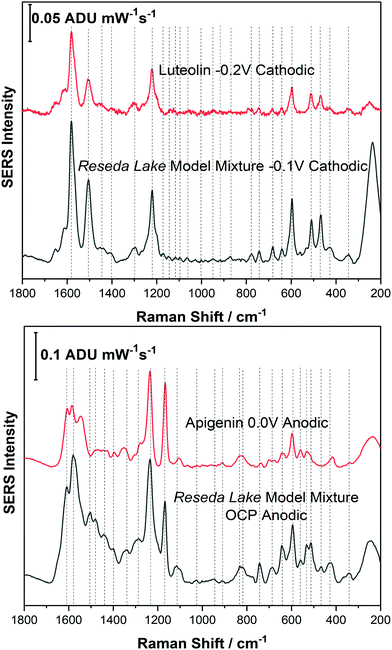
Before analysing a real pigment sample, it was important to study a model dye mixture. For example, in Reseda Lake, it is known that apigenin and luteolin are the primary dye components found in this pigment. Therefore, before analysing Reseda Lake pigment a model dye mixture consisting of apigenin and luteolin was prepared for EC-SERS analysis.Fig. 6 shows a spectral comparison of the Reseda Lake model mixture with both luteolin and apigenin standards. In the top panel of Fig. 6, the Reseda Lake model mixture at −0.1 V from the cathodic progression is compared to the luteolin standard at −0.2 V from the cathodic progression. Comparing these two spectra demonstrates that luteolin is being detected in the Reseda Lake model mixture at −0.1 V. In the bottom panel of Fig. 6 the Reseda Lake model mixture at OCP for the anodic progression is compared to the apigenin standard at 0.0 V for the anodic progression. It is observed that apigenin, another known polyphenol present in Reseda Lake, is detected instead of luteolin. From this study, it appears that as the potential increased in the cathodic direction, luteolin desorbed from the surface of the electrode. Consequently, as the potential was stepped back in the anodic direction, apigenin could adhere electrostatically to the surface of the electrode and be detected. By simply changing the voltage, another polyphenol could be detected in the model mixture, showcasing how EC-SERS can help detect more than one polyphenol present in a pigment.
EC-SERS analysis of Reseda Lake
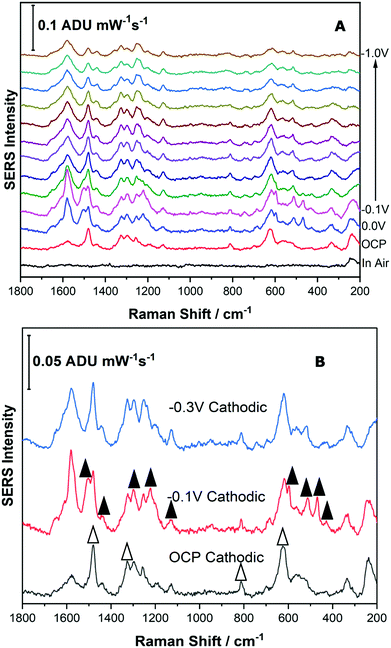
For the Reseda Lake pigment sample, a sample treatment procedure to hydrolyse and extract the chromophores was used as outlined above. 5 μL of the resulting extract was then deposited onto the SERS-active electrode and allowed to dry. The SERS signal was collected in air, and then the 0.1 M NaF supporting electrolyte was added to the spectroelectrochemical cell and the OCP spectrum was collected. Next the potential was stepped in the cathodic direction in 100 mV increments from 0.0 V to −1.0 V, and then back in the anodic direction to 0.0 V. Fig. 7 shows the EC-SERS data collected for the cathodic progression for the Reseda Lake extract.As can be observed in Fig. 7A, the “in air” spectrum for the Reseda Lake extract is exceedingly weak. When the electrolyte is added, the signal is increased significantly, as noted in the OCP spectrum. As the potential is stepped in the cathodic direction, several spectral changes are apparent. In Fig. 7B, the EC-SERS spectra for OCP, −0.1 V and −0.3 V are compared. It is clear that when compared to the spectra for the luteolin and quercetin standards (provided in the ESI,† as Fig. S-6), there are contributions from both quercetin and luteolin present. The signal at OCP is dominated by quercetin, and then at −0.1 V the spectrum is dominated by luteolin, where the signature peaks for quercetin and luteolin are denoted with white and black triangles, respectively. As the potential is stepped further in the cathodic direction, the SERS signal is dominated by luteolin but not as strongly as it is at −0.1 V. This is an interesting result for several reasons. Firstly, the main dye components observed for this lake pigment via EC-SERS are quercetin and luteolin. Apigenin was not observed to be a major contributor to the lake pigment investigated in this study, in contrast to reported studies which indicate that apigenin is a main chromophore in this pigment.1,12 Secondly, through the application of an applied voltage, the SERS signal for two different dye components is observed to be maximized at different potentials such as OCP for quercetin and −0.1 V for luteolin, highlighting the selectivity of the EC-SERS technique for the analysis of natural pigments.
EC-SERS analysis of Stil de Grain
For the next part of this study, Stil de Grain was chosen as a model yellow lake pigment because it is known to be a complex mixture; in particular four polyphenols are thought to be present in this lake pigment.11 In this study, the dye components of the Stil de Grain lake pigment were extracted and analysed by EC-SERS as described above.Fig. 8A shows the EC-SERS cathodic progression of the Stil de Grain pigment extract. Similar to the Reseda Lake sample, the “in air” signal shows no spectral signal for the dye components, suggesting that typical SERS analysis of the dye in this way would be challenging. Once the electrolyte is added, the signal for the dye components is visible, and as the potential is stepped in the cathodic direction, the SERS signal increases to a maximum at 0.0 V and then decreases. As the potential is then stepped back in the anodic direction (Fig. S-7, ESI†), the signal is observed to increase significantly, and is maximum again at 0.0 V, however this time the signal indicates a different dye component is present. Fig. 8B and C compare the EC-SERS signals recorded at −0.3 V (anodic direction) and 0.0 V (anodic direction), respectively, which are excellent spectral matches for quercetin and rhamnetin. Again, this finding highlights the excellent sensitivity and selectivity for natural dye components achieved by application of a voltage to the SERS substrate. The various dye components and the potentials at which they appear can in fact be used as a tool to identify natural pigments which may contain many similar dye components.
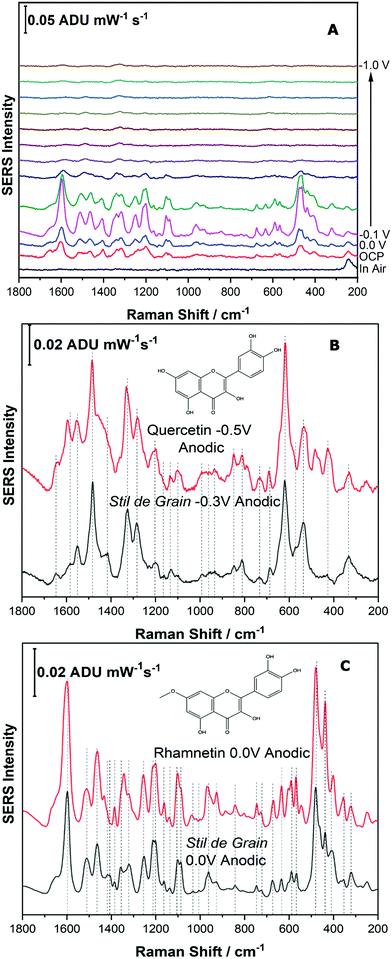 | ||
| Fig. 8 Fig. 8 (A) Cathodic progression of EC-SERS spectra for Stil de Grain extract. (B) Comparison of EC-SERS spectra for Stil de Grain extract at −0.3 V with quercetin, recorded at −0.5 V. (C) Comparison of EC-SERS spectra for Stil de Grain extract at 0.0 V anodic with rhamnetin, recorded at 0.0 V anodic. Laser excitation was 780 nm. Power at the sample was 80 mW, and acquisition time was 30 s. | ||
EC-SERS analysis of simulated Stil de Grain art sample
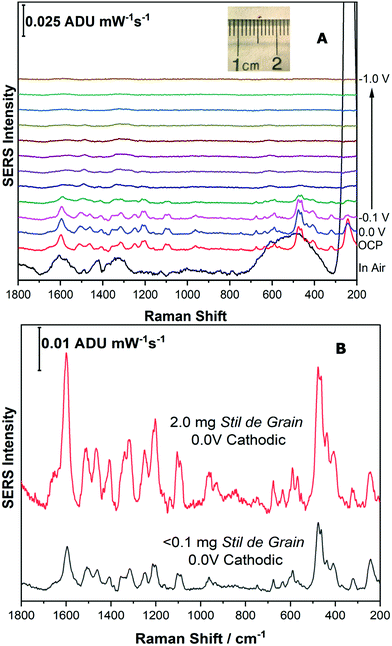
For the final part of this work, it was important to highlight that this technique could be applied to a very small sample of pigment, such as that taken from an art historical object, such as a textile. Samples taken from artworks for analysis are precious, and as a result are often exceedingly small, less than 100 μm. In addition, as many dyes have high tinting power, they are typically present in small amounts, and are often present with other components, such as binders and fillers, which further dilutes the dye.In order to simulate a typical sample from a cultural heritage object, a microscopic disperse sample of Stil de Grain pigment (1 mm diameter, <0.1 mg) was collected, shown as inset to Fig. 9A. The same extraction procedure was completed in a smaller volume of solvent (10 μL compared to 100 μL) and the EC-SERS analysis was performed successfully at an excitation power of 120 mW. As shown in Fig. 9A, the cathodic progression for the dye components is similar to the higher concentration study (Fig. 8A), although weaker in intensity. At 0.0 V, the SERS signal is maximum, and is clearly identifiable as a Stil de Grain dye component, most closely matching rhamnetin. Fig. 9B provides a comparison between the EC-SERS signal collected at 0.0 V cathodic for the 2 mg sample (top) and the simulated art sample (bottom).
In summary, this study highlighted that it is possible to scale down both the sample size required and the extraction protocol, such that samples which more closely simulate an art sample can be effectively studied. This demonstrates that EC-SERS may indeed be a useful technique for the investigation of art historical samples in the future and may be of great benefit when the sample size is limited.
Conclusions
This study investigated the detection of eight different polyphenols, a model mixture, and both Reseda Lake and Stil de Grain lake pigments using EC-SERS. The results show a greatly increased SERS signal for all polyphenols studied when EC-SERS was used, compared to traditional SERS. In particular, the polyphenol signal is intensified through the application of a voltage. For the yellow lake pigment samples, EC-SERS demonstrates an exceptional ability to differentiate between various dye components in the sample without a prior separation step. This work shows particular promise when investigating fugitive dyes in art samples as EC-SERS is very sensitive and can provide a definitive signal for a particular polyphenol even when present in a complex mixture. Since this signal is also potential-dependent, with different analytes exhibiting maximum signal at different applied voltages, the EC-SERS method is helpful for the identification of multiple chromophores that are contained within microscopic samples from art. This study has, for the first time, highlighted electrochemical SERS as a useful tool for the analysis of complex mixtures of polyphenolic compounds. Future work will seek to extend this work to art historical samples and will focus on the extent to which EC-SERS can be used for pigment fingerprinting. In addition, EC-SERS completed using portable instrumentation, such as a hand-held Raman spectrometer, would be desirable for this application.Conflicts of interest
There are no conflicts of interest to declare.Acknowledgements
C. L. Brosseau acknowledges the infrastructure support from the Canada Foundation for Innovation, the Natural Sciences and Engineering Research Council, the Canada Research Chairs Program and Research Nova Scotia. K. L. Wustholz acknowledges the Henry Dreyfus Teacher-Scholar Awards Program.Notes and references
- L. Bravo, Nutr. Rev., 1998, 56(11), 317–333 CrossRef CAS PubMed.
- Y. Rao, X. Zhao, Z. Li and J. Huang, Talanta, 2018, 190, 174–181 CrossRef CAS PubMed.
- C. Tanase, S. Coşarcă and D.-L. Muntean, Molecules, 2019, 24(6), 1182 CrossRef PubMed.
- A. N. Panche, A. D. Diwan and S. R. Chandra, J. Nutr. Sci., 2016, 5 Search PubMed.
- Z. Diaconeasa, R. Florica, D. Rugina, C. Lucian and C. Socaciu, J. Food. Nutr. Res., 2014, 2(11), 781–785 CrossRef.
- J. Hernández-Borges, G. González-Hernández, T. Borges-Miquel and M. A. Rodríguez-Delgado, Food Chem., 2005, 91(1), 105–111 CrossRef.
- M. Thiruvengadam, N. Praveen, E. Kim, S. Kim and I. Chung, Protoplasma, 2014, 555–566 CrossRef CAS PubMed.
- K. B. Pandey and S. I. Rizvi, Oxid. Med. Cell. Longev, 2009, 2(5), 270–278 CrossRef PubMed.
- L. S. Baumann, Polyphenols, 2010, 41(1), 14 Search PubMed.
- O. Deveoglu and R. Karadag, Int. J. Adv. Eng. Pure Sci., 2019, 31(3), 188–200 Search PubMed.
- H. E. Mayhew, D. M. Fabian, S. A. Svoboda and K. L. Wustholz, Analyst, 2013, 138(16), 4493–4499 RSC.
- D. Cristea, I. Bareau and G. Vilarem, Dyes Pigm., 2003, 57(3), 267–272 CrossRef CAS.
- A. Natale, D. Nardiello, C. Palermo, M. Muscarella, M. Quinto and D. Centonze, J. Chromatogr. A, 2015, 1420, 66–73 CrossRef CAS PubMed.
- A. Cesaratto, M. Leona and F. Pozzi, Front. Chem., 2019, 7, 105 CrossRef CAS PubMed.
- B. W. Pirok and P. J. Schoenmakers, J. Sep. Sci., 2018, 31(5), 242, 244, 246, 248–249 Search PubMed.
- L. A. Carlyle; S. Barrett; D. C. Stulik; H. Glanville; A. Massing; S. A. Woodcock; B. Federspiel; R. Woudhuysen-Keller; J. A. Darrah and K. I. Duffy, Historical Painting Techniques, Materials, and Studio Practice, Getty Publications, 1995 Search PubMed.
- Z. Jurasekova, C. Domingo, J. V. Garcia-Ramos and S. Sanchez-Cortes, J. Raman Spectrosc., 2008, 39(10), 1309–1312 CrossRef CAS.
- I. M. Bell, R. J. Clark and P. J. Gibbs, Spectrochim. Acta, Part A, 1997, 53(12), 2159–2179 CrossRef.
- J. R. Ferraro, Introductory Raman Spectroscopy, Elsevier, 2003 Search PubMed.
- G. Turrell and J. Corset, Raman Microscopy: Developments and Applications, Academic Press, 1996 Search PubMed.
- T. P. Lynk, C. S. Sit and C. L. Brosseau, Anal. Chem., 2018, 90(21), 12639–12646 CrossRef CAS PubMed.
- G. S. Bumbrah and R. M. Sharma, Egypt. J. Forensic Sci., 2016, 6(3), 209–215 CrossRef.
- A. Kudelski, Talanta, 2008, 76(1), 1–8 CrossRef CAS PubMed.
- B. L. Goodall, A. M. Robinson and C. L. Brosseau, Phys. Chem. Chem. Phys., 2013, 15(5), 1382–1388 RSC.
- F. Casadio, M. Leona, J. R. Lombardi and R. P. Van Duyne, Acc. Chem. Res., 2010, 43(6), 782–791 CrossRef CAS PubMed.
- F. Pozzi, J. R. Lombardi, S. Bruni and M. Leona, Anal. Chem., 2012, 84(8), 3751–3757 CrossRef CAS PubMed.
- M. V. Cañamares, M. Leona, M. Bouchard, C. M. Grzywacz, J. Wouters and K. Trentelman, J. Raman Spectrosc., 2010, 41(4), 391–397 Search PubMed.
- M. Leona and J. R. Lombardi, J. Raman Spectrosc., 2007, 38(7), 853–858 CrossRef CAS.
- C. Corredor, T. Teslova, M. V. Canamares, Z. Chen, J. Zhang, J. R. Lombardi and M. Leona, Vib. Spectrosc., 2009, 49(2), 190–195 CrossRef CAS.
- M. Leona, J. Stenger and E. Ferloni, J. Raman Spectrosc., 2006, 37(10), 981–992 CrossRef CAS.
- C. L. Brosseau, K. S. Rayner, F. Casadio, C. M. Grzywacz and R. P. Van Duyne, Anal. Chem., 2009, 81(17), 7443–7447 CrossRef CAS PubMed.
- M. V. Cañamares, D. A. Reagan, J. R. Lombardi and M. Leona, J. Raman Spectrosc., 2014, 45(11–12), 1147–1152 CrossRef.
- C. L. Brosseau, A. Gambardella, F. Casadio, C. M. Grzywacz, J. Wouters and R. P. V. Duyne, Anal. Chem., 2009, 81(8), 3056–3062 CrossRef CAS PubMed.
- F. Pozzi, N. Shibayama, M. Leona and J. R. Lombardi, J. Raman Spectrosc., 2013, 44(1), 102–107 CrossRef CAS.
- M. E. Abdelsalam, P. N. Bartlett, J. J. Baumberg, S. Cintra, T. A. Kelf and A. E. Russell, Electrochem. Commun., 2005, 7(7), 740–744 CrossRef CAS.
- A. M. Robinson, S. G. Harroun, J. Bergman and C. L. Brosseau, Anal. Chem., 2012, 84(3), 1760–1764 CrossRef CAS PubMed.
- R. A. Karaballi, A. Nel, S. Krishnan, J. Blackburn and C. L. Brosseau, Phys. Chem. Chem. Phys., 2015, 17(33), 21356–21363 RSC.
- B. H. C. Greene, D. S. Alhatab, C. C. Pye and C. L. Brosseau, J. Phys. Chem. C, 2017, 121(14), 8084–8090 CrossRef.
- A. J. Wain and M. A. O’Connell, Adv. Phys. X, 2017, 2(1), 188–209 CAS.
- M. Dendisová, Z. Němečková, M. Člupek and V. Prokopec, Appl. Surf. Sci., 2019, 470, 716–723 CrossRef.
- P. C. Lee and D. Meisel, J. Phys. Chem., 1982, 86(17), 3391–3395 CrossRef CAS.
- Z. Jurasekova, J. V. Garcia-Ramos, C. Domingo and S. Sanchez-Cortes, J. Raman Spectrosc., 2006, 37(11), 1239–1241 CrossRef CAS.
- S. Sanchez-Cortes, D. Jancura, P. Miskovsky and A. Bertoluzza, Spectrochim. Acta, Part A, 1997, 53, 769–779 CrossRef.
- I. Aguilar-Hernández, N. K. Afseth, T. López-Luke, F. F. Contreras-Torres, J. P. Wold and N. Ornelas-Soto, Vib. Spectrosc., 2017, 89, 113–122 CrossRef.
- N. Biswas, S. Kapoor, H. S. Mahal and T. Mukherjee, Chem. Phys. Lett., 2007, 444, 338–345 CrossRef CAS.
Footnote |
| † Electronic supplementary information (ESI) available. See DOI: 10.1039/d1cp03301h |
| This journal is © the Owner Societies 2022 |

