Monte carlo simulations and experiments of all-silica zeolite LTA assembly combining structure directing agents that match cage sizes†
Cecilia
Bores‡
a,
Song
Luo
b,
J.
David Lonergan
b,
Eden
Richardson
c,
Alexander
Engstrom
b,
Wei
Fan
b and
Scott M.
Auerbach
 *bc
*bc
aDepartment of Biochemistry and Molecular Biology, University of Texas Medical Branch, 301 University Blvd, Galveston, TX 77555-0304, USA
bDepartment of Chemical Engineering, University of Massachusetts Amherst, 686 N Pleasant St, Amherst, MA 01003, USA. E-mail: auerbach@umass.edu
cDepartment of Chemistry, University of Massachusetts Amherst, 710 N Pleasant St, Amherst, MA 01003, USA
First published on 29th November 2021
Abstract
We investigated the influence of organic structure-directing agents (OSDAs) on the formation rates of all-silica zeolite LTA using both simulations and experiments, to shed light on the crystallization process. We compared syntheses using one OSDA with a diameter close to the size of the large cavity in LTA, and two OSDAs of diameters matching the sizes of both the small and large LTA cavities. Reaction-ensemble Monte Carlo (RxMC) simulations predict a speed up of LTA formation using two OSDAs matching the LTA pore sizes; this qualitative result is confirmed by experimental studies of crystallization kinetics, which find a speedup in all-silica LTA crystallization of a factor of 3. Analyses of simulated rings and their Si–O–Si angular energies during RxMC crystallizations show that all ring sizes in the faster crystallization exhibit lower angular energies, on average, than in the slower crystallization, explaining the origin of the speedup through packing effects.
1. Introduction
Zeolites are nanoporous crystals used extensively in shape-selective catalysis and molecular separations.1–3 Understanding how organic structure-directing agents (OSDAs) steer zeolite syntheses towards particular crystalline frameworks could inform syntheses of new structures with advanced performance.4,5 A significant amount of research6–9 has established that OSDAs stabilize pores and channels in precursor silica networks through a mix of charge balancing, hydrophobic attractions to silica,10 and van der Waals interactions.11 In contrast, relatively little work has been done on understanding how combining different OSDAs can influence and possibly accelerate the kinetics of zeolite formation. For example, Boal et al. reported that synthesizing all-silica zeolite A (LTA) with distinct OSDAs that match LTA's small and large cage sizes is faster than that from using a single OSDA alone.12 There are many similar reports in the literature,13–20 but what's missing are atomic-level simulations of zeolite assembly,21 benchmarked by synthesis experiments, to explain the physical chemistry underlying accelerated syntheses. In the present work, we report specialized Monte Carlo simulations within the reaction ensemble, along with corresponding zeolite synthesis experiments, to investigate the formation kinetics of all-silica LTA zeolite and why using multiple OSDAs can speed up the process.Computer simulations of zeolite formation have received substantial attention21 because of their promise for revealing key steps in nucleation22 and growth,23,24 and in identifying hypothetical zeolite frameworks.25–27 The proliferation of hypothetical zeolite structures into the millions has triggered a flurry of computational studies aimed at discovering the most synthesizable new frameworks using structures,28–32 flexibilities,33 thermodynamics,34 and machine learning.35–40 Computational methods have also been developed for predicting effective OSDAs.41,42 A recent machine-learning study has even suggested that, while empty zeolite frameworks are thermodynamically metastable relative to dense polymorphs, zeolites are thermodynamically stable under aqueous synthesis conditions while containing OSDAs and considering pH.43
However, despite all this progress, simulating the process of zeolite crystallization from beginning to end with atomic-level detail remains a grand challenge. Indeed, such a simulation would have to capture 3D network formation around space-filling molecules, sample configurations efficiently despite potentially glassy dynamics, and reach the time scales – hours to days – of zeolite synthesis to yield fully-formed nanoporous crystals. Pushing computer simulations to capture such physical and chemical effects can help shed light on nanopore self-assembly, including the factors underlying accelerated syntheses.
Towards this end, we have developed a unique Monte Carlo (MC) approach for simulating silica polymerization44–46 and all-silica zeolite formation in the absence47,48 and presence of OSDAs.49,50 Our modeling approach forms interconnections among flexible SiO4 tetrahedra with hard-sphere cores,44 driven by the energetics of silica condensation obtained from DFT calculations.21 MC simulations of this model within the reaction ensemble, which sample 3D silica network structures through local reactive fluctuations that form and hydrolyze silica![[triple bond, length as m-dash]](https://www.rsc.org/images/entities/char_e002.gif) Si–O–Si
Si–O–Si![[triple bond, length as m-dash]](https://www.rsc.org/images/entities/char_e002.gif) bridges, have been shown to faithfully reproduce the sequential kinetics of silica branching measured by 29Si solid-state NMR.51 This reactive MC approach, together with a hard-sphere (space-filling) model of OSDAs, has predicted a narrow range of OSDA sizes that allows for (all silica) LTA formation,49,50 in good agreement with experimental synthesis results.12,52 From a physical chemistry perspective, these results suggest that complex mixtures of associating and non-associating hard spheres, which go beyond the normal additive hard-sphere approximation,53 can mimic important aspects of nanopore assembly around OSDAs.
bridges, have been shown to faithfully reproduce the sequential kinetics of silica branching measured by 29Si solid-state NMR.51 This reactive MC approach, together with a hard-sphere (space-filling) model of OSDAs, has predicted a narrow range of OSDA sizes that allows for (all silica) LTA formation,49,50 in good agreement with experimental synthesis results.12,52 From a physical chemistry perspective, these results suggest that complex mixtures of associating and non-associating hard spheres, which go beyond the normal additive hard-sphere approximation,53 can mimic important aspects of nanopore assembly around OSDAs.
Further research into this simulation approach will involve adding new levels of rigor to the model such as capturing chemical details of the OSDAs, and testing the present model under more complex nanopore assembly contexts. In the present work, we pursue the latter by investigating the effect of using large and small OSDAs on the relative kinetics of all-silica LTA zeolite formation, inspired by the results of Boal et al.12 We augment these simulations with synthesis experiments to probe the precise kinetics of all-silica zeolite formation with multiple OSDAs. Here, we report MC simulations yielding accelerated crystal formation confirmed by an experimental kinetics study. Furthermore, we have analyzed the rings that form during crystallization along with their energetics to help explain the speed up.
The remainder of this article is organized as follows: Section 2 outlines the simulation and experimental methods used herein; Section 3 details and discusses the simulation and experimental results; and Section 4 offers a summary and concluding remarks.
2. Materials and methods
2.1. Simulation methods
Here we outline our simulation methods; a detailed description of our approach is offered in the ESI† (Section 1). The synthesis system being modeled is shown in Fig. 1 with all-silica zeolite A (LTA) comprising small and large cavities – the so-called β- and α-cages, respectively.54 Boal et al. showed that the molecule denoted as “BULKY” in Fig. 1 serves as an effective OSDA for making all-silica LTA through fluoride-mediated synthesis.12 Following the supramolecular OSDA paradigm introduced by Corma et al.,52 two molecules of BULKY are found to occupy the α-cage in as-made LTA, coordinating like two hands in a snowball-packing configuration. The volume excluded by the composite dimer is quasi-spherical as shown by the green sphere in Fig. 1. As such, our coarse-grained molecular model of BULKY as an OSDA treats each BULKY dimer as a sphere of 10 Å in diameter, consistent with the direct, end-to-end length of BULKY. In this work, as with our previous research,49,50 we have modeled OSDAs as hard spheres to investigate their roles as pore fillers11 in nanopore formation.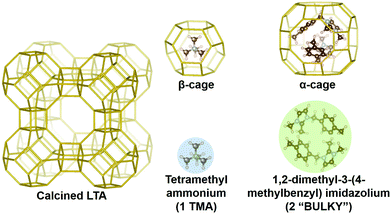 | ||
| Fig. 1 LTA zeolite with OSDAs: two BULKY molecules (green) modeled as one sphere of 10 Å in diameter, which fits in α-cage; 1 TMA (blue) modeled as a sphere of 6 Å in diameter fitting in β-cage. | ||
Boal et al. also showed that all-silica LTA can be synthesized by combining BULKY with tetramethyl-ammonium (TMA) as a secondary OSDA.12 One molecule of TMA fits well in the β-cage of LTA, and can be modeled as a hard sphere with a 6 Å diameter consistent with ion permeabilities55 (see the blue sphere in Fig. 1). OSDAs interact with the silica network in our model via hard spheres placed on each Si atom (diameter of 2 Å44,45), located at the center of each SiO4 tetrahedron. For computational simplicity, we only consider interactions between OSDAs and the silicon in each tetrahedron. We have simulated all-silica LTA formation in two cases, as follows:
• Case 1 = 1 OSDA type: 2 BULKY molecules = one 10 Å sphere
• Case 2 = 2 OSDA types: 2 BULKY = one 10 Å sphere, plus 1 TMA = one 6 Å sphere
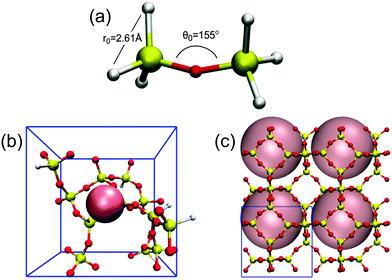
Our reaction ensemble MC (RxMC) simulations sample spatial and reactive fluctuations of flexible SiO4 tetrahedra in the presence of OSDAs, as depicted in Fig. 2. Each flexible tetrahedron is characterized by six springs connecting each O–O pair, while connected tetrahedra have Si–O–Si angles controlled by angular springs (see Fig. 2(a)). The parameters for these O–O and Si–O–Si springs (all simulation details are reported in ESI,† Section 1), which were reported previously by us,56 were determined by DFT and found to reproduce bulk moduli of several all-silica zeolites and dense polymorphs of silica. Silica polymerization around OSDAs is sampled within RxMC through local reactive fluctuations of the form:![[triple bond, length as m-dash]](https://www.rsc.org/images/entities/char_e002.gif) Si–OH + HO–Si
Si–OH + HO–Si![[triple bond, length as m-dash]](https://www.rsc.org/images/entities/char_e002.gif) ⇌
⇌ ![[triple bond, length as m-dash]](https://www.rsc.org/images/entities/char_e002.gif) Si–O–Si
Si–O–Si![[triple bond, length as m-dash]](https://www.rsc.org/images/entities/char_e002.gif) + HOH, with an RxMC probability proportional to the condensation or hydrolysis equilibrium constant (Keq). As such, our simulations contain two kinds of oxygen species: terminal oxygens representing OH groups (white atoms in Fig. 2), and bridging oxygens (red atoms in Fig. 2). Overall, the spring-tetrahedron model allows us to track the stabilities of building units such as rings during zeolite formation, and the superimposed hard-sphere interactions model the effect of volume exclusion by OSDAs.
+ HOH, with an RxMC probability proportional to the condensation or hydrolysis equilibrium constant (Keq). As such, our simulations contain two kinds of oxygen species: terminal oxygens representing OH groups (white atoms in Fig. 2), and bridging oxygens (red atoms in Fig. 2). Overall, the spring-tetrahedron model allows us to track the stabilities of building units such as rings during zeolite formation, and the superimposed hard-sphere interactions model the effect of volume exclusion by OSDAs.
We have performed simulations in the reaction ensemble at fixed volume and temperature under periodic boundary conditions. The glassiness of silica requires enhanced sampling methods such as replica exchange57 to equilibrate the system into a crystalline phase. We applied replica exchange with an adaptive grid of 28 replicas, each with its own value of Keq.48 To generate smooth crystallization curves, we averaged results over 56 identical but statistically independent replica exchange simulations, culminating in a total of 1568 RxMC runs for each synthesis case, each for 10 million MC steps. In summary, we emphasize that while there are several components to our model with varying levels of accuracy – from DFT to hard-spheres – there is no parameter in the present model fitted to reproduce experimental zeolite synthesis kinetics.
2.2. Experimental methods
We have conducted experimental syntheses of all-silica LTA using BULKY alone, and BULKY along with TMA. We did not investigate the possibility of using TMA alone because previous literature has suggested only aluminum containing low Si/Al LTA can be synthesized when TMA and Na cations are used in the synthesis gel.58 Syntheses of all-silica LTA using BULKY alone, and using BULKY with TMA, were achieved in the presence of HF as reported previously12 with modifications as detailed in the ESI† (Section 2) (HF is a dangerous reagent; use with appropriate caution.). We note that seeds were used in the syntheses, but X-ray diffraction (XRD) in Fig. S5 (ESI†) shows that the seeds dissolve in HF before the formation of a crystal phase, indicating that the seeds don’t need to be modeled in the MC simulations. To study the effect of TMA on the crystallization kinetics of LTA, TMACl was added to the synthesis gel; TMACl was used instead of TMAOH to avoid changing the pH, i.e., to avoid changing two synthesis variables at the same time. At several time points along both syntheses, materials were characterized by XRD to compare the relative crystallinities of the two materials as a function of time. (The XRD patterns at various time points during crystallization are shown in the ESI† in Fig. S4.) Relative crystallinities were calculated from the ratios of diffraction peak areas of the (003) and (122) peaks of LTA and the (100) peak of quartz, as explained in the ESI.†3. Results and discussion
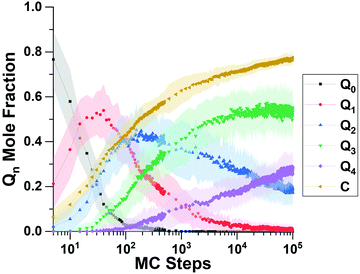
We begin this section by showing computational predictions of silica polymerization and all-silica zeolite crystallization; we then follow with experimental results to test the predictions; and end with computational results to interpret the key results in the article.Fig. 3 shows the “short time” behavior of silica polymerization as predicted by the RxMC simulations. Displayed in Fig. 3 is the evolution of the Qn distribution vs. MC step, where Qn is the mole fraction of Si atoms bound to n bridging oxygens. Devreux et al. applied 29Si solid-state NMR to measure the Qn distribution, finding an initial depletion of Q0 silica (monomers), a subsequent rise and fall of Q1 silica (dimers), then the rise and fall of Q2 silica (chains and rings), and so forth to more highly branched silica structures.51Fig. 3 shows that this kinetic signature of silica polymerization – sequential structure development – is correctly captured by our replica exchange RxMC simulations. To our knowledge, this is the first time that replica exchange RxMC has been successfully applied to compute the Qn distribution of silica polymerization. This finding indicates the reliability of the system evolution predicted by Monte Carlo at “later times.”
We simulated “longer time” progress towards crystallization by computing the degree of polymerization (DoP, yellow line in Fig. 3), which takes the value of 1 when all SiO4 tetrahedra are fully connected through![[triple bond, length as m-dash]](https://www.rsc.org/images/entities/char_e002.gif) Si–O–Si
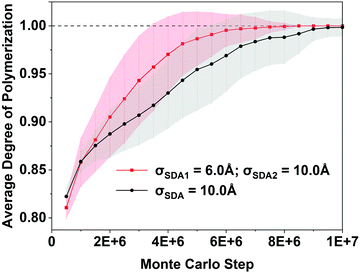
Si–O–Si![[triple bond, length as m-dash]](https://www.rsc.org/images/entities/char_e002.gif) bridges. Fig. 3 shows that the DoP is just under 0.8 after 105 MC steps; Fig. 4 shows that simulating the rise of the DoP to unity – i.e., simulating crystallization – requires 107 MC steps for this LTA system. Simulated X-ray diffraction (XRD) patterns in Fig. S1 of the ESI† confirm that these fully connected assemblies possess the LTA framework structure.
bridges. Fig. 3 shows that the DoP is just under 0.8 after 105 MC steps; Fig. 4 shows that simulating the rise of the DoP to unity – i.e., simulating crystallization – requires 107 MC steps for this LTA system. Simulated X-ray diffraction (XRD) patterns in Fig. S1 of the ESI† confirm that these fully connected assemblies possess the LTA framework structure.
Fig. 4 shows the simulated crystallization curves for the two synthesis cases, showing the DoP averaged over 56 identical RxMC runs. The BULKY-only crystallization curve is shown in black while that for BULKY/TMA is shown in red. Fig. 4 predicts a modest speedup in LTA crystallization when going from the BULKY-only synthesis to the BULKY/TMA system. One way to estimate this speedup is to compare the number of MC steps required for the shaded regions to reach the DoP = 1 line. The BULKY/TMA system reaches DoP = 1 at 3.5 × 10⁶ MC steps, while BULKY alone does so at 5.5 × 10⁶ MC steps, indicating a speedup of ∼1.6. Another way is to compare the mean number of MC steps required for crystallization, averaged over the 56 runs. Histograms of the number of MC steps required for crystallization (ESI† Fig. S2) indicate that 4.0 × 10⁶ MC steps are required on average for BULKY/TMA, and 6.0 × 10⁶ MC steps for BULKY alone, suggesting a speedup by a factor of 1.5. While modest, this MC-based prediction of a speedup in zeolite formation is statistically significant and warrants experimental testing, which we now discuss.
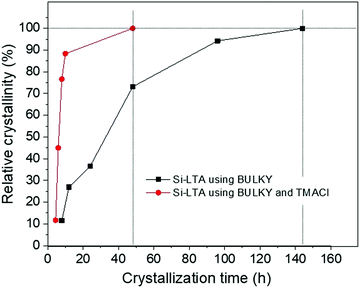
Fig. 5 shows experimental data for the relative crystallinity of LTA synthesized with BULKY alone (black line) and with both BULKY and TMACl (red line), as a function of crystallization time. We observe a clear and substantial speedup of the crystallization process by using the 2 OSDAs, in qualitative agreement with the MC predictions. The system reaches a relative crystallinity of 50% about 5 times faster when combining BULKY with TMA. Furthermore, 100% relative crystallinity is reached 3 times faster when both OSDAs are used, reaching full relative crystallinity in 48 h (BULKY/TMA) instead of 144 h (BULKY).
The MC prediction of this acceleration in the crystallization process, confirmed by experiments, represents a remarkable accomplishment for this modeling scheme. The MC model underestimates the magnitude of this speedup due to the relative simplicity of the model, in particular, the absence of long-range interactions and the omission of water and fluoride from the simulations. Learning how to include these effects while maintaining efficient, long-time sampling remains an ambitious target for future simulation work.
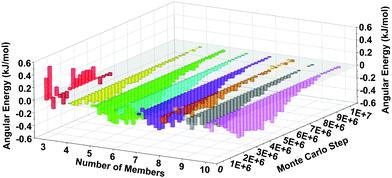
The MC simulations can point to physical origins behind the observed speedup in the LTA synthesis. Towards this end, we have analyzed the energetics of the spring-tetrahedron model during the RxMC trajectories and correlated that analysis with ring distributions computed during crystallization. Rings were obtained from snapshots of 3 × 3 × 3 periodic extensions of the RxMC simulations, using King's shortest-path algorithm for counting rings59,60 as implemented in the R.I.N.G.S. code.61 We have computed mean Si–O–Si angular energies, as a function of ring size and MC step, shown in Fig. 6 as an energy difference of BULKY/TMA energy minus BULKY energy. Fig. 6 reveals the finding that, for the faster zeolite synthesis using BULKY/TMA, all ring sizes (except for 3-rings, which are very few as shown in Fig. 7) exhibit lower average Si–O–Si angular energies than for the slower synthesis using BULKY alone. (Fig. S3 in the ESI† shows that both O–O and Si–O–Si spring energies are lower in the simulated BULKY/TMA synthesis.) We find it remarkable that all rings from 4-rings up to 10-rings are found to adopt more stable configurations during synthesis in the 2 OSDA system. Because silica and OSDAs interact as hard spheres in our RxMC simulations, the stabilization in Fig. 6 arises from packing an additional OSDA into the simulation box, coaxing the silica network and its rings into more stable geometries, thereby speeding up crystal formation.
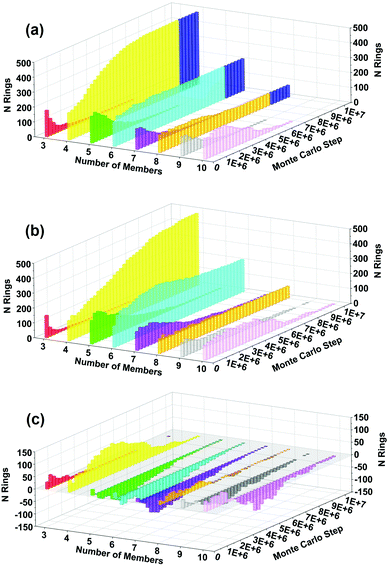
We have also analyzed the evolution of ring-size distributions during crystallization, shown in Fig. 7(a) for BULKY/TMA, Fig. 7(b) for BULKY, and the difference in Fig. 7(c). Fig. 7(c) reveals that the BULKY/TMA synthesis produces a substantial surplus of 4-rings in the BULKY/TMA system compared to that in BULKY alone. This surplus of 4-rings is significant because such rings are the major secondary building unit in LTA, as shown in the blue shaded region of Fig. 7(a). What's fascinating is that 4-rings are not the most stabilized ring size in Fig. 6, which might be expected from their substantial surplus in the BULKY/TMA system. This finding indicates that hard-sphere entropic effects are likely responsible for the surplus of 4-rings in our model of the BULKY/TMA system. As such, we find the signatures of both energetic and entropic effects in our model of the acceleration of LTA synthesis using the BULKY/TMA combination.
The results described above on energetic and entropic effects in zeolite LTA formation may be discussed in light of experimental and computational studies on the thermodynamics of zeolite synthesis. Both experimental calorimetry62 and DFT calculations63 have established that empty zeolite frameworks are thermodynamically metastable relative to dense polymorphs, leading many materials scientists to conclude that kinetic considerations are of paramount importance for determining the outcomes of zeolite synthesis experiments. However, a recent machine-learning study of zeolite synthesis energetics has reported that synthesizable zeolite phases correlate with their thermodynamic stabilities when including OSDAs in the energetics.43 These recent results underscore the importance of both thermodynamics and synthesis conditions for understanding zeolite formation.
Towards this end, Piccione, Navrotsky, and coworkers have reported results of solution calorimetry measurements during zeolite crystallization for high-silica zeolites.64 They found Gibbs free energies of zeolite crystallization in the range of −4.9 kJ mol−1 Si to −8.5 kJ mol−1 Si (±2.8 kJ mol−1 Si), with no single factor – enthalpy or entropy – dominating these Gibbs free energies. This qualitative observation – that both enthalpic and entropic factors conspire to distinguish different zeolite syntheses – is entirely consistent with the findings of our RxMC simulations detailed above. In particular, our simulations predict that all relevant rings are energetically stabilized by adding an extra hard-sphere OSDA (modeling TMA), while 4-ring production is particularly enhanced beyond what would be expected by the computed stabilization, pointing to entropic effects from hard-sphere packing. Overall, we suggest that investigating energetic and entropic effects of evolving framework-OSDA systems will lead to enhanced understanding of zeolite formation. In forthcoming work, we will report on quantifying differential entropies of crystallization from our simulations, for comparison with experimental values.
4. Summary and concluding remarks
We have studied effects of OSDAs on the molecular-level processes that trigger all-silica zeolite formation. We have performed reaction ensemble MC simulations predicting that the presence of two types of OSDAs, with hard-sphere diameters matching the sizes of the cages in zeolite LTA, speeds up zeolite LTA formation. A refined version of this model with atomic-level detail for the OSDAs will be considered in future work. We also present experimental synthesis results showing a clear and substantial speedup of LTA synthesis using both small and large OSDAs, in qualitative agreement with the MC predictions. Ring-size distributions and energetics from MC simulations indicate that having both small and large OSDAs stabilizes all ring sizes (except for 3-rings), and increases the rate of 4-ring production – the key secondary building block of the LTA structure – through entropic effects. Our results indicating the interplay of energetic and entropic results are consistent with previous thermodynamics experiments on high-silica zeolites, and provide a deeper understanding of the role of thermodynamics in zeolite assembly.Testing this molecular-level picture using in situ characterization methods such as Raman spectroscopy,65 which can characterize ring distributions in silica systems, remains an important way forward for shedding light on the roles of OSDAs, and on the early stages and key steps in zeolite formation. Furthermore, adapting the present simulation approach to model the formation of aluminosilicate zeolites requires generalizing the spring-tetrahedron model to reproduce structural and energetic properties of aluminosilicate networks, and creating computationally efficient models that capture the electrostatics of aluminosilicate networks and their interactions with cationic OSDAs. Overall, these findings present new opportunities for both improving zeolite crystallization and understanding its molecular-level mechanisms.
Author contributions
All authors contributed to writing the manuscript and/or preparing figures for publication, in addition to carrying out the simulations and/or experiments.Abbreviations
| RxMC | Reactive ensemble monte carlo. |
| OSDA | Organic structure directing agent. |
| BULKY | 1,2-Dimethyl-3-(4-methylbenzyl)imidazolium. |
| TMA | Tetramethyl-ammonium. |
Conflicts of interest
There are no conflicts to declare.Acknowledgements
This work was supported by the U. S. Department of Energy, Office of Science, Basic Energy Sciences, Materials Sciences and Engineering Division, under Award # DE-SC0019170. E. R. and A. E. acknowledge support from the NSF REU 1659266. S. M. A. is grateful to the Mahoney Family Sponsorship for funding of computing infrastructure. The authors thank Dr Sebastian le Roux for discussions about the analysis of rings.References
- S. M. Auerbach, K. A. Karrado and P. K. Dutta, Handbook of Zeolite Science and Technology. Marcel Dekker: New York, 2003, p. 1184 Search PubMed.
- S. M. Wu, X. Y. Yang and C. Janiak, Angew. Chem., Int. Ed., 2019, 58, 12340–12354 CrossRef CAS PubMed.
- Y. Li and J. Yu, Nature Reviews Materials 2021, 6, 1156–1174.
- P. Bai, M. Y. Jeon, L. Ren, C. Knight, M. W. Deem, M. Tsapatsis and J. I. Siepmann, Nat. Commun., 2015, 6, 5912 CrossRef CAS PubMed.
- L. C. Lin, A. H. Berger, R. L. Martin, J. Kim, J. A. Swisher, K. Jariwala, C. H. Rycroft, A. S. Bhown, M. Deem, M. Haranczyk and B. Smit, Nat. Mater., 2012, 11, 633–641 CrossRef CAS PubMed.
- R. F. Lobo, S. I. Zones and M. E. Davis, J. Inclusion Phenom. Mol. Recognit. Chem., 1995, 21, 47–78 CAS.
- C. S. Cundy and P. A. Cox, Microporous Mesoporous Mater., 2005, 82, 1–78 CrossRef CAS.
- J. X. Jiang, J. H. Yu and A. Corma, Angew. Chem., Int. Ed., 2010, 49, 3120–3145 CrossRef CAS PubMed.
- S. I. Zones, Microporous Mesoporous Mater., 2011, 144, 1–8 CrossRef CAS.
- S. L. Burkett and M. E. Davis, J. Phys. Chem., 1994, 98, 4647–4653 CrossRef CAS.
- A. W. Burton, J. Am. Chem. Soc., 2007, 129, 7627–7637 CrossRef CAS PubMed.
- B. W. Boal, J. E. Schmidt, M. A. Deimund, M. W. Deem, L. M. Henling, S. K. Brand, S. I. Zones and M. E. Davis, Chem. Mater., 2015, 27, 7774–7779 CrossRef CAS.
- A. B. Pinar, R. García, L. Gómez-Hortigüela and J. Pérez-Pariente, Top. Catal., 2010, 53, 1297–1303 CrossRef CAS.
- J. Grand, H. Awala and S. Mintova, CrystEngComm, 2016, 18, 650–664 RSC.
- R. K. S. Almeida, L. Gómez-Hortigüela, A. B. Pinar and J. Peréz-Pariente, Microporous Mesoporous Mater., 2016, 232, 218–226 CrossRef CAS.
- M. Castro, R. Garcia, S. J. Warrender, A. M. Z. Slawin, P. A. Wright, P. A. Cox, A. Fecant, C. Mellot-Draznieks and N. Bats, Chem. Commun., 2007, 3470–3472 RSC.
- T. Lu, R. Xu and W. Yan, Microporous Mesoporous Mater., 2016, 226, 19–24 CrossRef CAS.
- M. A. Camblor, A. Corma, M.-J. Díaz-Cabañas and C. Baerlocher, J. Phys. Chem. B, 1998, 102, 44–51 CrossRef CAS.
- A. Turrina, R. Garcia, A. E. Watts, H. F. Greer, J. Bradley, W. Zhou, P. A. Cox, M. D. Shannon, A. Mayoral, J. L. Casci and P. A. Wright, Chem. Mater., 2017, 29, 2180–2190 CrossRef CAS.
- M. Kumar, Z. J. Berkson, R. J. Clark, Y. Shen, N. A. Prisco, Q. Zheng, Z. Zeng, H. Zheng, L. B. McCusker, J. C. Palmer, B. F. Chmelka and J. D. Rimer, J. Am. Chem. Soc., 2019, 141, 20155–20165 CrossRef CAS PubMed.
- S. M. Auerbach, W. Fan and P. A. Monson, Int. Rev. Phys. Chem., 2015, 34, 35–70 Search PubMed.
- C. S. Yang, J. M. Mora-Fonz and C. R. A. Catlow, J. Phys. Chem. C, 2013, 117, 24796–24803 CrossRef CAS.
- J. R. Agger, C. B. Chong and M. W. Anderson, 3D computer simulation of zeolite A crystal growth, in Studies in Surface Science and Catalysis, ed. E. van Steen, M. Claeys and L. H. Callanan, 2004, vol. 154, pp. 1282–1288 Search PubMed.
- A. R. Hill, P. Cubillas, J. T. Gebbie-Rayet, M. Trueman, N. de Bruyn, Z. A. Harthi, R. J. S. Pooley, M. P. Attfield, V. A. Blatov, D. M. Proserpio, J. D. Gale, D. Akporiaye, B. Arstad and M. W. Anderson, Chem. Sci., 2021, 12, 1126–1146 RSC.
- D. J. Earl and M. W. Deem, Ind. Eng. Chem. Res., 2006, 45, 5449–5454 CrossRef CAS.
- R. Pophale, P. A. Cheeseman and M. W. Deem, Phys. Chem. Chem. Phys., 2011, 13, 12407–12412 RSC.
- M. D. Foster and M. M. J. Treacy A Database of Hypothetical Zeolite Structures: http://www.hypotheticalzeolites.net.
- Y. Li, J. Yu and R. Xu, Angew. Chem., Int. Ed., 2013, 52, 1673–1677 CrossRef CAS PubMed.
- V. A. Blatov, G. D. Ilyushin and D. M. Proserpio, Chem. Mater., 2013, 25, 412–424 CrossRef CAS.
- J. L. Salcedo Perez, M. Haranczyk and N. E. R. Zimmermann, Z. Kristallogr. - Cryst. Mater., 2019, 234, 437–450 CrossRef CAS.
- X. Liu, S. Valero, E. Argente, V. Botti and G. Sastre, Z. Kristallogr. - Cryst. Mater., 2015, 230, 291–299 CrossRef CAS.
- J. Lu, L. Li, H. Cao, Y. Li and J. Yu, Phys. Chem. Chem. Phys., 2017, 19, 1276–1280 RSC.
- C. J. Dawson, V. Kapko, M. F. Thorpe, M. D. Foster and M. M. J. Treacy, J. Phys. Chem. C, 2012, 116, 16175–16181 CrossRef CAS.
- E. D. Kuznetsova, O. A. Blatova and V. A. Blatov, Chem. Mater., 2018, 30, 2829–2837 CrossRef CAS.
- L. Li, B. Slater, Y. Yan, C. Wang, Y. Li and J. Yu, J. Phys. Chem. Lett., 2019, 10, 1411–1415 CrossRef CAS PubMed.
- M. Moliner, Y. Román-Leshkov and A. Corma, Acc. Chem. Res., 2019, 52, 2971–2980 CrossRef CAS PubMed.
- Z. Jensen, E. Kim, S. Kwon, T. Z. H. Gani, Y. Román-Leshkov, M. Moliner, A. Corma and E. Olivetti, ACS Cent. Sci., 2019, 5, 892–899 CrossRef CAS PubMed.
- B. A. Helfrecht, R. Semino, G. Pireddu, S. M. Auerbach and M. Ceriotti, J. Chem. Phys., 2019, 151, 154112 CrossRef PubMed.
- D. Schwalbe-Koda, Z. Jensen, E. Olivetti and R. Gómez-Bombarelli, Nat. Mater., 2019, 18, 1177–1181 CrossRef CAS PubMed.
- D. Schwalbe-Koda, S. Kwon, C. Paris, E. Bello-Jurado, Z. Jensen, E. Olivetti, T. Willhammar, A. Corma, Y. Román-Leshkov, M. Moliner and R. Gómez-Bombarelli, Science, 2021, 374, 308–315 CrossRef CAS PubMed.
- R. Pophale, F. Daeyaert and M. W. Deem, J. Mater. Chem. A, 2013, 1, 6750–6760 RSC.
- J. E. Schmidt, M. W. Deem and M. E. Davis, Angew. Chem., Int. Ed., 2014, 53, 8372–8374 CrossRef CAS PubMed.
- S. Ma, C. Shang, C.-M. Wang and Z.-P. Liu, Chem. Sci., 2020, 11, 10113–10118 RSC.
- A. Malani, S. M. Auerbach and P. A. Monson, J. Phys. Chem. C, 2011, 115, 15988–16000 CrossRef CAS.
- A. Malani, S. M. Auerbach and P. A. Monson, J. Phys. Chem. Lett., 2010, 1, 3219–3224 CrossRef CAS.
- S.-C. Chien, S. M. Auerbach and P. A. Monson, Langmuir, 2015, 31, 4940–4949 CrossRef CAS PubMed.
- S.-C. Chien, S. M. Auerbach and P. A. Monson, J. Phys. Chem. C, 2015, 119, 26628–26635 CrossRef CAS.
- C. Bores, S. M. Auerbach and P. A. Monson, Mol. Simul., 2018, 44, 453–462 CrossRef CAS.
- C. Bores, S. M. Auerbach and P. A. Monson, J. Phys. Chem. Lett., 2018, 9, 3703–3707 CrossRef CAS PubMed.
- C. Bores, S. M. Auerbach and P. A. Monson, J. Phys. Chem. Lett., 2019, 10, 6089 CrossRef CAS PubMed.
- J. Devreux, J. P. Boilot, F. Chaput and A. Lecomte, Phys. Rev. A: At., Mol., Opt. Phys., 1990, 41, 6901–6909 CrossRef PubMed.
- A. Corma, F. Rey, J. Rius, M. J. Sabater and S. Valencia, Nature, 2004, 431, 287–290 CrossRef CAS PubMed.
- C. Barrio and J. R. Solana, Binary Mixtures of Additive Hard Spheres. Simulations and Theories, in Theory and Simulation of Hard-Sphere Fluids and Related Systems, ed. Á. Mulero, Springer Berlin Heidelberg, Berlin, Heidelberg, 2008, pp. 133–182 Search PubMed.
- C. Baerlocher, L. B. McCusker and D. H. Olson, Atlas of Zeolite Framework Types, Elsevier, Amsterdam, 6th edn, 2007 Search PubMed.
- E. W. McCleskey and W. Almers, Proc. Natl. Acad. Sci. U. S. A., 1985, 82, 7149–7153 CrossRef CAS PubMed.
- R. Astala, S. M. Auerbach and P. A. Monson, Phys. Rev. B: Condens. Matter Mater. Phys., 2005, 71, 014112 CrossRef.
- C. H. Turner, J. K. Brennan and M. Lísal, J. Phys. Chem. C, 2007, 111, 15706–15715 CrossRef CAS.
- M. Dusselier and M. E. Davis, Chem. Rev., 2018, 118, 5265–5329 CrossRef CAS PubMed.
- S. V. King, Nature, 1967, 213, 1112–1113 CrossRef CAS.
- D. S. Franzblau, Phys. Rev. B: Condens. Matter Mater. Phys., 1991, 44, 4925–4930 CrossRef CAS PubMed.
- S. Le Roux and P. Jund, Comput. Mater. Sci., 2010, 49, 70–83 CrossRef CAS.
- P. M. Piccione, C. Laberty, S. Yang, M. A. Camblor, A. Navrotsky and M. E. Davis, J. Phys. Chem. B, 2000, 104, 10001–10011 CrossRef CAS.
- R. Astala, S. M. Auerbach and P. A. Monson, J. Phys. Chem. B, 2004, 108, 9208–9215 CrossRef CAS.
- P. M. Piccione, S. Yang, A. Navrotsky and M. E. Davis, J. Phys. Chem. B, 2002, 106, 3629–3638 CrossRef CAS.
- T. Wang, S. Luo, G. A. Tompsett, M. T. Timko, W. Fan and S. M. Auerbach, J. Am. Chem. Soc., 2019, 141, 20318–20324 CrossRef CAS PubMed.
Footnotes |
| † Electronic supplementary information (ESI) available: The ESI contains the following material: Section 1: Computational methods; section 2: Experimental methods; section 3: Simulated XRD of computed LTA structure; histogram of number of Monte Carlo steps required for crystallization; spring tetrahedron energetics during crystallization; section 4: experimental XRD data. See DOI: 10.1039/d1cp03913j |
| ‡ Present address: Physics and Astronomy Department, Union College, Schenectady, NY 12308, USA. |
| This journal is © the Owner Societies 2022 |

