
 Open Access Article
 This Open Access Article is licensed under a
 Creative Commons Attribution 3.0 Unported Licence
Conformational plasticity of DNA secondary structures: probing the conversion between i-motif and hairpin species by circular dichroism and ultraviolet resonance Raman spectroscopies†
Jussara
Amato
 a,
Nunzia
Iaccarino
a,
Federica
D'Aria
a,
Francesco
D'Amico
b,
Antonio
Randazzo
a,
Concetta
Giancola
a,
Attilio
Cesàro
b,
Silvia
Di Fonzo
*b and
Bruno
Pagano
*a
a,
Nunzia
Iaccarino
a,
Federica
D'Aria
a,
Francesco
D'Amico
b,
Antonio
Randazzo
a,
Concetta
Giancola
a,
Attilio
Cesàro
b,
Silvia
Di Fonzo
*b and
Bruno
Pagano
*a
aDepartment of Pharmacy, University of Naples Federico II, Naples, I-80131, Italy. E-mail: bruno.pagano@unina.it
bElettra-Sincrotrone Trieste S. C. p. A., Science Park, Trieste, I-34149, Italy. E-mail: silvia.difonzo@elettra.eu
First published on 24th February 2022
Abstract
The promoter regions of important oncogenes such as BCL2 and KRAS contain GC-rich sequences that can form distinctive noncanonical DNA structures involved in the regulation of transcription: G-quadruplexes on the G-rich strand and i-motifs on the C-rich strand. Interestingly, BCL2 and KRAS promoter i-motifs are highly dynamic in nature and exist in a pH-dependent equilibrium with hairpin and even with hybrid i-motif/hairpin species. Herein, the effects of pH and presence of cell-mimicking molecular crowding conditions on conformational equilibria of the BCL2 and KRAS i-motif-forming sequences were investigated by ultraviolet resonance Raman (UVRR) and circular dichroism (CD) spectroscopies. Multivariate analysis of CD data was essential to model the presence and identity of the species involved. Analysis of UVRR spectra measured as a function of pH, performed also by the two-dimensional correlation spectroscopy (2D-COS) technique, showed the role of several functional groups in the DNA conformational transitions, and provided structural and dynamic information. Thus, the UVRR investigation of intramolecular interactions and of local and environmental dynamics in promoting the different species induced by the solution conditions provided valuable insights into i-motif conformational transitions. The combined use of the two spectroscopic tools is emphasized by the relevant possibility of working in the same DNA concentration range and by the heterospectral UVRR/CD 2D-COS analysis. The results of this study shed light on the factors that can influence at the molecular level the equilibrium between the different conformational species putatively involved in the oncogene expression.
Introduction
The conformational plasticity of nucleic acids is essential for several biological functions. Variations of the DNA secondary structure, which depend on the base sequence and molecular environment, are often necessary for the specific regulation of DNA transcription, replication or repair.1–3The so-called “noncanonical” DNA secondary structures represent sequence-dependent conformational topologies, frequently clustered in regulatory regions of oncogenes and in telomeres. For example, G-rich strands can form G-quadruplex (G4) structures which, depending on the DNA sequence, in solution may switch into several interconvertible polymorphs upon changes in DNA or cation concentration.4–8 Similarly, depending on the environmental conditions (particularly pH variations), some C-rich sequences can experience polymorphism between i-motif (iM) and hairpin structures.9–12
While the G4 structures have been extensively investigated, a growing attention has only recently being paid to the iM DNA.13,14 Indeed, although the first iM structure was reported in 1993,15 strong evidence for iM formation in vivo has been only recently provided by in cell NMR experiments16 and by the discovery of an antibody able to specifically bind such structures in the nuclei of human cells.17 Even more recent is the visualization of iMs in the nuclei and chromosomes of the testis of Bombyx mori by using immunofluorescence staining.18
The iM structures consist of two parallel-stranded duplexes, stabilized by intercalated, hemi-protonated cytosine–cytosine (C·C+) base pairs (Fig. 1A), which is why the formation of an iM is favored at slightly acidic pH.13,19,20 As in the case of G4 structures, iMs may fold in an intermolecular fashion from the association of two (dimers) or four (tetramers) separate DNA strands; otherwise, they may form an intramolecular structure (monomer) due to the spatial arrangement of four different C-segments within the same strand. Differently from G4s, the intercalation of base pairs from two parallel duplexes leads to a structure with two wide grooves and two extremely narrow grooves. A relevant feature of iM structures is also the absence of stabilizing π-stacking interactions between the aromatic heterocycles of the adjacent C·C+ base pairs (Fig. 1B); indeed in this intercalated DNA structure the stacking geometry of C·C+ pairs is mainly governed by the repulsive base stacking interactions due to the presence of the proton in each base pair.21
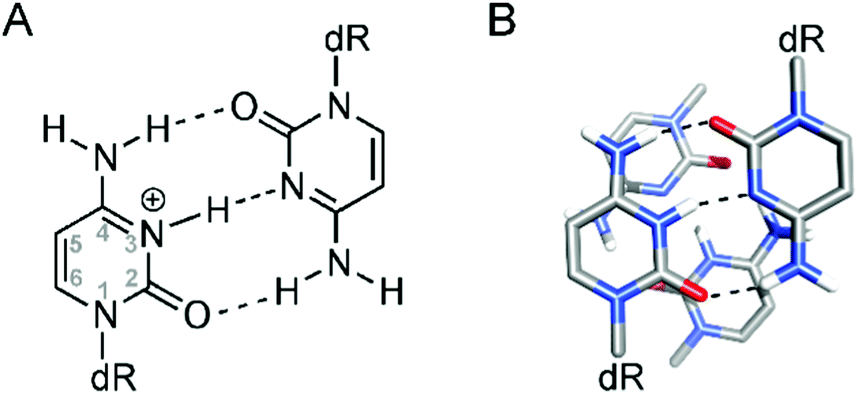 | ||
| Fig. 1 (A) Structure of the hemi-protonated C·C+ base pair; (B) representation of two adjacent C·C+ base pairs in an iM structure. | ||
The lack of base stacking is partly compensated by interactions between the deoxyribose sugar moieties of the two closely spaced antiparallel backbones in the narrow grooves, and by the dipole–dipole interactions between intercalated C·C+ base pairs.15,22 Furthermore, iM formation and stabilization may be favored in cells by interactions with DNA-binding proteins and by molecular crowding.13,23–25
Interestingly, putative G4/iM-forming sequences have been identified in or near the promoter regions of more than 40% of human genes,26 including important oncogenes such as BCL2 and KRAS, where they have been shown to be involved in the regulation of transcription,12,27 by means of mechanisms in which the iM structures appear to be in dynamic equilibrium with hairpin species (Fig. 2).9,12,28
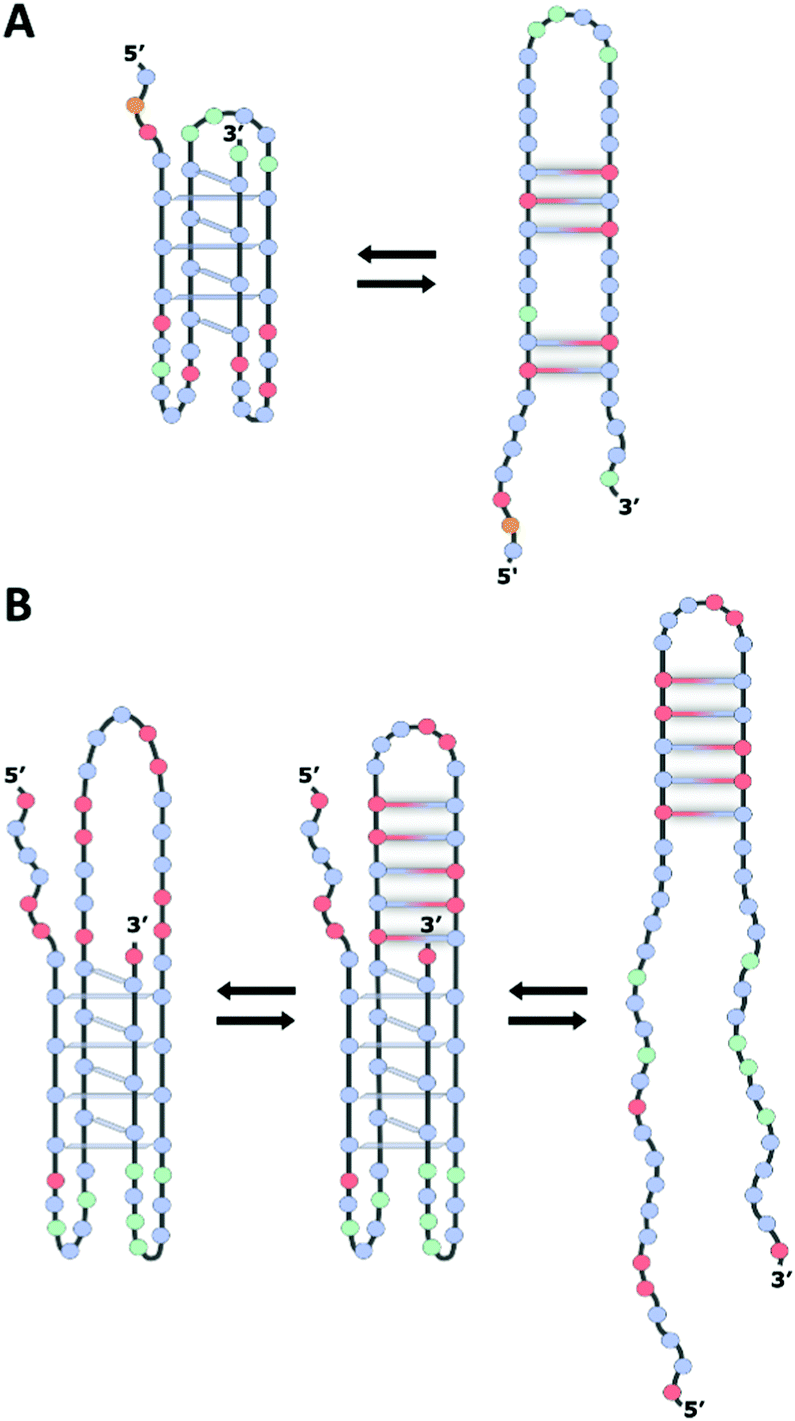 | ||
| Fig. 2 Schematic illustration of the proposed folding pattern for the (A) BCL2 and (B) KRAS gene promoter iMs in equilibrium with the hairpin species stabilized by Watson–Crick base pairs. The iMs predominate at lower pH (<6.0) while the hairpin structures predominate at higher pH (>7.0). The blue, red, orange, and green circles represent cytosine, guanine, adenine, and thymine, respectively. | ||
Furthermore, there was also evidence that iM formation could interfere with DNA repair and replication. This, in turn, may result in genomic instability, which is associated with cancer development.29,30 Therefore, iM DNA and its equilibrating species may represent attractive targets to treat cancer; indeed topology-specific binders may enable site-specific control of genomic instability and expression of genes modulated by the noncanonical structures.
Generally, intramolecular iM structures with longer loops are more stable compared to those with shorter loops,13,31 due to the presence of extra stabilizing interactions in longer loops. Noteworthily, depending on pH, iMs with long loop configuration can even house an entire hairpin-forming sequence in the structure,32 thus coexisting as a hybrid iM/hairpin species in equilibrium with the single iM and hairpin structures, as assumed in the case of the iM within the KRAS gene promoter region termed the Mid-region (Fig. 2B).12 Interestingly, the capping structures formed from these large loops may serve as recognition scaffolds for specific interaction with proteins and/or small molecules, thus affecting the equilibrium between these alternative DNA structures, with consequent effects on the cellular regulation mechanism.
Given the high structural polymorphism of C-rich sequences and the effects of the different structures on cell replication and transcription, it is of primary importance to shed light on the equilibrium between the different species and on the factors that influence it.
Ultraviolet resonance Raman (UVRR) spectroscopy represents a useful tool for detecting and monitoring molecular markers of biomolecules, including nucleic acids.33 Besides providing structural information of biomolecules, produced by molecular vibrations associated to their specific conformation (at micromolar or lower concentrations), UVRR is a powerful method to disclose biologically relevant issues affecting the structure and dynamics of nucleic acids and their interaction with putative drugs, as also already reported by some of us.34–37 Compared to other Raman-based methods, UVRR scattering benefits from the selective enhancement occurring in resonance conditions for the vibrations mainly localized on the nucleotide rings, thus allowing the monitoring of all four nitrogenous bases in a single experiment.37 Indeed, a careful choice of the UVRR excitation wavelength, in resonance with the electronic transitions of specific nucleobases, efficiently allows the disentanglement of each vibrational contribution arising from individual nucleotides.
In this context, the present study aims to investigate by means of UVRR and circular dichroism (CD) spectroscopies two iM-forming DNA sequences known to play a functional role in the transcriptional regulation of BCL2 and KRAS oncogenes. In particular, these sequences are a 39-nucleotide sequence located directly upstream (∼30 bases) of the P1 promoter of the BCL2 gene38 and a 54-nucleotide sequence from the GC-rich nuclease hypersensitive element (NHE) of the KRAS gene promoter region located upstream of the transcription start site (Fig. 2).12
Since CD spectroscopy is a valuable tool for mapping conformational properties of particular DNA molecules,39 it has been used here to preliminarily study the pH-dependent as well as the temperature-dependent structural features of BCL2 and KRAS oligonucleotides. Multivariate curve resolution-alternating least squares (MCR-ALS) analysis of CD data was crucial to explore similarities and differences in the behavior of the two DNA sequences and to describe the number, evolution and identity of structural species found in the pH range of interest.
In parallel, an extensive UVRR study was accomplished to establish the diagnostic markers of C-rich oligonucleotides in their different states of folding (iM, hairpin, and hybrid iM/hairpin structures) and to investigate the changes in the equilibrium between these species induced by environmental perturbations, like pH variations and presence of PEG 200 as a cell-mimicking molecular crowder. The 266 nm UVRR excitation wavelength was selected since it achieves the resonance and pre-resonance conditions for the electronic transitions which contribute to the long-wavelength absorption bands of DNA bases.40–42 Therefore, this wavelength provides the best performance to detect the modifications occurring in the cytosine and guanine bases upon pH changes and to unravel the role of several functional groups in the DNA conformational transitions. Structural and dynamic information on pH-dependent conformational transitions was further retrieved by analyzing the UVRR spectra of DNA molecules using the two-dimensional correlation spectroscopy (2D-COS) technique. In addition, the heterospectral 2D-COS analysis made it possible to correlate the changes in the UVRR and CD spectra. The combined use of the two spectroscopic tools is of relevance also in view of the possibility of working in the same DNA concentration range.
Experimental
Materials
All common chemicals, reagents, and solvents, as well as polyethylene glycol of average molecular weight 200 g mol−1 (PEG 200), were purchased from Merck KGaA (Darmstadt, Germany). Phosphoramidite and controlled pore glass supports for DNA synthesis were purchased from Link Technologies (Bellshill, UK).Oligonucleotide synthesis and sample preparation
The C-rich oligonucleotides d(CAG CCC CGC TCC CGC CCC CTT CCT CCC GCG CCC GCC CCT) (BCL2) and d(GCC CGG CCC CCG CTC CTC CCC CGC CGG CCC GGC CCG GCC CCC TCC TTC TCC CCG) (KRAS) were chemically synthesized on an ABI 394 DNA/RNA synthesizer (Applied Biosystem) at 1 μmol scale using the standard β-cyanoethylphosphoramidite solid-phase chemistry, as described elsewhere.43 After synthesis, the oligonucleotides were deprotected and detached from the support by treating with concentrated aqueous ammonia at 55 °C for 12 h. The combined filtrates and washings were concentrated under reduced pressure, dissolved in water, and purified by HPLC using standard protocols. Isolated oligonucleotides have been shown to be more than 98% pure by NMR. The oligonucleotide concentration was determined spectrophotometrically by UV absorption measurements at 90 °C using molar extinction coefficients calculated at 260 nm by the nearest-neighbor model.44 Samples were prepared in 10 mM sodium phosphate buffer in the absence and presence of 40% PEG 200 (used as a crowding agent) and at three different pH values: 5.2, 6.6, and 7.8. All samples were then heated at 80 °C for 5 min, slowly cooled to room temperature overnight, and finally incubated at 4 °C for 24 h, before data acquisition. The pH of each sample was verified immediately before measurements.Circular dichroism (CD) spectroscopy
CD experiments were carried out on a Jasco J-815 spectropolarimeter equipped with a Peltier PTC-423S/15 temperature controller. Spectra were recorded in the 220–360 nm wavelength range at 15 or 40 μM oligonucleotide concentration, using 1 mm path length quartz cuvettes, 1 nm bandwidth, 1 s response time, and a scan rate of 100 nm min−1. pH-dependent experiments (pH titrations) were performed at a pH varying from 4.7–4.9 to 8.0–8.1 with about 0.2 pH unit intervals (i.e., 16–17 different pH values were tested) at 10 °C. Temperature-dependent CD spectra (3D melting) were collected from 10 to 90 °C using a temperature step of 5 °C and a 0.5 °C min−1 heating rate. The buffer baseline was subtracted from each spectrum. CD melting curves were obtained by reporting the CD signal at 288 or 280 nm as a function of temperature.45 The curves were fitted using sigmoid functions and the melting temperatures (as defined by the inflection point) determined.Multivariate curve resolution-alternating least squares (MCR-ALS) analysis of CD data
All experimental CD spectra (3D melting and pH titration) of both DNA samples (BCL2 and KRAS) were analyzed using the MCR-ALS procedure46 with the aim of estimating the concentration profiles and pure spectra for each spectroscopically active conformation present in melting and pH titration experiments. MCR-ALS is based on the multiwavelength extension of Lambert–Beer's law (in matrix form):| D = CST + E | (1) |
Ultraviolet resonant Raman (UVRR) spectroscopy
UVRR measurements were performed at the Inelastic Ultraviolet Scattering (IUVS) beamline at Elettra Synchrotron Laboratory (Trieste, Italy). The selected excitation wavelength was 266 nm since it accomplishes the resonance and pre-resonance conditions for the electronic transitions contributing to the long-wavelength absorption bands of DNA bases (Fig. S1, ESI†).40–42 In particular, two electronic transitions at 245 and 275 nm contribute to the long-wavelength absorption band of guanines. According to the CNDO calculations,53 the former transition is largely localized on the N7![[double bond, length as m-dash]](https://www.rsc.org/images/entities/char_e001.gif) C8 double bond of the imidazole ring, while the latter transition involves the C2N3–C4C5–N7C8 fragment (Fig. S2, ESI†). Therefore, 266 nm wavelength assured the best visibility to detect the pH-induced modifications occurring in the guanine bases upon acidification, while still allowing for sufficient signal from the other nucleotides. A complete description of the experimental apparatus and of the measurement protocol parameters is reported elsewhere.54 Briefly, experiments were carried out at 40 μM oligonucleotide concentration, keeping the temperature constant at 5.0 ± 0.2 °C. Spectra were all acquired in the wavenumber range of 1000–1800 cm−1, using the 266 nm incident light, from a table-top solid-state laser. Light from the samples was collected in back-scattering geometry using a Czerny–Turner spectrometer (model TR557, TriVista, Princeton Instruments), with a focal length of 750 mm equipped with a holographic dispersive element of 3600 lines per mm and coupled with a Peltier-cooled back-thinned CCD. The spectral bandwidth was set to 4.5 cm−1. Raman frequencies were calibrated to ±1 cm−1 of accuracy by using cyclohexane as the standard.55 The total acquisition time was 4 h for each sample, with each final spectrum being the average of 16 spectra of 15 min duration each. This fractionation procedure ensured the optimal detection of potential time-dependent phenomena. Spectral processing was performed using the Spectragryph software (version 1.2.14) for optical spectroscopy. The following processing workflow for spectra reduction was used: (a) removal of cosmic ray peaks; (b) data averaging; (c) dark subtraction; (d) energy shift; (e) solvent subtraction (after normalizing the spectra to the OH-stretching band of water at 3300 cm−1); (f) cell subtraction (the signal from the empty cell has been scaled to equalize it to the intensity of the spectrum of DNA in the intervals where the signal of the empty cell is predominant, i.e., 750–850 and 1000–1130 cm−1); and (g) fluorescence removal by a polynomial fit. The signal from the spectra in the presence of PEG 200 has been scaled after point (e) to the corresponding spectrum of the same sequence without PEG obtained at the end of procedure (e), by equalizing the intensity in the ranges 750–850 and 1000–1130 cm−1. Then points (f) and (g) were applied. The spectra of the solvent and the cell were also processed through steps (a) to (d). Since most of UVRR bands are formed by overlapping resonant vibrations of the constituting nucleotides, a fitting procedure, which follows a χ square minimization method, was applied to the spectra to disentangle the spectral features. Each identified vibration was then approximated with a Gaussian function. The same fitting procedure was used for the UVRR spectra recorded at pH 7.8, 6.6, and 5.2. The studies of Fodor et al.41,56 and When et al.40 were taken into account as a guide to the peaks’ resonance attributions. Additional information on the formation of C·C+ base pairs was retrieved from the non-resonant Raman study of Benevides et al.57 The complete collection of the spectral data with the corresponding parameters (peak position, amplitude, area, FWHM, and band assignment) at the different pH values in the absence and presence of 40% PEG 200 is reported in Tables S1–S12 (ESI†).
C8 double bond of the imidazole ring, while the latter transition involves the C2N3–C4C5–N7C8 fragment (Fig. S2, ESI†). Therefore, 266 nm wavelength assured the best visibility to detect the pH-induced modifications occurring in the guanine bases upon acidification, while still allowing for sufficient signal from the other nucleotides. A complete description of the experimental apparatus and of the measurement protocol parameters is reported elsewhere.54 Briefly, experiments were carried out at 40 μM oligonucleotide concentration, keeping the temperature constant at 5.0 ± 0.2 °C. Spectra were all acquired in the wavenumber range of 1000–1800 cm−1, using the 266 nm incident light, from a table-top solid-state laser. Light from the samples was collected in back-scattering geometry using a Czerny–Turner spectrometer (model TR557, TriVista, Princeton Instruments), with a focal length of 750 mm equipped with a holographic dispersive element of 3600 lines per mm and coupled with a Peltier-cooled back-thinned CCD. The spectral bandwidth was set to 4.5 cm−1. Raman frequencies were calibrated to ±1 cm−1 of accuracy by using cyclohexane as the standard.55 The total acquisition time was 4 h for each sample, with each final spectrum being the average of 16 spectra of 15 min duration each. This fractionation procedure ensured the optimal detection of potential time-dependent phenomena. Spectral processing was performed using the Spectragryph software (version 1.2.14) for optical spectroscopy. The following processing workflow for spectra reduction was used: (a) removal of cosmic ray peaks; (b) data averaging; (c) dark subtraction; (d) energy shift; (e) solvent subtraction (after normalizing the spectra to the OH-stretching band of water at 3300 cm−1); (f) cell subtraction (the signal from the empty cell has been scaled to equalize it to the intensity of the spectrum of DNA in the intervals where the signal of the empty cell is predominant, i.e., 750–850 and 1000–1130 cm−1); and (g) fluorescence removal by a polynomial fit. The signal from the spectra in the presence of PEG 200 has been scaled after point (e) to the corresponding spectrum of the same sequence without PEG obtained at the end of procedure (e), by equalizing the intensity in the ranges 750–850 and 1000–1130 cm−1. Then points (f) and (g) were applied. The spectra of the solvent and the cell were also processed through steps (a) to (d). Since most of UVRR bands are formed by overlapping resonant vibrations of the constituting nucleotides, a fitting procedure, which follows a χ square minimization method, was applied to the spectra to disentangle the spectral features. Each identified vibration was then approximated with a Gaussian function. The same fitting procedure was used for the UVRR spectra recorded at pH 7.8, 6.6, and 5.2. The studies of Fodor et al.41,56 and When et al.40 were taken into account as a guide to the peaks’ resonance attributions. Additional information on the formation of C·C+ base pairs was retrieved from the non-resonant Raman study of Benevides et al.57 The complete collection of the spectral data with the corresponding parameters (peak position, amplitude, area, FWHM, and band assignment) at the different pH values in the absence and presence of 40% PEG 200 is reported in Tables S1–S12 (ESI†).
Two-dimensional correlation spectroscopy (2D-COS)
The 2D-COS analysis was performed by employing the freely available Mat2DCorr toolbox in the MATLAB environment (R2018b) following the 2D correlation criteria proposed by Noda.58,59 Basically, a set of spectra affected by an external perturbation (in this case the pH) is collected and then transformed into two-dimensional (ν1, ν2) correlation maps through a well-established cross-correlation analysis. According to the theory developed by Noda,58,60 two different types of 2D correlation spectra can be defined, namely synchronous (Θ(ν1, ν2)) and asynchronous (Ω(ν1, ν2)), the latter providing useful information on the time-dependent order of changes in the molecular behavior along the perturbation variable. The intensity of the synchronous 2D correlation spectrum can be considered as a measure of the similarity of spectral intensity variations at spectral variable positions ν1 and ν2. The intensity of the asynchronous 2D correlation spectrum represents the dissimilarity or, more specifically, a phase difference of these changes and it is thus useful when analyzing the sequential order of spectral events. Here, homospectral (UVRR) and heterospectral (UVRR/CD) 2D correlation maps (synchronous and asynchronous) were obtained by using the pH variation (5.2, 6.6, and 7.8 pH values) as the external variable. Three UVRR spectra and three CD spectra were employed for the heterospectral 2D-COS analysis. No reference spectrum was selected. The auto-correlation peaks (auto-peaks) located at the diagonal (ν1 = ν2) of the synchronous homospectral correlation maps are always positive and reflect the sensitivity of UVRR bands to the pH variation. The peaks located at off-diagonal positions (ν1 ≠ ν2) of the synchronous 2D-COS maps (cross-peaks) reflect synchronized changes of spectral intensities between pairs of bands. The more the change in intensity between the bands is coordinated, the stronger the cross-peak is. If no reference is applied, as in the present case, the intensity of the cross-peaks in the synchronous maps has the same sign of the original spectra (for UVRR it is always positive). More importantly, in the asynchronous maps, the sign of the cross-peaks determines the temporal sequence of the events. An asynchronous peak is positive if the intensity change at ν1 occurs predominantly before ν2, or it is negative if the change occurs after ν2. This rule is reversed if the cross-peak in the synchronous map is negative.Results and discussion
Circular dichroism (CD) experiments in dilute solution and MCR-ALS analysis
The two C-rich sequences from the BCL2 and KRAS gene promoters chosen for this study have been shown to form stable iM structures at acidic pH and exhibit relatively high transitional pH values (around pH 6.6 and 6.9 for BCL2 and KRAS, respectively).12,38 Both sequences present several tracts of at least three contiguous cytosines along with some guanine bases and, depending on the pH, have been reported to switch between iM and hairpin structures.9,12,61 Moreover, as mentioned above, the long central loop of the KRAS sequence (17 nucleotides) allows iM and hairpin to coexist in the same chain at pH values around the transitional pH. In both cases, below pH 6.0, the iM conformation is favored, whereas the hairpin conformation is favored at pH > 7.0. At intermediate pH, all species are expected to be in slow exchange, with comparable populations. Therefore, to explore these three different conditions, the experiments were performed mainly at three pH values, namely 5.2, 6.6, and 7.8.First, the CD spectra as a function of pH at 10 °C were analyzed, so as to verify the proper folding of the two sequences at the different pH values (Fig. S3, ESI†). At pH 5.2, the CD spectra of both BCL2 and KRAS sequences exhibited the characteristic iM profile, i.e., a strong positive band at 288 nm and a negative one at 264 nm.62 On increasing the pH to 6.6, a shift of the maximum to 285 nm was observed for both oligonucleotides, suggesting the formation of a certain amount of hairpin conformation. Upon further increase of the pH to 7.8, the CD spectra of both DNA sequences exhibited a significant intensity drop of the positive band along with the shift of the maximum to 280 nm. This suggests the complete conformational transition of the iM toward the hairpin, although the presence of a fraction of single-stranded DNA cannot be excluded, since unfolded C-rich sequences show a CD maximum centered at around 278 nm.
In order to better understand such conformational equilibria, pH-dependent CD spectra (Fig. S3, ESI†) were submitted to a multivariate data analysis approach, named MCR-ALS, which estimates the pure spectra and the concentration profiles of the species in solution.46 The MCR output strongly depends on the number of components (species) considered to be present during the titration. For BCL2, the model was generated by assuming the presence of either two or three species. However, only the solution obtained from the model generated considering two species turned out to be chemically meaningful. Indeed, the results (Fig. 3A and C) indicate that the first species, which predominates at pH values lower than 7, corresponds to the iM structure, having a strong positive band at 288 nm and a negative one at 264 nm. The second species, prevalently present at pH > 7, corresponds to the hairpin conformation which arises when the bases are deprotonated, as already reported in the literature.9,61 Concerning KRAS data, the MCR model was generated by considering two, three and four species. However, only the model that included three species turned out to be acceptable. Fig. 3B and D show, respectively, the MCR-resolved pure spectra of the species in solution and their relative concentration during the pH titration. Interestingly, it seems that two iM-containing species are present at pH lower than 7.2. The first species (with a positive band at 288 nm and a negative one at 264 nm) is predominant at pH < 6, while the second one starts to appear at pH 5.5, reaches its maximum concentration at pH 7, and then it decreases as the pH increases. This second iM-containing species is characterized by a CD spectrum having a negative band slightly shifted toward lower wavelengths compared to the usual iM structures (at around 258 nm instead of at 264 nm). Such an additional species has already been reported by Benabou and co-workers for another iM-forming sequence,32 and it arises from the partial deprotonation of cytosines located in the loops which allows the formation of a stable Watson–Crick hairpin that coexists with the iM structure, thus generating a hybrid iM/hairpin species (hereafter referred to as hybrid). Finally, at pH values higher than 7.5, the hairpin conformation (third species) becomes the predominant species in solution.
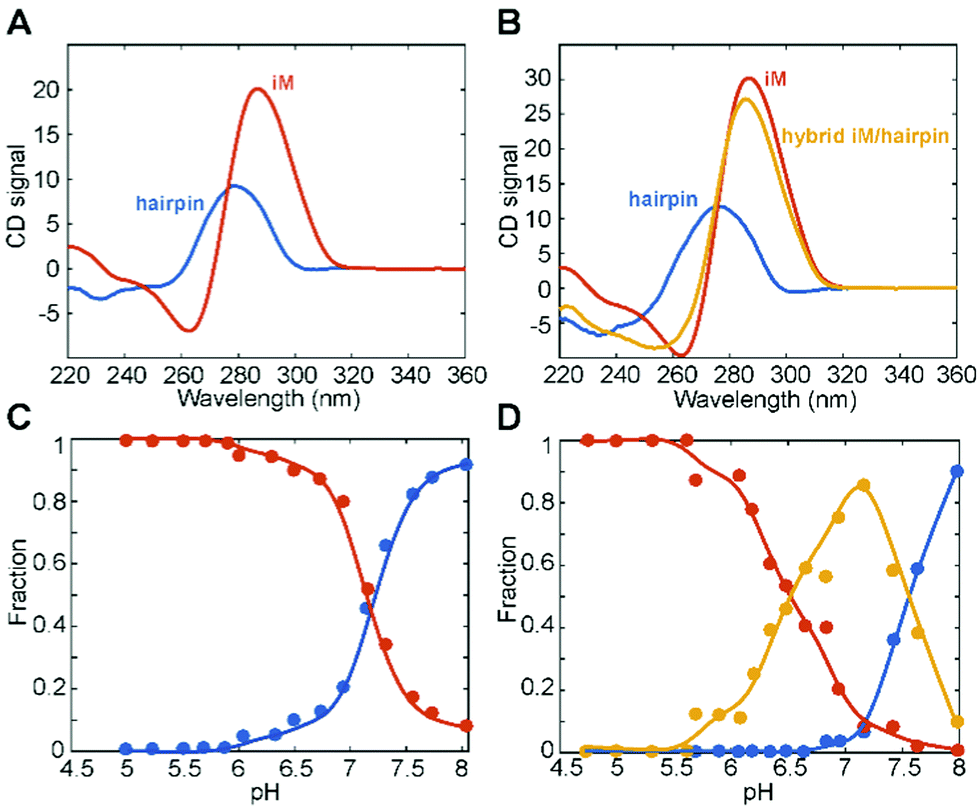 | ||
| Fig. 3 MCR-ALS-resolved (A and B) pure spectra and (C and D) composition profiles for the analysis of pH titration experiments for BCL2 (left) and KRAS (right) oligonucleotides monitored by CD spectroscopy. Red line, iM; orange line, hybrid iM/hairpin species; blue line, hairpin. T = 10 °C. | ||
Three-dimensional CD melting curves, which consist in collecting whole CD spectra as a function of temperature, were then obtained for BCL2 and KRAS oligonucleotides at pH 5.2, 6.6, and 7.8 (Fig. S4 and S5, ESI†). The univariate analysis of the data using the CD trace at the wavelength of maximum absorbance variation showed the existence of clear cooperative transitions at pH 5.2 (with apparent melting temperatures, Tm, of 59.9 and 66.5 °C for BCL2 and KRAS, respectively) and pH 6.6 (with Tm of 27.7 and 43.8 °C for BCL2 and KRAS, respectively). In contrast, the temperature-induced changes in the CD spectra at pH 7.8 seemed to reflect a non-cooperative process. However, from this univariate procedure, it is difficult in all cases to state the existence of more than one transition during the experiment.
Thus, as done for the pH titrations, MCR-ALS analysis of temperature-induced unfolding processes was performed. To fully exploit the information hidden behind the 3D melting experiments conducted at three different pH values, a “column-wise matrix augmentation” approach was used to combine in one matrix the CD spectra obtained at the three pH values investigated (see the Experimental section for further details). In this way, the information related to both pH and temperature was employed to consistently generate the pure spectra of the species and their relative concentration profiles. The choice of the number of components was based on the species found by the MCR results obtained from the pH titrations and considering that the increase of the temperature generates the additional single-stranded species in solution.
Therefore, three components were chosen for the MCR-ALS analysis of BCL2. Moreover, we also constrained the concentration profiles to fixed values, using the equality constraint, as described in the Experimental section. The choice of the constrained values was based both on our previous knowledge (i.e., single-stranded DNA is always absent at 10 °C, while it is the only species present at 90 °C, independent of pH) and on the information obtained from the pH titrations performed at 10 °C (i.e., relative fractions of iM, hybrid, and hairpin at pH 5.2, 6.6, and 7.8). The obtained MCR-resolved spectral and concentration profiles clearly show the presence of three species in equilibrium when pH and temperature change simultaneously (Fig. S6, ESI†). At pH 5.2, the presence of iM is predominant at temperature values lower than 60 °C while at higher temperature the unfolded species takes over. At pH 6.6, the hairpin conformation seems to be more thermally stable than the iM structure. This is in line with the fact that such pH is not optimal for the iM conformation, and thus its thermal stability drops dramatically. Finally, at pH 7.8 the iM species is basically absent and the two main species in solution are the hairpin, prevalent at low temperatures, and the single-stranded DNA, which predominates at higher temperatures.
Analogously, the 3D melting data sets of KRAS were processed with the MCR-ALS analysis (Fig. S7, ESI†). Indeed, also in this case, the results obtained from the analysis of the pH titration were used to constrain the concentration profiles to fixed values, using the equality constraint. Thus, at low temperature, three conformations (iM, hybrid and hairpin) were found to be in equilibrium at the different pH values, while the single-stranded DNA (fourth species) turned out to be always the predominant species at temperature values higher than 50 °C indicating the complete DNA unfolding with the further increase in temperature.
The tridimensional MCR-resolved composition profiles on varying pH and temperature, for both BCL2 and KRAS, were generated according to the procedure described in the Experimental section and shown as contour plots of conformational composition (iM, hairpin, hybrid, and single-stranded DNA) in Fig. S8A and B (ESI†). Within the limits of the approximations imposed by the interpolation procedures, these plots represent a sort of state diagrams featuring the conformational transitions as a function of pH and temperature.
UVRR spectra of BCL2 and KRAS oligonucleotides at pH 7.8 and band assignment
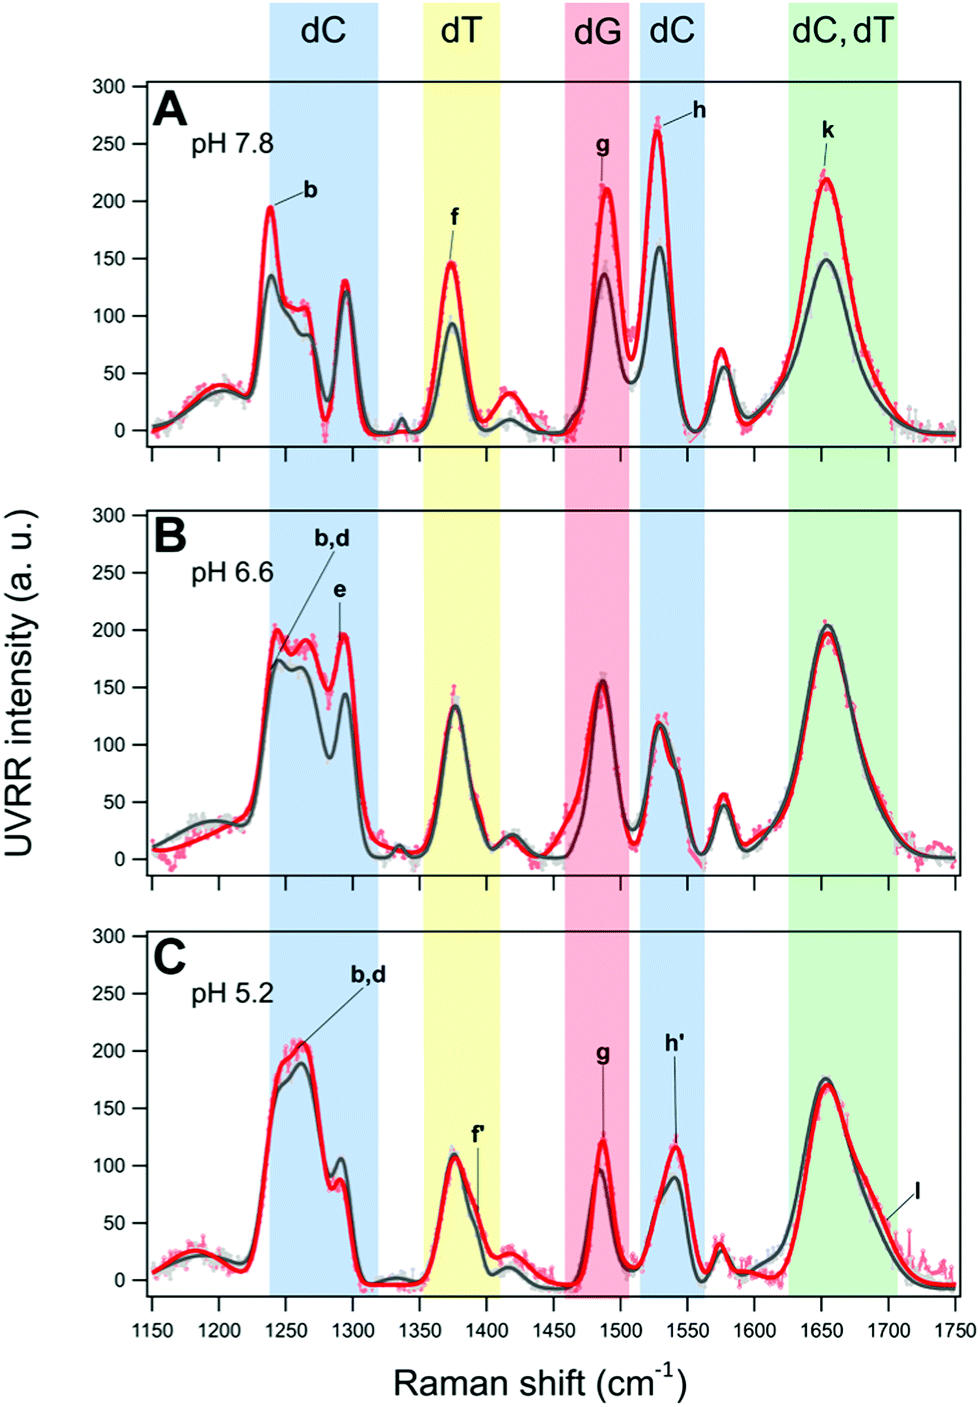
The UVRR spectra of BCL2 and KRAS sequences were acquired in aqueous buffer solution at pH 7.8, 6.6 and 5.2. In principle, the UVRR diagnostic markers of each different folding state adopted by C-rich oligonucleotides may be identified by monitoring the changes of the most sensitive UVRR bands with the pH in the 750–1800 cm−1 resonance range. However, a more detailed UVRR spectroscopic analysis is required for the identification and assignment of bands for the vibrations of each of the four nucleobases (dA, dG, dC, and dT). The UVRR spectra of the two oligonucleotides were first analyzed at pH 7.8 (Fig. 4A and B). In the absence of structured species, their spectra should be roughly reproduced by the weighted sum of the UVRR spectra of their constituent nucleotides. This rough approximation does not consider the effect of interactions between DNA bases, but still represents a sufficient primer for the assignment of vibrations. As for the oligonucleotides studied in this work, several bands in the experimental UVRR spectra of both molecules at pH 7.8 were redshifted compared to the spectra reproduced from the nucleotides constituting the DNA sequences (Fig. S9 and S10, ESI†), thus indicating the occurrence of interactions between nucleobases at such pH (see below).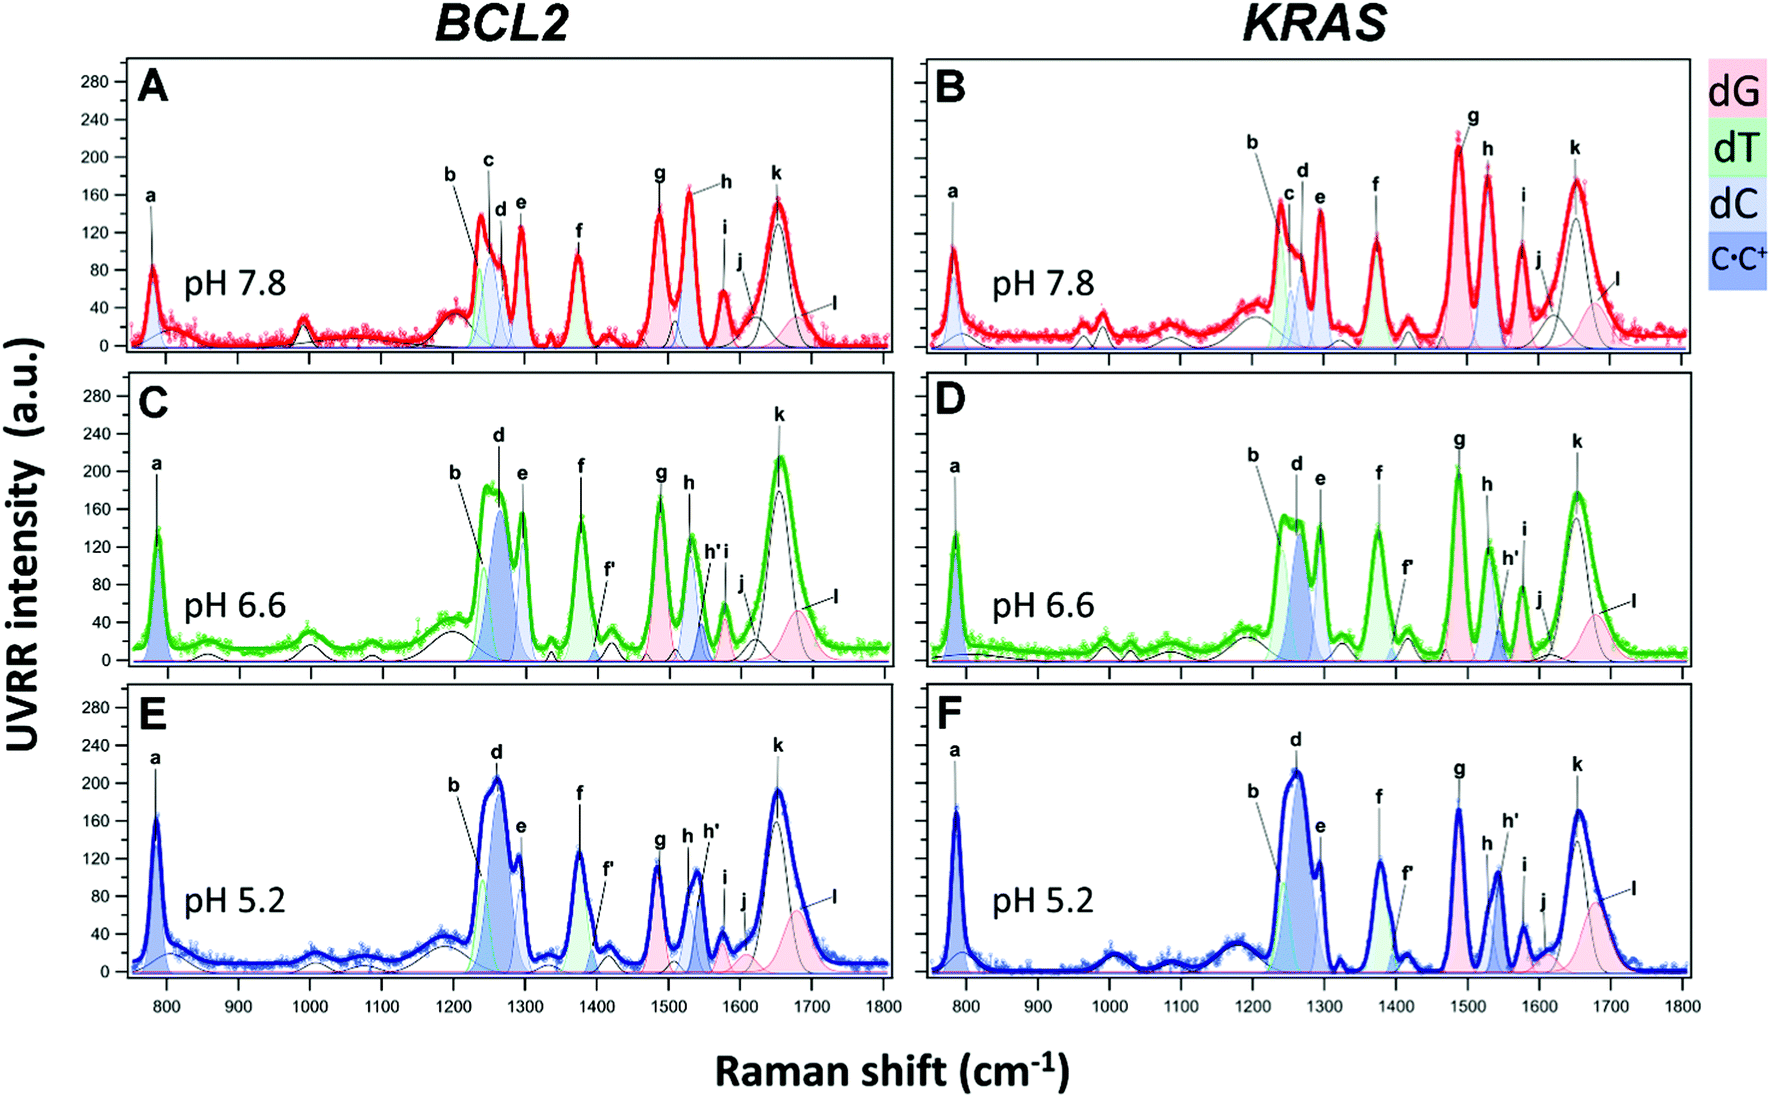 | ||
| Fig. 4 UVRR spectra of BCL2 (left) and KRAS (right) oligonucleotides (40 μM) at pH 7.8, 6.6, and 5.2, and experimental data fitting with the UVRR bands of the constituting nucleotides. The color code used to highlight the main bands is as follows: blue for cytosine (bands corresponding to neutral cytosines are highlighted in light blue, while those related to hemi-protonated C·C+ pairs are in dark blue), red for guanine, and green for thymine. Bands shown in white comprise the contribution of several vibrations associated to DNA bases and/or backbone. Letters a–l indicate vibrational assignments (s = stretching; b = bending): a = dC (ring breathing, deoxyribose-phosphate backbone); b = dT (C5–CH3, ring s); c = dC (C6H b, C4N s); d = dC; e = dC (N1C6, C5C6 s); f = dT (C5-CH3 s); g = dG (C8H b; C8N9, N7C8 s); h = dC (N3C4 and N1C2 s) of the neutral nucleobase; f′, h′ = hemi-protonated C·C+ pairs; i = dG (C4C5, N3C4 and C5N7 s), dA (C4C5, N3C4 s) for BCL2; j (at pH 7.8 and 6.6) = dG exocyclic NH2 scissors (C-paired) and dC exocyclic CO stretching (G-paired); j (at pH 5.2) = dG exocyclic NH2 scissors (unpaired); k = unpaired dT, dC exocyclic CO s; l = unpaired dG exocyclic CO s. | ||
Furthermore, to disentangle the contribution of the vibrations of each nucleobase to the bands of the spectra, a data fitting procedure was applied, in combination with the homospectral 2D-COS analysis (see below). Bands relative to the nucleobases are colored by type (Fig. 4). Highlighted in light blue are the diagnostic bands of cytosines in their neutral form, located at about 783, 1253, 1269, 1295 and 1529 cm−1, and hereafter indicated with the letters a, c, d, e, and h, respectively. In particular, band a is mainly associated with the breathing of the cytosine ring; bands c and d are associated with the exocyclic C6H bending and C4N stretching, and with cytosine ring stretching vibrations, respectively; while the two most intense bands e and h are attributed to vibrational modes involving the stretching of the N1C6, C5C6 and N3C4, N1C2 groups in the pyrimidine ring, respectively. Since cytosines are highly sensitive to protonation/deprotonation equilibria, most of these bands should be influenced by pH changes.
As for the thymine bases (in green), two diagnostic bands at about 1239 and 1374 cm−1, referred to as b and f, respectively, are observed in the spectra. These bands are both attributed to the stretching of the methyl C5-CH3 group and bending of C6H.40,63 Among the two, band b is less informative because of its overlapping with band c of the cytosine around 1253 cm−1, while the position of the isolated band f is expected to give information about the interaction between thymines and other bases in the DNA sequence or with the solvent.35
Furthermore, two bands diagnostic of guanine (in red) were also identified in the spectra. The most intense one at about 1488 cm−1 (hereafter referred to as g) is attributed to vibrational modes involving the N7C8 and C8N9 imidazole ring stretching plus the C8H inter-plane bending.40 Since the guanine imidazole ring is not engaged in the recognition and pairing with cytosine, band g is not expected to be particularly susceptible to pH changes, while it should be sensitive to solvent exposure. A similar pH response would be expected for band i at approximately 1577 cm−1, which is assigned to mixed guanine vibrational modes involving the C4C5 stretching out of phase with the flanking N3C4 and C5N7 moieties. In fact, these groups are not directly involved in guanine pairing with cytosine (G–C base pair). Moreover, this band is less informative since it severely overlaps with the one at 1580 cm−1, ascribed to the vibration of the single adenine residue present in the BCL2 sequence (Fig. S9, ESI†).
UVRR profiles of both oligonucleotides also exhibited a wide band centered at around 1653 cm−1, hereafter referred to as k, which mainly results from the overlap of the stretching vibrations of the exocyclic CO group of unpaired cytosine and thymine residues,41,56 while the stretching vibration of the CO group of unpaired guanines appears as a separate shoulder of band k (hereafter referred to as band l) at around 1679 cm−1.41 This band is expected to increase upon acidification as a consequence of the progressive cytosine protonation and consequent disruption of G–C base pairs, with the formation of C·C+ base pairs.
As mentioned above, the redshift of UVRR bands of BCL2 and KRAS at pH 7.8 with respect to the weighted sum of their constituting nucleotides (Fig. S9 and S10, ESI†) clearly suggests the presence of some base-pairing interactions in both DNA sequences at such pH. Particularly significant are the redshifts of bands g and i of guanine, and h of cytosine indicating the presence of G–C interactions.
Noteworthily, UVRR spectra comparison with the sum spectra of the weighted nucleotides also reveals the loss of the band at around 1605 cm−1 which, according to the literature, is associated with the NH2 scissor modes of unpaired guanine,41 along with the appearance of a shoulder, named band j, on the left side of band k. Actually, at pH 7.8, band j comprises two bands, one at 1620 cm−1 corresponding to the NH2 scissor modes of guanine paired to cytosine, and the other at 1632 cm−1 associated to the exocyclic CO stretch of cytosine paired to guanine, overall confirming the occurrence of G–C base pairing at pH 7.8 for both oligonucleotides.41
UVRR spectral changes for BCL2 and KRAS oligonucleotides upon pH variation
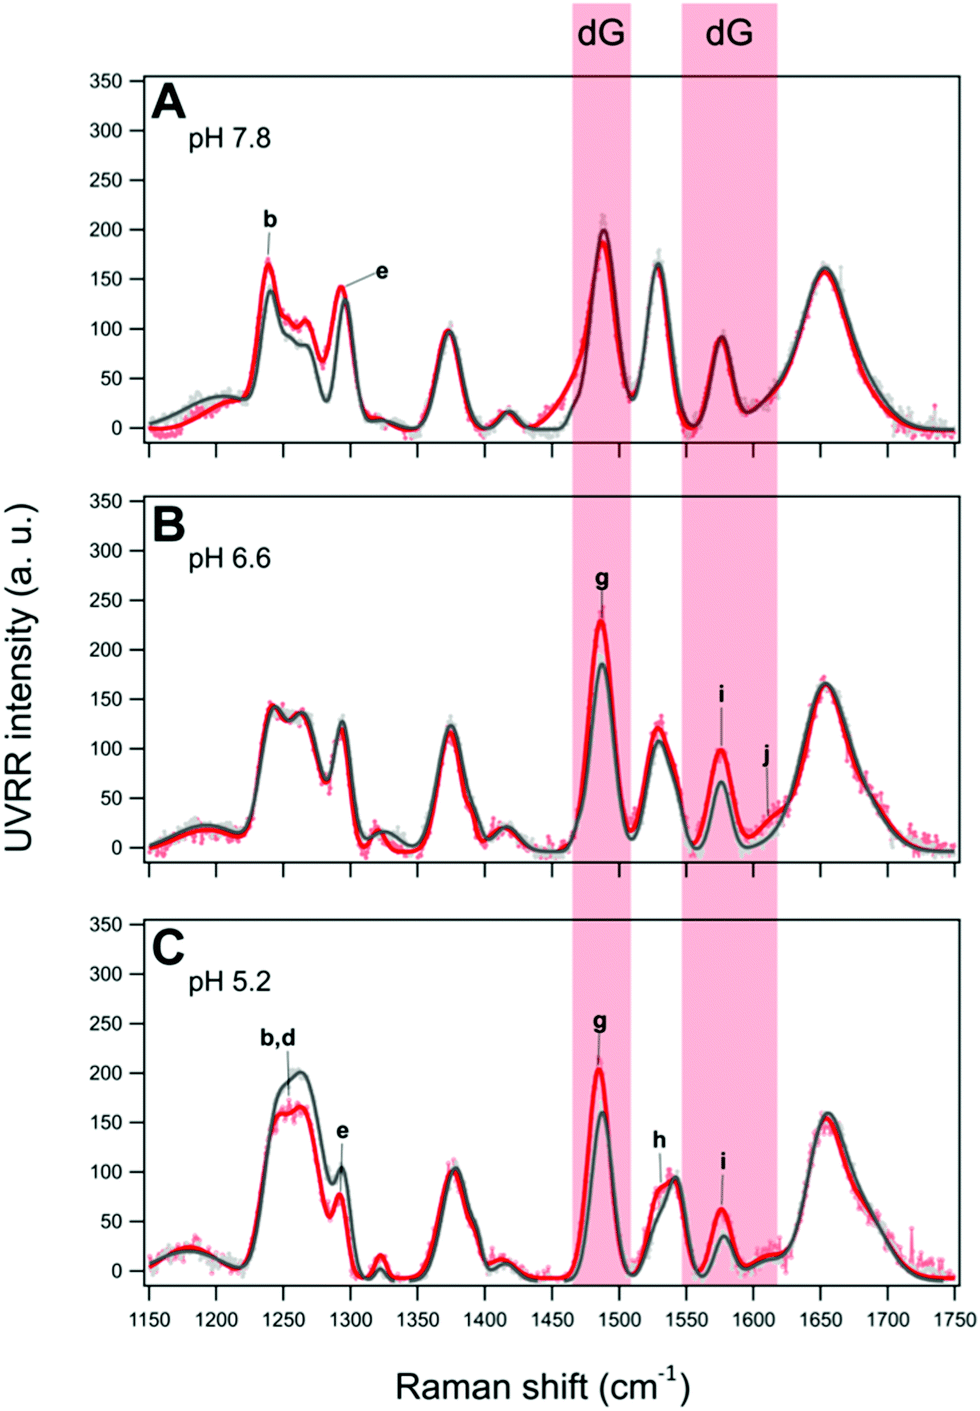
The UVRR spectra of BCL2 and KRAS oligonucleotides at pH 6.6 and 5.2 are shown in Fig. 4C–F. For both DNA sequences, the most notable changes with decreasing pH concern the intensity (area of the peak) and position of the cytosine bands (a, c, d, e, and h). These changes are here described to detect, close to neutral pH, the hairpin conformation stabilized by the canonical Watson–Crick C–G base pairs, or even by C–T mismatched base pairs.64 Then, upon decreasing the pH to slightly acidic values, the protonation of cytosines allows the formation of hemi-protonated C·C+ base pairs, which stabilize the iM conformation.Interestingly, bands a, d, and l exhibited a significant intensification from pH 7.8 to 5.2, in agreement with the increase of cytosine protonation, and thus with the higher number of C·C+ base pairs formed at the lower pH value. However, among them, only band a can be considered as a good marker of the C·C+ base pair, because of the extended overlap of neighboring bands in the other cases. Interestingly, band a undergoes a blueshift of about 3.5 cm−1 from pH 7.8 to 5.2 in both KRAS and BCL2 spectra (Fig. 5A and B), suggesting the conformational transition of the oligonucleotides to their corresponding iM structures upon decreasing the pH.65 Conversely, band h undergoes a strong intensity drop upon decreasing the pH (Fig. 4), thus suggesting that, in principle, it could be used as a marker of the unpaired cytosines.
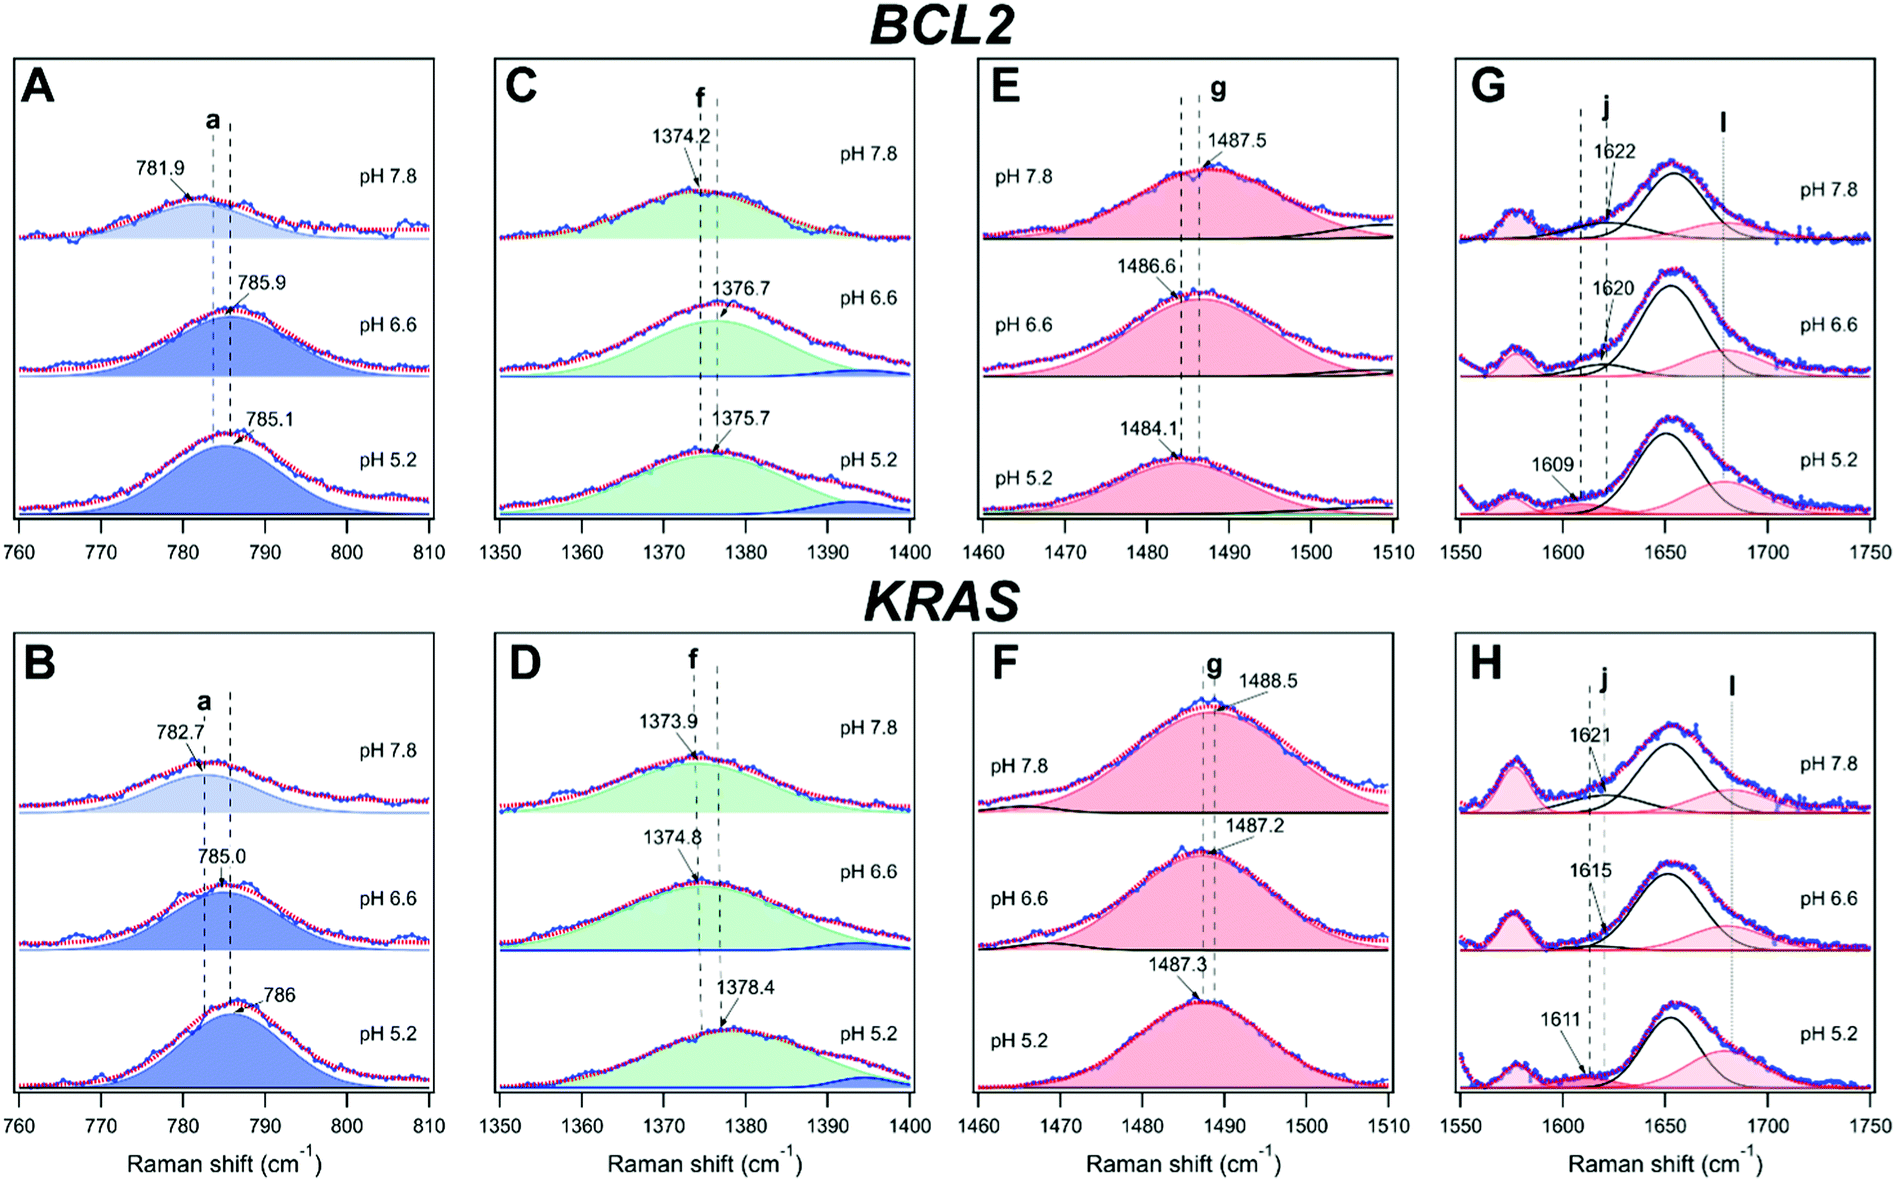 | ||
| Fig. 5 Behavior of the bands (A and B) a, (C and D) f, (E and F) g, and (G and H) j and l for BCL2 (top panels) and KRAS (bottom panels) oligonucleotides at the three different pH investigated. | ||
Noteworthily, spectra at pH 6.6 and 5.2 of both DNA sequences also exhibit the presence of two novel bands located at 1394 and 1543 cm−1 (indicated by f′ and h′, respectively), whose intensities increase as the pH decreases (Fig. 4 and Tables S1–S6, ESI†). Both these bands are associated with the presence of protonated cytosine and consequently with the formation of hemi-protonated C·C+ base pairs in C-rich oligonucleotides.57 However, the overlapping of the small band f’ with the more intense band f of thymine prevents its use as a potential quantitative marker of iM formation, while the relative variation of bands h (1529 cm−1, neutral cytosine) and h’ (1543 cm−1, C·C+ base pair) may represent a valuable marker of iM formation. According to the literature, the Raman signature of hemi-protonated cytosine base pairs is distinct from the signatures of unprotonated and protonated cytosines, since C·C+ lacks marker bands of unprotonated cytosine, and the intensity of the bands of protonated cytosine decreases by a factor of 2. Indeed, at pH 7.8, band h is the only observable and a decrease in the intensity of this band is clearly observed upon acidification, along with the concomitant gradual intensification of band h′. Therefore, a quantitative measure of the fraction of iM population can be given by fraction Π defined by the relation
| Π(%) = 100Ah′/(Ah + Ah′) | (2) |
| pH | BCL2 Π | KRAS Π | ||
|---|---|---|---|---|
| No PEG | PEG 200 | No PEG | PEG 200 | |
| 7.8 | 0 | 0 | 0 | 0 |
| 6.6 | 22.3 ± 1.9 | 35.5 ± 1.4 | 16.3 ± 1.2 | 16.5 ± 1.3 |
| 5.2 | 48.0 ± 2.2 | 72.8 ± 2.4 | 57.6 ± 1.5 | 50.0 ± 1.9 |
Then, a careful examination of other pH-sensitive bands not related to cytosines was performed to have further insights into the pH-dependent dynamic equilibrium between iM and hairpin species of BCL2 and KRAS. From this perspective, remarkable information on DNA structural transitions was retrieved from changes of band f of thymine, as well as g, j, and l of guanine.
Band f probes the position of thymine bases in DNA, as already observed by following the thermal denaturation of G-quadruplex structures.35 This band turned out to be redshifted during the melting of G-quadruplexes, i.e. when such nucleobases become unstacked in the single-stranded DNA. Interestingly, band f turned out to be sensitive to pH as well (Fig. 5C and D). A general blueshift of band f is observed upon acidification of both oligonucleotide solutions, which can be ascribed to changes experienced by thymines during the C-rich DNA conformational transition to form the iM. Interestingly, band f undergoes a larger shift in the case of KRAS compared to BCL2 (Tables S1–S6, ESI†), suggesting a different structural environment experienced by thymines in the case of the two sequences. Previous studies indicate that thymines in the loops of iMs are common capping residues that can be involved in additional base pairs, like T·T and/or A·T (Hoogsteen, reverse Watson–Crick), that extend the iM core and stabilize the structures.66,67 In the structural model proposed for KRAS (Fig. 2B),12 all thymines belong to the flanking residues at the 5′- and 3′-ends in the unordered region of the hairpin structure, while they are part of the loops of the iM structure, potentially contributing to its stabilization. Conversely, in the folding pattern proposed for BCL2 (Fig. 2A), only the last thymine residue of the sequence is located in the flanking, unordered region of the iM and hairpin structures.9,61 Therefore, the different changes in the position of band f observed for the two oligonucleotides agree well with their structural models. Thus, band f represents a marker to detect loop formation or modification during the conformational transitions of C-rich oligonucleotides.
An appreciable shift of band g (assigned to the guanine ring) to a lower frequency was observed for both oligonucleotides upon acidification from pH 7.8 to 5.2 (Fig. 5E and F). It has been pointed out that a redshift of band g shows an increased strength of hydrogen bonding of N7 of unpaired guanine bases with the solvent, which causes a lowering of the frequency of this vibration.68 Interestingly, a gradual variation of band g takes place in the case of BCL2, thus suggesting the related gradual decrease of Watson–Crick G–C base pairs. Moreover, band g undergoes a smaller shift for KRAS than for BCL2, in agreement with the formation, at pH 6.6, of a hybrid iM/hairpin species stabilized by the Watson–Crick G–C base pairs as in the hairpin conformation, which would imply a greater persistence of G–C base pairs in KRAS.
Another remarkable piece of information on hairpin/iM transitions can also be retrieved from changes of bands j and l of guanines (Fig. 5G and H), associated with the vibration of the exocyclic NH2 scissoring and CO stretching, respectively. Although these bands are detected as shoulders of the wide band k at around 1654 cm−1, they are well-established markers of guanines involved or not in base pairing with cytosines. As for band j, both oligonucleotides exhibited a redshift when the pH decreases, albeit to a slightly different extent, indicative of G–C base pair dissociation.41,56 In particular, at pH 7.8, the position of band j at the same wavenumber for the two oligonucleotides (around 1622 cm−1) suggests a similar G–C base pair content for the two. However, some differences are observed in the behavior of band j for KRAS and BCL2 at pH 6.6. These differences may reflect the different conformational states that the two oligonucleotides have at this pH value. Finally, at pH 5.2, the position of band j is the same in both KRAS and BCL2 spectra (around 1610 cm−1), indicating an almost complete iM formation for both the oligonucleotides.
Interesting is also the behavior of band l (which refers to unpaired guanines) upon pH changes. In particular, a gradual intensification of band l is observed for BCL2 from pH 7.8 to 5.2, which denotes the gradual increase of unpaired guanines. Conversely, no significant variation of such band is detected for KRAS between pH 7.8 and 6.6, confirming the retention of the G–C base pairs in the corresponding DNA structure it forms at pH 6.6. On the other hand, the KRAS oligonucleotide exhibits a significant intensification of band l at pH 5.2, in agreement with the already mentioned predominant formation of iM at such pH.
With the aim of further corroborating the pH-dependent structural information and conformational transitions, the two-dimensional correlation spectroscopy (2D-COS) analysis of UVRR spectra at the three different pH values was performed. The synchronous 2D correlation maps for BCL2 and KRAS (Fig. 6A and C) show auto-peaks (located at the diagonal of the maps) for each of the UVRR bands, thus confirming that all of them, even though to different extent, are perturbed by the pH variation. On the other hand, the positive cross-peaks (located at off-diagonal positions of the maps) observed between pairs of bands indicate that the intensities of ν1 and ν2 always vary in the same direction. For example, band k (overlapped with j and l) shows cross-peaks with all the other bands, thus indicating the existence of synchronized spectral changes with the different bands. The most intense cross-peak suggests a strong correlation between the intensity change of the bands j, k, l and the bands b, c, d. This agrees well with the fact that these bands carry the information concerning the most pH-sensitive vibrations of dC and dT residues.
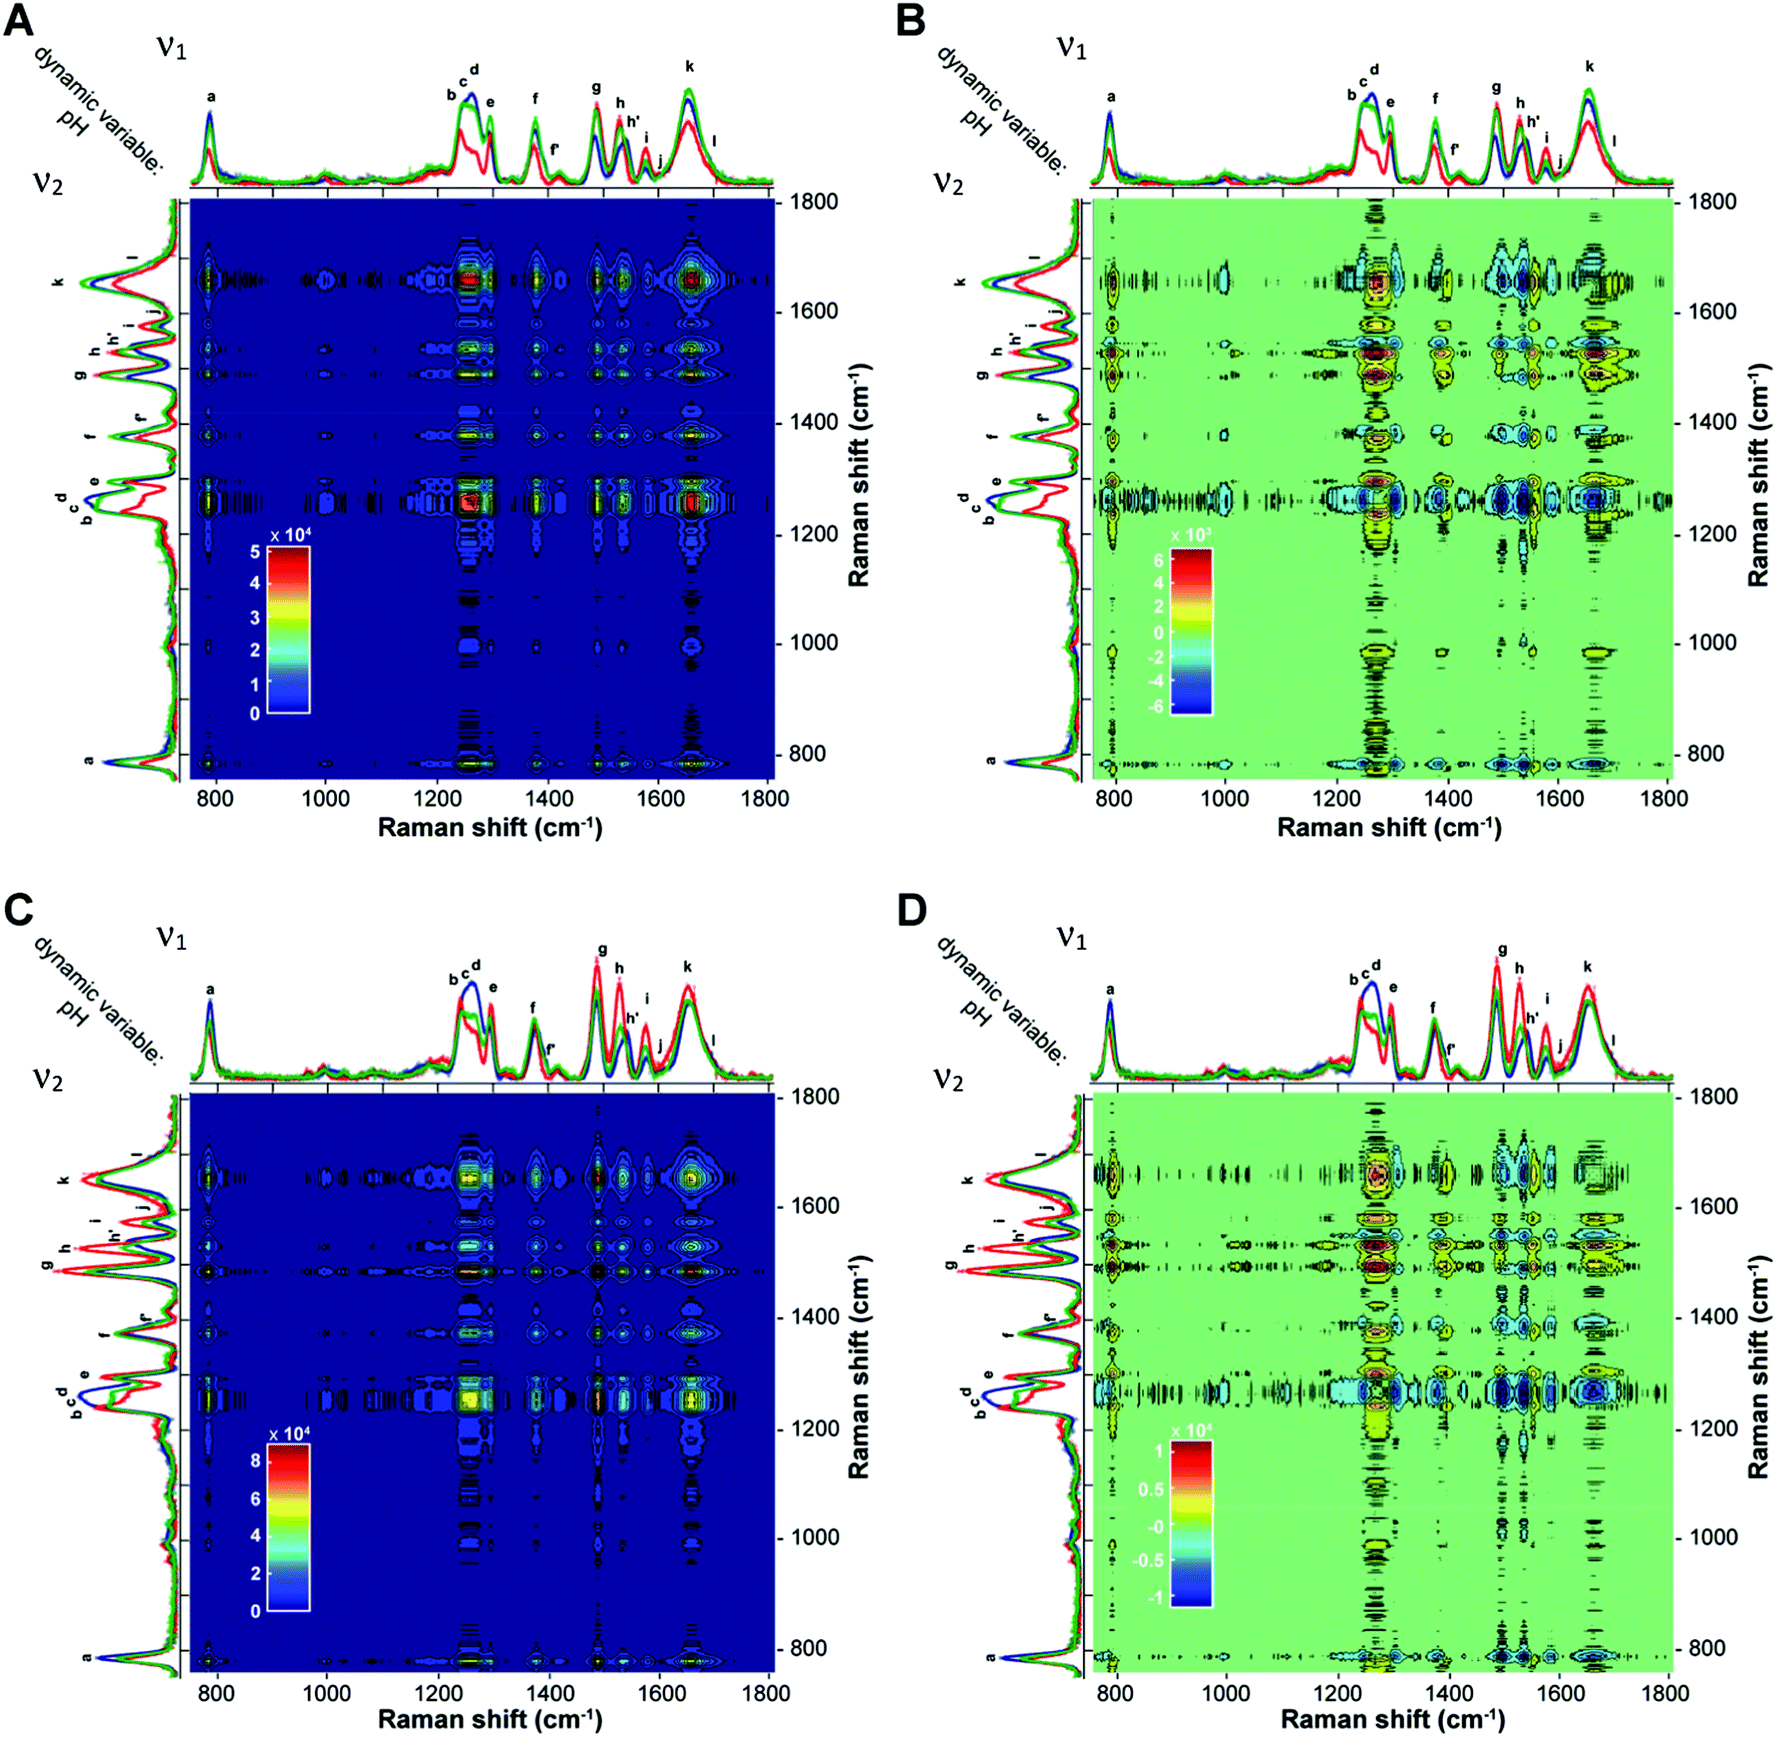 | ||
| Fig. 6 Synchronous (A and C) and asynchronous (B and D) 2D UVRR correlation maps for BCL2 (top) and KRAS (bottom) generated from the pH-dependent spectra. The color bar that applies to each map is displayed at the bottom left of the map. | ||
The sign of the cross-peaks in the homospectral asynchronous 2D-COS maps of BCL2 and KRAS (Fig. 6B and D) provides crucial information on the sequential relationships between peaks with different spectral origins and provides further validation of the peak deconvolution. Indeed, according to the interpretation rules of such signs by Noda,58,60 in an asynchronous plot, if a peak (ν1, ν2) is positive, band ν1 will vary prior to band ν2, and if it is negative, band ν1 will vary after band ν2. Furthermore, cross-peaks in the synchronous map with a rather broad area that does not display any well-resolved bands, likely because of the presence of several overlapping bands, could also split into smaller cross-peaks of different colors in the asynchronous map, thus showing the presence of different entities under the same band. Thus, the asynchronous 2D-COS maps of BCL2 and KRAS show a clear split of the four broad synchronous cross-peaks at around 1250 (bands b, c, and d), 1377 (bands f and f′), 1529 (bands h and h′), and 1654 cm−1 (bands k and l). This result matches very well with the previously performed peak deconvolution and assignment reported in Fig. 4 and 5.
Regarding the sequential order of events, the values of the cross-peaks indicate that, when pH changes from 5.2 to 7.8, the changes in the bands a, c, d, f′, h′, and k occur before the intensity variation in g and i, demonstrating that the guanines (bands g and i) are involved in the iM to hairpin conformational transition after the partial deprotonation of the cytosines. On the other hand, the sign of the cross-peaks indicates that changes in bands e and h occur always after the changes in the other bands as the pH increases.
Finally, a careful inspection of the asynchronous maps reveals that the only noticeable difference between the two sequences is in the behavior of band b (associated with dT), which, only in the case of BCL2, shows a negative cross-peak with band k. This difference once again suggests a different structural environment experienced by thymines in the case of the two sequences.
Effect of molecular crowding induced by PEG 200 on the UVRR spectra of KRAS and BCL2 oligonucleotides
Since low molecular weight polyethylene glycol (PEG) is commonly used as a cosolute to mimic molecular crowding conditions close to those of the cellular environment,69 the effect of 40% PEG 200 on the two oligonucleotides at the three different pH values has been investigated. According to the literature (see the comprehensive review by Takahashi and Sugimoto),25 this “crowded” condition simulates a reduced hydration which is also known to indirectly affect the base–base interactions generally inducing more compact conformations, e.g., stabilizing iM structures even at neutral pH,23,70 and thus increasing their thermal stability.24Fig. 7 and 8 show the overlaid UVRR spectra of BCL2 and KRAS in the presence and absence of PEG 200 at pH 7.8, 6.6 and 5.2. At pH 7.8, BCL2 seems to be affected by the presence of 40% PEG 200 more than KRAS (Fig. 7A and 8A, respectively), with a general increase of the intensity of bands for the first and an increase limited to bands b–e for the second. Moreover, a shift of some bands of cytosine and guanine (about 2–5 cm−1) is observed along with no significant changes in the position of the thymine bands (see Tables S1 and S7 for BCL2, and Tables S4 and S10 for KRAS, ESI†), thus suggesting some effects on G–C interactions. However, the absence of bands f′ and h′, which are the markers for the iM formation, indicates that at pH 7.8 both sequences are unable to form such a structure under the molecular crowding conditions as in dilute solution.
 | ||
| Fig. 7 Overlay of the UVRR spectra and corresponding fits for BCL2 in dilute (grey) and PEG-crowded (red) solutions at pH (A) 7.8, (B) 6.6, and (C) 5.2. The colored rectangles highlight the bands whose intensity varies more in the presence of 40% PEG 200. | ||
 | ||
| Fig. 8 Overlay of the UVRR spectra and corresponding fits for KRAS in dilute (grey) and PEG-crowded (red) solutions at pH (A) 7.8, (B) 6.6, and (C) 5.2. The red rectangles highlight the guanine bands whose intensity increases in the presence of 40% PEG 200. | ||
This finding is also confirmed by CD spectra and melting data recorded in PEG 200-crowded solution (Fig. S11 and S12, ESI†), which show no significant changes with respect to the data obtained in dilute solution.
At pH 6.6, the UVRR spectra of the oligonucleotides in PEG-containing solution vary differently in terms of intensity for BCL2 and KRAS compared to the respective spectra recorded in the absence of PEG (see Tables S2 and S8 for BCL2, and Tables S5 and S11 for KRAS, ESI†). In particular, an increase in the intensity of bands d and e of cytosine, and b of thymine is detected in the case of BCL2 (Fig. 7B). Moreover, a significant increase of the Π value (around 60%) for the hemi-protonation of cytosine was observed in the presence of PEG 200 with respect to the dilute solution (Table 1), while the CD melting data at pH 6.6 show increased thermal stability of the BCL2 structure (ΔTm ≈ +4.5 °C) in the presence of PEG compared to that in its absence (Fig. S4 and S11, ESI†). These results suggest that PEG 200 induces the formation and stabilization of BCL2 iM at that pH.23
In contrast, a different scenario is observed for KRAS in PEG-containing solutions at pH 6.6 (Fig. 8B). In this case, an increase of the intensity of bands g, i, and j, all relative to guanine bases, is detected, while the bands of thymine and cytosine (either neutral or protonated) remain almost unaffected. The irrelevant effect of PEG on cytosines, and thus on the iM structure formed by KRAS, is also confirmed by the value of the Π marker which is close to that obtained from the spectra in dilute solution (Table 1). However, a thermal destabilization effect (ΔTm ≈ −7 °C) is observed by CD experiments for the KRAS structure in the presence of PEG 200 at pH 6.6 (Fig. S5 and S12, ESI†).
Attempting a rationalization of these results, the changes in the guanine bands of KRAS under crowding conditions at pH 6.6 suggest that the presence of PEG 200 affects mainly, if not exclusively, the guanine bases mostly located in the long hairpin-forming loop of the hybrid iM/hairpin species. This increase in intensity indicates a decrease of the short-range (nearest-neighbor) interactions of the guanine bases due to the effect of shielding by the PEG polymer chains. Actually, the effect of PEG on hairpin is complex and it depends on both the dimension of the hairpin junction and the size of the PEG chain.71,72 Cosolutes with low molecular weights, such as PEG 200, which decrease the water activity and generate osmotic stress, were found to decrease the stability of the DNA hairpins.71 Therefore, the changes in guanine bands and the lower thermal stability detected for KRAS at pH 6.6 may arise from a decrease of G–C interactions in the hairpin-forming loop of the hybrid species.
The UVRR spectra of BCL2 and KRAS at pH 5.2 in the presence of 40% PEG 200 (Fig. 7C and 8C, respectively) also show a different behavior for the two oligonucleotides. In the case of BCL2, except for a slight decrease in band e, an increase in the intensity of most bands is observed, including f′ and h′, the markers of the C·C+ base pair. This results in a PEG-induced increase of the Π value (around 50%, Table 1) indicating an increase of cytosine protonation (and thus of iM population) at that pH, with a slight thermal stabilization (ΔTm ≈ +2 °C) as detected by CD melting experiments (Fig. S4 and S11, ESI†). As far as KRAS is concerned, the spectrum at pH 5.2 in the presence of PEG shows a decrease in the intensity of bands b, d, and e, along with an increase in the intensity of bands g, h, and i. On the other hand, no significant variation with respect to the spectrum recorded in dilute solution was observed for bands f′ and h′, as well as no consequences on iM stability were detected by CD melting (Fig. S12, ESI†), thus suggesting the absence of relevant effects of PEG 200 on that iM structure. These results are in agreement with the low-to-null effects of PEG 200 on the thermal stability of c-MYC promoter iM at pH values around 5.0.72
Additional information on pH-dependent conformational transitions of BCL2 and KRAS under molecular crowding conditions was achieved by performing 2D-COS analysis of UVRR spectra recorded in the presence of PEG 200. The synchronous 2D correlation maps of BCL2 and KRAS (Fig. S13A and C, ESI†) as well as the asynchronous correlation map of BCL2 (Fig. S13B, ESI†) show no noteworthy differences with respect to the maps obtained in dilute solution (Fig. 6). Conversely, the asynchronous 2D correlation map generated for KRAS in PEG-crowded solution (Fig. S13D, ESI†) shows some small but significant differences, all concerning band g of guanine: (i) two novel cross-peaks between band g and bands b and f (around 1243 and 1376 cm−1, respectively) of thymine emerge from the background; ii) the cross-peaks of band g with bands i and k (around 1576 and 1652 cm−1, respectively) show a clear split into two smaller cross-peaks of different colors.
These findings corroborate the idea that the presence of PEG 200 mainly affects the guanine bases located in the long hairpin-forming loop of KRAS and that their behavior under crowding conditions is correlated to that of the thymines present in the short loops.
Heterospectral UVRR/CD 2D-COS analysis
A heterospectral 2D correlation map compares two sets of spectra obtained by two different spectroscopic techniques, here UVRR and CD, at identical values of the perturbation variable. This is a powerful method based on the assumption that the correlation of a band in a set of spectra with another band in a second set is most probably due to the fact that these two bands monitor the same event. The synchronous and asynchronous heterospectral 2D-COS maps generated from the pH-dependent UVRR and CD spectra (on the x-axis and y-axis, respectively) of BCL2 and KRAS are shown in Fig. 9. In contrast to the homospectral correlation plots, these 2D heterospectral correlation plots are no longer symmetrical about the diagonal line. Thus, all peaks have to be interpreted as cross-peaks. The synchronous heterospectral correlation plots (Fig. 9A and C) show that most of the assigned UVRR bands give strong positive correlation peaks with the main CD positive band at 288 nm except for bands h and i, which generate less intense cross-peaks. Such correlations further validate the fact that the CD band at 288 nm is indicative of the presence of the iM structure in solution; thus its intensity decreases when pH increases (and vice versa) in a synchronized manner compared to the variations observed in the UVRR peaks. The synchronous maps show also negative cross-peaks in correspondence of the CD band at 264 nm, which is, indeed, negatively correlated with the positive band at 288 nm; thus, the intensity change occurs in opposite directions as expected.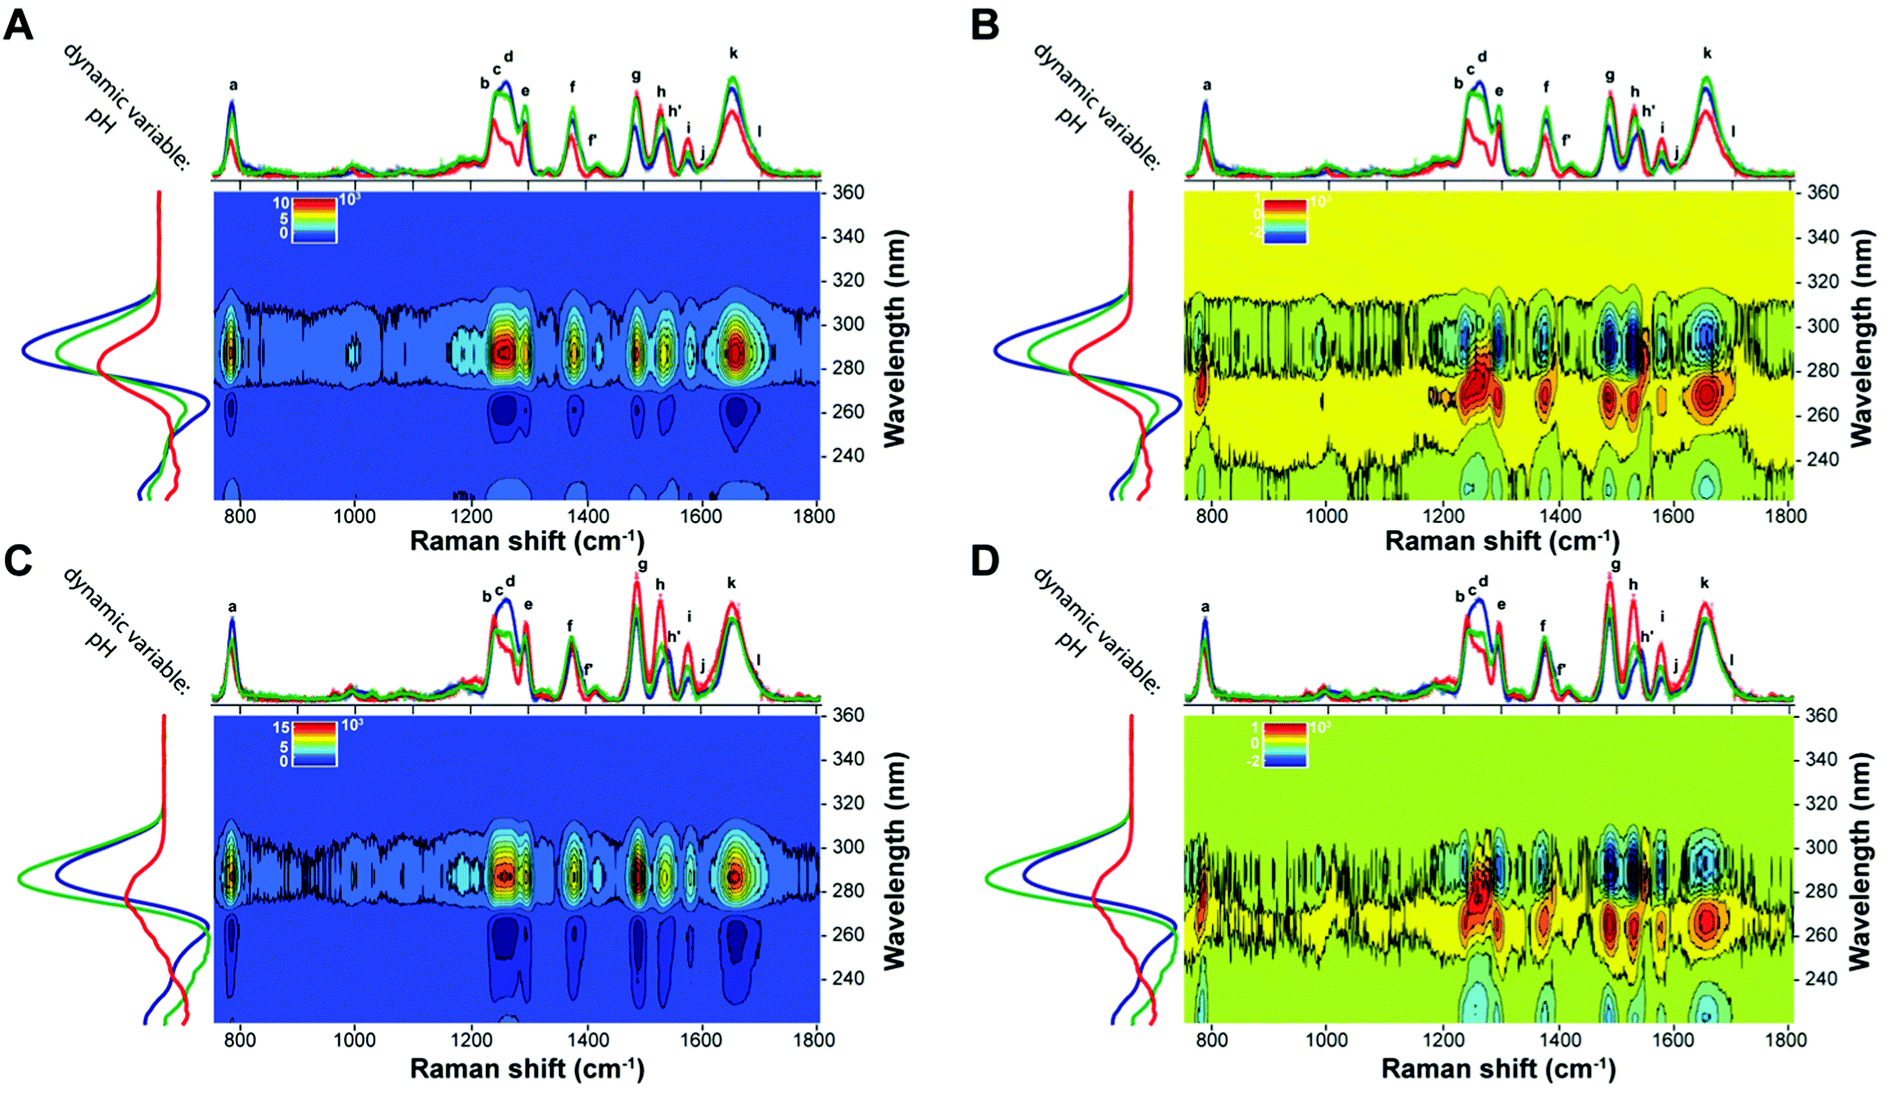 | ||
| Fig. 9 Synchronous (A and C) and asynchronous (B and D) 2D heterospectral correlation maps generated from the UVRR and CD dynamic spectra of BCL2 (top) and KRAS (bottom). The color bar that applies to each map is displayed at the top left of the map. | ||
Even more informative are the asynchronous 2D-COS maps (Fig. 9B and D). Indeed, a careful inspection of those maps reveals that the intensity changes for all UVRR peaks take place faster than that of the CD band at 264 nm (positive cross-peaks), while their variations in relation to the CD band at 288 nm are slower (negative cross-peaks) in most cases, apart from bands d, f′, h′, and, in part, a, where cross-peaks with a positive sign are observed. Interestingly, these findings agree with the fact that these bands carry the information related to the hemi-protonated C·C+ pairs, which are, of course, very sensitive to the pH variation. It is also reasonable that the maximum CD band at 288 nm varies faster than the other UVRR peaks since it is also indicative of the presence of the iM in solution. Noteworthily, the asynchronous plot of KRAS (Fig. 9D) shows, for the aforementioned bands, a more pronounced split of the corresponding synchronous cross-peaks than that of BCL2. This phenomenon may be due to the different conformational transition pathway of the two oligonucleotides.
Conclusions
The pH-dependent conformational transitions of two C-rich sequences were studied by combining CD and UVRR spectroscopies with the aim of understanding the structural changes of DNA sequences forming iM structures and other conformational species in solution. The multivariate analysis of CD data and the scrutiny of the UVRR band patterns were used to quantify the composition of various species in solution, enlightening the dynamic equilibrium of BCL2 and KRAS iMs with hairpin species. Furthermore, the 2D-COS analysis was employed to highlight the local perturbations and the sequential events occurring in the course of changes of the dynamic variable pH.The whole set of CD data have been fruitfully exploited to deconvolute the composition profiles of the conformational species as a function of pH and temperature and, thus, to generate contour plots identifying the fractions of the various species formed by BCL2 and KRAS in a pH-temperature diagram. The inspection of these diagrams indicates that the iMs with a long loop, such as in KRAS, at certain pH values can really house an entire hairpin-forming sequence in the structure, thus coexisting as a hybrid iM/hairpin species in equilibrium with the single iM and hairpin structures. On the other hand, the Watson–Crick hairpin in both BCL2 and KRAS is the predominant species in solution at pH >7.5 and low temperature.
The pH-dependent UVRR spectral changes have been initially quantified by the shift and intensity variations, establishing the diagnostic markers of C-rich oligonucleotides in their different conformations. Then the scrutiny of the 2D-COS maps, especially the asynchronous ones, provided a strong confirmation of the conventional Raman spectral analysis and peak markers. More importantly, the analysis of the asynchronous correlation maps offered a sensitive means in detecting the sequence of events in response to changes induced by pH variations, in the absence and presence of PEG 200 as a crowding agent. This provides relevant complementary information for a detailed description of the observed dynamical scenario upon the applied pH path. The analysis of the sequential order of events indicates that the conformational changes induced by pH occurred at different rates for different parts of the oligonucleotides. In particular, when pH changes from 5.2 to 7.8, guanine bases are involved in the iM to hairpin conformational transition after the partial deprotonation of the cytosines. A noteworthy difference between BCL2 and KRAS is in the behavior of thymine bases which suggests a different structural environment experienced by such nucleobases during the iM-hairpin conformational transitions in the case of the two DNA sequences. Similarly, the effect of the presence of PEG 200 on the pH-induced conformational transitions was also elucidated, highlighting a different effect of the crowding agent on the two oligonucleotides especially at pH 6.6. Indeed, at this pH, it induces the stabilization of BCL2 iM, while a destabilizing effect is observed for KRAS, most likely due to the decrease of G–C interactions in the hairpin-forming loop of the hybrid species.
Overall, the present work emphasizes the concerted CD-assisted UVRR task to shed light on the effect of solution conditions on intra- and intermolecular interactions of the different DNA conformations.
Conflicts of interest
The authors declare no conflict of interest.Acknowledgements
The authors wish to thank the BL10.2–IUVS beamline scientists for their kind support and suggestions during the Raman measurements and Dr Friedrich Menges for providing the Spectragryph software for data reduction. The authors acknowledge the CERIC-ERIC Consortium for the access to experimental facilities and financial support [Proposal no. 20192149 to J. A.]. Financial support from the Italian Association for Cancer Research [IG 24590 to B. P.] is also gratefully acknowledged.References
- F. Kouzine, Supercoil-driven DNA structures regulate genetic transactions, Front. Biosci., 2007, 12, 4409–4423 CrossRef CAS PubMed.
- A. Bacolla and R. D. Wells, Non-B DNA conformations, genomic rearrangements, and human disease, J. Biol. Chem., 2004, 279, 47411–47414 CrossRef CAS PubMed.
- S. Kendrick and L. H. Hurley, The role of G-quadruplex/i-motif secondary structures as cis-acting regulatory elements, Pure Appl. Chem., 2010, 82, 1609–1621 CAS.
- J. Palacký, M. Vorlíčková, I. Kejnovská and P. Mojzeš, Polymorphism of human telomeric quadruplex structure controlled by DNA concentration: A Raman study, Nucleic Acids Res., 2013, 41, 1005–1016 CrossRef PubMed.
- R. D. Gray, J. Li and J. B. Chaires, Energetics and kinetics of a conformational switch in G-quadruplex DNA, J. Phys. Chem. B, 2009, 113, 2676–2683 CrossRef CAS PubMed.
- R. D. Gray, L. Petraccone, J. O. Trent and J. B. Chaires, Characterization of a K+-induced conformational switch in a human telomeric DNA oligonucleotide using 2-aminopurine fluorescence, Biochemistry, 2010, 49, 179–194 CrossRef CAS PubMed.
- C.-T. Lin, T.-Y. Tseng, Z.-F. Wang and T.-C. Chang, Structural conversion of intramolecular and intermolecular G-quadruplexes of bcl2mid: The effect of potassium concentration and ion exchange, J. Phys. Chem. B, 2011, 115, 2360–2370 CrossRef CAS PubMed.
- B. Pagano, C. A. Mattia, L. Cavallo, S. Uesugi, C. Giancola and F. Fraternali, Stability and cations coordination of DNA and RNA 14-Mer G-quadruplexes: A multiscale computational approach, J. Phys. Chem. B, 2008, 112, 12115–12123 CrossRef CAS PubMed.
- S. Kendrick, H.-J. Kang, M. P. Alam, M. M. Madathil, P. Agrawal, V. Gokhale, D. Yang, S. M. Hecht and L. H. Hurley, The dynamic character of the BCL2 promoter i-motif provides a mechanism for modulation of gene expression by compounds that bind selectively to the alternative DNA hairpin structure, J. Am. Chem. Soc., 2014, 136, 4161–4171 CrossRef CAS PubMed.
- A. Kovanda, M. Zalar, P. Šket, J. Plavec and B. Rogelj, Anti-sense DNA d(GGCCCC)n expansions in C9ORF72 form i-motifs and protonated hairpins, Sci. Rep., 2016, 5, 17944 CrossRef PubMed.
- G. Miglietta, S. Cogoi, E. B. Pedersen and L. E. Xodo, GC-elements controlling HRAS transcription form i-motif structures unfolded by heterogeneous ribonucleoprotein particle A1, Sci. Rep., 2016, 5, 18097 CrossRef PubMed.
- C. E. Kaiser, N. A. Van Ert, P. Agrawal, R. Chawla, D. Yang and L. H. Hurley, Insight into the complexity of the i-motif and G-quadruplex DNA structures formed in the KRAS promoter and subsequent drug-induced gene repression, J. Am. Chem. Soc., 2017, 139, 8522–8536 CrossRef CAS PubMed.
- H. Abou Assi, M. Garavís, C. González and M. J. Damha, i-Motif DNA: structural features and significance to cell biology, Nucleic Acids Res., 2018, 46, 8038–8056 CrossRef PubMed.
- J. Amato, N. Iaccarino, A. Randazzo, E. Novellino and B. Pagano, Noncanonical DNA secondary structures as drug targets: The prospect of the i-motif, ChemMedChem, 2014, 9, 2026–2030 CrossRef CAS PubMed.
- K. Gehring, J.-L. Leroy and M. Guéron, A tetrameric DNA structure with protonated cytosine–cytosine base pairs, Nature, 1993, 363, 561–565 CrossRef CAS PubMed.
- S. Dzatko, M. Krafcikova, R. Hänsel-Hertsch, T. Fessl, R. Fiala, T. Loja, D. Krafcik, J.-L. Mergny, S. Foldynova-Trantirkova and L. Trantirek, Evaluation of the stability of DNA i-motifs in the nuclei of living Mammalian cells, Angew. Chem., Int. Ed., 2018, 57, 2165–2169 CrossRef CAS PubMed.
- M. Zeraati, D. B. Langley, P. Schofield, A. L. Moye, R. Rouet, W. E. Hughes, T. M. Bryan, M. E. Dinger and D. Christ, I-motif DNA structures are formed in the nuclei of human cells, Nat. Chem., 2018, 10, 631–637 CrossRef CAS PubMed.
- W. Tang, K. Niu, G. Yu, Y. Jin, X. Zhang, Y. Peng, S. Chen, H. Deng, S. Li, J. Wang, Q. Song and Q. Feng, In vivo visualization of the i-motif DNA secondary structure in the Bombyx mori testis, Epigenet. Chromat., 2020, 13, 12 CrossRef CAS PubMed.
- N. Iaccarino, A. Di Porzio, J. Amato, B. Pagano, D. Brancaccio, E. Novellino, R. Leardi and A. Randazzo, Assessing the influence of pH and cationic strength on i-motif DNA structure, Anal. Bioanal. Chem., 2019, 411, 7473–7479 CrossRef CAS PubMed.
- J. Amato, F. D’Aria, S. Marzano, N. Iaccarino, A. Randazzo, C. Giancola and B. Pagano, On the thermodynamics of folding of an i-motif DNA in solution under favorable conditions, Phys. Chem. Chem. Phys., 2021, 23, 15030–15037 RSC.
- M. Mondal, D. Bhattacharyya and Y. Q. Gao, Structural properties and influence of solvent on the stability of telomeric four-stranded i-motif DNA, Phys. Chem. Chem. Phys., 2019, 21, 21549–21560 RSC.
- I. Berger, M. Egli and A. Rich, Inter-strand C–H⋯O hydrogen bonds stabilizing four-stranded intercalated molecules: stereoelectronic effects of O4′ in cytosine-rich DNA, Proc. Natl. Acad. Sci. U. S. A., 1996, 93, 12116–12121 CrossRef CAS PubMed.
- A. Rajendran, S. Nakano and N. Sugimoto, Molecular crowding of the cosolutes induces an intramolecular i-motif structure of triplet repeat DNA oligomers at neutral pH, Chem. Commun., 2010, 46, 1299–1301 RSC.
- Y. P. Bhavsar-Jog, E. Van Dornshuld, T. A. Brooks, G. S. Tschumper and R. M. Wadkins, Epigenetic modification, dehydration, and molecular crowding effects on the thermodynamics of i-Motif structure formation from C-Rich DNA, Biochemistry, 2014, 53, 1586–1594 CrossRef CAS PubMed.
- S. Takahashi and N. Sugimoto, Stability prediction of canonical and non-canonical structures of nucleic acids in various molecular environments and cells, Chem. Soc. Rev., 2020, 49, 8439–8468 RSC.
- J. Choi and T. Majima, Conformational changes of non-B DNA, Chem. Soc. Rev., 2011, 40, 5893–5909 RSC.
- J. Amato, A. Pagano, D. Capasso, S. Di Gaetano, M. Giustiniano, E. Novellino, A. Randazzo and B. Pagano, Targeting the BCL2 gene promoter G-quadruplex with a new class of furopyridazinone-based molecules, ChemMedChem, 2018, 13, 406–410 CrossRef CAS PubMed.
- H. J. Kang, S. Kendrick, S. M. Hecht and L. H. Hurley, The transcriptional complex between the BCL2 i-motif and hnRNP LL is a molecular switch for control of gene expression that can be modulated by small molecules, J. Am. Chem. Soc., 2014, 136, 4172–4185 CrossRef CAS PubMed.
- S. Takahashi, J. A. Brazier and N. Sugimoto, Topological impact of noncanonical DNA structures on Klenow fragment of DNA polymerase, Proc. Natl. Acad. Sci. U. S. A., 2017, 114, 9605–9610 CrossRef CAS PubMed.
- H. Gaillard, T. García-Muse and A. Aguilera, Replication stress and cancer, Nat. Rev. Cancer, 2015, 15, 276–289 CrossRef CAS PubMed.
- M. Debnath, K. Fatma and J. Dash, Chemical regulation of DNA i-Motifs for nanobiotechnology and therapeutics, Angew. Chem., Int. Ed., 2019, 58, 2942–2957 CrossRef CAS PubMed.
- S. Benabou, R. Ferreira, A. Aviñó, C. González, S. Lyonnais, M. Solà, R. Eritja, J. Jaumot and R. Gargallo, Solution equilibria of cytosine- and guanine-rich sequences near the promoter region of the n-myc gene that contain stable hairpins within lateral loops, Biochim. Biophys. Acta, Gen. Subj., 2014, 1840, 41–52 CrossRef CAS PubMed.
- J. M. Benevides, S. A. Overman and G. J. Thomas, Raman, polarized Raman and ultraviolet resonance Raman spectroscopy of nucleic acids and their complexes, J. Raman Spectrosc., 2005, 36, 279–299 CrossRef CAS.
- F. Bianchi, L. Comez, R. Biehl, F. D’Amico, A. Gessini, M. Longo, C. Masciovecchio, C. Petrillo, A. Radulescu, B. Rossi, F. Sacchetti, F. Sebastiani, N. Violini and A. Paciaroni, Structure of human telomere G-quadruplex in the presence of a model drug along the thermal unfolding pathway, Nucleic Acids Res., 2018, 46, 11927–11938 CrossRef CAS PubMed.
- S. Di Fonzo, C. Bottari, J. W. Brady, L. Tavagnacco, M. Caterino, L. Petraccone, J. Amato, C. Giancola and A. Cesàro, Crowding and conformation interplay on human DNA G-quadruplex by ultraviolet resonant Raman scattering, Phys. Chem. Chem. Phys., 2019, 21, 2093–2101 RSC.
- S. Di Fonzo, J. Amato, F. D’Aria, M. Caterino, F. D’Amico, A. Gessini, J. W. Brady, A. Cesàro, B. Pagano and C. Giancola, Ligand binding to G-quadruplex DNA: New insights from ultraviolet resonance Raman spectroscopy, Phys. Chem. Chem. Phys., 2020, 22, 8128–8140 RSC.
- F. D’Amico, P. Zucchiatti, K. Latella, M. Pachetti, A. Gessini, C. Masciovecchio, L. Vaccari and L. Pascolo, Investigation of genomic DNA methylation by ultraviolet resonant Raman spectroscopy, J. Biophotonics, 2020, 13, e202000150 Search PubMed.
- S. Kendrick, Y. Akiyama, S. M. Hecht and L. H. Hurley, The i-Motif in the bcl-2 P1 promoter forms an unexpectedly stable structure with a unique 8:5:7 loop folding pattern, J. Am. Chem. Soc., 2009, 131, 17667–17676 CrossRef CAS PubMed.
- J. Kypr, I. Kejnovska, D. Renciuk and M. Vorlickova, Circular dichroism and conformational polymorphism of DNA, Nucleic Acids Res., 2009, 37, 1713–1725 CrossRef CAS PubMed.
- Z. Q. Wen and G. J. Thomas, UV resonance Raman spectroscopy of DNA and protein constituents of viruses: Assignments and cross sections for excitations at 257, 244, 238, and 229 nm, Biopolymers, 1998, 45, 247–256 CrossRef CAS PubMed.
- S. P. A. Fodor and T. G. Spiro, Ultraviolet resonance Raman spectroscopy of DNA with 200–266-nm laser excitation, J. Am. Chem. Soc., 1986, 108, 3198–3205 CrossRef CAS.
- A. Toyama, Y. Takino, H. Takeuchi and I. Harada, Ultraviolet resonance Raman spectra of ribosyl C(1′)-deuterated purine nucleosides: Evidence of vibrational coupling between purine and ribose rings, J. Am. Chem. Soc., 1993, 115, 11092–11098 CrossRef CAS.
- J. Amato, A. Pagano, S. Cosconati, G. Amendola, I. Fotticchia, N. Iaccarino, J. Marinello, A. De Magis, G. Capranico, E. Novellino, B. Pagano and A. Randazzo, Discovery of the first dual G-triplex/G-quadruplex stabilizing compound: A new opportunity in the targeting of G-rich DNA structures?, Biochim. Biophys. Acta, Gen. Subj., 2017, 1861, 1271–1280 CrossRef CAS PubMed.
- C. R. Cantor, M. M. Warshaw and H. Shapiro, Oligonucleotide interactions. III. Circular dichroism studies of the conformation of deoxyoligonucleolides, Biopolymers, 1970, 9, 1059–1077 CrossRef CAS PubMed.
- Y.-M. Chang, C. K. M. Chen and M.-H. Hou, Conformational changes in DNA upon ligand binding monitored by circular dichroism, Int. J. Mol. Sci., 2012, 13, 3394–3413 CrossRef CAS PubMed.
- J. Jaumot, N. Escaja, R. Gargallo, C. González, E. Pedroso and R. Tauler, Multivariate curve resolution: A powerful tool for the analysis of conformational transitions in nucleic acids, Nucleic Acids Res., 2002, 30, e92 CrossRef PubMed.
- J. Jaumot, A. de Juan and R. Tauler, MCR-ALS GUI 2.0: New features and applications, Chemom. Intell. Lab. Syst., 2015, 140, 1–12 CrossRef CAS.
- G. H. Golub and C. F. Van Loan, Matrix computations, 3rd edn, John Hopkins University Press, Baltimore, 1996 Search PubMed.
- M. Maeder, Evolving factor analysis for the resolution of overlapping chromatographic peaks, Anal. Chem., 1987, 59, 527–530 CrossRef CAS.
- W. Windig and J. Guilment, Interactive self-modeling mixture analysis, Anal. Chem., 1991, 63, 1425–1432 CrossRef CAS.
- R. Tauler and M. Maeder, Comprehensive Chemometrics, Elsevier, 2009, vol. 2, pp. 345–363 Search PubMed.
- R. Tauler and A. de Juan, Data Handling in Science and Technology, Elsevier Ltd, 2015, vol. 29, pp. 247–292 Search PubMed.
- W. Hug and I. Tinoco, Electronic spectra of nucleic acid bases. I. Interpretation of the in-plane spectra with the aid of all valence electron MO-CIA calculations, J. Am. Chem. Soc., 1973, 95, 2803–2813 CrossRef CAS PubMed.
- F. D’Amico, M. Saito, F. Bencivenga, M. Marsi, A. Gessini, G. Camisasca, E. Principi, R. Cucini, S. Di Fonzo, A. Battistoni, E. Giangrisostomi and C. Masciovecchio, UV resonant Raman scattering facility at Elettra, Nucl. Instruments Methods Phys. Res. Sect. A Accel. Spectrometers, Detect, Assoc. Equip., 2013, 703, 33–37 CrossRef.
- R. L. McCreery, in Handbook of Vibrational Spectroscopy, ed. P. R. Griffiths, John Wiley & Sons, Ltd, Chichester, UK, 2006 Search PubMed.
- S. P. A. Fodor, R. P. Rava, T. R. Hays and T. G. Spiro, Ultraviolet resonance Raman spectroscopy of the nucleotides with 266-, 240-, 218-, and 200-nm pulsed laser excitation, J. Am. Chem. Soc., 1985, 107, 1520–1529 CrossRef CAS.
- J. M. Benevides, C. Kang and G. J. Thomas, Raman signature of the four-stranded intercalated cytosine motif in crystal and solution structures of DNA deoxycytidylates d(CCCT) and d(C8), Biochemistry, 1996, 35, 5747–5755 CrossRef CAS PubMed.
- I. Noda, Generalized two-dimensional correlation method applicable to infrared, Raman, and other types of spectroscopy, Appl. Spectrosc., 1993, 47, 1329–1336 CrossRef CAS.
- P. Lasch and I. Noda, Two-dimensional correlation spectroscopy (2D-COS) for analysis of spatially resolved vibrational spectra, Appl. Spectrosc., 2019, 73, 359–379 CrossRef CAS PubMed.
- I. Noda, A. E. Dowrey, C. Marcott, G. M. Story and Y. Ozaki, Generalized two-dimensional correlation spectroscopy, Appl. Spectrosc., 2000, 54, 236A–248A CrossRef CAS.
- L. Lannes, P. Young, C. Richter, N. Morgner and H. Schwalbe, Interaction of the N-terminal tandem domains of hnRNP LL with the BCL2 Promoter i-Motif DNA sequence, ChemBioChem, 2017, 18, 2033–2044 CrossRef CAS PubMed.
- N. Iaccarino, M. Cheng, D. Qiu, B. Pagano, J. Amato, A. Di Porzio, J. Zhou, A. Randazzo and J.-L. Mergny, Effects of sequence and base composition on the CD and TDS Profiles of i-DNA, Angew. Chem., Int. Ed., 2021, 60, 10295–10303 CrossRef CAS PubMed.
- H. Susi and J. S. Ard, Planar valence force constants and assignments for pyrimidine derivatives, Spectrochim. Acta, Part A, 1974, 30, 1843–1853 CrossRef.
- H. T. Allawi and J. SantaLucia, Thermodynamics of internal C.T mismatches in DNA, Nucleic Acids Res., 1998, 26, 2694–2701 CrossRef CAS PubMed.
- Y. Li, X. Han, Y. Yan, Y. Cao, X. Xiang, S. Wang, B. Zhao and X. Guo, Label-free detection of tetramolecular i-Motifs by surface-enhanced raman spectroscopy, Anal. Chem., 2018, 90, 2996–3000 CrossRef CAS PubMed.
- A. L. Lieblein, B. Fürtig and H. Schwalbe, Optimizing the kinetics and thermodynamics of DNA i-Motif folding, ChemBioChem, 2013, 14, 1226–1230 CrossRef CAS PubMed.
- M. Garavís, N. Escaja, V. Gabelica, A. Villasante and C. González, Centromeric alpha-satellite DNA adopts dimeric i-Motif structures capped by AT Hoogsteen base pairs, Chem. – Eur. J., 2015, 21, 9816–9824 CrossRef PubMed.
- J. G. Duguid, V. A. Bloomfield, J. M. Benevides and G. J. Thomas, DNA melting investigated by differential scanning calorimetry and Raman spectroscopy, Biophys. J., 1996, 71, 3350–3360 CrossRef CAS PubMed.
- L. Petraccone, B. Pagano and C. Giancola, Studying the effect of crowding and dehydration on DNA G-quadruplexes, Methods, 2012, 57, 76–83 CrossRef CAS PubMed.
- S. Paul, S. S. Hossain and A. Samanta, Insights into the folding pathway of a c-MYC-promoter-based i-Motif DNA in crowded environments at the single-molecule level, J. Phys. Chem. B, 2020, 124, 763–770 CrossRef CAS PubMed.
- S. Nakano, D. Miyoshi and N. Sugimoto, Effects of molecular crowding on the structures, interactions, and functions of nucleic acids, Chem. Rev., 2014, 114, 2733–2758 CrossRef CAS PubMed.
- J. Cui, P. Waltman, V. Le and E. Lewis, The effect of molecular crowding on the stability of human c-MYC promoter sequence I-Motif at neutral pH, Molecules, 2013, 18, 12751–12767 CrossRef CAS PubMed.
Footnote |
| † Electronic supplementary information (ESI) available. See DOI: 10.1039/d2cp00058j |
| This journal is © the Owner Societies 2022 |