 Open Access Article
Creative Commons Attribution 3.0 Unported Licence
Polarisation of water under thermal fields: the effect of the molecular dipole and quadrupole moments†
Aidan
Chapman
 * and
Fernando
Bresme
 *
*
Department of Chemistry, Molecular Sciences Research Hub (MSRH) Imperial College London, London, W12 0BZ, UK. E-mail: aidan.chapman16@imperial.ac.uk; f.bresme@imperial.ac.uk
First published on 30th May 2022
Abstract
The investigation of the behaviour of water under thermal fields is important to understand thermoelectricity of solutions, aqueous suspensions, bioelectric effects or the properties of wet materials under spatially inhomogeneous temperature conditions. Here we discuss the response of bulk water to external thermal fields using non-equilibrium molecular dynamics simulations, and five widely used forcefields: TIP4P/2005, TIP4P/2005f, OPC, SPC/E and TIP3P. These models all show the thermal polarisation (TP) effect in bulk water, namely the build-up of an electrostatic field induced by the temperature gradient. The strength of this effect is ∼0.1–1 mV K−1 at near-standard conditions for all forcefields, supporting the generality of TP. Moreover, all the models predict a temperature inversion of the polarisation field, although the inversion temperatures vary significantly across different models. We rationalise this result by deriving theoretical equations that describe the temperature inversion as a balance of the isobaric thermal expansion, dipole orientation in the thermal field and the ratio of the molecular dipole/quadrupole moments. Lower ratios lead to higher inversion temperatures. Based on our results, we conclude that the accuracy of the forcefields describing the TP effect decreases as, TIP4P/2005 ∼ TIP4P/2005f ∼ OPC > SPC/E > TIP3P. At coexistence conditions, the inversion temperature is expected to be around 400 K. Furthermore, we establish a correlation between the TP inversion temperature and the temperature corresponding to the minimum of the liquid–vapour surface potential of water.
1 Introduction
The Ludwig-Soret (LS)1,2 and Seebeck (Se)3 effects were observed for the first time by applying thermal gradients to aqueous solutions and metals, respectively. These non-equilibrium effects involve couplings with the heat flux that lead to concentration gradients (LS) or electrostatic potential differences (Se). These effects are well understood at the macroscopic level in the context of Non-Equilibrium Thermodynamics theory,4 which provides phenomenological equations to predict the strength of mass separation or electrostatic potential difference with the magnitude of a thermal gradient.The LS and Se effects have provided the theoretical background to develop analytical devices to track the thermophoretic motion of biomolecules,5 and design thermoelectric conversion devices,6 which find applications in the automotive and aerospace industries.7 Recently, a new family of non-equilibrium coupling effects, thermal polarisation (TP), was reported.8. The application of a thermal gradient to water induces a molecular orientation and consequently polarisation and a net electric field, which is directly proportional to the magnitude of the thermal gradient. These fields are potentially strong in nanoscale environments, as very large gradients can be generated with small temperature differences.9 The thermal polarisation and more generally, the thermal orientation effects have been reproduced in theoretical studies of other molecular fluids,10–13 and the importance of this effect has been discussed in the context of quantum fluids,14 thermoelectricity of alkali halide solutions,15 optothermoelectrics,16 colloids and solutions of soft matter systems,17 bioelectric effects,18 or microwave drying of materials.19
Water is the most important solvent on Earth, and therefore a good understanding of its behaviour under thermal gradients is important, particularly in the context of aqueous solutions and biomolecules, where thermal fields induce thermophoretic forces as well as thermoelectric fields.15,20,21 The thermal polarisation of water features a complex behaviour. The thermal polarisation coefficient, STP, is positive at low temperatures. Upon increasing the temperature, the coefficient reverses sign at a specific inversion temperature.22 The change in sign results in a minimum in the thermo-polarisation electrostatic potential, ϕTP, where STP = 0, and the thermal polarisation field cancels. This TP inversion has been observed in the SPC/E and TIP4P/2005 water models.23,24 One can conclude from these analyses that the magnitude of the TP coefficient is ∼0.1–1 mV K−1. The analysis of the limited data available shows that the inversion temperatures predicted by these two forcefields are quite different, while both forcefields show consistently that the inversion point appears when the dipolar and quadrupolar contributions to the TP field cancel.
The importance of quadrupolar contributions in the electrostatic properties of water has been highlighted in studies of the surface potential, χ, of water.25–28 The surface potential for different water forcefields varies between χ = −0.89 and 0.03 V.26,28–31 The temperature dependence of χ for SPC/E water has been investigated in ref. 27, showing dχ/dT ∼ −1 mV K−1. The sign and the magnitude of this derivative is consistent with early experimental data reported by Randles and Schiffrin32 using diluted alkali halide solutions. Interestingly, for SPC/E water χ features a broad minimum between 350 and 425 K, indicating a change in sign in the interfacial electrostatic potential. The minimum in χ emerged from the different temperature dependence of the dipolar (dχP/dT < 0) and quadrupolar contributions (dχQ/dT > 0) to the total surface potential. The rate of change with temperature is also different, and connected in the case of the quadrupole to the change in density from the liquid to the vapour phase, and for the dipole to the orientation of the interfacial water molecules. Later in this work, we draw comparisons between the TP effect and the surface potential of water.
It follows from the discussion above that the magnitude of the quadrupole moment in water has a significant impact both on the interfacial properties and thermal polarisation response of water. More generally, the importance of the quadrupole term in the phase diagram of water has been discussed in ref. 33 and 34. It was suggested that the performance of empirical forcefields can be classified using the dipolar/quadrupolar ratio (μ/QT). Forcefields with ratios corresponding to lengthscales of the order of the O–H intramolecular bond (QT/μ ∼ 0.9572 Å35) predict the phase diagram more accurately. Water models such as TIP3P predict a small ratio, QT/μ ∼ 0.7 Å and overestimate the stability of Ice II.34 One question we address here is whether the TP response can be understood in terms of the ratio QT/μ, and whether this ratio can be used to derive theoretical relations to model the TP effect, and to assess the performance of different forcefields in describing this effect.
In this work we report an investigation of the thermal polarisation response using 5 popular water models: TIP4P/2005,36 TIP4P/2005f,37 SPC/E,38 OPC39 and TIP3P.40 For all these models, we compute the temperature inversion line on the temperature-density plane. Further, we interpret the non-equilibrium response obtained with these models using the μ/QT ratio, and derive equations that describe the TP inversion temperature in terms of the thermal expansion coefficient and dipolar/quadrupolar ratio of the water molecule.
2 Methods
The TP effect emerges from the coupling of heat and polarization fluxes. The thermopolarisation coefficient STP8,24 quantifies the strength of the coupling, | (1) |
 the temperature gradient in the direction of the heat flux. Since we are interested in dipolar and quadrupolar contributions, we define the corresponding dipolar (STP,P) and quadrupolar (STP,Q) TP coefficients,
 | (2) |
 | (3) |
We calculated the TP of water using four empirical rigid point charge (PC) models, TIP4P/2005,36 SPC/E,38 TIP3P40 and the OPC model.39 All the models have three charged sites and a Lennard-Jones (LJ) pair potential acting between the oxygen atoms only. In the SPC/E and TIP3P models, the negative charge is located on the oxygen atom, whereas the TIP4P/2005 and OPC models include an additional massless (‘dummy’) atom that holds the negative charge. This dummy atom is located at a distance, dOM from the oxygen along the HOH angle bisector. In all four models, the positive charges are located on the hydrogen atoms and the geometry of the molecule is held rigid throughout the simulation. We performed additional simulations with the TIP4/2005f flexible model for selected thermodynamic states. This model allows for changes in the molecular geometry and, therefore, the electrostatic moments. We compile in Table 1 the parameters for the models discussed above, as well as the dipole–quadrupole ratio, which varies significantly across the four models investigated here.
| Model | d OH/Å | θ HOH/° | d OM/Å | q −/e | q +/e | ε OO/kcal mol−1 | σ OO/Å | μ/QT/Å |
|---|---|---|---|---|---|---|---|---|
| TIP4P/200536 | 0.9572 | 104.52 | 0.1546 | −1.1128 | 0.5564 | 0.1852 | 3.1589 | 1.0036 |
| SPC/E38 | 1.0000 | 109.47 | — | −0.8476 | 0.4238 | 0.1553 | 3.1660 | 1.1547 |
| TIP3P40 | 0.9572 | 104.52 | — | −0.8340 | 0.4170 | 0.1521 | 3.1507 | 1.3634 |
| OPC39 | 0.8724 | 103.60 | 0.1594 | −1.3582 | 0.6791 | 0.2128 | 3.16655 | 1.0782 |
| TIP4P/2005f37 | 0.9664 | 104.79 | 0.15555 | −1.1128 | 0.5564 | 0.1852 | 3.1644 | 0.9876 |
The coulombic interactions were calculated using the particle-particle particle-mesh (PPPM)41 as implemented in the molecular dynamics package LAMMPS,42 with a 12 Å cut-off and a relative target error of 1 × 10⁻⁵ in the forces. The LJ potential cut-offs were set to 12 Å. Constraints on the angles and bonds were applied using the RATTLE algorithm.43
The temperature gradients, needed to induce the TP effect, were generated using Non-Equilibrium Molecular Dynamics Simulations (NEMD). Cuboidal simulation boxes were created with dimensions (Lx, Ly, Lz) = (7a0, 7a0, 35a0), where  is the appropriate fcc lattice constant, which is chosen to give the desired average mass density, ρ, of water (with a molar mass of MH2O = 18.015 g mol−1) in the simulation box (a0 ≈ 4.93 Å for 0.997 g cm−3). Two thermostatting regions of 5 Å thickness in the z direction were set up, one (hot thermostat) in the middle of the box and the other (cold thermostat) at the edge of the simulation box in the z direction. The thermostat at the edge was split evenly across the periodic boundary to ensure symmetry in the simulation set up across the z axis. Fig. 1 shows a snapshot of the simulation setup employed in this work.
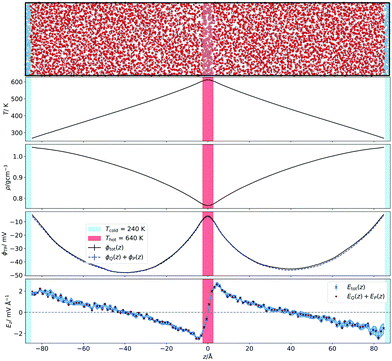 | ||
| Fig. 1 (Top panel) Snapshot of the simulation box illustrating the set-up employed to perform the non-equilibrium simulations. Water box graphic generated with OVITO.44 (Bottom panels) Corresponding temperature, density and electrostatic potential and field profiles. For the field we have represented the total result from the integral of the charge density and the field obtain by adding the dipolar and quadrupolar contributions to the field. | ||
Starting from an equilibrated system of the desired average temperature and density, a non-equilibrium steady state was established by applying the hot (central) thermostat at +200 K above the target average temperature and the cold (edge) thermostat at −200 K below the target temperature, for at least 1 ns (with a 2 fs time step). For the box sizes employed here, this setup results in thermal gradients on the order of ±4 K Å−1. Thermostatting in these regions was performed using the canonical sampling velocity rescaling (CSVR) thermostat.45 The thermostatting was applied every step, followed by resetting of the centre of mass momentum of the box. Production runs were performed using five statistically independent replicas, each for at least 2 ns. The replicas were generated from the same steady state configurations, however, using different random seeds for the CSVR thermostats to ensure independent trajectories.
All profiles (properties as a function of the box z coordinate) were computed by averaging with bins of 0.25 Å in the z direction, resulting in between 300 and 500 bins in each side of the simulation box, depending on the density. In the figures shown below the properties have been ‘rebinned’ by averaging points within larger 1.25 Å bins, reducing the number of points by a factor of 5. In some cases, additional smoothing applying a rolling average of 5 neighbouring bins was used. The local thermodynamic properties were calculated “on-the-fly” using LAMMPS, whereas the electrostatic properties where post-processed from trajectories using in house Python scripts46 that use the MDAnalysis package.47,48
The simulations of the flexible TIP4P/2005f model were performed with Gromacs2021.349 compiled with GPU support, and the thermal gradients were generated using the boundary method introduced in ref. 13 and 50. A typical simulation consisted of 2371 bulk water molecules, 63 and 66 water molecules for the hot and cold thermostats in a simulation box of dimensions (Lx, Ly, Lz) = (24.66, 24.66, 123.29) Å. The time step was set at 0.2 fs, and at 0.1 fs for high temperatures (T ≈ 500 K). Seven thermodynamic average states were simulated, as shown in Table A.4 (ESI†).
2.1 Simulations of the water–vapour interface
We also performed equilibrium simulations of the water liquid vapour interface. As discussed in the introduction, the interfacial electrostatic potential of water features a minimum, which emerges from the balance of dipolar and quadrupolar terms. These terms change due to rapid changes in the density of the fluids. We are interested in investigating whether there is a correlation between the minimum in the interfacial potential and the inversion temperature arising from the thermal polarization effect. In both cases, the balance of dipole/quadrupolar contributions defines the existence of minima in the electrostatic potentials. This comparison motivates our analysis of water–vapour interfaces.Initially, a simulation box with dimensions of (Lx, Ly, Lz) = (24.64, 24.64, 98.56) Å was created with 2000 water molecules at a density of 1 g cm−3 with the molecules arranged on an FCC lattice. The system was equilibrated at 300 K. Then, the box was slowly elongated symmetrically in the z direction (the longest dimension) to a length of Lz = 164.26 Å, whilst constantly thermostatting to 300 K, giving an average box density of 0.6 g cm−3. For the OPC model39 a longer box was used corresponding to an average density of 0.5 g cm−3. For the TIP3P model, the last configuration from a TIP4P/2005 production run was used (by removing the dummy site and changing the charges to be those of TIP3P) and equilibrated for at least 1 ns. Production runs were performed for each model at temperatures in 50 K and in some cases 25 K intervals from 300 K, until the interface disappeared. A timestep of 1 fs was used for the TIP4P/2005 and SPC/E models, whereas a timestep of 2 fs was used for the OPC and TIP3P models (Fig. 2).
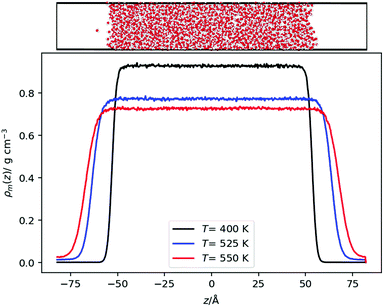 | ||
| Fig. 2 (Top) Snapshot of a liquid–vapour interface showing the simulation setup. The snapshot was generated with OVITO44 (Bottom) Density profiles for the TIP4P/2005 model at different temperatures. | ||
2.2 Calculation of electrostatics
The electrostatic potential profiles for both NEMD and equilibrium interfacial simulations, were calculated by integrating the 1D charge densities, following Poisson's equation, | (4) |
 | (5) |
 | (6) |
 | (7) |
The dipole and (traced) quadrupole contributions to the potential and electric fields are given by,22,24,51
 | (8) |
 | (9) |
 | (10) |
We note that the calculation of the quadrupole moment involves some ambiguity in the choice of the reference coordinate, zm, since the quadrupole depends on the choice of that reference. The optimal choice is the one that minimises the contribution of the higher order multipole moments and corresponding contributions to the electric field. As we show in Section 3.1 and Fig. 1, the choice of zm employed here for the negative charge results in a good agreement between the total electric field and sum of the dipolar and quadrupolar contributions, hence justifying our approach. We also note that for all electric fields, and the corresponding potentials presented in this work were obtained from the average charge densities, as stated in eqn (5). We enforced that the electric field at either end of the simulation box is zero, as required for a neutral system, (see ESI,† Section A.1).
3 Results and discussion
3.1 Thermopolarisation of water
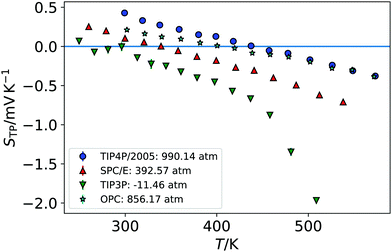
We show in Fig. 1 the electrostatic fields generated by the thermal gradient for TIP4P/2005 water with a target average temperature and density of 440 K and 0.94 g cm−3. We show in the same figure the corresponding temperature profile, which is not linear, as expected, since the thermal conductivity varies as the non-equilibrium system traverses through regions with different density and temperature. Figure A.5 (ESI†) compares the equations of state from NEMD simulations to those from equilibrium NpT simulations, showing that local equilibrium holds well for the thermodynamic states studied. The results on Fig. 1 shows a clear inversion in the electric field in both sides of the simulation box, at about ±40 Å. The antisymmetry of the electrostatic fields around the hot thermostat emerges from the reversal of the temperature gradient and heat flux directions in the two halves of the simulation box. The crossing from positive to negative values of the electrostatic fields indicate an inversion in the thermopolarisation effect and a minimum in the corresponding thermopolarisation potential (see fourth panel in Fig. 1). Fig. 3 shows the thermal polarisation coefficient obtained from eqn (1), for the four rigid models investigated in this work at specific thermodynamic conditions. The main conclusion from this analysis is that the thermal polarisation inversion demonstrated in ref. 22 for SPC/E and in ref. 24 for TIP4P-2005, is a general physical phenomenon reproduced using fairly different water models. The large negative coefficient seen for the TIP3P model here is a consequence of the enhancement of STP when approaching the critical point (578 K for TIP3P52) previously observed in the TIP4P/2005 model.24 The cross comparison of the data in Fig. 3 also indicates that the inversion temperature predicted by the models differs significantly. Hence, it is important to disentangle the role of the microscopic electrostatic field contributions to STP and establish which of these water models is expected to provide the most accurate prediction for real water. With this purpose we performed an extensive analysis consisting of a total of 66 thermodynamic states (TIP4P/2005 – 21, TIP3P – 18, SPC/E – 18, OPC – 9 states, each with 4-10 repeats) independent simulations, each corresponding to a different isobar. The full range of states as well as summary data can be seen in the Table A.1 (ESI†).
Fig. 4 shows the equations of state for the different models, covering both subcritical and supercritical states. We have colour-coded the isobars according to the magnitude and sign of the thermopolarisation coefficient. The results for TIP4P/2005 agree with the data reported in ref. 24, showing an inversion region. Here instead we are able to resolve the TP inversion line precisely, by performing simulations targeting states where the inversion takes place in a single simulation (see ESI,† Section A.2 for further details on our procedure). Our results do show a clear inversion line for SPC/E, confirming the earlier predictions of inversion for this model,22 but again providing a precise location for the orientation of the field as a function of temperature and density (see Fig. 4). We do also observe an inversion line in OPC, and TIP3P, although for the latter model, the temperature and density dependence is very different to that observed in TIP4P/2005, SPC/E and OPC. Because the inversion of TIP3P water appears at low temperatures, we checked that our orientation results were not affected by a slowing of the dynamics of the liquid. We show in Fig. A.6 in the ESI,† the results for the orientation 〈cos![[thin space (1/6-em)]](https://www.rsc.org/images/entities/char_2009.gif) θ〉 along the simulation box for five independent trajectories using the TIP3P model. The profiles above 225 K are smooth in all cases. Hence, we conclude that the orientation and the polarization are not affected by a dynamic slowing down at low temperatures. However, we observe strong oscillations at low temperature, which we attach to the onset of a glass transition, with the fluid dynamics slowing down significantly. The dynamics slowing down appears at temperatures well below those relevant to the inversion computations presented here, and therefore it does not affect our TIP3P thermal polarization coefficients.
θ〉 along the simulation box for five independent trajectories using the TIP3P model. The profiles above 225 K are smooth in all cases. Hence, we conclude that the orientation and the polarization are not affected by a dynamic slowing down at low temperatures. However, we observe strong oscillations at low temperature, which we attach to the onset of a glass transition, with the fluid dynamics slowing down significantly. The dynamics slowing down appears at temperatures well below those relevant to the inversion computations presented here, and therefore it does not affect our TIP3P thermal polarization coefficients.
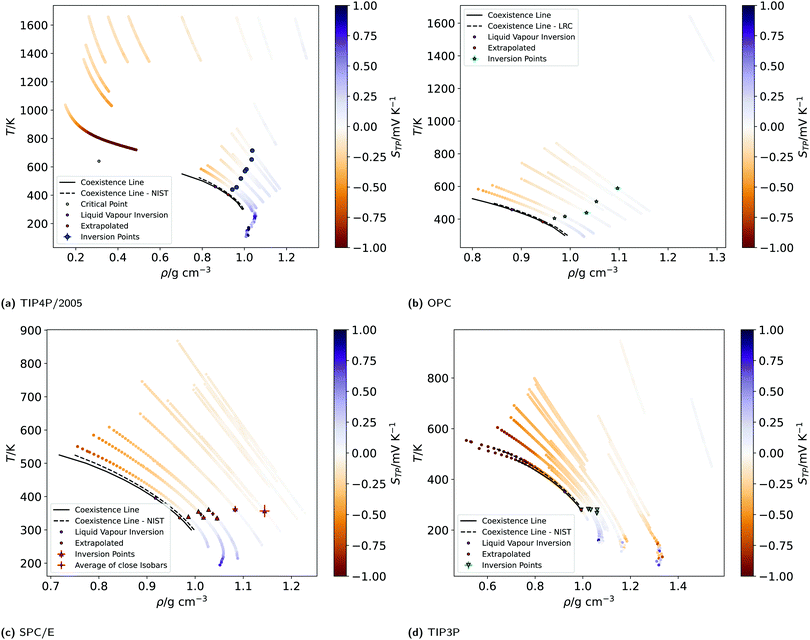 | ||
| Fig. 4 (a)–(d) Equations of state (EOS) of the isobars of the four models simulated. The EOS were generated by plotting the non-equilibrium local temperature profiles against the local mass density profiles, after re-binning to 1.25 Å, folding the profiles (averaging the two halves of the simulation box) and averaging over at least 4–10 repeats. The isobars are coloured according to the value of the thermopolarisation coefficient, STP, as indicated by the colour bars. The colour bars are set to range between −1 and 1 mV K−1 (values outside of this range have the same colour as the nearest edge). The large points indicate the temperatures and densities of inversion found from the data re-binned to 1.25 Å. The black dotted line represents the liquid–vapour coexistence line for the corresponding water model, as reported in the NIST standard reference simulation database.53 The black solid lines are coexistence lines computed from LV simulations in this work (see Section A.10, ESI†) Due to being very close in pressure, two pairs of SPC/E isobars have been averaged to give the diamond points. | ||
We tested the dependence of the thermopolarisation coefficient on the applied temperature gradient, by performing additional simulations of the 400 K, 0.94 g cm−3 state, with lower thermal gradients of 1.14 K Å−1 and 2.27 K Å−1. The comparison of the STP coefficients obtained with different thermal gradients agree with each other within the uncertainty of our computations, hence confirming the results presented in Fig. 4, for a gradient of ∇T = 4.54 K Å−1 are within the linear response (see Fig. A.3, ESI†).
The results presented above, using different rigid water models, agree on the prediction of thermal polarisation and a thermal polarisation inversion line. While the magnitude of the range of the polarisation fields is similar, −0.6 … +0.6 mV K−1, for all the forcefields, the predicted inversion temperatures are rather different, particularly in the TIP3P as compared with the other three water models. This is better shown in Fig. 5, which represents the inversion lines on the density/temperature plane. The inversion temperatures, or temperatures corresponding to a minimum in the TP electrostatic potential, decrease in the order TIP4P/2005 ∼ TIP3P/2005f > OPC > SPC/E > TIP3P, the same order as the QT/μ ratio. The slope of the line of inversion points in the T-ρ plane does also depend strongly on the model employed. Fig. 5 shows that in addition to changes in the absolute value of the inversion temperature, the dependence on the temperature/density plane is rather different too. In most models the inversion temperature increases with density, while TIP3P is an exception, with the temperature decreasing with increasing density. Obtaining the TP coefficient for TIP3P entails additional challenges. As the inversion temperatures are much lower, the sampling is poorer than in other models, due to significant slow down of the dynamics. Hence, in this model we were able to calculate accurately fewer points than in the other three models.
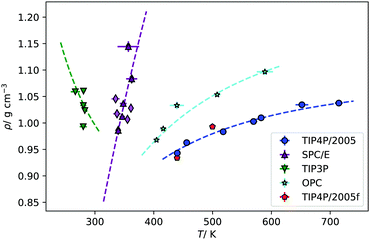 | ||
| Fig. 5 Fitting of the simulated points of inversion to eqn (11), for each of water model. The fits have been weighted by one over the standard error of the density data. The red points are the inversion points found for the TIP4P/2005f model. | ||
For future reference, we have fitted our inversion lines to the function,
 | (11) |
| A/104 K2 | B/10−1 | |
|---|---|---|
| TIP4P/2005 | −2.8064 | 0.9180 |
| SPC/E | −10.2174 | 8.7185 |
| TIP3P | 2.4207 | −2.7305 |
| OPC | −3.8486 | 2.0391 |
An interesting property of eqn (11) functional form is that it suggests the inversion line does not disappear, but the regions of different signs of STP persist into high temperatures, with the density of inversion, tending to a constant value, ρT→∞ = ρ°eB, at infinite temperature. To test this prediction, we performed additional simulations for the TIP4P/2005 water model at high temperatures (Tave = 1500 K), with varying average densities. Interpolating the data set for these states and plotting the contour where STP = 0 (Fig. 6), we observe an inversion that depends little on density. The oscillations are the result of our fitting approach to extract the inversion temperature. The independence of the inversion with density agrees with the high temperature predicted by our equation ρT→∞ = ρ°eB, namely at high temperatures the density corresponding to the inversion point reaches a limiting value.
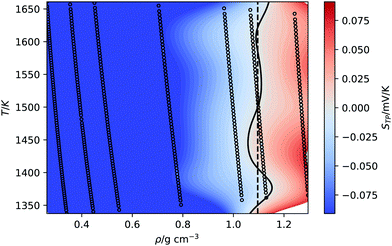 | ||
| Fig. 6 Equations of state for the TIP4P/2005 at high average temperature (1500 K). The background is coloured according to the thermopolarisation coefficient, STP, which is interpolated between isobars with a smoothed bivariate cubic spline using SciPy.54 The solid curved line represents the contour at which the interpolated value of the thermopolarisation coefficient features inversion, STP = 0. The dotted vertical line is the density of inversion at infinite temperature predicted by eqn (11). | ||
The flexible version of the TIP4P/2005 model, does also feature the thermal polarisation effect. The thermal polarisation coefficient is of the order of those obtained with the rigid model (see Fig. 5, Table A.4 and Fig. A.10, ESI†), and the inversion temperatures similar to the rigid model. The thermal conductivities of TIP4P/2005f (see Table A.4, ESI†) are also similar to the values obtained with the rigid version.50 We do not find significant changes in the geometry of the molecule with temperature (see Table A.4, ESI†).
The results presented above support the general existence of the TP effect in water. At the same time, they reveal a significant dependence of the TP effect with the model. In the following, we discuss the microscopic origin of the TP inversion effect for these models. This information should be helpful to establish which water models provide a better representation of the thermal polarisation effect in water.
3.2 Understanding the inversion of the thermal polarisation
In a previous work, the TP inversion temperature was rationalised in terms of a balance of dipolar and quadrupolar contributions Armstrong and Bresme,22 which feature different dependencies with temperature and opposite signs. These two contributions define the total thermal polarisation field, which becomes zero when the contributions cancel exactly. We note that this cancellation is specific of water. Other polar molecules, such as acetonitrile, do also exhibit thermal polarisation but no temperature inversion in the liquid region, as the dipolar contribution is the dominant in a wide range of temperatures and densities.13A phenomenological equation representing the thermopolarisation field, Ephen., in terms of dipolar and quadrupolar contributions, was proposed in ref. 22,
 | (12) |
 | (13) |
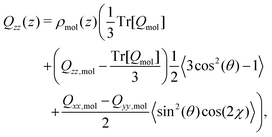 | (14) |
Yang et al.26 showed that the orientations of the water molecules at the water liquid–vapour interface resulted in the second and third terms in (14) being significantly smaller than unity. Hence, the quadrupolar density is given to a very good approximation as,
 | (15) |
 | (16) |
 | (17) |
 | (18) |
Combining eqn (18) and (17) gives,
 | (19) |
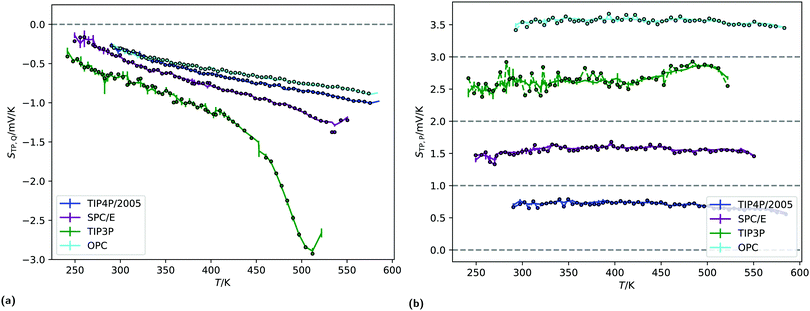 | ||
Fig. 7 (a) The quadrupolar contribution to the thermopolarisation coefficient for the lowest pressure isobar showing TP inversion for each model. The points represent the approximate form given in eqn (19). (b) Dipolar contribution to the thermopolarisation coefficient for the lowest pressure isobars, showing TP inversion for each rigid model. The points and dashed lines show the contribution to the field given by eqn (25), with the approximation that 〈cos![[thin space (1/6-em)]](https://www.rsc.org/images/entities/char_2009.gif) θ〉ρ(z) ≈ 〈cos θ〉ρ(z) ≈ 〈cos![[thin space (1/6-em)]](https://www.rsc.org/images/entities/char_2009.gif) θ〉 (z). Each model has been offset successively by 1 mV K−1 in the y-axis, with the horizontal dashed lines indicating 0 mV K−1. θ〉 (z). Each model has been offset successively by 1 mV K−1 in the y-axis, with the horizontal dashed lines indicating 0 mV K−1. | ||
Pz(z) = |μ|〈cos![[thin space (1/6-em)]](https://www.rsc.org/images/entities/char_2009.gif) θ〉ρ(z)ρmol(z), θ〉ρ(z)ρmol(z), | (20) |
 is the angle between the dipole moment vector and the z axis (direction of the heat flux) and,
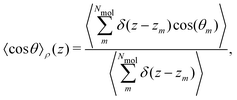 | (21) |
 | (22) |
![[thin space (1/6-em)]](https://www.rsc.org/images/entities/char_2009.gif) θ〉ρ(z) ≈ 〈cos
θ〉ρ(z) ≈ 〈cos![[thin space (1/6-em)]](https://www.rsc.org/images/entities/char_2009.gif) θ〉 (z) is a good approximation, which we use in eqn (26). The unweighted average, 〈cos
θ〉 (z) is a good approximation, which we use in eqn (26). The unweighted average, 〈cos![[thin space (1/6-em)]](https://www.rsc.org/images/entities/char_2009.gif) θ〉 (z), is calculated and used in the following equations, where using 〈cos
θ〉 (z), is calculated and used in the following equations, where using 〈cos![[thin space (1/6-em)]](https://www.rsc.org/images/entities/char_2009.gif) θ〉 (z)ρ would be exact.
θ〉 (z)ρ would be exact.
Integrating the contribution to the density, the dipole contribution to the electric field of the system is,
 | (23) |
 | (24) |
 | (25) |
![[thin space (1/6-em)]](https://www.rsc.org/images/entities/char_2009.gif) θ〉ρ(z) ≈ 〈cos
θ〉ρ(z) ≈ 〈cos![[thin space (1/6-em)]](https://www.rsc.org/images/entities/char_2009.gif) θ〉 (z).
θ〉 (z).
Partitioning the contributions to the electric field into the quadrupole and dipole contributions as we have in eqn (17) and (25), respectively, reveals that there are both “isotropic” and orientational contributions to the electric field. These can be identified as the quadrupolar and dipolar parts, respectively, because the former depends only on the local thermodynamic state and temperature gradient, whereas the latter shows explicit dependence on the average orientation of molecules, as well as the local thermodynamic state.
 | (26) |
In eqn (26) we only include the dipole and quadrupolar terms, and higher order terms are negligible. We recall that our simulations show that this approximation is valid, when the appropriate reference point zm in eqn (9) is used. See Fig. 1 for a test of this notion, where the electrostatic potential is described in terms of dipolar and quadrupolar terms only.
In this work, we only found the STP,P to be positive, and thus the ratio 〈cos![[thin space (1/6-em)]](https://www.rsc.org/images/entities/char_2009.gif) θ〉/∇T < 0. The direction of −∇T is the direction of the heat flux. This shows that the dipole moment vector (defined from the negative to the positive charges) points in the same direction as the heat flux, and such the hydrogens have the tendency to point to the cold thermostats and the oxygens towards the hot thermostats.
θ〉/∇T < 0. The direction of −∇T is the direction of the heat flux. This shows that the dipole moment vector (defined from the negative to the positive charges) points in the same direction as the heat flux, and such the hydrogens have the tendency to point to the cold thermostats and the oxygens towards the hot thermostats.
The second term in (26), corresponding to STP,Q, is always negative in regions where thermal expansion is positive, that is above the temperatures of maximum density. Below this temperature inversion in the TP field is not possible and the overall field must be strictly positive. Whether inversion occurs at the temperatures of maximum density depends on the strength of the orientational (dipolar) contribution at these points.
From eqn (26), a criterion for inversion of the electric field with respect to the temperature gradient can be found (i.e. by setting STP = 0),
 | (27) |
Eqn (27) can be rearranged as follows,
 | (28) |
![[thin space (1/6-em)]](https://www.rsc.org/images/entities/char_2009.gif) θ〉ρ(zinv)/α (zinv)∇T (zinv) + Tr[Q]/3μ = 0. This idea is illustrated in Fig. 8 for the TIP4P/2005 model, where it can be seen that the values for inversion found for this method are very close to the temperatures of inversion calculated by fitting the electrostatic potential to a quadratic equation, as explained in the A.2 (ESI†).
θ〉ρ(zinv)/α (zinv)∇T (zinv) + Tr[Q]/3μ = 0. This idea is illustrated in Fig. 8 for the TIP4P/2005 model, where it can be seen that the values for inversion found for this method are very close to the temperatures of inversion calculated by fitting the electrostatic potential to a quadratic equation, as explained in the A.2 (ESI†).
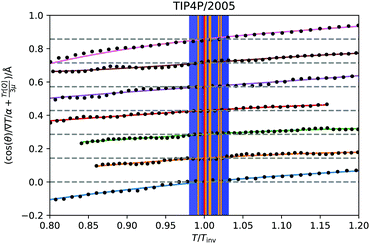 | ||
Fig. 8 Test of eqn (28) for the TIP4P/2005 states that showed inversion, indicated by the isobars with markers on in Fig. 4a. The solid curves are spline fittings used to find the roots where the inversion occurs. The temperature axis is scaled relative to the temperature of inversion found by this criterion. The approximation 〈cos![[thin space (1/6-em)]](https://www.rsc.org/images/entities/char_2009.gif) θ〉ρ(z) ≈ 〈cos θ〉ρ(z) ≈ 〈cos![[thin space (1/6-em)]](https://www.rsc.org/images/entities/char_2009.gif) θ〉 (z) has been used. The orange vertical lines are the temperatures of inversion found by the quadratic fittings, with the blue shaded regions being the corresponding uncertainty. The dotted grey lines indicate 〈cos θ〉 (z) has been used. The orange vertical lines are the temperatures of inversion found by the quadratic fittings, with the blue shaded regions being the corresponding uncertainty. The dotted grey lines indicate 〈cos![[thin space (1/6-em)]](https://www.rsc.org/images/entities/char_2009.gif) θ〉ρ(zinv)/α (zinv)∇T (zinv) + Tr[Q]/3μ = 0 for each state. The lines for each state have been shifted upwards along the y-axis for visual clarity. θ〉ρ(zinv)/α (zinv)∇T (zinv) + Tr[Q]/3μ = 0 for each state. The lines for each state have been shifted upwards along the y-axis for visual clarity. | ||
3.3 Surface potential of the liquid–vapour interface
We have shown above that the inversion temperature of the thermal polarisation effect is a general physical phenomenon observed in different water models. Our results clearly show a significant variability in the inversion temperature. The inversion temperature denotes a minimum in the electrostatic potential, which should also be observed at coexistence conditions. At coexistence a liquid-interface forms, giving rise to an interfacial electrostatic potential, which emerges from the reordering of the water molecules at the interface. Interestingly, minima in this interfacial electrostatic potential were reported in simulation studies.27 The minimum appears as a result of the different dependencies of dipolar and quadrupolar terms, hence a situation reminiscent of the underlying physics observed in the inversion of the thermal polarisation discussed above.To analyse correlations between the inversion of the thermal polarisation and minima in the interfacial electrostatic potential, we performed equilibrium simulations of liquid slabs and computed the corresponding surface potential for the four rigid water models investigated in this work. The surface potential for the liquid vapour (LV) interface for each temperature (see Section 2.1), was computed by averaging the potential profiles from 5 independent simulations. The potential drop across the interface defines the surface potential for each temperature (see Fig. 9a). For all four models, we used 25 Å either side of the centre of the simulation box for averaging, because the potential was sufficiently constant in this region. This procedure was performed for each replica separately and the result was averaged afterwards. Because the potential profiles have been computed by integrating from the left sides of simulation boxes, deep in the vapour phase, these potentials are already relative to the vapour phase.
Fig. 9b shows the average surface potentials for each water model as a function of temperature. Each model has negative values of the surface potential of the order of ∼0.5 V and all show a clear minimum. The location of this minimum depends on the model, shifting to lower temperatures for the models with large dipole to quadrupole ratio. The temperature of the minimum surface potential can be clearly seen by looking at the crossing of the temperature derivative of ϕlv at zero (Fig. 9c). Numerical values for this temperature were found by interpolating the temperature derivative of the potential with cubic splines and finding the analytical root. This was repeated for each of the five replicas separately, then the results were averaged and the corresponding standard deviations used to calculate error bars.
Fig. 9b shows the sum of the two leading contributions to the surface potential multipole expansion (the dipole and the quadrupole moments), showing good agreement between the potentials calculated from the overall charge distribution and from the multipole moments. The surface potentials presented in Fig. 9b are consistent with previous results using classical point charge forcefields.27,28 Similar values can be obtained with ab initio calculations, providing care is taken to remove contributions from the internal charge distribution of the molecules.30,56 The quadratic variance of the surface potential with temperature seen in Fig. 9b has previously been reported by Sokhan.27 The location of the SPC/E model minimum calculated here (395.1 ± 11.7 K) is close to the results presented in that work. The gradient of the potential with respect to temperature at 300 K is also in line with the values reported by Sokhan and Tildesley,27 as well as with experimental works.32
3.4 Comparing inversion between interfacial and NEMD systems
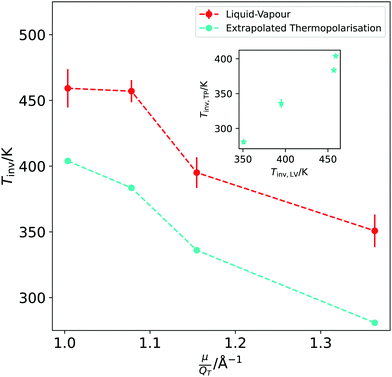
We have established that the temperature of inversion in both the thermopolarisation and LV surface potential depend strongly on the water model used. We show in Fig. 10-inset a correlation plot that represents the temperatures of minimum surface potential vs the inversion temperature for thermal polarisation along the coexistence line. The inversion temperature at coexistence was obtained by extrapolating our NEMD data to the coexistence line. For the SPC/E, TIP4P/2005 and OPC models the eqn (11) was used (see Fig. 5), however for the TIP3P model, a simple linear extrapolation of inversion points to the coexistence line was used. Fig. 10 clearly shows a correlation between both inversion temperatures (or minimum temperatures if the electrostatic surface potential is considered), with TIP3P showing consistently lower and TIP4P/2005 higher inversion temperatures. This result indicates a common origin on the temperature ordering observed for both surface potential and thermal polarisation potential minima. The ordering observed here is proportional to the dipole–quadrupole ratio, introduced earlier in ref. 52 to assess the accuracy of water models in predicting coexistence phase diagrams. This ratio is given by μ/QT, where QT is not the trace of the molecular quadrupole moment, but it is defined by,33,34,39 | (29) |
The analyses of the TP and surface potential temperatures in terms of the dipole–quadrupole ratio can be used to predict what models are expected to provide a more accurate prediction of the thermal polarisation of real water. It has been shown that the most accurate models TIP4P/2005 and OPC,39,52 that feature the lowest μ/QT ratios predict thermophysical properties in better agreement with experiments. Eqn (28) shows that the inversion of the TP effect depends on this ratio. Moreover, the inversion condition includes the thermal expansion coefficient. Based on eqn (29) we expect that the TIP4P/2005 and OPC will predict inversion temperatures closer to the experimental one. This is backed up by their superior performance predicting the thermal expansion. At 300 K and 1 atm the TIP4P/2005 and OPC model predict α = 2.8 × 10⁻⁴ K−1![[thin space (1/6-em)]](https://www.rsc.org/images/entities/char_2009.gif) 36 and 2.7 × 10⁻⁴ K−1,39 respectively, which compare favourably to the experimental value 2.56 × 10⁻⁴ K−1.57 In contrast, at the same conditions, the SPC/E58 and TIP3P58 predict 5.0 × 10⁻⁴ K−1 and 9.2 × 10⁻⁴K−1, respectively, showing significant deviations from the experimental data.
36 and 2.7 × 10⁻⁴ K−1,39 respectively, which compare favourably to the experimental value 2.56 × 10⁻⁴ K−1.57 In contrast, at the same conditions, the SPC/E58 and TIP3P58 predict 5.0 × 10⁻⁴ K−1 and 9.2 × 10⁻⁴K−1, respectively, showing significant deviations from the experimental data.
4 Conclusions
We have investigated the thermal polarisation of water induced by the application of a thermal gradient. We proved the generality of the thermal polarisation effect by reproducing this physical effect in five different water models, widely used to investigate the properties of water and solutions: TIP4P/2005, TIP4P/2005f, OPC, SPC/E and TIP3P. The models predict similar strengths in the TP effect, with thermal polarisation coefficients of the order of 10−4 V K−1 at standard conditions. Consistent with previous studies, we observe an inversion of the TP field of the TIP4P/2005 and SPC/E models with temperature. We have reported the TP inversion temperature of the TIP4P/2005f, OPC and TIP3P models for the first time. While all the models predict the primary physical behaviour, we found significant variability in the inversion temperatures, with the TIP4P/2005 (rigid and flexible) models predicting the highest temperatures and TIP3P the lowest.We have derived an equation that rationalises the different results obtained with different water models. The equation contains three fundamental quantities: the molecular orientation of the water dipole with respect to the heat flux, the isobaric thermal expansion and the dipole/quadrupole ratio:
We have also demonstrated a correlation between the temperature defining the minimum of the liquid–vapour surface potential of water and the TP inversion temperature. Both temperatures feature similar dependencies with the dipole/quadrupole ratio, with higher temperatures for lower ratios.
Guiding future experiments requires an assessment of the performance of the different models in predicting the thermal polarisation effect of water. Our theoretical analysis highlights the important role of the dipole/quadrupole ratio in defining the TP inversion. Incidentally, it has been shown in previous studies that this ratio can be used to assess the accuracy of a forcefield in predicting the thermophysical properties of water. We conclude that the accuracy in predicting the TP of water decreases as TIP4P/2005 ∼ TIP4P/2005f ∼ OPC > SPC/E > TIP3P. We note that most of the models investigated here are rigid and include polarization effects effectively. We showed that the TIP4P/2005 flexible model, which allows for dipolar fluctuations, predicts results very close to those obtained with the TIP4P/2005 rigid model. It would be of interest to extend our studies to polarizable water models, which should allow additional degrees of freedom connected to e.g. charge fluctuations.
Comparing the temperature dependence of the TP effect and the surface potential reveals a correlation that might inspire future experiments aimed at quantifying the thermal polarisation of water. Spectroscopy techniques are well-established approaches to interrogate the orientation of water molecules at interfaces,59–61 and could offer a sensitive probe to analyse the behaviour of water in the anisotropic environment of a thermal field, which leads ultimately to the thermal polarisation effect and the build-up of the thermally induced electrostatic field.
Conflicts of interest
There are no conflicts to declare.Acknowledgements
We thank the Leverhulme Trust (UK grant RPG-2018-384) for financial support, the Imperial College RCS High Performance Computing facility and the UK Materials and Molecular Modelling Hub for computational resources partially funded by the EPSRC (EP/P020194/1 and EP/T022213/1). AC thanks the EPSRC and the Imperial College of London Department of Chemistry for his DTP studentship funding (Project Ref. 2438823).References
- C. Ludwig, Sitzber. Akad. Wiss. Wien, Math.-Naturw. Kl, 1856, 20, 539 Search PubMed.
- C. Soret, Arch. Sci. Phys. Nat., 1879, 2, 48–61 Search PubMed.
- T. J. Seebeck, Ann. Phys., 1826, 82, 253–286 CrossRef.
- S. R. de Groot and P. Mazur, Non-equilibrium Thermodynamics, Dover Publications, 1984 Search PubMed.
- C. J. Wienken, P. Baaske, U. Rothbauer, D. Braun and S. Duhr, Nat. Commun., 2010, 1, 100 CrossRef PubMed.
- G. J. Snyder and E. S. Toberer, Nat. Mater., 2008, 7, 105–114 CrossRef CAS PubMed.
- T. M. Tritt, Annu. Rev. Mater. Res., 2011, 41, 433–448 CrossRef CAS.
- F. Bresme, A. Lervik, D. Bedeaux and S. Kjelstrup, Phys. Rev. Lett., 2008, 101, 020602 CrossRef PubMed.
- A. O. Govorov, W. Zhang, T. Skeini, H. Richardson, J. Lee and N. A. Kotov, Nanoscale Res. Lett., 2006, 1, 84–90 CrossRef.
- F. Römer, F. Bresme, J. Muscatello, D. Bedeaux and J. M. Rubí, Phys. Rev. Lett., 2012, 108, 105901 CrossRef PubMed.
- A. Gardin and A. Ferrarini, Phys. Chem. Chem. Phys., 2019, 21, 104–113 RSC.
- P. Wirnsberger, D. Fijan, R. A. Lightwood, A. Šarić, C. Dellago and D. Frenkel, Proc. Natl. Acad. Sci. U. S. A., 2017, 114, 4911–4914 CrossRef CAS PubMed.
- O. R. Gittus, P. Albella and F. Bresme, J. Chem. Phys., 2020, 153, 204503 CrossRef CAS PubMed.
- K. Abe and K. Hyeon-Deuk, J. Phys. Chem. Lett., 2017, 8, 3595–3600 CrossRef CAS PubMed.
- S. Di Lecce and F. Bresme, J. Phys. Chem. B, 2018, 122, 1662–1668 CrossRef CAS PubMed.
- Z. Chen, P. S. Kollipara, H. Ding, A. Pughazhendi and Y. Zheng, Langmuir, 2021, 37, 1315–1336 CrossRef CAS PubMed.
- J. D. Olarte-Plata and F. Bresme, J. Chem. Phys., 2020, 152, 204902 CrossRef CAS PubMed.
- R. Joshi, Synergy Between Electric Pulse and Thermal Effects, Springer Singapore, Singapore, 2021, pp. 301–315 Search PubMed.
- B. Fu, M. Chen, Q. Li and J. Song, Appl. Therm. Eng., 2018, 133, 237–247 CrossRef CAS.
- D. Niether and S. Wiegand, J. Phys.: Condens. Matter, 2019, 31, 503003 CrossRef CAS PubMed.
- J. Duan, G. Feng, B. Yu, J. Li, M. Chen, P. Yang, J. Feng, K. Liu and J. Zhou, Nat. Commun., 2018, 9, 5146 CrossRef PubMed.
- J. Armstrong and F. Bresme, Phys. Rev. E: Stat., Nonlinear, Soft Matter Phys., 2015, 92, 060103 CrossRef PubMed.
- J. Armstrong, A. Lervik and F. Bresme, J. Phys. Chem. B, 2013, 117, 14817–14826 CrossRef CAS PubMed.
- I. Iriarte-Carretero, M. A. Gonzalez, J. Armstrong, F. Fernandez-Alonso and F. Bresme, Phys. Chem. Chem. Phys., 2016, 18, 19894–19901 RSC.
- M. A. Wilson, A. Pohorille and L. R. Pratt, J. Chem. Phys., 1989, 90, 5211–5213 CrossRef CAS PubMed.
- B. Yang, D. E. Sullivan, B. Tjipto-Margo and C. G. Gray, J. Phys.: Condens. Matter, 1991, 3, F109–F125 CrossRef CAS.
- V. P. Sokhan and D. J. Tildesley, Mol. Phys., 1997, 92, 625–640 CrossRef CAS.
- E. Harder and B. Roux, J. Chem. Phys., 2008, 129, 234706 CrossRef PubMed.
- M. Paluch, Annales Universitatis Mariae Curie-Skłodowska Lublin-Polonia, 2015, 70, 1–11 Search PubMed.
- S. M. Kathmann, I.-F. W. Kuo, C. J. Mundy and G. K. Schenter, J. Phys. Chem. B, 2011, 115, 4369–4377 CrossRef CAS PubMed.
- F. S. Cipcigan, V. P. Sokhan, A. P. Jones, J. Crain and G. J. Martyna, Phys. Chem. Chem. Phys., 2015, 17, 8660–8669 RSC.
- J. Randles and D. Schiffrin, J. Electroanal. Chem., 1965, 10, 480–484 CAS.
- J. L. Abascal and C. Vega, J. Phys. Chem. C, 2007, 111, 15811–15822 CrossRef CAS.
- J. L. Abascal and C. Vega, Phys. Rev. Lett., 2007, 98, 2005–2008 CrossRef PubMed.
- W. S. Benedict, N. Gailar and E. K. Plyler, J. Chem. Phys., 1956, 24, 1139–1165 CrossRef CAS.
- J. L. F. Abascal and C. Vega, J. Chem. Phys., 2005, 123, 234505 CrossRef CAS PubMed.
- M. A. González and J. L. F. Abascal, J. Chem. Phys., 2011, 135, 224516 CrossRef PubMed.
- H. J. Berendsen, J. R. Grigera and T. P. Straatsma, J. Phys. Chem., 1987, 91, 6269–6271 CrossRef CAS.
- S. Izadi, R. Anandakrishnan and A. V. Onufriev, J. Phys. Chem. Lett., 2014, 5, 3863–3871 CrossRef CAS PubMed.
- W. L. Jorgensen, J. Chandrasekhar, J. D. Madura, R. W. Impey and M. L. Klein, J. Chem. Phys., 1983, 79, 926–935 CrossRef CAS.
- R. W. Hockney and J. W. Eastwood, Computer simulation using particles, CRC Press, 1988 Search PubMed.
- S. Plimpton, J. Comput. Phys., 1995, 117, 1–19 CrossRef CAS.
- H. C. Andersen, J. Comput. Phys., 1983, 52, 24–34 CrossRef CAS.
- A. Stukowski, Modell. Simul. Mater. Sci. Eng., 2010, 18, 015012 CrossRef.
- G. Bussi, D. Donadio and M. Parrinello, J. Chem. Phys., 2007, 126, 014101 CrossRef PubMed.
- A. Chapman, multipole-parakeet, 2021, https://github.com/bresmegroup/multipole-parakeet.git.
- N. Michaud-Agrawal, E. J. Denning, T. B. Woolf and O. Beckstein, J. Comput. Chem., 2011, 32, 2319–2327 CrossRef CAS PubMed.
- R. Gowers, M. Linke, J. Barnoud, T. Reddy, M. Melo, S. Seyler, J. Domański, D. Dotson, S. Buchoux, I. Kenney and O. Beckstein, Proceedings of the 15th Python in Science Conference, 2016, 98–105 Search PubMed.
- M. J. Abraham, T. Murtola, R. Schulz, S. Páll, J. C. Smith, B. Hess and E. Lindahl, SoftwareX, 2015, 1-2, 19–25 CrossRef.
- F. Römer, A. Lervik and F. Bresme, J. Chem. Phys., 2012, 137, 74503 CrossRef PubMed.
- J. D. Jackson, Classical electrodynamics, Wiley, New York, 3rd edn, 1999 Search PubMed.
- C. Vega and J. L. Abascal, Phys. Chem. Chem. Phys., 2011, 13, 19663–19688 RSC.
- V. K. Shen, D. W. Siderius, W. P. Krekelberg and H. W. Hatch, NIST Standard Reference Simulation Website, NIST Standard Reference Database Number 173, National Institute of Standards and Technology, Gaithersburg MD, 20899 DOI:10.18434/T4M88Q , (retrieved 14 February 2022).
- P. Virtanen, et al. , Nat. Methods, 2020, 17, 261–272 CrossRef CAS PubMed.
- D. J. Evans and G. P. Morriss, Statistical Mechanics of Nonequilibrium Liquids, ANU Press, 2007 Search PubMed.
- F. Bresme and E. Artacho, J. Mater. Chem., 2010, 20, 10351 RSC.
- G. S. Kell, J. Chem. Eng. Data, 1975, 20, 97–105 CrossRef CAS.
- L. P. Wang, T. J. Martinez and V. S. Pande, J. Phys. Chem. Lett., 2014, 5, 1885–1891 CrossRef CAS PubMed.
- S. Baldelli, C. Schnitzer, M. J. Shultz and D. J. Campbell, J. Phys. Chem. B, 1997, 101, 10435–10441 CrossRef CAS.
- Y. R. Shen and V. Ostroverkhov, Chem. Rev., 2006, 106, 1140–1154 CrossRef CAS PubMed.
- G. L. Richmond, Chem. Rev., 2002, 102, 2693–2724 CrossRef CAS PubMed.
Footnote |
| † Electronic supplementary information (ESI) available. See DOI: https://doi.org/10.1039/d2cp00756h |
| This journal is © the Owner Societies 2022 |

