 Open Access Article
Creative Commons Attribution 3.0 Unported Licence
Ion transport mechanism in anhydrous lithium thiocyanate LiSCN part II: frequency dependence and slow jump relaxation†
Markus
Joos
 a,
Maurice
Conrad‡
 b,
Igor
Moudrakovski
 a,
Maxwell W.
Terban
 a,
Ashkan
Rad
a,
Payam
Kaghazchi
a,
Ashkan
Rad
a,
Payam
Kaghazchi
 c,
Rotraut
Merkle
 *a,
Robert E.
Dinnebier
 a,
Thomas
Schleid
 b and
Joachim
Maier
 a
a
aMax Planck Institute for Solid State Research, Heisenbergstr. 1, 70569 Stuttgart, Germany. E-mail: r.merkle@fkf.mpg.de
bInstitut für Anorganische Chemie, University of Stuttgart, Pfaffenwaldring 55, 70569 Stuttgart, Germany
cForschungszentrum Jülich GmbH, Institute of Energy and Climate Research, Materials Synthesis and Processing (IEK-1), 52425 Jülich, Germany
First published on 27th July 2022
Abstract
Specific aspects of the Li+ cation conductivity of anhydrous Li(SCN) are investigated, in particular the high migration enthalpy of lithium vacancies. Close inspection of impedance spectra and conductivity data reveals two bulk relaxation processes, with comparatively fast ion transport at high frequencies and slow ion migration at low frequencies. The impedance results are supported by solid state nuclear magnetic resonance (ssNMR), and pair distribution function (PDF) analysis. This behavior reflects a frequency dependent conductivity, which is related to the extremely slow thiocyanate (SCN)− anion lattice relaxation that occurs when a Li+ cation jumps to the next available site. Two possible migration models are proposed: the first model considers an asymmetric energy landscape for Li+ cation hopping, while the second model is connected to the jump relaxation model and allows for 180° rotational disorder of the (SCN)− anion. A complete kinetic analysis for the hopping of Li+ cations is presented, which reveals new fundamental insights into the ion transport mechanism of materials with complex anions.
1. Introduction
Anhydrous Li(SCN) is an intrinsically Schottky defective material with lithium vacancies as mobile defects.1 Based on the thermodynamic and kinetic knowledge of its defect chemistry, we investigate the specific physical mechanism of Li+ cation hopping, especially regarding the role of the anisotropic thiocyanate anion (SCN)−.
In literature, it has been shown for numerous materials, especially with complex anions, that the cation mobility is significantly affected by the interplay with the motion of the anion. A common term used to describe this interplay is the so-called “paddle-wheel” mechanism, which was originally proposed for ionic systems with complex anions such as Li2(SO4).2 The anion could actively promote cation conduction by dragging it along through Coulomb interaction when it fully rotates (paddle wheel). Further investigations also led to some controversy,3–7 and an alternative interpretation based on free volume increase (“percolation model”) was proposed.6,7 Here, the anion could only indirectly promote transport by increasing the free volume through rotational disorder, creating a flatter potential landscape and eliminating energetic bottlenecks. Actually, neither of the two ideas is exclusive, and the increase of free volume is even a requirement for the rotation of the anion to occur. Regardless of the underlying mechanism, the interplay between cation mobility (translational motion, i.e. hopping) and anion mobility (reorientational motion, i.e. rotation) can, in a limiting case, lead to an anomalous and strong increase in ionic conductivity, which is known as the rotor phase transition. The underlying material properties for this transition to occur can be summarized accordingly: (i) the material's anion (or cation) lattice needs to become fully disordered (molten sublattice). If the anion has an internal structure ((SO4)2−, (PO4)3−, (WO4)2−), it becomes fully symmetric by fast local rotational disorder (rotor phase). (ii) The material's crystal structure needs to be spacious enough for the anion (or cation) to become fully disordered. Since full disorder of the anion (and/or cation) lattice is accompanied by a structural change (otherwise a change in aggregate state occurs), polymorphism is often observed in these systems (e.g. also seen in Na2(S2O3)).8
An increasing number of investigations concluded that dynamic correlations of cation and anion motion in phases with rotationally disordered complex anions are beneficial for fast cation transport,9–13 and supplied detailed atomistic views, e.g. from molecular dynamics (MD) simulations (cf. also ref. 14). However, it is not necessary to have full rotational disorder of a complex anion to see effects on cation dynamics. Partial rotations and other local relaxations may be important. Such effects are often related to a frequency dependence in the bulk conductivity connected to different characteristic times of the involved substeps of the transport processes.
The underlying physical concept of the role of anion disorder for cation transport can be nicely brought into context with the jump relaxation model introduced by Funke.15 This concept describes the time/frequency effect of the structural rearrangement of a site in which an ion (coming from a relaxed site) has just hopped in. Importantly, relaxation effects in the microwave or submicrowave regime are usually not caused by the fast phononic relaxation but by rearrangement of the other mobile ions. When the anion lattice becomes more mobile (higher degree of disorder), the relaxation process occurs faster and long-range transport is promoted.
Regarding the (SCN)− anion, the complexity of thiocyanate coordination chemistry is twofold: (i) thiocyanates can form a variety of coordination compounds with different ligands, e.g. Li(SCN) with H2O or tetrahydrofuran (THF)16–18 as well as other metal thiocyanates (M = Na with H2O;19 M = Mg with H2O and/or THF;20 M = Ca with H2O, dimethoxyethane (DME) or acetonitrile (NCMe)).21,22 (ii) As a non-spherical, bidentate ligand, it can bind in different orientations and different binding strengths. The effect of M–(SCN) coordination on physical properties in solid crystals such as local structure, thermal expansion, elasticity, spin-lattice dynamics, etc. has been reviewed and studied in detail for K(SCN).23–25 The (SCN)− anion can reorient locally between two energetically non-equivalent states, which become (on a timescale of <10−2 s) equivalent after a phase transition. It is therefore reasonable to consider the reorientation of (SCN)− as a decisive relaxation process when investigating the Li+ cation transport in Li(SCN).
Here, we will explicitly discuss the physical mechanism of Li+ ion (or rather  ) hopping and the influence that (SCN)− local motion has on the cation transport in anhydrous Li(SCN). With the combination of electrochemical impedance spectroscopy (EIS), solid state nuclear magnetic resonance (ssNMR) and pair distribution function (PDF) analysis, it is concluded that the transport of mobile defects is distinctly frequency dependent. Below 150 °C, local (backward–forward) cation hopping is observed at high frequencies, and successful long-range motion (i.e. direct current (DC) conductivity) only occurs at low frequencies (<0.1 Hz at 25 °C). At higher temperatures, lattice relaxation processes occur faster, and local and global cation motions become no longer distinguishable. We show that this frequency dependent conductivity is related to local relaxation processes of the (SCN)− anion, and can be interpreted in terms of the jump relaxation model.15 The presented results of Li(SCN) are compared to literature data of other materials with complex anions.
2. Results and discussion
2.1. Impedance spectroscopy
As shown in Fig. 1, the measured complex impedance arcs of anhydrous Li(SCN) reveal two relaxation processes at high (ω1) and low (ω2) frequencies, which is best seen in the modulus representation in Fig. 1b. The dependence on the sample thickness made clear that both signals correspond to the bulk responses and not e.g. to electrode processes (cf. ESI,† Fig. S3). With increasing temperature the two relaxation times become similar and eventually the two signals become indistinguishable in the complex impedance representation (Fig. 1c). For comparison, the impedance of LiI was also measured (ESI,† Fig. S4b). Despite the chemical similarity, LiI shows only one EIS semicircle with a (rather) temperature independent dielectric constant of 30. These results strongly suggest that the presence of two EIS bulk signals in Li(SCN) is connected with the anisotropic properties of the (SCN)− anion. | ||
| Fig. 1 (a) Complex impedance and (b) complex modulus plot of anhydrous Li(SCN) at 69 °C (cold-pressed pellet, relative density 89%, data from ref. 1). (c) Impedance spectra of anhydrous Li(SCN) at various temperatures. The Warburg feature at low frequencies expected for ion blocking electrodes was observed but is omitted for clarity. | ||
Two serial processes with different relaxation times τ (τn = RnCn) are often phenomenologically described by a simple Ser{Par[R1,C1], Par[R2,C2]} circuit. However, the EIS spectra of anhydrous Li(SCN) show a strong convolution for the high (ω1) and low (ω2) frequency signals, especially at lower temperatures. For such a situation, the circuit in Fig. 1a yields a better fit (due to the cross term jω1C1R2, which links the impedance signals).
If blocking grain boundaries were present, bulk and grain boundary capacitances are expected to differ by at least two to three orders of magnitude (depending on grain size), and the relaxation times should sufficiently differ for the semicircles to be separated. Fig. S5 in the ESI† demonstrates that even at higher temperature when the electrode arc comes into the measured frequency range no response from blocking grain boundaries is observed between bulk and electrode response. Furthermore, Li(SCN) is not expected to have strongly blocking grain boundaries considering its soft behavior.26 Porosity effects or current constriction at grain contacts can also be ruled out, as a 94% dense sample prepared by SPS (included in Fig. 2) yielded the same EIS response as cold pressed pellets.
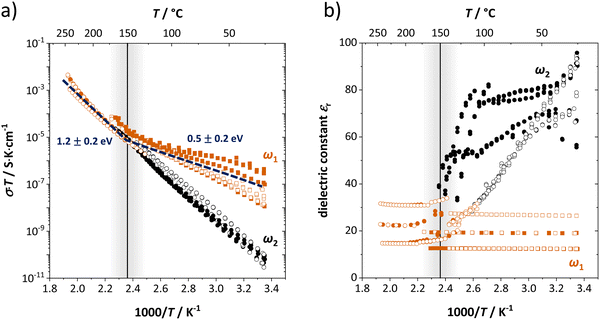 | ||
| Fig. 2 (a) Conductivity and (b) dielectric constant εr as a function of inverse temperature from different samples of anhydrous Li(SCN). The figure shows the high (ω1) and low (ω2) frequency process of bulk transport as fitted by the circuit in Fig. 1a as red and black symbols (full symbols: heating, empty symbols: cooling). The vertical line indicates the transition after which the two impedance arcs merge and only one peak frequency is observed. | ||
Fig. 2 shows the conductivities and dielectric constants at different temperatures calculated from the high (ω1) and low (ω2) frequency contributions to bulk transport obtained with the circuit shown in Fig. 1a. Even though the dielectric constant εr at low frequencies (ω2) is higher than at high frequencies (ω1), it is too low to correspond to an interfacial process. If blocking grain boundaries were present, one would expect the apparent grain boundary dielectric constant to be at least 2–3 orders of magnitude higher than for bulk (for the Li(SCN) grain size in the micrometer range).26 Also the temperature dependence of εr,ω2 does not match the expectation for grain boundaries.
The high frequency process (ω1) changes its activation energy at ∼150 °C from (0.5 ± 0.2) eV to (1.2 ± 0.2) eV (error bar calculated from averaging over all measurements), while its dielectric constant remains relatively constant at roughly 25. This permittivity (εr,ω1) value is almost identical to the one of LiI and is within the typical range of solid ion conductors with large, polarizable anions. In contrast, εr,ω2 is strongly temperature dependent and can exceed 100 at low temperatures. Both features indicate a relation to the (SCN)− anion, since its local motion can induce polarization, causing an increased dielectric response.
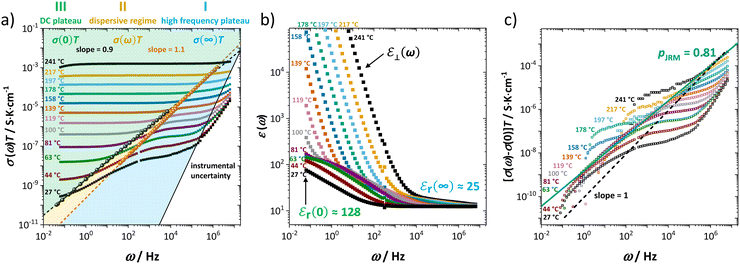
As extensively discussed in the literature (see e.g. ref. 15) and as mentioned in the introduction, ion transport in a material can exhibit a frequency dependence related to relaxation processes of the jumping ion's environment. Each hop has a probability for a reverse jump (high, as long as the environment has not yet accommodated to the jumped ion), or for continuing the transport process in other directions and thus contributing to the long-range DC conductivity. At high frequencies, ions hop in correlated forward–backward motions (many back-jumps) and hardly contribute to long-range ion migration. This manifests itself as a high frequency plateau in the frequency dependent real part of the complex conductivity (Fig. 3a, regime I). With decreasing frequency, such forward–backward jumps contribute increasingly less, and the real part of the complex conductivity becomes smaller. This leads to a dispersive behavior depicted as regime II in Fig. 3a. Finally, at low frequencies (long time) only the few successful hops including environment relaxation are recorded and the DC plateau corresponding to long-range ion transport is reached (regime III). Fig. 3 shows both the frequency dependent real conductivity σ(ω) and dielectric constant εr(ω1) at various temperatures, for which the values at high (∞) and low (0) frequencies are indicated (σ(0) represents the low frequency plateau). At elevated temperatures a blocking electrode feature appears (i.e. Warburg diffusion), recognized at low frequencies by its apparently high dielectric constant ε⊥(ω). The Warburg feature is also observed in the impedance spectra in Fig. 1, yet is omitted for clarity.
In our case, the direct observation of the high frequency plateau at room temperature is remarkable, considering that typically much lower temperatures (for MHz range) or microwave techniques in the GHz range are required.15 The astonishingly long relaxation time for local ion hopping in regime I entails a very short dispersive regime II, until the DC plateau in regime III is reached. According to the jump relaxation model JRM, the frequency dependence of σ(ω) for the transition from regime II to III is well approximated with [σ(ω) − σ(0)] ∝ ωp (Fig. 3c). The exponent p relates to the “mismatch parameter” α (or β in the Kohlrausch–Williams–Watts approach), which describes the energetic asymmetry when the immediate neighborhood of an ion relaxes after a hop. The activation energies (enthalpies) for high (ω1) and low (ω2) frequencies in Fig. 2 correspond to the ion motion in regime I and III, reflecting local short time forward–backward hopping, and long-range ion migration, respectively.
2.2. 7Li and 15N solid state NMR spectroscopy
Fig. 4 shows the results from static 7Li ssNMR measurements at various temperatures. At low temperatures up to about 60 °C, anhydrous Li(SCN) displays a broad signal characteristic to the spin 3/2 quadrupolar nucleus, and consists of the signals from central and satellite transitions. At 70 °C, an additional, narrow signal becomes visible at the top of the central transition. This signal intensifies as the temperature increases, while the intensity of both the central and satellite transitions of the initial spectrum simultaneously decrease. When the temperature exceeds 230 °C the broad component vanish, and only the narrow signal remains.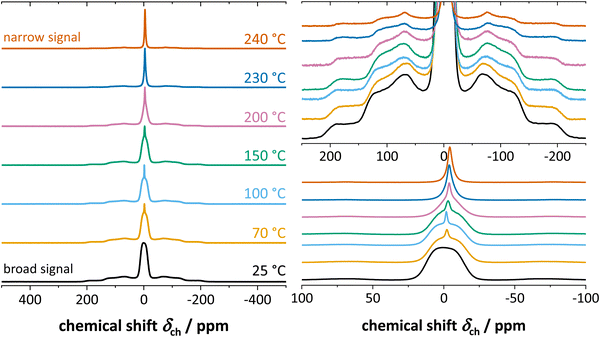 | ||
| Fig. 4 7Li ssNMR spectra of anhydrous Li(SCN) at various temperatures, with appropriate magnifications on the right hand side. | ||
The change in the width of the central transition by motional narrowing can be detected already above 60 °C, and becomes very pronounced above 150 °C (Fig. 5a), i.e. at the same temperature region where the low-frequency process in impedance spectra becomes indistinguishable. Together with the results on spin-lattice relaxation times T1 (Fig. 5b), we can identify the emerging narrow signal as the high frequency process (ω1), and the broad signal as the low frequency process (ω2) observed from impedance (Fig. 3). The respective changes in the signal shapes and widths reflect the lithium ion transport dynamics in the same manner as seen by impedance, with the high frequency process showing a much higher transport rate than the low frequency one. From the change in full width at half maximum (FWHM) in Fig. 5a, an activation energy can be calculated with the empirical expression EonsetA = 1.617 × 10⁻³ eV·Tc/K, where Tc is the onset temperature of motional narrowing.27,28 The obtained value of 0.69 eV is close to the one for high frequencies (ω1) from EIS ((0.5 ± 0.2) eV, within the experimental error range). The observed T1 spin-lattice relaxation times of the broad signal (exceeding 1000 s below 150 °C) are extremely long. This comparison demonstrates the complementarity of these two techniques. While NMR spin-lattice relaxation times are not necessarily identical to the inverse of the jump rate of the cation, both processes are nevertheless related. The fact that the long-range transport process is limited to such low frequencies explains why the transition to the high frequency process (ω1) also occurs at comparably low frequencies, and thus the high frequency plateau falls into the EIS measurement range.
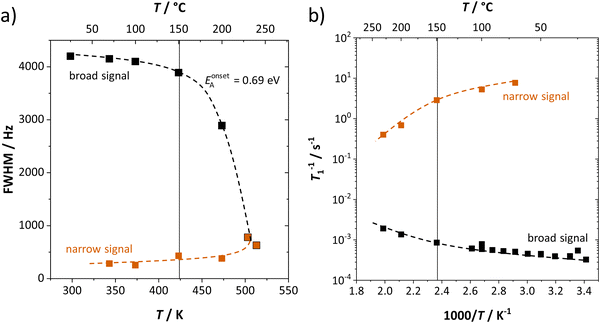 | ||
| Fig. 5 (a) Full width at half-maximum (FWHM) and (b) spin–lattice relaxation rate (1/T1) as a function of temperature for the broad (black) and narrow (red) components as shown in Fig. 4. Dashed lines are a guide for the eye. | ||
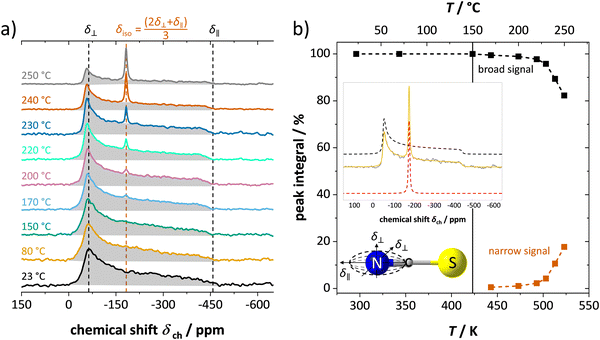
In addition to 7Li NMR, 15N NMR spectroscopy was conducted on an enriched Li(SC15N) sample to probe the mobility of the thiocyanate anion (Fig. 6). The observed axially anisotropic signal (shaded area in Fig. 6a) agrees well with the expected shape for 15N in the (SCN)− anion,29 and reflects an essentially immobile (SCN)− unit in the lattice. In complete agreement with the observations for Li+ cations, at temperatures above 150–170 °C, an additional narrow peak appears on top of the broad signal. The position, the symmetry and highly reduced line width of the signal all indicate a much higher isotropic mobility of the new moiety. With increasing temperature the ratio of the narrow signal gradually increases (Fig. 6b), demonstrating a similar behavior to the narrow signal in 7Li NMR (Fig. 4 and 5). The essential preservation of the axially anisotropic line shape up to the highest studied temperatures hints at the development of two slowly communicating (on the NMR time scale) anionic species; i.e. the simultaneous presence of two differently magnetically shielded (SCN)− anions. This indicates either both slow (broad, anisotropic signal) and fast (narrow, isotropic signal) moving (SCN)− anions (e.g. partial or full rotation), or an increasing fraction of (SCN)− anions being isotropically shielded by the fast moving Li+ cations (VLi′ defects) around them.
In conclusion, the observed changes in 7Li and 15N NMR spectra with temperature both support the observations from impedance in Fig. 2, and also suggest a relation between Li+ cations and (SCN)− anions in the migration mechanism of  (analogous to Na3(PO4), cf. discussion in the ESI†).9,30 With an increased mobility of the anion lattice, the relaxation after the initial jump occurs much faster, and the faster reorientation of the (SCN)− anion cancels its anisotropic polarization effect. However, NMR is a local technique, reflecting local processes, and NMR frequency or rather time domains cannot directly be related to the frequency (time) range of impedance (integral technique).9,30
A good comparison is K(SCN), in which the spin-lattice relaxation behavior of 39K has been explained with the rotational motion of (SCN)−.23 In the K(SCN) structure, the (SCN)− anion has a higher degree of rotational freedom compared to in Li(SCN), which is reflected by the far lower T1 relaxation time of 39K compared to 7Li, and the structural transition. The anion can change its orientation between two states, until at 142 °C the degree of reorientation strongly increases (full rotational disorder on average time scale) and a phase transition occurs (however, based on volume contributions Plester et al.25 considers complete rotational disorder of (SCN)− in K(SCN) unlikely). Such a transition does not occur in Li(SCN) below its melting point. This evident difference in anion mobility behavior can be understood from two aspects: (i) the more spacious K(SCN) structure allows for the (complete) rotation of (SCN)−, and (ii) for the larger and softer K+ cation there is no preference for K–N over K–S bonding. Therefore, any rotational disorder of (SCN)− in Li(SCN), if it occurs at all, would likely be very small in magnitude. It remains an open question whether or not the (SCN)− anion can perform full 180° rotations or merely reorientates.
2.3. Pair distribution function
The impact of (SCN)− rotational disorder on the local structure was investigated with X-ray total scattering measurements and PDF analysis at 20, 120, and 226 °C (Fig. 7a). As expected, there is negligible change in the atom-pair distances within the anions. The shifting and broadening of the peaks at higher distances signify expansion of the intermolecular distances and increased thermal displacements.Rotations of the anions away from their average positions, particularly off the mirror planes, effectively lower the symmetry of the local structure environments. Structure refinement over short distances in real space yields information about the preferred relative orientations of the molecules, independent of the presence or absence of long-range correlation between rotational states. This allows one to compare how well models with different rotational distortions describe the data. To systematically test for the preference of symmetry-breaking rotations, starting with the Pnma parent structure,31 all rotational isotropy subgroups in orthorhombic, monoclinic, and triclinic crystal systems were determined.32,33 For each subgroup, the structure model with (SCN)− anions defined as rigid bodies was refined allowing free rotation around the central carbon atom. The lithium and carbon positions were kept fixed to reduce the number of parameters. All models were tested against the measurement at 226 °C. Then, the top performing models in each crystal system were refined against the lower temperature datasets. The refinement goodness-of-fit is plotted against the number of refined parameters for each case in Fig. 7. Every subgroup tested gives an improved description of the local structure, especially when including multiple molecules in the asymmetric unit, which allows for more disordered relative anion orientations. However, even with one molecule allowed to rotate freely off the mirror plane in Pnma (e.g. in P21/c), the fit already improves by ∼1.5%. The number of refined parameters increases with each model, so the results are not completely unambiguous, however they do suggest that the local structure prefers distortions of both rotational orientations and the lattice metric away from the average. Refinements suggest the presence of rotational distortions at lower temperatures, although the increasing improvement in the fits for 120 and 226 °C suggests prominence at higher temperature. In this sense, the PDF results support the observations from ssNMR of reorientational disorder of (SCN)− in Li(SCN), which becomes more pronounced with increasing temperature.
2.4. Discussion
Based on the experimental evidence shown above, we want to develop possible kinetic models to explain the transport mechanism in anhydrous Li(SCN). The migration of
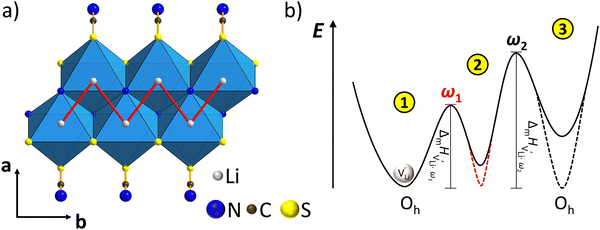
  , i.e. the hopping of Li+ cations, is considered to occur via next nearest neighbors (adjacent sites) which was used to construct the defect model in Part I,1 and is depicted in Fig. 8a. Every Li+ cation has two nearest neighbor Li+ sites at a distance of 3.16 Å. The vacancies can move in a “zigzag” fashion along the b direction via octahedral sites. The temperature dependent behavior of εr,ω2 shown in Fig. 2b, as well as the results from ssNMR (Fig. 4–6) and PDF (Fig. 7) suggest that the (SCN)− anion is also involved in the jump process, since its reorientation is expected to cause polarization changes. The conductivity measurements were clearly frequency dependent with two distinct activation energies both at high (ω1) and low (ω2) frequencies. We can therefore conclude that the mechanism of
  migration in Li(SCN) involves two energy barriers which are overcome at different frequencies, as shown in Fig. 8b, and that the first barrier (
 at high frequencies ω1) reflects local Li+ cation hopping, while the second barrier (
 at low frequencies ω2) corresponds to long-range Li+ cation transport. The reason for this frequency dependence, however, is still ambiguous. Nonetheless, based on these considerations, we hypothesize two alternative transport models that would lead to a frequency dependent conductivity.
Model 1: if we presume that the structure and Coulomb interactions in Li(SCN) do not allow for full 180° rotations of the (SCN)− anion, only small local relaxations (i.e. reorientations) occur during Li+ cation hopping ( migration). Between the edge sharing octahedra are empty tetrahedral (interstitial) sites Vi, which are composed of [Vi N3S] units (Fig. 9). These empty tetrahedral sites are closer to the regular Li+ cations (1.96 Å and 2.11 Å are the distances to the next regular Li+ site, cf.Fig. 9), and the cations could hop on the Vi sites (transition from (1) to (2) in Fig. 8b and 9), resulting in a tetrahedral (interstitial) site mediated migration mechanism (such a path has also been discussed for LiI).34 In a rigid lattice without relaxation, such a process is energetically unfavorable and the ion would just jump back. However, the hopping of Li+ to Vi induces local relaxation of the neighborhood and the potential energy of the interstitial site decreases (red dashed line in Fig. 8b). Since the Li+ cation favors the Li–N coordination, the tetrahedral sites offer a rather favorable bonding situation as the concentration of Li–N bonds is high compared to the concentration of regular octahedra sites. As a consequence of this rather stable position, the barrier for the jump to the next regular site is high (transition from (2) to (3) in Fig. 8b and 9). Another important point is that the barriers for entering and leaving the tetrahedral site differ (cf.Fig. 8b) because the Li+ cation moves either through a [N3] face or a [N2S] face (cf.Fig. 9), which offer more or less available space for the passing Li+ cation. This could explain why the transition from local hopping to long-range transport, which requires overcoming also the larger of the two barriers, occurs at comparatively low frequencies. For successful long-range motion to the next octahedral site, the high migration barrier
  has to be overcome.
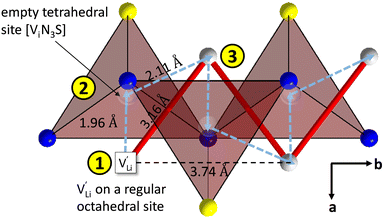 | ||
Fig. 9 Empty tetrahedral (interstitial) sites Vi composed of [ViN3S] units (red tetrahedra, blue spheres are nitrogen atoms, yellow spheres are sulfur atoms, grey spheres are lithium atoms). The transparent spheres inside of the tetrahedra indicate where a Li+ cation would be situated if they were filled. The solid red line describes the overall migration path between the regular octahedral Li+ sites to the nearest neighbor (cf.Fig. 8a). The dashed blue line describes the migration path of  according to model 1, if their transport is mediated via the empty tetrahedral (interstitial) sites. The encircled numbers (1)–(3) correspond to the energy level scheme in Fig. 8b. according to model 1, if their transport is mediated via the empty tetrahedral (interstitial) sites. The encircled numbers (1)–(3) correspond to the energy level scheme in Fig. 8b. | ||
In summary, for the  in Fig. 9 to migrate from (1) to (3), the adjacent Li+ cation will first jump through the [N2S] face into the empty tetrahedral site, after which the cation's immediate environment relaxes in the form of small (SCN)− reorientations (dashed red line in Fig. 8b). In order for the long-range transport to be successful, the second, larger energy barrier from (2) to (3) (cf.Fig. 8b) has to be overcome. The Li+ cation has to pass through the [N3] face to reach the octahedral position, after which the occurring (SCN)− reorientations lower the site energy and relax the structure. This means that the main cause of the two different barrier heights are the geometric differences in the [N3] versus [N2S] face, and the structural relaxations compensate for the associated energetic asymmetry (dashed red and black lines in Fig. 8b). This path bears some resemblance to a random barrier model (see e.g. ref. 35).
Model 2: if we assume that full 180° rotations of the (SCN)− anion can occur locally (possibly facilitated by  ), we can think of an alternative mechanism for Li+ cation transport (Fig. 10). A lithium vacancy would prefer a sulfur coordination (because then an occupied Li+ site can benefit from the nitrogen coordination), which would induce rotation of the (SCN)− in its immediate surrounding. The vacancy would first jump to the nearest octahedral site (transition from (1) to (2) in Fig. 8b and 10), which is, however, less favorable as long as it is coordinated to nitrogen, and thus prone to a fast back jump. Relaxation of the structure by rotation of the next (SCN)− anion would stabilize it, making the jump long-time successful (transition from (2) to (3) in Fig. 8b and 10). In this mechanism the second barrier refers to the energy the Li+ cation has to muster for hopping, as well as to a 180° rotation of the (SCN)− anion (i.e. the rotation energy is related to the high value of
  ).
).
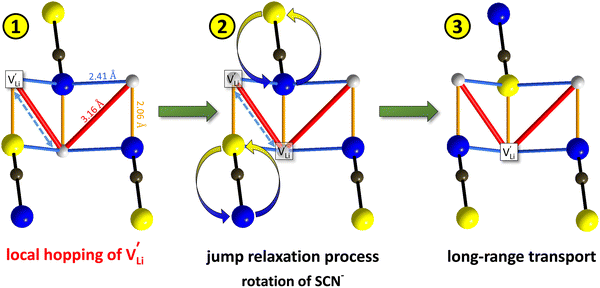 | ||
Fig. 10 Jump relaxation model for migration of  based on local, rotational disorder of the (SCN)− anion. Blue spheres are nitrogen atoms, brown spheres are carbon atoms, yellow spheres are sulfur atoms and grey spheres are lithium atoms. The solid red line describes the overall migration path between the regular octahedral Li+ sites to the nearest neighbor (cf.Fig. 8a). The dashed blue line describes the initial local forward–backward hopping of based on local, rotational disorder of the (SCN)− anion. Blue spheres are nitrogen atoms, brown spheres are carbon atoms, yellow spheres are sulfur atoms and grey spheres are lithium atoms. The solid red line describes the overall migration path between the regular octahedral Li+ sites to the nearest neighbor (cf.Fig. 8a). The dashed blue line describes the initial local forward–backward hopping of  according to model 2, if their long-range transport is enabled by rotational disorder of the (SCN)− anion. The encircled numbers (1), (2), and (3) correspond to the energy level scheme in Fig. 8b. The bent arrows for (2) are not meant to exactly specify the rotation axis (also an in-plane rotation axis may be possible for SCN−). At present we cannot predict which axis is energetically more feasible. according to model 2, if their long-range transport is enabled by rotational disorder of the (SCN)− anion. The encircled numbers (1), (2), and (3) correspond to the energy level scheme in Fig. 8b. The bent arrows for (2) are not meant to exactly specify the rotation axis (also an in-plane rotation axis may be possible for SCN−). At present we cannot predict which axis is energetically more feasible. | ||
According to the defect model and the derived enthalpies of Li(SCN) (cf. Table 2 in Part I),1 the  generation by Schottky reaction requires 0.6 eV, and the
  concentration
  can be calculated. Local ion hopping occurs with the high frequency
  migration enthalpy
  . With the relation
  ), where
  and e are the charge of
  and of an electron, as well as the conductivity shown in Fig. 2a, the high frequency mobility
  is obtained (Fig. 11):
 | (1) |
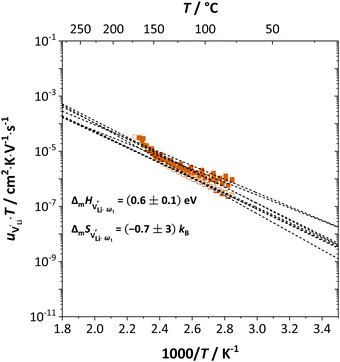 | ||
Fig. 11 High frequency mobility of  in anhydrous Li(SCN). Dashed lines correspond to linear fits. Full squares are heating, and empty squares are cooling data (cf.Fig. 2a). in anhydrous Li(SCN). Dashed lines correspond to linear fits. Full squares are heating, and empty squares are cooling data (cf.Fig. 2a). | ||
The situation described in model 2 matches with the jump relaxation model JRM, in which relaxation of the immediate environment (here (SCN)− anions) significantly affects cation transport. Within the JRM, the energy barriers EI, EII, and EIII for the three frequency regimes in Fig. 3a and associated relaxation energies can be estimated accordingly (Fig. 12): the energies EI and EIII are the local and long-range migration enthalpies of the lithium vacancies  and
and  . The energy well immediately after the initial jump is denoted as δ, and the associated relaxation as δ′. The barrier EIII may be expressed as EIII = EI + 2A(EI − δ), in which A is a constant close to unity.15,36 The energy term related to the rotation of (SCN)− corresponds to ΔHSCN = 2A(EI − δ) = (0.3 ± 0.1) eV, which means δ ≈ (0.5 ± 0.1) eV. Based on the JRM, for the dispersive regime EII = (1 − p)EIII applies, yielding EII = (0.17 ± 0.02)eV (Fig. 3c). The energy EII indicates the energetic change during the relaxation of the lattice after the mobile ion has jumped locally, i.e. δ′ ≈ EII. The sum δ + δ′ is then (0.7 ± 0.1) eV, close to EI.
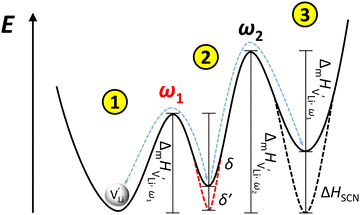 | ||
Fig. 12 Energy level scheme of  migration in Li(SCN) with assignment based on the jump relaxation model. The solid black line refers to the energy levels, while the dashed red and black line reflect occurring structural relaxation. The dashed blue line indicates the hopping of migration in Li(SCN) with assignment based on the jump relaxation model. The solid black line refers to the energy levels, while the dashed red and black line reflect occurring structural relaxation. The dashed blue line indicates the hopping of  (i.e. the Li+ cation). The numbers (1), (2), and (3) refer to the mechanism shown in Fig. 10. (i.e. the Li+ cation). The numbers (1), (2), and (3) refer to the mechanism shown in Fig. 10. | ||
Overall, the two possible mechanisms can be summarized as:
 | (2) |
 | (3) |
The newly discovered phase Mg1.02Li3.96(SCN)6 in Part I1 is a perfect comparison to Li(SCN) to support the just discussed concept. In this new material, Mg2+ is almost exclusively bonded to nitrogen atoms of (SCN)−, and the sulfur atoms coordinate to Li+. This favors the generation of lithium vacancies (the Schottky reaction formation enthalpy ΔSH° is lowered) and the conductivity is increased. This observation supports the above statement that (SCN)− coordination via sulfur stabilizes  . Regarding the cubic phase of Mg1.02Li3.96(SCN)6 above 62 °C, the lower activation energy of the conductivity (cf. Part I, Fig. 1a)1 indicates that there
  might be more mobile compared to Li(SCN). The impedance spectra do not show any sign of an additional high frequency response, and the dielectric constant suggests a very different reorientation behavior of (SCN)− in this system (cf. Part I, ESI,† Fig. S10).1 A higher degree of local (SCN)− motion is indeed expected for Mg1.02Li3.96(SCN)6, given the more spacious lattice and the higher flexibility in cation to anion coordination (partially mixed occupancy).
2.5. Comparison to other alkali metal cation conductors
Fig. 13 compiles conductivities of several other cation conductors. Some of them show a phase transition into a high temperature phase with full rotational disorder (rotor phase transition Li2(SO4), Li2(CO3), Li3(PS4), Na3(PO4), Na3(PS4)). Even below such a transition, local relaxation phenomena and corresponding frequency dependence of the conductivity is expected. Evidence can be found in various compounds.15 However, the key difference between Li(SCN) and fast cation conductors with complex anions is that the degree and rate of reorientational motions of the anion in Li(SCN) is much lower. It is comparable to the anion reorientational motion in fast cation conductors at subzero Celsius temperatures, effectively meaning a signal shift to lower frequencies, enabling the direct observation of local cation hopping with impedance. This is seen e.g. in the impedance spectra of Li6SI(SbS4) at −78 °C (cf. Fig. 3 in ref. 38) and Li6SCl(PS4) at − 100 °C (cf. Fig. 4b in ref. 39). There, the presence of two semicircles was interpreted as bulk and blocking grain boundaries. However, considering the chemistry of these materials, blocking grain boundaries would be less expected for such soft compounds – neither LiI (ESI,† Fig. S4b) nor Li2S (Fig. 1 in ref. 40) show blocking grain boundaries. Furthermore, the two semicircles are strongly convoluted, and the capacitances differ by less than one order of magnitude, which would only occur for grain sizes in the nanometer range. Instead, a more likely explanation are contributions from both local ion hopping (high frequency signal) and long-range motion (low frequency signal), as seen for Li(SCN) between room temperature and ∼150 °C (cf.Fig. 1 and 2).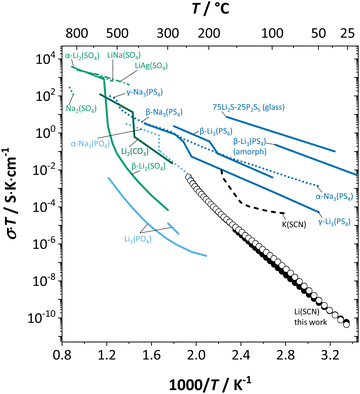 | ||
| Fig. 13 Comparison of Li(SCN) conductivity (black circles) with literature data of K(SCN),25 and different ion conducting material systems with complex anions (Li+ solid lines, Na+ dotted, K+ dashed, mixed cations dash-dotted); Li3(PO4),41,42 (α-)Na3(PO4),30 Li2(CO3),43 α- and β-Li2(SO4),42,44,45 LiNa(SO4),46 LiAg(SO4),47 Na2(SO4),46 β-Li3(PS4),48,49 γ-Li3(PS4),50 α-, β- and γ-Na3(PS4),51 and 75Li2S–25P2S5 glass ceramic52 (cf. also ref. 14). | ||
As briefly discussed in Part I,1 Li(SCN) differs in its defect chemistry from related systems such as lithium halides: its defect formation enthalpy is low (stabilization of  ), yet the migration barrier is high. The reason for this large migration barrier is the connection between cation (or rather
  ) migration and anion reorientation mobility (i.e. slow relaxation of (SCN)−). Such a correlation between cation–anion mobility has been shown for various systems employing different methods (M(SO4) (M = Li2, LiNa, LiAg, Na2) Raman spectroscopy and ab initio MD,53,54 75Li2S–25P2S5ab initio MD,12 Na3(PO4) NMR,9,30 Na3(PS4) ab initio MD,13 [Na11Sn2]PnCh12 (Pn = P, Sb and Ch = S, Se) neutron diffraction and ab initio MD,11 and M2(B12H12) (M = Li, Na) neutron diffraction and ab initio MD55,56), and does typically apply for materials with complex anions14 (however, this correlation is not limited to complex anions, as the Li+ cation mobility in Li2(OH)Cl was shown to correlate with the proton disorder).57 Naturally, one would expect the anion reorientation rate to predominantly influence the pre-exponential factor of cation mobility. However, the influence of anion reorientation might also extend to the migration enthalpy, as anion disorder has been suggested to flatten the energy landscape of the system (cf. Fig. 8 in ref. 58, referred to as increasing anharmonicity).
Since the cation mobility is linked to the anion reorientational motion, the anion reorientational rate (amongst other factors) determines the ionic conductivity. Typical anion reorientation times are between 1–100 ps for highly conductive rotor phases (300–800 °C),11–13,30,53–56 in which the anion is considered to have full rotational disorder. Given the demand to find highly conducting materials for room temperature application, it is desirable to retain these small anion reorientation times below the rotor temperature range.12 However, many materials undergo structural changes (i.e. phase transitions) at lower temperatures, increasing the reorientation times strongly, and accompanied by a sudden drop of conductivity (e.g. Na3(PO4)).9,30
The comparison of the activation energy from conductivity data (directly related to the cation) with the anion reorientation energy in Table 1 provides insight into the limiting factor for the transport mechanism: if either energy value is high, the cation conductivity will be limited by that high value. We can compare isotropic ((B12H12)2−, (PO4)3−, (PS4)3−, (SO4)2−) and anisotropic ((CN)−, (FHF)−, (N3)−, (SCN)−) anions. Although the anisotropic shape is more restricting, the energy values are rather similar to isotropic anions. This emphasizes the, besides shape, other two important factors for anion reorientation time (and energy): crystal structure and cation–anion coordination. Larger cations cause a lower packing density, which provides more space for the anion to move.24 Furthermore, the more different cation and anion are in size, and the more similar they are in electronegativity, the higher both their mobilities will be.
| Compound | Activation energy EA/eV | Anion | E rot/eV | Ref. |
|---|---|---|---|---|
| a Neutron diffraction. b Raman spectroscopy. c NMR. d Ab initio MD simulation. | ||||
| R(bcc) Na2(B12H12) | (Exp.) 0.21 | (B12H12)2− | (Exp.)a 0.26 | 55 and 59 |
| (tetr.) Na3(PO4) | (Exp.) 0.98 | (PO4)3− | (Exp.)c 0.65 | 9 and 30 |
| R(fcc α-) Na3(PO4) | (Exp.) 0.42 | (PO4)3− | (Exp.)c 0.18 | 30 |
| [Na11Sn2]PS12 | (Exp.) 0.24–0.31 | (PS4)3− | (Calc.)ad 0.12–0.24 | 11 |
| (Calc.) 0.19 | ||||
| [Na11Sn2]PSe12 | (Exp.) 0.28 | (PSe4)3− | (Calc.)ad 0.12–0.20 | 11 |
| (Calc.) 0.18 | ||||
| [Na11Sn2]SbS12 | (Exp.) 0.34 | (PSb4)3− | (Calc.)ad 0.60–0.86 | 11 |
| (Calc.) 0.25 | ||||
| (bcc β-) Na3(PS4) | (Exp.) 0.40 | (PS4)3− | (Calc.)d 0.66 | 13 and 51 |
| R(γ-) Na3(PS4) | (Exp.) 0.10 | (PS4)3− | (Calc.)d 0.15 | 13 |
| 75Li2S–25P2S5 | (Exp.) 0.38 | (PS4)3− | (Calc.)d 0.27 | 12 |
| (Exp.) 0.35 | 60 | |||
| (Calc.) 0.24 | 52 | |||
| R(fcc α-) Li2(SO4) | (Exp.) 0.36 | (SO4)2− | (Exp.)b 0.40 | 44 |
| (Exp.) 0.34 | 53 | |||
| R(bcc) LiNa(SO4) | (Exp.) 0.63 (Li+)/0.64 (Na+) | (SO4)2− | (Exp.)b 0.86 | 53 |
| R(bcc α-) LiAg(SO4) | (Exp.) 0.52 (Li+)/0.52 (Ag+) | (SO4)2− | (Exp.)b 0.72 | 53 |
| (hex.) Na2(SO4) | (Exp.) 1.68 | (SO4)2− | 53 | |
| Na(CN) | (C N)− N)− |
(Calc.) 0.11–0.26 | 61 | |
| K(CN) | (C N)− N)− |
(Calc.) 0.02–0.08 | 61 | |
| K(HF2) | (F–H–F)− | (Exp.)c 0.52 | 24 | |
| Cs(HF2) | (F–H–F)− | (Exp.)c 0.26 | 24 | |
| Cs(N3) | (N![[double bond, length as m-dash]](https://www.rsc.org/images/entities/char_e001.gif) N N![[double bond, length as m-dash]](https://www.rsc.org/images/entities/char_e001.gif) N)− N)− |
(Exp.)b 0.39 | 24 | |
We can now understand the observed conductivity of Li(SCN) compared to (AOx)n− and (ASx)n− anions in Fig. 13. The (SCN)− anion encompasses both situations; strong ionic bonding with Li–N![[double bond, length as m-dash]](https://www.rsc.org/images/entities/char_e001.gif) C
C![[double bond, length as m-dash]](https://www.rsc.org/images/entities/char_e001.gif) S coordination similar as for (AOx)n− systems, which mostly have lower conductivities than Li(SCN), and weaker Li–S–C
S coordination similar as for (AOx)n− systems, which mostly have lower conductivities than Li(SCN), and weaker Li–S–C![[triple bond, length as m-dash]](https://www.rsc.org/images/entities/char_e002.gif) N bonds enabling facile anion disorder and fast cation conduction as observed for ASn−x systems. However, the pronounced anisotropy of (SCN)− (compared to e.g. (CN)−), as well as the rather dense crystal structure of Li(SCN) (compared to e.g. Cs(N3)) restrict the anion reorientational motion strongly, and prevent it from becoming a rotor phase (compared to e.g. K(SCN)).23,24 In conclusion, we can summarize that the anisotropic shape and bidentate coordination of the (SCN)− anion is of absolute importance regarding ion transport in the whole temperature range.
N bonds enabling facile anion disorder and fast cation conduction as observed for ASn−x systems. However, the pronounced anisotropy of (SCN)− (compared to e.g. (CN)−), as well as the rather dense crystal structure of Li(SCN) (compared to e.g. Cs(N3)) restrict the anion reorientational motion strongly, and prevent it from becoming a rotor phase (compared to e.g. K(SCN)).23,24 In conclusion, we can summarize that the anisotropic shape and bidentate coordination of the (SCN)− anion is of absolute importance regarding ion transport in the whole temperature range.
3. Conclusion
This work presents a detailed investigation of Li+ cation transport in anhydrous Li(SCN), combining impedance, ssNMR, and PDF. Li+ cation hopping is impeded by the slow anion lattice relaxation, which imposes a frequency dependence on the ion transport. The reason for this slow lattice relaxation is the bidentate coordination in (SCN)− and the connected favor for Li–N and disfavor for Li–S bonds. Based on the coordination and defect chemistry of Li(SCN), it is proposed that lithium vacancies favor sulfur coordination by (SCN)− in contrast to Li+ cations. Two possible migration models are suggested, which comprise partial or complete rotation of (SCN)− close to the migrating ion, and thereby relax the immediate surrounding. With this approach respective kinetic data are derived. Li(SCN) is one of the few known systems in which the high frequency plateau of the bulk conductivity can directly be observed by impedance spectroscopy at room temperature. A comparison with literature data of other ion conductors with complex anions suggests connections with the kinetic model presented here. However, the specific properties of (SCN)− (anisotropic shape and very different Li–S and Li–N bond strengths) lead to a comparatively low ion conductivity.Author contributions
All authors have contributed to the experimental results, calculations and writing of the manuscript, and have given their approval to the final version of the manuscript.Conflicts of interest
There are no conflicts to declare.Acknowledgements
We want to thank Armin Sorg for his assistance in preparing samples by spark plasma sintering, and Max Hödl for proof reading the manuscript. Open Access funding provided by the Max Planck Society.References
- M. Joos, M. Conrad, A. Rad, P. Kaghazchi, S. Bette, R. Merkle, R. E. Dinnebier, Th. Schleid and J. Maier, Phys. Chem. Chem. Phys., 2022 10.1039/D2CP01836E.
- T. Førland and J. Krogh-Moe, Z. Elektrochem., 1957, 61, 1342 Search PubMed.
- U. M. Gundusharma, C. Maclean and E. A. Secco, Solid State Commun., 1986, 57, 479–481 CrossRef CAS.
- A. Lundén, Solid State Ionics, 1988, 28–30, 163–167 CrossRef.
- A. Lundén, Solid State Commun., 1988, 65, 1237–1240 CrossRef.
- E. A. Secco, J. Solid State Chem., 1992, 96, 366–375 CrossRef CAS.
- N. H. Andersen, P. W. S. K. Bandaranayake, M. A. Careem, M. A. K. L. Dissanayake, C. N. Wijayasekera, R. Kaber, A. Lundén, B. E. Mellander, L. Nilsson and J. O. Thomas, Solid State Ionics, 1992, 57, 203–209 CrossRef CAS.
- H. von Benda and K. von Benda, Z. Naturforsch., 1979, 34b, 957–968 CrossRef CAS.
- M. Witschas, H. Eckert, H. Freiheit, A. Putnis, G. Korus and M. Jansen, J. Phys. Chem. A, 2001, 105, 6808–6816 CrossRef CAS.
- D. Wilmer, H. Feldmann and R. E. Lechner, Phys. Chem. Chem. Phys., 2002, 4, 3260–3265 RSC.
- Z. Zhang, P. N. Roy, H. Li, M. Avdeev and L. F. Nazar, J. Am. Chem. Soc., 2019, 141, 19360–19372 CrossRef CAS PubMed.
- J. G. Smith and D. J. Siegel, Nat. Commun., 2020, 11, 1–11 CrossRef PubMed.
- K. Sau and T. Ikeshoji, J. Phys. Chem. C, 2020, 124, 20671–20681 CrossRef CAS.
- Z. Zhang and L. F. Nazar, Nat. Rev. Mater., 2022, 7, 389–405 CrossRef.
- K. Funke, Prog. Solid State Chem., 1993, 22, 111–195 CrossRef CAS.
- V. I. Nikolaev, J. Russ. Phys.-Chem. Soc., 1929, 61, 939 CAS.
- M. Conrad, M. Joos, S. Bette, R. E. Dinnebier, J. Maier and Th. Schleid, Dalton Trans., 2021, 50, 12292–12300 RSC.
- M. Joos, M. Conrad, S. Bette, R. Merkle, R. E. Dinnebier, Th. Schleid and J. Maier, J. Phys. Chem. Solids, 2022, 160, 110299 CrossRef CAS.
- K. Mereiter and A. Preisinger, Z. Kristallogr., 1984, 169, 95–107 CrossRef CAS.
- M. Joos, M. Conrad, R. Merkle, Th. Schleid, J. Maier, R. E. Dinnebier and S. Bette, Dalton Trans., 2021, 50, 6949–6991 RSC.
- C. Wickleder and P. Larsen, Z. Naturforsch., 2002, 57b, 1419–1426 CrossRef.
- J. M. Bakker, G. B. Deacon, C. M. Forsyth, P. C. Junk and M. Wiecko, Eur. J. Inorg. Chem., 2010, 2813–2825 CrossRef CAS.
- W. Schranz, Phase Transitions, 1994, 51, 1–66 CrossRef CAS.
- A. Fuith, Phase Transitions, 1997, 62, 1–93 CrossRef CAS.
- D. W. Plester, S. E. Rogers and A. R. Ubbelohde, Proc. R. Soc. London. Ser. A. Math. Phys. Sci., 1956, 235, 469–481 CAS.
- M. Joos, PhD thesis, University of Stuttgart, 2021.
- A. Kuhn, S. Narayanan, L. Spencer, G. Goward, V. Thangadurai and M. Wilkening, Phys. Rev. B: Condens. Matter Mater. Phys., 2011, 83, 1–11 CrossRef.
- J. Waugh and E. Fedin, Sov. Phys.-Solid State, 1963, 4, 1633–1636 Search PubMed.
- J. Viger-Gravel, I. Korobkov and D. L. Bryce, Cryst. Growth Des., 2011, 11, 4984–4995 CrossRef CAS.
- M. Witschas, H. Eckert, D. Wilmer, R. D. Banhatti, K. Funke, J. Fitter, R. E. Lechner, G. Korus and M. Jansen, Z. Phys. Chem., 2000, 214, 643 CAS.
- O. Reckeweg, A. Schulz, B. Blaschkowski, Th. Schleid and F. J. DiSalvo, Z. Naturforsch., 2014, 69b, 17–24 CrossRef.
- H. T. Stokes, D. M. Hatch and B. J. Campbell, ISODISTORT, ISOTROPY Software Suite, https://iso.byu.edu Search PubMed.
- B. J. Campbell, H. T. Stokes, D. E. Tanner and D. M. Hatch, J. Appl. Crystallogr., 2006, 39, 607–614 CrossRef CAS.
- C. R. A. Catlow, J. Corish, K. M. Diller, P. W. M. Jacobs and M. J. Norgett, J. Phys. C-Solid State Phys., 1979, 12, 451–464 CrossRef CAS.
- J. C. Dyre, P. Maass, B. Roling and D. L. Sidebottom, Reports Prog. Phys., 2009, 72, 15 Search PubMed.
- K. Funke, Solid State Ionics, 1988, 28–30, 100–107 CrossRef.
- M. Joos, M. Conrad, S. Bette, R. Merkle, R. E. Dinnebier, Th. Schleid and J. Maier, Phys. Chem. Chem. Phys., 2022 10.1039/D2CP01841A.
- L. Zhou, A. Assoud, Q. Zhang, X. Wu and L. F. Nazar, J. Am. Chem. Soc., 2019, 141, 19002–19013 CrossRef CAS PubMed.
- L. Zhou, N. Minafra, W. G. Zeier and L. F. Nazar, Acc. Chem. Res., 2021, 54, 2717–2728 CrossRef CAS PubMed.
- S. Lorger, R. E. Usiskin and J. Maier, Adv. Funct. Mater., 2019, 29, 1–11 CrossRef.
- B. Wang, C. Chakoumakos, B. C. Sales, B. S. Kwak and J. B. Bates, J. Solid State Chem., 1995, 115, 313–323 CrossRef CAS.
- C. N. Wijayasekera and B. E. Mellander, Solid State Ionics, 1991, 45, 293–298 CrossRef CAS.
- B. G. Kale, Indian J. Pure Appl. Phys., 1991, 29, 738–740 CAS.
- S. Pizzini, J. Appl. Electrochem., 1971, 1, 153–161 CrossRef CAS.
- M. A. K. L. Dissanayake, M. A. Careem, P. W. S. K. Bandaranayake and C. N. Wijayasekera, Solid State Ionics, 1991, 48, 277–281 CrossRef CAS.
- A.-M. Josefson and A. Kvist, Z. Naturforsch., 1969, 24a, 466–468 CrossRef.
- A. Kvist, Z. Naturforsch., 1967, 22a, 208–212 CrossRef.
- M. Tachez, J. Malugani, R. Mercier and G. Robert, Solid State Ionics, 1984, 14, 181–185 CrossRef CAS.
- D. Prutsch, B. Gadermaier, H. Brandstätter, V. Pregartner, B. Stanje, D. Wohlmuth, V. Epp, D. Rettenwander, I. Hanzu and H. M. R. Wilkening, Chem. Mater., 2018, 30, 7575–7586 CrossRef CAS.
- K. Homma, M. Yonemura, T. Kobayashi, M. Nagao, M. Hirayama and R. Kanno, Solid State Ionics, 2011, 182, 53–58 CrossRef CAS.
- M. Jansen and U. Henseler, J. Solid State Chem., 1992, 99, 110–119 CrossRef CAS.
- A. Hayashi, S. Hama, H. Morimoto, M. Tatsumisago and T. Minami, J. Am. Ceram. Soc., 2001, 84, 477–479 CrossRef CAS.
- L. Börjesson and L. M. Torell, Proc. Electrochem. Soc., 1986, 86–1, 21–28 CrossRef.
- R. W. Impey, M. L. Klein and I. R. McDonald, J. Phys. C-Solid State Phys., 1984, 17, 3941–3944 CrossRef CAS.
- N. Verdal, T. J. Udovic, V. Stavila, W. S. Tang, J. J. Rush and A. V. Skripov, J. Phys. Chem. C, 2014, 118, 17483–17489 CrossRef CAS.
- K. E. Kweon, J. B. Varley, P. Shea, N. Adelstein, P. Mehta, T. W. Heo, T. J. Udovic, V. Stavila and B. C. Wood, Chem. Mater., 2017, 29, 9142–9153 CrossRef CAS.
- F. Wang, H. A. Evans, K. Kim, L. Yin, Y. Li, P. C. Tsai, J. Liu, S. H. Lapidus, C. M. Brown, D. J. Siegel and Y. M. Chiang, Chem. Mater., 2020, 32, 8481–8491 CrossRef CAS.
- S. Muy, R. Schlem, Y. Shao-Horn and W. G. Zeier, Adv. Energy Mater., 2021, 11, 1–14 Search PubMed.
- T. J. Udovic, M. Matsuo, A. Unemoto, N. Verdal, V. Stavila, A. V. Skripov, J. J. Rush, H. Takamura and S. I. Orimo, Chem. Commun., 2014, 50, 3750–3752 RSC.
- C. Dietrich, M. Sadowski, S. Sicolo, D. A. Weber, S. J. Sedlmaier, K. S. Weldert, S. Indris, K. Albe, J. Janek and W. G. Zeier, Chem. Mater., 2016, 28, 8764–8773 CrossRef CAS.
- A. Buljan, P. Alemany and E. Ruiz, J. Phys. Chem. A, 1997, 101, 1393–1399 CrossRef CAS.
Footnotes |
| † Electronic supplementary information (ESI) available. See DOI: https://doi.org/10.1039/d2cp01837c |
| ‡ Present address: Institut für Photovoltaik, University of Stuttgart, Pfaffenwaldring 47, 70569 Stuttgart, Germany. |
| This journal is © the Owner Societies 2022 |

