Low-frequency dynamics in ionic liquids: comparison of experiments and the random barrier model†
Yangyang
Wang

Center for Nanophase Materials Sciences, Oak Ridge National Laboratory, Oak Ridge, Tennessee 37831, USA. E-mail: wangy@ornl.gov
First published on 22nd June 2022
Abstract
By examining the fine features of dielectric spectra of ionic liquids, we show that the derivative of real permittivity progressively broadens at low frequencies when the glass transition is approached from above. This phenomenon, ubiquitous and yet difficult to ascertain in the widely used conductivity or modulus representations, is not captured by the popular analytical ac universality equations based on the random barrier model. Numerical simulations with the random barrier model reveal that the observed low-frequency broadening is associated with the contributions from high activation energy pathways, suggesting a direct connection between relaxation time distribution and barrier distribution. While the overall prediction of the random barrier model about ac conduction is insensitive to the distribution of activation energy in the extreme disorder limit, the fine features of the derivative spectra contain further information about the energy landscape. These results demonstrate the usefulness of derivative analysis of the dielectric spectra of ionic liquids and glasses at low frequencies, where materials exhibit individual characteristics despite apparent ac universality. The use of numerical solutions of the random barrier model improves the description of the dielectric spectra of the ionic materials studied herein, in some cases, eliminating the need of introducing ad hoc relaxation processes at low frequencies. Lastly, a new analytical equation is proposed to take into account the low-frequency spectrum broadening phenomenon while preserving the universal ac conductivity behavior predicted by the random barrier model.
1 Introduction
This study concerns the interpretation of low-frequency dynamics in liquids and glasses with high concentrations of ionic species, such as molten salts, room-temperature ionic liquids, and polymerized ionic liquids, whose dielectric spectra are often characterized by the so-called ac universality.1–6 While the exact meaning of “universality” may be still philosophically debatable, the emerging common features of conductivity spectra of ionic liquids and disordered solids have prompted extensive experimental, theoretical, and computational investigations over the past several decades. Among these efforts, the random barrier model (RBM)6–15 and its analytical approximations have turned out to be a particularly useful and illuminating theoretical approach.16–20 For example, the following RBM-based formula has been successfully applied to many ionic materials: | (1) |
![[small sigma, Greek, tilde]](https://www.rsc.org/images/entities/i_char_e10d.gif) * ≡ σ*/σ0, and ω by a characteristic relaxation time τ,
* ≡ σ*/σ0, and ω by a characteristic relaxation time τ, ![[small omega, Greek, tilde]](https://www.rsc.org/images/entities/i_char_e10f.gif) ≡ ωτ. In addition, recent studies suggest that the random barrier model might be applicable to the mean-squared displacements and linear viscoelastic properties of glass-forming liquids.21,22
≡ ωτ. In addition, recent studies suggest that the random barrier model might be applicable to the mean-squared displacements and linear viscoelastic properties of glass-forming liquids.21,22
The current investigation is directly motivated by the observation that the RBM appears to consistently miss some fine features of dielectric spectra of many ionic liquids at low frequencies.23Fig. 1 presents an example of the dielectric spectrum of 1-butyl-3-methylimidazolium acetate [BMIm][OAc] at 233 K. Evidently, the use of eqn (1) alone is inadequate, and a full description of complex permittivity requires the consideration of an additional low-frequency relaxation process. Recent studies have shown that mesoscopic structures can manifest themselves in the dielectric spectra of ionic liquids at low frequencies.24,25 Interestingly, as shall be demonstrated below, the aforementioned discrepancy between experiments and RBM-based ac universality equations persists in many materials without mesoscopic aggregates. As eqn (1) is derived from theoretical and computational studies of the random barrier model, one may naturally wonder if the observed deviation points to some missing theoretical ingredients in the RBM along with our current understanding of the conduction mechanism in ionic liquids in general.26
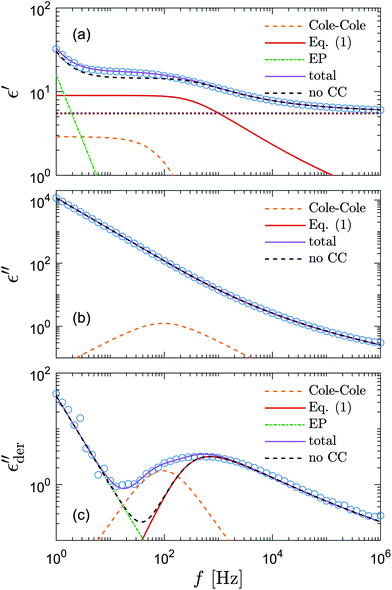 | ||
Fig. 1 Example of fitting of the dielectric spectrum of a representative ionic liquid 1-butyl-3-methylimidazolium acetate [BMIm][OAc] with eqn 1. Complex conductivity σ* predicted by eqn 1 is converted to complex permittivity ε* through the relation σ* = iωε0ε*. In order to describe the spectrum in the entire frequency range, a power-law term is added to account for the effect of electrode polarization (EP) on the real part of permittivity at low frequencies:  . And a Cole–Cole (CC) process is also needed for intermediate frequencies: . And a Cole–Cole (CC) process is also needed for intermediate frequencies:  . Blue circles: experimental data. Lines: fittings. The real, imaginary, and derivative . Blue circles: experimental data. Lines: fittings. The real, imaginary, and derivative  spectra are shown in panels (a), (b), and (c), respectively. The horizontal dotted line in panel (a) indicates the contribution from the “infinite-frequency” permittivity ε∞. The black dashed line represents the fitting result without the contribution from the Cole–Cole process. The experimental temperature is 223 K. spectra are shown in panels (a), (b), and (c), respectively. The horizontal dotted line in panel (a) indicates the contribution from the “infinite-frequency” permittivity ε∞. The black dashed line represents the fitting result without the contribution from the Cole–Cole process. The experimental temperature is 223 K. | ||
The present study draws upon the derivative analysis technique,27–32 which is an effective method for revealing fine spectral features of ionic materials at low frequencies. After laying down the essential technical details in Section 2, we examine both the “polarization component” of imaginary permittivity  and derivative spectrum
  of several analytical approximations to the RBM6,15 in Section 3.1 and compare the theoretical predictions with experimental data in Section 3.2. We show that the effective-medium approximation leads to Debye-like low-frequency behavior, with
  . By contrast, the hopping model with the diffusion cluster approximation produces a completely different low-frequency response: for small fractal dimension Df,
  , where the exponent γ < 0. Our derivative analysis of the experimental data reveals a lack of universality for the low-frequency ionic dynamics, where the underlying relaxation (retardation) time distribution is much broader than a Debye process, and the degree of spectrum broadening increases with the decrease of temperature. These experimental features are not captured by the analytical equations considered herein.
To resolve the apparent discrepancy between theory and experiment, we turn to numerical simulations of the random barrier model in Sections 3.3 and 3.4. We show that the RBM is in fact capable of producing low-frequency spectrum broadening when the high activation energy pathways above the bond percolation threshold are properly considered. While these links make no significant contribution to conduction, they clearly manifest themselves in real permittivity and its derivatives. Using the energy cutoff as an additional adjustable parameter, the dielectric spectra of many samples can be satisfactorily described by the RBM without introducing any ad hoc relaxation processes at low frequencies.
More generally, this work demonstrates that derivative analysis is a useful approach for identifying individual characteristics of ionic liquids and glasses, when their ac conductivity spectra “look more or less the same.”6 Experimentally, the low-frequency derivative spectra are material and temperature dependent. On the other hand, within the framework of the random barrier model, it is shown that the shape of the low-frequency derivative spectra is sensitive to the details of the activation energy distribution. Despite the apparent ac universality, the low-frequency dynamics of ionic materials exhibit “individuality” and deserve further investigations in the future.
2 Materials and methods
2.1 Broadband dielectric spectroscopy
Two ionic liquids, 1-ethyl-3-methylimidazolium ethyl sulfate [EMIm][EtSO4] and 1-butyl-3-methylimidazolium bis(trifluoromethylsulfonyl)imide [BMIm][NTf2], were obtained from Sigma Aldrich. Ionic liquids with amphiphilic structures can exhibit mesomorphic behavior even as a single phase, and additional dielectric relaxation processes can arise at low frequencies.24,25,33 By contrast, the imidazolium ionic liquids in this study have relatively short alkyl groups, and such complications were thus avoided. Additionally, the behavior of a model ionic glass former, CKN ([Ca(NO3)2]0.4[KNO3]0.6), was also investigated. Potassium nitrate (KNO3) and calcium nitrate tetrahydrate [Ca(NO3)2·4H2O] were purchased from Sigma Aldrich. The two salts were mixed with the aid of a small amount of deionized water (Millipore 18 MΩ cm) and subsequently dried under flowing nitrogen gas in a chemical hood. The mixture was further dried at 130 °C in a vacuum oven overnight. Finally, the salt was heated up to 180 °C on a hot plate, poured into the dielectric liquid sample cell, and sealed in the molten state. The sample cell was immediately placed on a cold surface to quench the CKN into the glassy state (Tg ≈ 335 K). The dc conductivities of our CKN sample at various temperatures above Tg are consistent with the literature data.34,35Broadband dielectric spectroscopy measurements of [EMIm][EtSO4], [BMIm][NTf2], and CKN were carried out using a Novocontrol Concept 40 system in the frequency range 0.1–107 Hz. To minimize the interference of electrode polarization (EP)36,37 on the low-frequency spectrum, a parallel-plate capacitor with a large gap of 2.5 mm was used. To suppress crystallization, all the samples were first supercooled at a fast quenching rate and the temperature was then gradually raised for the dielectric spectroscopy measurements, with an equilibrium time of 15 minutes at each experimental temperature.
2.2 Derivative analysis
The electrical properties of materials can be represented and analyzed in different interrelated quantities such as complex permittivity, conductivity, and electrical modulus. For example, complex conductivity σ*(ω) and permittivity ε*(ω) are related by the equation, σ*(ω) = σ′ + iσ′′ = iωε0ε*(ω) = ωε0(ε′′ + iε′). Although different electrical material functions are, in theory, equivalent to each other, the subtlety of using different representations has long been recognized, discussed, and debated in the literature.4,17,38–43 For ionic materials, the low-frequency spectrum of real conductivity σ′(ω) is typically dominated by dc conduction, and so is the imaginary permittivity ε′′(ω) = σ′(ω)/ε0ω, masking any other potentially interesting dynamic processes.There are at least two strategies for examining low-frequency dynamics in ionic materials.27–29 One can inspect the “polarization component” of dielectric loss by subtracting the dc contribution from the total real conductivity:  .28,29,44,45 On the other hand, one can analyze the derivative permittivity spectrum
  by utilizing the information offered by the imaginary conductivity: ε′ = σ′′(ω)/ε0ω.28–31,46 Here we follow the notation in ref. 30 and include a prefactor π/2 in the definition of
  , although this is not essential.29 It should be noted that while analyzing
  is generally feasible in theoretical studies, subtraction of dc conductivity for experimental data is not always straightforward. By contrast, the derivative analysis is well defined, offering a convenient route to better resolve “buried” relaxation processes in ionic materials.
To further illustrate the theoretical basis for derivative analysis, it is helpful to consider the phenomenological framework for dielectric relaxation,17,47,48 where the real and imaginary parts of complex permittivity (ε* ≡ ε′ − iε′′) can be expressed as:
 | (2) |
 | (3) |
 and
and  , conform with the Kramers–Kronig Relations:17,48,49
 | (4) |
 | (5) |
 typically takes the form of a series of superimposed peaks because
 | (6) |
This property makes the derivative spectrum more informative than the real permittivity spectrum itself. Therefore, when a direct analysis of the polarization component of dielectric loss  is plagued by the uncertainties associated with a subtraction error, the derivative analysis of real permittivity provides a robust and unambiguous approach for studying the dynamics of ionic materials besides dc conduction.
It should be emphasized that the current study is confined to melts and glasses with high concentrations of ionic species. The dielectric spectrum of such systems is dominated by the microscopic motion of ions in both the ac and dc regions. By contrast, for electrolyte solutions32 or dipolar liquids with a small amount of ionic impurities,31 while the derivative analysis still applies, the obtained spectrum  generally has little to do with “ionic dynamics.”
2.3 Computational methods
To put our analysis in perspective, in addition to eqn (1), we have examined other forms of RBM-based ac universality equations that were extensively studied and reviewed by Dyre and coworkers.6 The purpose of this exercise is to understand what features some of the existing analytical formulas are able to predict for the derivative spectra. Nevertheless, our investigation is not meant to be exhaustive, and we include here four more equations. The first equation is the so-called effective-medium approximation (EMA) formula [eqn (7)], which can be derived from the random barrier model by assuming an effective spatial homogeneity:6,50![[small sigma, Greek, tilde]](https://www.rsc.org/images/entities/i_char_e10d.gif) *ln *ln![[thin space (1/6-em)]](https://www.rsc.org/images/entities/char_2009.gif) ![[small sigma, Greek, tilde]](https://www.rsc.org/images/entities/i_char_e10d.gif) * = i * = i![[small omega, Greek, tilde]](https://www.rsc.org/images/entities/i_char_e10f.gif) | (7) |
The second equation is the percolation path approximation (PPA) formula [eqn (8)] for the RBM in the opposite limit, which assumes that the conducting path in a percolated network is strictly one dimensional:13,51
 | (8) |
Additionally, one can consider conduction paths with fractal dimensions (Df) that lie in between these two extremes with the diffusion cluster approximation (DCA) formula [eqn (9)]:6,13
 | (9) |
Lastly, for completeness, we include another popular ac universality equation due to Dyre:16,50,52
 | (10) |
In this study, eqn (1) and (7)–(9) are numerically solved on the proper branch cuts with the nonlinear equations solver in MATLAB. To avoid optimization with complex quantities, these equations are first cast into real forms by expressing complex conductivity in Euler's form: ![[small sigma, Greek, tilde]](https://www.rsc.org/images/entities/i_char_e10d.gif) * (
* (![[small omega, Greek, tilde]](https://www.rsc.org/images/entities/i_char_e10f.gif) ) = α(
) = α(![[small omega, Greek, tilde]](https://www.rsc.org/images/entities/i_char_e10f.gif) )eiβ(
)eiβ(![[small omega, Greek, tilde]](https://www.rsc.org/images/entities/i_char_e10f.gif) ). We note that eqn (1) can be regarded as a “hybrid” model of EMA [eqn (7)] and DCA [eqn (9)], and is “synthesized” to provide the best description of the numerical simulations of the random barrier model.15
). We note that eqn (1) can be regarded as a “hybrid” model of EMA [eqn (7)] and DCA [eqn (9)], and is “synthesized” to provide the best description of the numerical simulations of the random barrier model.15
To gain further insight into the potential limitations of the existing analytical ac universality equations, we have also performed numerical investigations with the random barrier model.6–15 Our solution technique follows that of Schrøder,14,53 which exploits the graph theory representation54,55 of master equations to solve the current autocorrelation function. Five different distributions p(Ẽ) of activation energy are examined, all expressed in reduced units (Ẽ ≡ E/E0), including: (1) uniform distribution, p(Ẽ) = 1, 0 < Ẽ < 1; (2) exponential distribution, p(Ẽ) = 2e−2Ẽ, 0 < Ẽ < ∞; (3) beta (2, 2) distribution, p(Ẽ) = (1 −Ẽ)Ẽ/B(2,2), 0 < Ẽ < 1; (4) beta (3,3) distribution, p(Ẽ) = (1 −Ẽ)2Ẽ2/B(3,3),0 < Ẽ < 1; (5) beta (0.5, 0.5) distribution: p(Ẽ) = (1 −Ẽ)−0.5Ẽ−0.5/B(0.5,0.5),0 < Ẽ < 1. All the calculations are carried out on a 64 × 64 × 64 simple cubic lattice with periodic boundary conditions at dimensionless inverse temperature β ≡ E0/(kBT) = 160. For each calculation, the reported result is based on at least ten independent samples.
3 Results and discussion
3.1 Analysis of AC universality equations
We start with the analysis of the analytical ac universality equations [eqn (1) and (7)–(10)]. Fig. 2(a) shows that for both the EMA equation [eqn (7)] and the PPA equation for the macroscopic model [eqn (10)], the polarization component of imaginary permittivity, , exhibits a Debye-like dispersion at low frequencies, with
  . The “hybrid” model [eqn (1)] behaves in the same manner in the low-frequency regime because by design, it is a crossover from DCA at high frequencies to EMA at low frequencies. By contrast, the hopping model with PPA [eqn (8)] and DCA [eqn (9)] displays markedly different behavior at low frequencies, where
  , with m < 0. In passing, we note that the widely used Jonscher's model,48,56
 , with n < 1, predicts a similar low-frequency dispersion:
  .48
.48
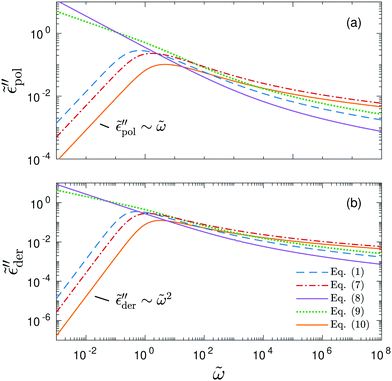 | ||
Fig. 2 Permittivities predicted by various RBM-based ac universality equations: (a) “polarization component” of imaginary permittivity  and (b) derivative spectrum and (b) derivative spectrum  . The corresponding equations are described in the main text. Df =4/3 is used for the calculations with the DCA equation [eqn (9)]. . The corresponding equations are described in the main text. Df =4/3 is used for the calculations with the DCA equation [eqn (9)]. | ||
Because of the close relation between the real ε′ and imaginary  permittivities [eqn (2)–(6)], the derivative spectra
  as shown in Fig. 2(b) are qualitatively similar but not identical to
  . The derivative permittivities predicted by the EMA equation [eqn (7)], macroscopic model with PPA [eqn (10)], and hybrid model [eqn (1)] exhibit the same low-frequency power-law behavior as the Debye model, with
  . On the other hand, the derivative spectra of the hopping model with PPA [eqn (8)] and DCA [eqn (9)] do not converge to zero at low frequencies:
  , with k < 0.
The above analysis demonstrates that the low-frequency dynamics of ionic systems can be conveniently analyzed in proper forms of complex permittivity ( or
or  ), where the spectra take the form of superimposed peaks [eqn (3) and (6)]. On the other hand, such information cannot be directly obtained from real conductivity. In the literature, the complex electrical modulus (M* = 1/ε*) is another popular quantity for representing the properties of ionic materials.39,57–60 In particular, the transition from ac to dc conduction often appears as a peak in the imaginary electrical modulus, M′′ = ε′′/[(ε′)2 + (ε′′)2], providing a simple method to determine the phenomenological “conductivity relaxation time.” However, M′′ suffers similar drawbacks as σ′ at low frequencies because of the dominant contribution of dc conduction. Additionally, M′′ is also affected by the behavior of ε′. We also see that the predictions of the analytical ac universality equations [eqn (1), (7), (8), (9) and (10)] about the low-frequency dynamics fall into two categories: the EMA [eqn (7)], macroscopic PPA [eqn (10)], and hybrid [eqn (1)] equations predict Debye-like dispersion at low frequencies, whereas the hopping model PPA [eqn (8)], DCA [eqn (9)], and Jonscher's equations lead to non-vanishing dielectric loss for the polarization component
  . A question now arises: which type of prediction is observed in experiments? Furthermore, is the behavior of slow dynamics universal? The following section thus zeroes in on the permittivity spectra of several representative ionic materials, using the experimental data collected in our lab as well as those in the literature. Because of the uncertainty associated with the subtraction of dc conductivity in computing the polarization component of permittivity
  , we focus our analysis on the derivative spectra
  .
.
3.2 Comparison with experiments
Fig. 3 shows the derivative spectra of various ionic systems, along with the predictions by eqn (1) (the “hybrid” model).15 To produce a proper comparison, the theoretical curve is horizontally shifted by adjusting the characteristic relaxation time in the model and vertically shifted by choosing an appropriate value for the dielectric relaxation strength Δε ∝ σ0τ/ε0. At high temperatures, eqn (1) provides an excellent description of the derivative spectrum of [EMIm][EtSO4] on both the high- and low-frequency sides of the peak [Fig. 3(a)]. However, as the temperature is lowered towards the glass transition, the low-frequency side of the derivative peak becomes increasingly broader. A similar behavior is also observed in [BMIm][NTf2] [Fig. 3(b)]. The case of CKN is slightly more complicated: because of the high intrinsic conductivity,34,61 electrode polarization and bulk response are not well separated even in the presence of a large capacitor gap [Fig. 3(c)]. However, by modeling EP by a power-law ε′∼ Afn,46 it is clear that a significant portion of the low-frequency derivative spectrum is unaccounted for by eqn (1). In other words, the low-frequency dispersion of ionic dynamics in CKN is much broader than a Debye process as well. Lastly, we apply the derivative analysis to the (Na2O)x(GeO2)1−x data reported by Sidebottom.5 The derivative spectrum is obtained from an apparent fitting of the reported real permittivity ε′(f) [inset of Fig. 3(d)]. The low-frequency spectrum broadening is also evident [Fig. 3(d)], although the high-frequency derivative spectrum is well described by eqn (1) over a wide frequency range. These observations (Fig. 3) are consistent with the previous analyses of ε′′ or in the literature.44,62 Nevertheless, these early data apparently have not attracted sufficient attention in recent studies. Finally, we point out that similar low-frequency spectrum broadening has also been reported for electronic semiconductors such as amorphous silicon and germanium around liquid nitrogen temperatures.27–29
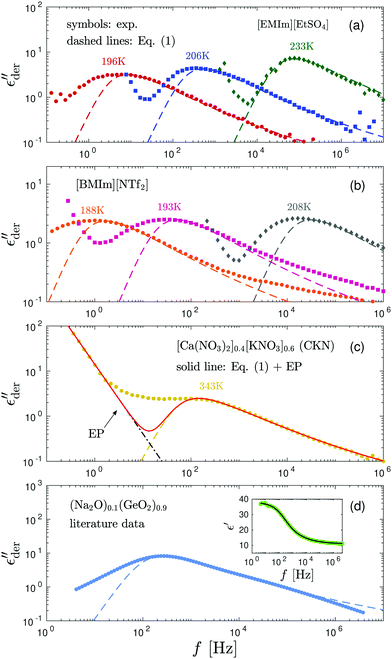 | ||
Fig. 3 Derivative spectra of various ionic glass-forming systems: (a) [EMIm][EtSO4], (b) [BMIm][NTf2], (c) [Ca(NO3)2]0.4[KNO3]0.6, and (d) (Na2O)0.1(GeO2)0.9.5 Dashed lines: “Fittings” by eqn (1). The dash-dotted line in panel (c) describes the contribution of electrode polarization (EP) to the low-frequency spectrum. The solid line in panel (c) is the combined contribution from EP and the hybrid model. For the (Na2O)0.1(GeO2)0.9 data from Sidebottom,5 the derivative spectrum is computed from an apparent fitting of the reported real permittivity ε′(f) (inset) with a “double Boltzmann” equation: ε′ = ε0 + Ap/(1 + e(ln![[thin space (1/6-em)]](https://www.rsc.org/images/entities/char_2009.gif) f − ln f − ln![[thin space (1/6-em)]](https://www.rsc.org/images/entities/char_2009.gif) f1)Γ1) + A(1 − p)/(1 + e(ln f1)Γ1) + A(1 − p)/(1 + e(ln![[thin space (1/6-em)]](https://www.rsc.org/images/entities/char_2009.gif) f − ln f − ln![[thin space (1/6-em)]](https://www.rsc.org/images/entities/char_2009.gif) f2)Γ2). We note that the functional form of the apparent fit is not of critical importance for the current analysis. For example, fitting the data of ε′ vs. ln f2)Γ2). We note that the functional form of the apparent fit is not of critical importance for the current analysis. For example, fitting the data of ε′ vs. ln![[thin space (1/6-em)]](https://www.rsc.org/images/entities/char_2009.gif) f with a ninth degree polynomial yields an almost identical derivative spectrum below ∼104 Hz. Similar to the case of CKN, the low-frequency upturns in [EMIm][EtSO4] and [BMIm][NTf2] are due to electrode polarization. f with a ninth degree polynomial yields an almost identical derivative spectrum below ∼104 Hz. Similar to the case of CKN, the low-frequency upturns in [EMIm][EtSO4] and [BMIm][NTf2] are due to electrode polarization. | ||
While the derivative spectra  of the present ionic systems display individual characteristics at low frequencies, their corresponding real conductivity spectra σ′(f) conform with the known ac universality and fall onto a mastercurve after proper scaling (Fig. 4). Additionally, eqn (1) provides a reasonable description of the universal mastercurve. This result should be hardly surprising: the dominating contribution from dc conduction completely eclipses any other low-frequency dynamic processes.
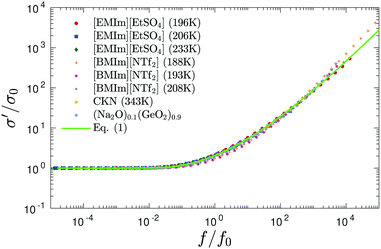 | ||
| Fig. 4 “Universal” master curve for the same data as shown in Fig. 3. To create the master curve, σ′ is normalized by dc conductivity σ0, and a horizontal shift factor f0 is applied to frequency f. Solid lines: Prediction of eqn (1). | ||
How do we interpret the discrepancy between theory and experiment at low frequencies? We note that the different low-frequency behaviors of EMA and DCA equations likely arise from their distinct treatments of spatial inhomogeneity. While the effective-medium approximation assumes an effective spatial homogeneity, the diffusion cluster approximation considers the fractal dimension in which conduction effectively takes place. Therefore, it is not unreasonable to associate the observed spectrum broadening in experiments with the heterogeneous molecular dynamics in glass-forming systems, although the exact nature of “dynamic heterogeneity” itself is still a subject of considerable debate. On the surface, the increasing degree of spectrum broadening with the decrease of temperature does seem to resemble the behavior of some dipolar glass-forming liquids (e.g., pages 179, 191, and 246 of ref. 48). Additionally, there is a close connection between ionic transport and structural relaxation in glass-forming liquids in general.19,61 There is also evidence that the decoupling of ionic transport from structural relaxation in polymers as well as ionic liquids finds its origin in phenomena related to glass transition.32,63 We thus argue that the ac universality picture must be supplemented with “individual characteristics” in order for us to properly understand the ionic transport mechanism in the broader context of the glass transition phenomenon.
3.3 Comparison with RBM simulations
To get a deeper understanding of the observed low-frequency spectrum broadening phenomenon, we turn to numerical simulations of the random barrier model6–15 with different distributions p(Ẽ) of activation energy. The technical details of the calculations can be found in Section 2 and the previous studies by Schrøder and Dyre.6,14,15,53 It is well known that percolation often plays a pivotal role in the electrical conduction of disordered materials.64,65 For a given distribution p(Ẽ), one can define “percolation energy” Ec that is associated with the bond percolation threshold pc:6,14,15,66 | (11) |
For computer simulations of the RBM, it typically suffices to apply an energy cutoff Ẽcut slightly above the percolation threshold to speed up calculations and avoid numerical problems:14,15
 | (12) |
Fig. 5 presents the simulation results of the RBM at dimensionless inverse temperature β = 160 for different cutoff parameters k. Here, the energy barriers are drawn from a uniform random distribution: p(Ẽ) = 1 (0 < Ẽ < 1). Evidently, the high activation energy pathways have no appreciable influence on the spectral shape of  at high frequencies, which is consistent with the previous study on real conductivity.15 On the other hand, the derivative spectrum becomes increasingly broader at low frequencies, as more and more high energy barriers are included with increasing cutoff threshold k. The previous RBM simulations by Schrøder and Dyre15 focus on the case of k = 6.4 for β = 160 and 320. Fig. 5 indicates that under these conditions, the deviation from eqn (2) is indeed relatively small for the derivative spectrum. On the other hand, the low-frequency dispersion broadens substantially at large k values. Ideally, one approaches the “real” solution of the RBM, when pc + k/β → 1, i.e., no link is excluded. Practically, for large β and lattice size, the calculation proves difficult, when the cutoff energy is too high. Nevertheless, we can offer two observations. First, it appears that near the peak,
  exhibits an asymptotic behavior
  for large k values (Fig. 5). Second, whenever the real permittivity can be described by the phenomenological expression of eqn (2), one always recovers the Debye behavior,
  , at sufficiently low frequencies according to eqn (6). This prediction is in accordance with the general trend shown in Fig. 5.
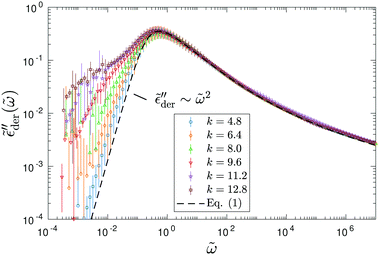 | ||
Fig. 5 Random barrier model predictions for the derivative spectrum  at β ≡ E0/kBT = 160, with different activation energy cutoffs above the percolation threshold: Ẽcut ≡ Ẽcut/E0 = pc + k/β, where pc = 0.2488 is the bond percolation threshold for the simple cubic lattice.14,15,67,68 The activation energy barrier, expressed in reduced unit Ẽcut ≡ E/E0, is drawn from a uniform distribution between 0 and 1. The dashed line represents the analytical approximation by eqn (1). Note that slightly different horizontal and vertical shift factors are needed in order to collapse the data at different cutoffs onto a master curve at high frequencies. at β ≡ E0/kBT = 160, with different activation energy cutoffs above the percolation threshold: Ẽcut ≡ Ẽcut/E0 = pc + k/β, where pc = 0.2488 is the bond percolation threshold for the simple cubic lattice.14,15,67,68 The activation energy barrier, expressed in reduced unit Ẽcut ≡ E/E0, is drawn from a uniform distribution between 0 and 1. The dashed line represents the analytical approximation by eqn (1). Note that slightly different horizontal and vertical shift factors are needed in order to collapse the data at different cutoffs onto a master curve at high frequencies. | ||
To demonstrate that the above observation is indeed general, we extend our analysis to four additional distributions of barriers: (1) exponential distribution: p(Ẽ) = 2e−2Ẽ, 0 < Ẽ < ∞; (2) beta (2,2) distribution: p(Ẽ) = (1 −Ẽ)Ẽ/B(2,2), 0 < Ẽ < 1; (3) beta (3,3) distribution: p(Ẽ) = (1 −Ẽ)2Ẽ2/B(3,3),0 < Ẽ < 1; (4) beta (0.5,0.5) distribution: p(Ẽ) = (1 −Ẽ)−0.5Ẽ−0.5/B(0.5,0.5),0 < Ẽ < 1. For the comparison to be more “meaningful,” these distributions are chosen in such a way that they have the same average barrier height:  . Similar to the calcultion for the uniform random distribution, an energy cutoff Ẽcut is applied according to the formula
  .
.
For each distribution, we first explore the influence of the cutoff parameter k on the behavior of  . On the qualitative level, the results resemble what we have found for the uniform distribution: the high-frequency behavior is insensitive to the barrier cutoff and can be described by eqn (1); for relatively small k values,
  at low frequencies and can be approximated by eqn (1) as well; on the other hand, spectrum broadening is observed when k is large. Next, we proceed to compare the predictions of different distributions for the same cutoff k. Fig. 6 shows the results for β = 160 and k = 9.6. The dashed lines in panels (a–e) depict the full distribution p(Ẽ), whereas the filled areas in these plots indicate the portion of the distribution below the cutoff energy Ẽcut. The corresponding normalized derivative spectra are presented in Fig. 6(e), along with the prediction of eqn (1) as a reference line. For the current set of parameters (β = 160 and k = 9.6), all the curves from the RBM calculations deviate from eqn (1) at low frequencies [Fig. 6(e)]. Additionally, the degree of deviations depends on the specific form of distribution, although they are cut off at the same level above the bond percolation threshold pc.
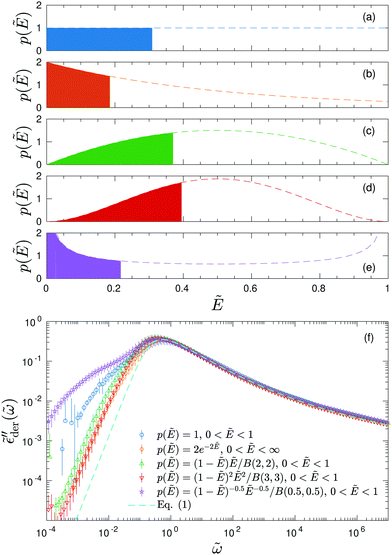 | ||
Fig. 6 Results for random barrier model calculations at β = 160 with different distributions p(Ẽ) of activation energy. (a) Uniform distribution: p(Ẽ) = 1,0 < Ẽ < 1. (b) Exponential distribution: p(Ẽ) = 2e−2Ẽ, 0 < Ẽ < ∞. (c) Beta (2,2) distribution: p(Ẽ) = (1 −Ẽ)Ẽ/B(2,2), 0 < Ẽ < 1. (d) Beta (3,3) distribution: p(Ẽ) = (1 −Ẽ)2Ẽ2/B(3,3), 0 < Ẽ < 1. (e) Beta (0.5, 0.5) distribution: p(Ẽ) = (1 −Ẽ)−0.5Ẽ−0.5/B(0.5,0.5),0 < Ẽ < 1. The distribution is cut off at an energy Ẽcut, which is evaluated according to  . The cutoff parameter k is fixed at 9.6 for these calculations. The filled areas in panels (a–e) indicate the portion of the distribution below the cutoff energy Ẽcut. Panel (e) shows the predicted derivative spectra . The cutoff parameter k is fixed at 9.6 for these calculations. The filled areas in panels (a–e) indicate the portion of the distribution below the cutoff energy Ẽcut. Panel (e) shows the predicted derivative spectra  . Similar to Fig. 5, horizontal and vertical shift factors are applied here to collapse the data onto a master curve at high frequencies. . Similar to Fig. 5, horizontal and vertical shift factors are applied here to collapse the data onto a master curve at high frequencies. | ||
The previous studies by Schrøder and Dyre demonstrate that in the extreme disorder limit, the normalized complex conductivity predicted by the RBM is insensitive to the level of energy cutoff as well as the form of barrier distribution.14,15 This conclusion holds for our current calculations. Fig. 7 presents the normalized complex conductivity of the same simulations shown in Fig. 6. Despite the differences in the derivative spectra, all the data can be collapsed onto two mastercurves for real and imaginary conductivities, respectively. Moreover, eqn (1) indeed provides a reasonable approximation for the complex conductivity over a wide frequency range. We emphasize that there is no inherent contradiction between the results as shown in Fig. 6 and 7. The fine features revealed by the derivative analysis or the polarization component of imaginary permittivity are simply concealed in the conventional conductivity representation. This can be better understood if we consider the complex permittivity [ε* = σ*(ω)/(iε0ω)]: for imaginary permittivity, the polarization component of the response is “buried” below dc conductivity; on the other hand, real permittivity approaches a constant value at low frequencies. Only by subtraction of dc conductivity or derivative analysis, we can clearly reveal the “hidden” fine features of these dielectric spectra.
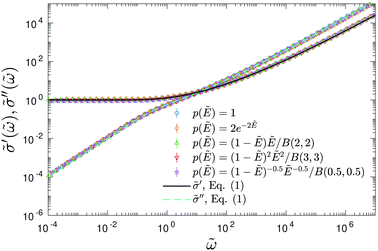 | ||
| Fig. 7 Real and imaginary parts of complex conductivity, predicted by the random barrier model with different distributions of activation energy. The parameters for the calculations are the same as those in Fig. 6, i.e., β = 160 and k = 9.6. Dashed lines: Prediction by eqn (1). All the numerical simulation data have been vertically and horizontally shifted in this analysis, i.e., the results are presented in reduced variables. | ||
3.4 Implications and Improvements
Now we must confront the question of whether the observed low-frequency spectrum broadening is actually important. After all, if the analytical approximation [eqn (1)] can capture the main features of the complex conductivity spectrum (e.g., Fig. 7), at least as far as the RBM is concerned, does it really matter if it misses certain fine details? Our answer to this question is fourfold.First, theoretically, it is clear that eqn (1) approximates only a subset of the solutions of the random barrier model, if we treat the energy cutoff as an intrinsic model parameter: eqn (1) is accurate for pc + k/β → pc; in the opposite limit of pc + k/β → 1, it fails to capture the derivative spectrum at low frequencies. As we shall show below, the analytical approximation of the RBM can be improved by a new formula [eqn (13)].
Second, derivative analysis is frequently employed to reveal slow dynamics in ionic liquids,25,69,70 where high conductivity makes it difficult to directly examine imaginary permittivity. Even for a relatively simple system without mesoscopic aggregates, the low-frequency derivative spectrum offers useful information about the individual characteristics of the ionic conductor. In this context, an accurate understanding of the prediction of the RBM for  at low frequencies is crucial. By establishing the correct reference line, any deviations from this idealized model can be properly discussed.26
Third, the numerical solutions of the RBM generally provide an improved description of the dielectric spectra of ionic liquids and glasses when the level of energy cutoff is treated as an intrinsic model parameter. Fig. 8 shows examples of such fittings for some of the data discussed in Section 3.2. For (Na2O)0.1(GeO2)0.9 and [EMIm][EtSO4] at 206 K, RBM simulations with appropriate k parameters give excellent fits to the experimental data, eliminating the need of adding ad hoc low-frequency processes. For [BMIm][NTf2] at 193 K and CKN at 343 K, while RBM simulations still offer an improvement over eqn (1), they still cannot fully account for the low-frequency dispersion of the derivative spectra. In this case, the deviation from the RBM implies that there are material specific features that are not considered by the model.
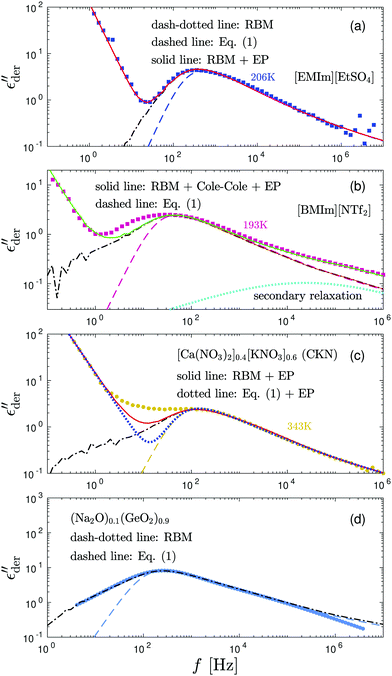 | ||
Fig. 8 Examples of fitting of the derivative spectra of ionic materials with the numerical solutions of the random barrier model (RBM). The presented results are based on calculations at β = 160 with a uniformly distributed activation energy Ẽ (0 < Ẽ < 1). The cutoff k is used as an adjustable parameter to control the dispersion of the low-frequency dynamics. Dashed lines: Predictions by eqn (1). Dash-dotted lines: Predictions of the RBM. The cutoff parameters are 6.4, 11.2, 12.8, and 9.6 for panels (a–d), respectively. The contribution of electrode polarization (EP) at low frequencies is modeled by a power-law function. A Cole–Cole function,  is used to describe the second relaxation of [BMIm][NTf2] at high frequencies. is used to describe the second relaxation of [BMIm][NTf2] at high frequencies. | ||
Fourth, our RBM simulations suggest that the low-frequency spectrum broadening is affected by the functional form of the barrier distribution and is directly linked to the contributions from high activation energy pathways. Based on this physical interpretation, we argue that analysis of the low-frequency dispersion provides a window into the potential energy landscape of ionic materials, particularly in the supercooled or glassy states. As we shall show in the Appendix, the traditional fitting method with the Kohlrausch–Williams–Watts (KWW) function cannot capture the spectrum broadening phenomenon. Compared to the fitting method with the Havriliak–Negami function, the RBM approach offers a theoretical framework for interpreting the low-frequency dynamics in a physically more meaningful way.
Finally, we seek to improve eqn (1) by incorporating low-frequency broadening into an analytical ac universality equation. Our analysis in Section 3.1 demonstrates that none of the analytical forms [eqn (1) and (7)–(10)] can properly produce the low-frequency dispersion of the derivative spectrum  . In addition, we know that eqn (1) is almost correct. A successful functional form must preserve the frequency scalings for complex conductivity: |ln
![[thin space (1/6-em)]](https://www.rsc.org/images/entities/char_2009.gif)
![[small sigma, Greek, tilde]](https://www.rsc.org/images/entities/i_char_e10d.gif) *|∝|
*|∝|![[small omega, Greek, tilde]](https://www.rsc.org/images/entities/i_char_e10f.gif) /
/![[small sigma, Greek, tilde]](https://www.rsc.org/images/entities/i_char_e10d.gif) *|2/3 at high frequencies and |ln
*|2/3 at high frequencies and |ln![[thin space (1/6-em)]](https://www.rsc.org/images/entities/char_2009.gif)
![[small sigma, Greek, tilde]](https://www.rsc.org/images/entities/i_char_e10d.gif) *|∝|
*|∝|![[small omega, Greek, tilde]](https://www.rsc.org/images/entities/i_char_e10f.gif) /
/![[small sigma, Greek, tilde]](https://www.rsc.org/images/entities/i_char_e10d.gif) *| at low frequencies. Mathematically, the low-frequency dispersion of
*| at low frequencies. Mathematically, the low-frequency dispersion of  is determined by how the real permittivity
 ![[small epsilon, Greek, tilde]](https://www.rsc.org/images/entities/i_char_e0de.gif) ′ approaches the static dielectric constant. Putting these clues together, we conjecture that spectrum broadening can be generated by controlling how the crossover from DCA [eqn (9)] to EMA [eqn (7)] occurs. A simple formula that satisfies all of our requirements is:
′ approaches the static dielectric constant. Putting these clues together, we conjecture that spectrum broadening can be generated by controlling how the crossover from DCA [eqn (9)] to EMA [eqn (7)] occurs. A simple formula that satisfies all of our requirements is:
 | (13) |
![[small sigma, Greek, tilde]](https://www.rsc.org/images/entities/i_char_e10d.gif) ′′ ∝
′′ ∝ ![[small omega, Greek, tilde]](https://www.rsc.org/images/entities/i_char_e10f.gif) 2/3 for
2/3 for ![[small omega, Greek, tilde]](https://www.rsc.org/images/entities/i_char_e10f.gif) ≫ 1 and
≫ 1 and ![[small sigma, Greek, tilde]](https://www.rsc.org/images/entities/i_char_e10d.gif) ′′ ∝
′′ ∝ ![[small omega, Greek, tilde]](https://www.rsc.org/images/entities/i_char_e10f.gif) for
for ![[small omega, Greek, tilde]](https://www.rsc.org/images/entities/i_char_e10f.gif) ≪ 1. The critical difference is that the low-frequency dispersion of
≪ 1. The critical difference is that the low-frequency dispersion of  can be tuned by parameter γ. For γ > 1, the dispersion of
  is narrower than a Debye process, i.e.,
  , with n < 2. Conversely, for γ > 1, eqn (13) produces spectrum broadening [Fig. 9(a)] at low frequencies, and the degree of broadening increases with decrease of γ. In accordance with the design of eqn (13), the predicted real and imaginary conductivities agree with those from eqn (1) [Fig. 9(b)] and thus the RBM simulations as well. Similar to the examples shown in Fig. 8 for the RBM, we can use eqn (13) to improve the description of the dielectric spectra of ionic liquids. It should be pointed out that eqn (13) does not produce the correct asymptotic behavior of
  at very low frequencies for γ < 1 (Fig. 9), where we should expect
  . Practically, however, this is not necessarily a problem, as such subtle features may not be experimentally resolvable.
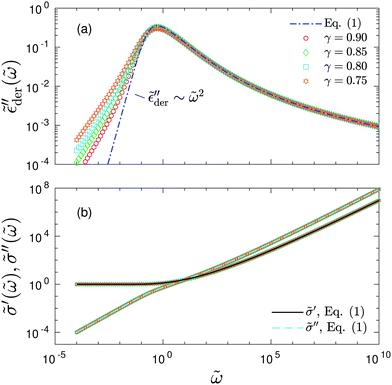 | ||
| Fig. 9 Predictions of the new “hybrid” equation [eqn (13)] with γ = 0.90, 0.85, 0.80, and 0.75. The corresponding values of A are 2.3 (for γ = 0.90), 2.2 (for γ = 0.85), 2.1 (for γ = 0.80), and 2.0 (for γ = 0.75). (a) Derivative spectra. Dash-dotted lines: Prediction of eqn (1). (b) Complex conductivity spectra for the same data. The solid and dashed lines are the real and imaginary conductivities predicted by eqn (1), respectively. | ||
4 Summary
In summary, the low-frequency dynamics of glass-forming ionic materials is analyzed in proper forms of permittivity representation. By virtue of the derivative analysis technique, we show that the ionic dynamics buried below dc conductivity generally has a broad dispersion. While the overall real conductivity exhibits universality, the low-frequency dynamics displays “individual characteristics” that are material and temperature dependent. The popular ac universality equations fail to capture the experimentally observed low-frequency spectrum broadening. Simulations with the random barrier model demonstrate that the spectrum broadening phenomenon can be accounted for by the model, if the contributions from high energy barriers are considered in the calculations. Finally, a modification of eqn (1) is proposed to improve the predictions at low frequencies, while preserving the universal ac conductivity behavior predicted by the random barrier model. By drawing attention to material “individuality” in the derivative spectrum, rather than universality, this work provides a different perspective for understanding ionic transport in disordered materials. We emphasize that there is nothing special about the ionic materials investigated in this work, other than that they have relatively “simple” structures. Our results should be relevant for transport problems in a wide array of disordered materials,6 including ionic liquids,71,72 polymerized ionic liquids,20 ionic glasses,5 molten salts,73 and certain electronic semiconductors.27–29 On the other hand, understanding the low-frequency dynamics of ionic liquids with mesoscopic structures24,25,33 and protic ionic liquids with significant contributions from Grotthuss-type mechanisms74 evidently requires additional considerations and should not be interpreted on the basis of the RBM alone.Appendix: derivative analysis of KWW function
Electrical modulus M*(ω) = M′ + iM′′ = 1/ε*(ω) has been a popular choice of the material function for analyzing the behavior of ionic melts and glasses.39,57–60 The reported complex electrical modulus is often discussed in terms of non-Debye (non-exponential) relaxation and quantified via a Kohlrausch–Williams–Watts (KWW) stretched exponential function. It is thus helpful to clarify the relation of the present work, which addresses the non-Debye low-frequency dynamics in the permittivity representation, and those in the literature in the modulus representation.Here, we consider the normalized electrical modulus ![[M with combining tilde]](https://www.rsc.org/images/entities/i_char_004d_0303.gif) *(ω) defined by a KWW relaxation function ϕ(
*(ω) defined by a KWW relaxation function ϕ(![[t with combining tilde]](https://www.rsc.org/images/entities/i_char_0074_0303.gif) ) = exp
) = exp![[thin space (1/6-em)]](https://www.rsc.org/images/entities/char_2009.gif) [−(t/τKWW)βKWW] = exp(−
[−(t/τKWW)βKWW] = exp(−![[t with combining tilde]](https://www.rsc.org/images/entities/i_char_0074_0303.gif) βKWW) through unilateral Fourier transform (Laplace transform with imaginary frequency):
βKWW) through unilateral Fourier transform (Laplace transform with imaginary frequency):
 | (14) |
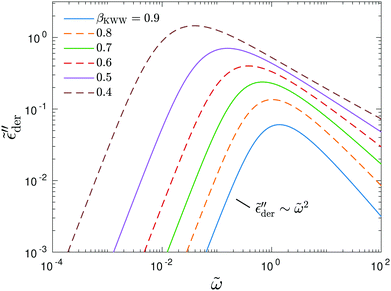
Fig. 10 shows the corresponding derivative spectrum of real permittivity,  , for different stretched exponents βKWW. Evidently, the asymptotic behavior of
  is Debye-like at low frequencies, with
  . In other words, the traditional modeling approach of the electrical modulus with the KWW function is inadequate for capturing the spectrum broadening phenomena discussed in this study. In this context, we mention that while the KWW function has been used to fit the dielectric spectra of CKN,34,75 the fine spectrum features cannot be described by this approach, as shown by the analyses in Fig. 3 and 10. Lastly, we emphasize that the present investigation focuses on low-frequency non-Debye relaxation revealed by derivative analysis, whereas the same term “non-Debye relaxation” is often used in a much broader sense in the literature.28,41
Conflicts of interest
There are no conflicts to declare.Acknowledgements
This work was supported by the Laboratory Directed Research and Development Program of the Oak Ridge National Laboratory, managed by UT-Battelle, LLC, for the US Department of Energy (DOE). The research was carried out at the Center for Nanophase Materials Sciences, which is a DOE Office of Science User Facility at the Oak Ridge National Laboratory. We thank our colleague J.-M. Y. Carrillo for discussions.References
- K. Funke, Prog. Solid State Chem., 1993, 22, 111–195 CrossRef CAS.
- K. Funke and C. Cramer, Curr. Opin. Solid State Mater. Sci., 1997, 2, 483–490 CrossRef CAS.
- B. Roling, A. Happe, K. Funke and M. Ingram, Phys. Rev. Lett., 1997, 78, 2160 CrossRef CAS.
- A. K. Jonscher, J. Phys. D: Appl. Phys., 1999, 32, R57 CrossRef CAS.
- D. L. Sidebottom, Phys. Rev. Lett., 1999, 82, 3653 CrossRef CAS.
- J. C. Dyre and T. B. Schrøder, Rev. Mod. Phys., 2000, 72, 873–892 CrossRef.
- P. Butcher, J. Phys. C: Solid State Phys., 1974, 7, 879 CrossRef.
- J. C. Kimball and L. W. Adams, Phys. Rev. B: Solid State, 1978, 18, 5851–5858 CrossRef CAS.
- H. Böttger and V. V. Bryksin, Hopping Conduction in Solids, VCH, Weinheim, 1985 Search PubMed.
- J. W. Haus and K. W. Kehr, Phys. Rep., 1987, 150, 263–406 CrossRef CAS.
- J.-P. Bouchaud and A. Georges, Phys. Rep., 1990, 195, 127–293 CrossRef.
- D. L. Stein and C. M. Newman, Phys. Rev. E: Stat. Phys., Plasmas, Fluids, Relat. Interdiscip. Top., 1995, 51, 5228 CrossRef CAS PubMed.
- T. B. Schrøder and J. C. Dyre, Phys. Rev. Lett., 2000, 84, 310–313 CrossRef PubMed.
- T. B. Schrøder and J. C. Dyre, Phys. Chem. Chem. Phys., 2002, 4, 3173–3178 RSC.
- T. B. Schrøder and J. C. Dyre, Phys. Rev. Lett., 2008, 101, 025901 CrossRef PubMed.
- J. C. Dyre, Phys. Lett. A, 1985, 108, 457–461 CrossRef.
- F. Kremer and A. Schohals, Broadband Dielectric Spectroscopy, Springer-Verlag, Berlin, 2002 Search PubMed.
- J. Sangoro, A. Serghei, S. Naumov, P. Galvosas, J. Kärger, C. Wespe, F. Bordusa and F. Kremer, Phys. Rev. E: Stat., Nonlinear, Soft Matter Phys., 2008, 77, 051202 CrossRef CAS PubMed.
- J. R. Sangoro and F. Kremer, Acc. Chem. Res., 2011, 45, 525–532 CrossRef PubMed.
- C. Gainaru, E. W. Stacy, V. Bocharova, M. Gobet, A. P. Holt, T. Saito, S. Greenbaum and A. P. Sokolov, J. Phys. Chem. B, 2016, 120, 11074–11083 CrossRef CAS PubMed.
- S. P. Bierwirth, R. Böhmer and C. Gainaru, Phys. Rev. Lett., 2017, 119, 248001 CrossRef PubMed.
- T. B. Schrøder and J. C. Dyre, J. Chem. Phys., 2020, 152, 141101 CrossRef PubMed.
- P. Griffin, A. L. Agapov, A. Kisliuk, X.-G. Sun, S. Dai, V. N. Novikov and A. P. Sokolov, J. Chem. Phys., 2011, 135, 114509 CrossRef PubMed.
- P. J. Griffin, A. P. Holt, Y. Wang, V. N. Novikov, J. R. Sangoro, F. Kremer and A. P. Sokolov, J. Phys. Chem. B, 2014, 118, 783–790 CrossRef CAS PubMed.
- T. Cosby, Z. Vicars, Y. Wang and J. Sangoro, J. Phys. Chem. Lett., 2017, 8, 3544–3548 CrossRef CAS PubMed.
- J. C. Dyre, P. Maass, B. Roling and D. L. Sidebottom, Rep. Prog. Phys., 2009, 72, 046501 CrossRef.
- N. Balkan, P. Butcher, W. Hogg, A. Long and S. Summerfield, Philos. Mag. B, 1985, 51, L7–L12 CAS.
- A. Hunt, J. Non-Cryst. Solids, 1993, 160, 183–227 CrossRef CAS.
- A. Hunt, Philos. Mag. B, 2001, 81, 875–913 CrossRef CAS.
- M. Wübbenhorst and J. van Turnhout, J. Non-Cryst. Solids, 2002, 305, 40–49 CrossRef.
- R. Richert, A. Agapov and A. P. Sokolov, J. Chem. Phys., 2011, 134, 104508 CrossRef PubMed.
- Y. Wang, A. L. Agapov, F. Fan, K. Hong, X. Yu, J. Mays and A. P. Sokolov, Phys. Rev. Lett., 2012, 108, 088303 CrossRef PubMed.
- P.-G. de Gennes and J. Prost, The Physics of Liquid Crystals, Oxford University Press, 1993, vol. 83 Search PubMed.
- F. S. Howell, R. A. Bose, P. B. Macedo and C. T. Moynihan, J. Phys. Chem., 1974, 78, 639–648 CrossRef CAS.
- M. Paluch, Z. Wojnarowska and S. Hensel-Bielowka, Phys. Rev. Lett., 2013, 110, 015702 CrossRef CAS PubMed.
- A. Serghei, J. R. Sangoro and F. Kremer, in Broadband Dielectric Spectroscopy on Electrode Polarization and Its Scaling, ed. H. Ohshima, John Wiley & Sons, Hoboken, New Jersey, 2012, book section 15 Search PubMed.
- Y. Wang, C.-N. Sun, F. Fan, J. R. Sangoro, M. B. Berman, S. G. Greenbaum, T. A. Zawodzinski and A. P. Sokolov, Phys. Rev. E: Stat., Nonlinear, Soft Matter Phys., 2013, 87, 042308 CrossRef PubMed.
- C. T. Moynihan, J. Non-Cryst. Solids, 1996, 203, 359–363 CrossRef CAS.
- C. T. Moynihan, Solid State Ionics, 1998, 105, 175–183 CrossRef CAS.
- R. Richert and H. Wagner, Solid State Ionics, 1998, 105, 167–173 CrossRef CAS.
- W. Dieterich and P. Maass, Chem. Phys., 2002, 284, 439–467 CrossRef CAS.
- I. Hodge, K. Ngai and C. Moynihan, J. Non-Cryst. Solids, 2005, 351, 104–115 CrossRef CAS.
- J. R. Macdonald, J. Phys. Chem. Solids, 2009, 70, 546–554 CrossRef CAS.
- J. Isard, J. Non-Cryst. Solids, 1970, 4, 357–365 CrossRef CAS.
- J. C. Dyre, J. Non-Cryst. Solids, 1991, 135, 219–226 CrossRef.
- Y. Wang, in Ionic Transport and Dielectric Relaxation in Polymer Electrolytes, ed. M. Paluch, Springer International Publishing, Cham, 2016, pp. 131–156 Search PubMed.
- J. R. Macdonald, J. Barlow and A. Carl, Rev. Mod. Phys., 1963, 35, 940–946 CrossRef.
- A. K. Jonscher, Dielectric Relaxation in Solids, Chelsea, Dielectrics Press, London, 1983 Search PubMed.
- J. S. Toll, Phys. Rev., 1956, 104, 1760–1770 CrossRef.
- J. C. Dyre, Phys. Rev. B: Condens. Matter Mater. Phys., 1993, 48, 12511 CrossRef CAS PubMed.
- J. C. Dyre and T. B. Schrøder, Phys. Rev. B: Condens. Matter Mater. Phys., 1996, 54, 14884 CrossRef CAS PubMed.
- J. C. Dyre, J. Appl. Phys., 1988, 64, 2456–2470 CrossRef.
- T. Schrøder, EPL, 2008, 81, 30002 CrossRef.
- J. Schnakenberg, Rev. Mod. Phys., 1976, 48, 571 CrossRef.
- M. Polettini, EPL, 2012, 97, 30003 CrossRef.
- A. K. Jonscher, Nature, 1977, 267, 673–679 CrossRef CAS.
- C. A. Angell, Chem. Rev., 1990, 90, 523–542 CrossRef CAS.
- C. T. Moynihan, J. Non-Cryst. Solids, 1994, 172, 1395–1407 CrossRef.
- K. Ngai and C. Moynihan, MRS Bull., 1998, 23, 51–56 CrossRef CAS.
- A. Ghosh and M. Sural, EPL, 1999, 47, 688 CrossRef CAS.
- Y. Wang and A. P. Sokolov, Curr. Opin. Chem. Eng., 2015, 7, 113–119 CrossRef.
- A. Owen, J. Non-Cryst. Solids, 1977, 25, 370–423 CrossRef CAS.
- P. J. Griffin, A. L. Agapov and A. P. Sokolov, Phys. Rev. E: Stat., Nonlinear, Soft Matter Phys., 2012, 86, 021508 CrossRef PubMed.
- V. Ambegaokar, B. Halperin and J. Langer, Phys. Rev. B: Solid State, 1971, 4, 2612 CrossRef.
- D. Stauffer and A. Aharony, Introduction to Percolation Theory, Taylor and Francis, 1991 Search PubMed.
- J. C. Dyre, Phys. Rev. B: Condens. Matter Mater. Phys., 1995, 51, 12276 CrossRef CAS PubMed.
- D. Stauffer, J. Adler and A. Aharony, J. Phys. A: Math. Gen., 1994, 27, L475 CrossRef.
- S. C. van der Marck, Phys. Rev. E: Stat. Phys., Plasmas, Fluids, Relat. Interdiscip. Top., 1997, 55, 1514 CrossRef CAS.
- Y. Wang, P. J. Griffin, A. Holt, F. Fan and A. P. Sokolov, J. Chem. Phys., 2014, 140, 104510 CrossRef PubMed.
- T. Cosby, A. Holt, P. J. Griffin, Y. Wang and J. Sangoro, J. Prot. Coat. Linings, 2015, 6, 3961–3965 CAS.
- J. Sangoro, C. Iacob, A. Serghei, S. Naumov, P. Galvosas, J. Kärger, C. Wespe, F. Bordusa, A. Stoppa and J. Hunger, et al. , J. Chem. Phys., 2008, 128, 214509 CrossRef CAS PubMed.
- P. J. Griffin, PhD thesis, University of Tennessee-Knoxville, 2014.
- A. Pimenov, P. Lunkenheimer, M. Nicklas, R. Böhmer, A. Loidl and C. Angell, J. Non-Cryst. Solids, 1997, 220, 93–101 CrossRef CAS.
- K.-D. Kreuer, Chem. Mater., 1996, 8, 610–641 CrossRef CAS.
- K. Ngai and R. Rendell, Phys. Rev. B: Condens. Matter Mater. Phys., 2000, 61, 9393 CrossRef CAS.
Footnote |
| † This manuscript has been authored by UT-Battelle, LLC under contract DE-AC05-00OR22725 with the US Department of Energy (DOE). The US government retains and the publisher, by accepting the article for publication, acknowledges that the US government retains a nonexclusive, paid-up, irrevocable, worldwide license to publish or reproduce the published form of this manuscript, or allow others to do so, for US government purposes. DOE will provide public access to these results of federally sponsored research in accordance with the DOE Public Access Plan (https://energy.gov/downloads/doe-publicaccess-plan). |
| This journal is © the Owner Societies 2022 |


![[triple bond, length as m-dash]](https://www.rsc.org/images/entities/char_e002.gif)
