 Open Access Article
Creative Commons Attribution 3.0 Unported Licence
Reduced nucleophilicity: an intrinsic property of the Lewis base atom interacting with H in hydrogen-bonds with Lewis acids HX (X = F, Cl, Br, I, CN, CCH, CP)†
Ibon
Alkorta
 a and
Anthony
Legon
 b
b
aInstituto de Química Médica (IQM-CSIC), Juan de la Cierva, 3, E-28006 Madrid, Spain. E-mail: ibon@iqm.csic.es; Tel: +34 915622900
bSchool of Chemistry, University of Bristol, Cantock's Close, Bristol BS8 1TS, UK. E-mail: a.c.legon@bristol.ac.uk; Tel: +44 (0)117 331 7708
First published on 13th October 2022
Abstract
Equilibrium hydrogen-bond dissociation energies De for the process B⋯HX = B + HX are calculated at the CCSD(T)(F12c)/cc-pVDZ-F12 level for ∼190 complexes B⋯HX. As established earlier, De values for such complexes can be described by the equation De = cNBEA, in which NB and EHX are the nucleophilicity and electrophilicity of the Lewis base B and the Lewis acid HX, respectively, and the constant c = 1 kJ mol−1. Graphs of De as the ordinate and EHX as the abscissa are presented for 26 series of hydrogen-bonded complexes B⋯HX. The Lewis base is fixed and HX is HF, HCl, HBr, HI, HCN, HCCH and HCP in each series. Each plot yields a good straight line, the slope of which is the nucleophilicity NB of B. The Lewis bases are chosen for their simplicity and all have at least one non-bonding electron pair carried by the atom directly involved in the B⋯HX hydrogen bond. The direction of the minimum value σmin of the molecular electrostatic surface potential on the 0.001 e bohr−3 iso-surface in the chosen bases B usually coincides with the axis of a non-bonding electron pair. The gradient of a graph of De/σmin plotted against EHX defines a reduced nucleophilicity ИB = NB/σmin in the sense that ИB appears to be a property only of the atom of B that is directly involved in the B⋯HX hydrogen bond, independent of the remainder of B. For example, the values of the reduced nucleophilicity for the series of isocyanide complexes CH3NC⋯HX, HNC⋯HX and FNC⋯HX are 0.0343(16), 0.0337(18) and 0.0332(18), respectively, while those for the corresponding series of cyanide complexes are 0.0337(23), 0.0329(24) and 0.0333(23).
1. Introduction
There have been many proposals to describe non-covalent interactions (particularly in respect of hydrogen bonding) in terms of various observable properties of the component molecules in complexes. For example, Drago and co-workers proposed a relationship between the dissociation enthalpy of hydrogen-bonded complexes and two parameters associated with the two components, one assigned to the hydrogen-bond donor and the other assigned to the hydrogen-bond acceptor.1,2 Taft and Abraham described hydrogen-bond complexation in terms of acidity α and basicity β scales of the hydrogen-bond donor and acceptor molecules, respectively,3–7 while Platts predicted α and β8–11 by means of theory. Both Steiner12–14 and Limbach15,16 discussed hydrogen bonding of complexes Y⋯HX investigated by NMR spectroscopy in terms of the distances r(X–H) and r(H⋯Y), with subsequent theoretical interpretation by Alkorta and Elguero.17,18 Relationships between electron density properties and intermolecular distances were pursued by Espinosa19 and others.20In this article we introduce the concept of a quantitative, reduced nucleophilicity associated with an isolated Lewis base B. The terms nucleophile and electrophile were first defined21 in 1933 and since then there has developed an extensive literature concerned with scales of nucleophilicity and electrophilicity, most of which are based on rates of reaction. See for example the review by Mayr and Patz.22 The subject is not without controversy.23 In 1987, an alternative definition of these quantities in terms of weak interactions between molecules was proposed, namely in terms of the intermolecular stretching force constant kσ of isolated hydrogen-bonded complexes B⋯HX formed between a Lewis base B and a Lewis acid HX. The definition was expressed by means of eqn (1):
| kσ = c′NBEHX, | (1) |
| De = cNBEHX. | (2) |
It is generally accepted that for hydrogen- and halogen-bonded complexes the intermolecular interaction has a large electrostatic contribution and geometries of complexes can be modelled on this basis.30 A popular method of describing the electrostatic charge distribution associated with a molecule is the so-called molecular electrostatic surface potential (MESP), which is the potential energy of a unit positive charge at a surface of constant electron density, with the iso-surface at which the charge density is 0.001 e bohr−3 in common usage.31 Examination of the MESP of Lewis acids such as HCl reveals that the value on the molecular axis near to H is the maximum (positive) potential σmax for the defined surface and is therefore the most electrophilic region of the molecule. In a recent article,32 we showed the quantity De/σmax is an intrinsic property of, for example, the H atom of a series of hydrogen halides HX and is independent of the atom X. Dividing eqn (2) by σmax gives
| De/σmax = cNB(EHX/σmax) = NBΞHX, | (3) |
In this article, we examine whether there is an analogous reduced nucleophilicity defined as ИB = NB/σmin. For linear and symmetric-top molecules, such as HCN and CH3CN, that carry an axial non-bonding electron pair, it is often the case that the MESP near the terminal atom is the minimum value σmin on the chosen iso-surface and is therefore the most nucleophilic region of the molecule. Dividing eqn (2) by σmin leads to
| De/σmin = c(NB/σmin)EHX = cИBEHX | (4) |
2. Theoretical methods
The geometries of the isolated monomers and complexes were optimized at the CCSD(T) (F12c) computational level34,35 with the cc-pVDZ-F12 basis set36 using the frozen-core approximation. The Cartesian coordinates of the optimized geometries are available in Table S1 of the ESI.† The equilibrium dissociation energies De were calculated as the difference between the electronic energy of the complex and the sum of those of the isolated monomers (see Table S2 of the ESI†), with correction for basis set superposition error (BSSE) using the full counterpoise method of Boys and Bernadi.37 These calculations were conducted with the MOLPRO program.38 The molecular electrostatic surface potentials (MESP) of the isolated Lewis bases were calculated at the MP2/aug-cc-pVTZ wavefunction with the GAUSSIAN program39 and analyzed on the 0.001 e bohr−3 electron density iso-surface with the Multiwfn program.40 Some MESPs used for illustrative purposes in various figures were calculated at the M06-2X/aug-cc-pVDZ level with the SPARTAN program.413. Results
3.1 Series of linear complexes B⋯HX in which the hydrogen-bond is to a terminal C atom, B = SC, SeC, OC
Fig. 1(a) shows a plot of Deversus EHX for the three series of hydrogen-bond complexes OC⋯HX, SC⋯HX and SeC⋯HX, where X = F, Cl, Br, I, CN, CCH and CP. The values of the electrophilicities EHX are set out in Table 1 for convenience and are from ref. 27, except for EHBr and EHI which are reported in ref. 42. Note that eqn (2) (with c = 1 kJ mol−1) is obeyed in good approximation by all three series, that the gradients for the Lewis bases = SC and SeC are identical but that for OC is smaller by a factor of two. Fig. 1(b) shows plots of De/σminversus EHX for the same three series. σmin is in each case the value of the MESP on the 0.001 e bohr−3 electron density iso-surface on the axis of the diatomic molecule and near to C. Values of σmin used in this article were calculated at the MP2/aug-cc-pVTZ level of theory and are listed in Table 2. The gradients of the 3 straight lines in Fig. 1(b) are identical within the fitting error, with the mean value 0.0349(4). According to eqn (4), the gradient of such lines is the reduced nucleophilicity ИB of the non-bonding electron pair associated with C in the three molecules SC, SeC and OC.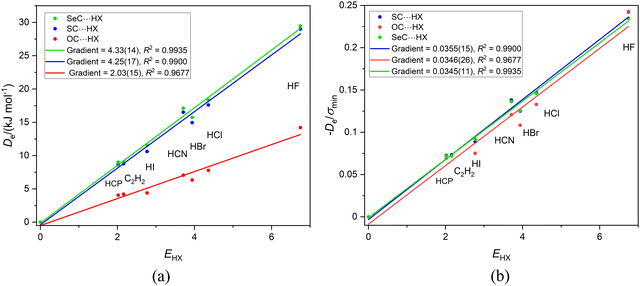 | ||
Fig. 1 (a) A plot of Deversus EHX for the series OC⋯HX, SC⋯HX and SeC⋯HX for X = F, Cl, Br, I, C![[triple bond, length as m-dash]](https://www.rsc.org/images/entities/char_e002.gif) N. C N. C![[triple bond, length as m-dash]](https://www.rsc.org/images/entities/char_e002.gif) CH and C CH and C![[triple bond, length as m-dash]](https://www.rsc.org/images/entities/char_e002.gif) P. (b) A plot of De/σmin for the same series. P. (b) A plot of De/σmin for the same series. | ||
| Lewis base | H-Bond to atomb | σ min/kJ mol−1 | Lewis base | H-Bond to atomb | σ min/kJ mol−1 |
|---|---|---|---|---|---|
| a The MESP is the potential energy of a unit positive charge (proton) at the iso-surface for which the electron density is 0.001 e bohr−3. The minimum (i.e. most negative) value of the MESP coincides in all but one case with the direction of the axis of a non-bonding electron pair carried by the H-bond acceptor atom of the Lewis base. NCl3 is an exception in that the MESP along a Cl non-bonding pair direction is actually the minimum value. b Atom involved in the hydrogen bond with the Lewis acid HX (see text). | |||||
O![[triple bond, length as m-dash]](https://www.rsc.org/images/entities/char_e002.gif) C C |
Carbon | −58.5 | H2O | Oxygen | −135.1 |
S![[triple bond, length as m-dash]](https://www.rsc.org/images/entities/char_e002.gif) C C |
Carbon | −119.7 | H2C![[double bond, length as m-dash]](https://www.rsc.org/images/entities/char_e001.gif) O O |
Oxygen | −121.4 |
Se![[triple bond, length as m-dash]](https://www.rsc.org/images/entities/char_e002.gif) C C |
Carbon | −125.6 | H2C![[double bond, length as m-dash]](https://www.rsc.org/images/entities/char_e001.gif) C C![[double bond, length as m-dash]](https://www.rsc.org/images/entities/char_e001.gif) O O |
Oxygen | −64.5 |
CH3N![[triple bond, length as m-dash]](https://www.rsc.org/images/entities/char_e002.gif) C C |
Carbon | −161.8 | (CH3)2O | Oxygen | −130.2 |
HN![[triple bond, length as m-dash]](https://www.rsc.org/images/entities/char_e002.gif) C C |
Carbon | −138.9 | Oxirene | Oxygen | −135.8 |
FN![[triple bond, length as m-dash]](https://www.rsc.org/images/entities/char_e002.gif) C C |
Carbon | −106.9 | H2S | Sulfur | −69.3 |
CH3C![[triple bond, length as m-dash]](https://www.rsc.org/images/entities/char_e002.gif) N N |
Nitrogen | −159.2 | H2C![[double bond, length as m-dash]](https://www.rsc.org/images/entities/char_e001.gif) S S |
Sulfur | −74.7 |
HC![[triple bond, length as m-dash]](https://www.rsc.org/images/entities/char_e002.gif) N N |
Nitrogen | −133.7 | (CH3)2S | Sulfur | −95.1 |
FC![[triple bond, length as m-dash]](https://www.rsc.org/images/entities/char_e002.gif) N N |
Nitrogen | −119.1 | Thiirene | Sulfur | −100.6 |
N![[triple bond, length as m-dash]](https://www.rsc.org/images/entities/char_e002.gif) N N |
Nitrogen | −35.8 | S![[double bond, length as m-dash]](https://www.rsc.org/images/entities/char_e001.gif) S S |
Sulfur | −50.3 |
P![[triple bond, length as m-dash]](https://www.rsc.org/images/entities/char_e002.gif) N N |
Nitrogen | −131.5 | H3N | Nitrogen | −155.9 |
O![[double bond, length as m-dash]](https://www.rsc.org/images/entities/char_e001.gif) C C![[double bond, length as m-dash]](https://www.rsc.org/images/entities/char_e001.gif) O O |
Oxygen | −44.6 | (CH3)3N | Nitrogen | −133.2 |
S![[double bond, length as m-dash]](https://www.rsc.org/images/entities/char_e001.gif) C C![[double bond, length as m-dash]](https://www.rsc.org/images/entities/char_e001.gif) O O |
Oxygen | −46.2 | Aza-tetrahedrane | Nitrogen | −140.2 |
| H–B | Boron | −134.5 | Cl3N | Nitrogen | −49.5 |
| H3C–B | Boron | −160.3 | H3P | Phosphorus | −67.4 |
| F–B | Boron | −89.3 | (CH3)3P | Phosphorus | −114.4 |
3.2 Series of linear or symmetric-top complexes B⋯HX in which the hydrogen-bond is to a terminal C atom. B = CH3NC, HNC and FNC
The three series CH3NC⋯HX, HNC⋯HX and FNC⋯HX (X = Cl, Br, I, CN, CCH and CP) are of interest here for two reasons. First, the hydrogen bond from HX is again to an axial, terminal carbon atom in these linear or symmetric-top molecules and secondly relative to H of HNC the CH3 and F groups attached to the isocyanide group are electron donating and electron withdrawing, respectively. The plots of De and De/σminversus EHX are in Fig. 2(a) and (b), respectively. The values of σmin are available in Table 2.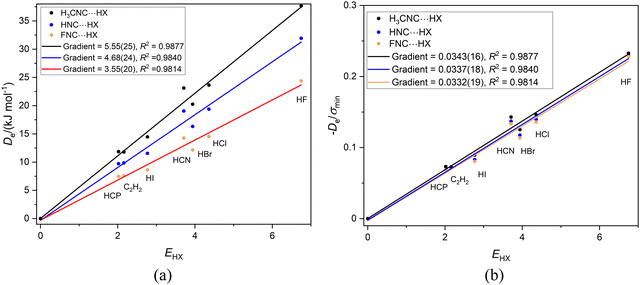 | ||
Fig. 2 (a) A plot of Deversus EHX for the series CH3NC⋯HX, HNC⋯HX and FNC⋯HX where X = F, Cl, Br, I, C![[triple bond, length as m-dash]](https://www.rsc.org/images/entities/char_e002.gif) N. C N. C![[triple bond, length as m-dash]](https://www.rsc.org/images/entities/char_e002.gif) CH and HC CH and HC![[triple bond, length as m-dash]](https://www.rsc.org/images/entities/char_e002.gif) P. (b) A plot of De/σmin for the same three series. P. (b) A plot of De/σmin for the same three series. | ||
We note from Fig. 2(a) that the gradients are in the order CH3NC⋯HX > HNC⋯HX > FNC⋯HX. Eqn (2) indicates that a plot of Deversus EHX should be a straight line through the origin with gradient NB, the nucleophilicity of the Lewis base involved. Thus, the order of the nucleophilicities of the isocyanides is NCH3NC = 5.55(25) > NHNC = 4.68(24) > NFNC = 3.55(20). This is the order expected from the inductive effects of the groups R in RNC, that is CH3 pushes electron density towards the non-bonding electron pair of the terminal C atom relative to H, while F is electron-withdrawing relative to H.
Fig. 2(b) shows that division of De by σmin reduces the three straight lines of Fig. 2(a) to a single line, for the gradients are now identical within the fitting error. Hence, it seems reasonable, according to eqn (4), to refer to the mean gradient = 0.0337(5) as the reduced nucleophilicity ИRNC. This appears to be an intrinsic property of isocyanide group, independent of the atom or group that is attached to it. Moreover, this value of ИRNB is very close to that deduced for the series SC, SeC and OC in Section 3.1. It appears that ИC could even be an intrinsic property of the terminal C atom in a linear, hydrogen-bonded complex, independent of the atoms/groups attached to that C atom. Alternatively, the close agreement of the two values of ИB might be just a coincidence.
3.3 Series of linear or symmetric-top complexes B⋯HX in which the hydrogen bond is to a terminal N atom. B = CH3CN, HCN or FCN, (X = F, Cl, Br, I, CN, CCH, CP) and B = PN and N2
It is of interest to examine the series of hydrogen-bonded complexes RCN⋯HX (X = F, Cl, Br, I, CN, CCH, CP) in which the hydrogen bond is to the terminal, axial nitrogen atom in the cyanides RCN (R = CH3, H or F) and to compare the results with those discussed for the corresponding series RNC⋯HX involving isocyanides. Fig. 3(a) contains the graphs of Deversus EHX for the three series CH3CN⋯HX, HCN⋯HX and FCN⋯HX, while Fig. 3(b) is the corresponding graph, but with De/σmin as the ordinate.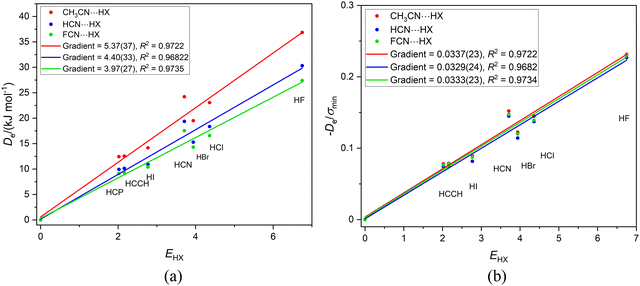 | ||
Fig. 3 (a) A plot of Deversus EHX for the series CH3CN⋯HX, HCN⋯HX and FCN⋯HX where X = F, Cl, Br, I, C![[triple bond, length as m-dash]](https://www.rsc.org/images/entities/char_e002.gif) N. C N. C![[triple bond, length as m-dash]](https://www.rsc.org/images/entities/char_e002.gif) CH and C CH and C![[triple bond, length as m-dash]](https://www.rsc.org/images/entities/char_e002.gif) P. (b) A plot of De/σmin for the same three series. P. (b) A plot of De/σmin for the same three series. | ||
The results in Fig. 3 are very similar to those for the corresponding RNC series in Fig. 2, except for a slightly larger scatter. The gradients in Fig. 3(a) are (according to eqn (2) when c is set to 1 kJ mol−1) the nucleophilicities NR–CN of the three cyanides. The values are 5.37(37), 4.40(33) and 3.92(27) for R = CH3CN, HCN and FCN, respectively, an order in agreement with the relative inductive effects of CH3, H and F found for the R-NC series in Section 3.2. In Fig. 3(b), division of De by σmin leads to a conflation of the three lines and again the gradients, which according to eqn (4) are the values of the reduced nucleophilicity ИRCN, are equal within the fitting error, with a mean value of 0.0333(6). Thus, the ИRCN values are independent of the group R attached to the CN group and are (possibly by coincidence) identical within the fitting errors with the values found for the RNC series.
A question that arises is: is the reduced nucleophilicity ИRCN an intrinsic property of the terminal N atom or does it depend on the C atom of the CN group also? This can be tested by considering the two series of hydrogen-bonded complexes N2⋯HX and PN⋯HX (X = F, Cl, Br, I, CN, CCH, CP) both of which are composed of linear complexes having a hydrogen bond to a nitrogen atom. Fig. 4(a) displays the Deversus EHX plot for both series, while Fig. 4(b) shows the result of diving De by σmin. Fig. 4(b) reveals that, within (the fairly large) standard deviations of the two fits, the gradients are equal and therefore the ИPN and ИN2 values are identical. These values are also similar (given the large errors) to the ИRCN.
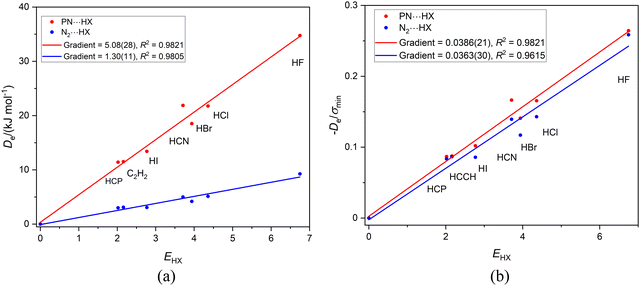 | ||
Fig. 4 (a) A plot of Deversus EHX for the series PN⋯HX and N2⋯HX where X = F, Cl, Br, I, C![[triple bond, length as m-dash]](https://www.rsc.org/images/entities/char_e002.gif) N. C N. C![[triple bond, length as m-dash]](https://www.rsc.org/images/entities/char_e002.gif) CH and C CH and C![[triple bond, length as m-dash]](https://www.rsc.org/images/entities/char_e002.gif) P. (b) A plot of De/σmin for the same two series. P. (b) A plot of De/σmin for the same two series. | ||
3.4 Series of linear complexes B⋯HX in which the hydrogen bond is to a terminal O atom of a linear molecule. B = OCO and SCO, (X = F, Cl, Br, I, CN, CCH, CP).
Fig. 5(a) and (b) show the graphs of Deversus EHX and De/σminversus EHX, respectively, for the linear complexes OCO⋯HX and SCO⋯HX having the order of the atoms indicated, that is having a hydrogen bond to a terminal oxygen atom. The gradients in Fig. 4(a) are almost equal, thereby indicating (according to eqn (2)) that the nucleophilicities of the O atoms in OCS and OCO are nearly equal. Division of De by σmin again results in the precise coincidence of the points for the two sets of complexes. Moreover, the gradients (equal within the standard deviation of the fits) are the reduced nucleophilicities of carbon dioxide and carbonyl sulfide and have the values. Иoco = 0.0372(36) and Иsco = 0.0380(37).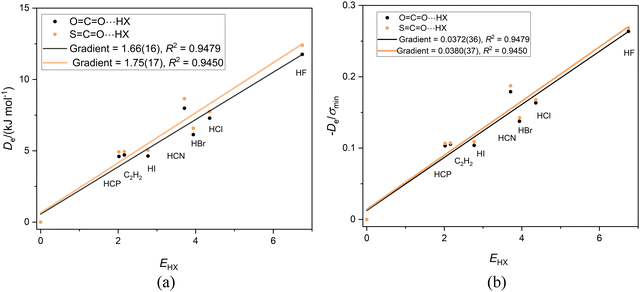 | ||
Fig. 5 (a) A plot of Deversus EHX for the series OCO⋯HX and SCO⋯HX for X = F, Cl, Br, I, C![[triple bond, length as m-dash]](https://www.rsc.org/images/entities/char_e002.gif) N. C N. C![[triple bond, length as m-dash]](https://www.rsc.org/images/entities/char_e002.gif) CH and C CH and C![[triple bond, length as m-dash]](https://www.rsc.org/images/entities/char_e002.gif) P. (b) A plot of De/σmin for the same two series. P. (b) A plot of De/σmin for the same two series. | ||
All the evidence so far presented indicates that when the terminal atom of a linear or symmetric-top Lewis base molecule forms a hydrogen-bonded complex B⋯HX, where X = F, Cl, Br, I, CN, CCH or CP, the reduced nucleophilicity is independent of the nature of the terminal atom and the atoms in the base that are connected to it. Unfortunately, the errors in the individual values of the ИLewis![[thin space (1/6-em)]](https://www.rsc.org/images/entities/char_2009.gif) base are quite significant.
base are quite significant.
3.5 Series of linear complexes B⋯HX in which the hydrogen bond is to a terminal boron atom in a Lewis base, R–B⋯HX, where R = CH3, H and F (X = F, Cl, Br, I, CN, CCH, CP)
Recently,42 we examined the effects of the group R on the dissociation energy De of the complexes R–B⋯HX, in which there is a hydrogen-bond to the axial non-bonding electron pair carried by the boron atom. The aim was define scales of nucleophilicity and the inductive effect that depend on the effect of R on hydrogen-bond interaction at boron rather than the more common definition in terms of rates of chemical reaction. Noting that fluoroborylene F–B is isoelectronic with OC and N2 (Lewis bases involved in earlier sections), it is of interest to compare the three series F–B⋯HX, H–B⋯HX and CH3B⋯HX. Fig. 6(a) displays the graph of Deversus EHX (X = F, Cl, Br, I, CN, CCH, CP) for these complexes involving the Lewis bases F–B, H–B and CH3B. As discussed earlier, the gradient of each straight lines through the origin in Fig. 6(a) is, according to eqn (2) with c = 1.0 kJ mol−1, the nucleophilicity of the Lewis base R–B. The values are NCH3B = 6.10(12), NHB = 4.97(13) and NFB = 3.16(12), which is consistent with chemical experience that CH3 pushes electron density onto the B atom relative to H while F withdraws electron density.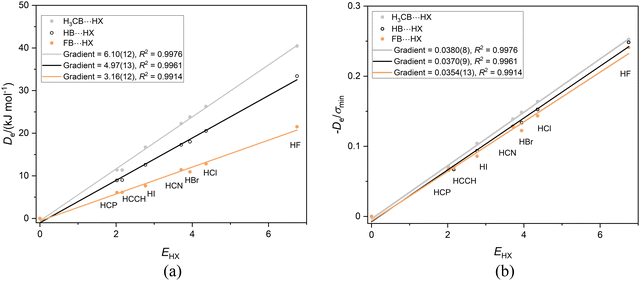 | ||
Fig. 6 (a) A plot of Deversus EHX for the series CH3B⋯HX, HB⋯HX and FB⋯HX, (X = F, Cl, Br, I, C![[triple bond, length as m-dash]](https://www.rsc.org/images/entities/char_e002.gif) N. C N. C![[triple bond, length as m-dash]](https://www.rsc.org/images/entities/char_e002.gif) CH and C CH and C![[triple bond, length as m-dash]](https://www.rsc.org/images/entities/char_e002.gif) P). (b) A plot of De/σmin for the same three series. P). (b) A plot of De/σmin for the same three series. | ||
Fig. 6(b) again shows, in accordance with eqn (4), with c chosen as 1.0 kJ mol−1, that the reduced nucleophilicities of CH3B, HB and FB are identical within the fitting error. Moreover, these values ИCH3B, ИHB and ИFB appear to be identical with those examined in Sections 3.1–3.4, inclusive, although some of the errors generated in fitting the various straight lines are quite large. If this conclusion is valid, it implies that, for the types of simple Lewis bases examined so far, the quantity ИLewis![[thin space (1/6-em)]](https://www.rsc.org/images/entities/char_2009.gif) base defined by the gradients of the De/σminversus EHX plots for the series is an intrinsic property of the interaction of the base with the series of H-bond donors defined.
base defined by the gradients of the De/σminversus EHX plots for the series is an intrinsic property of the interaction of the base with the series of H-bond donors defined.
3.6 Non-linear complexes in which the hydrogen bond is to an oxygen or sulfur atom of an asymmetric-top molecule
In this article so far, the discussion has been restricted to either linear or symmetric top, hydrogen-bonded complexes B⋯HX in which the Lewis base B is a linear molecule or a symmetric-top molecule. Moreover, the symmetric-top molecules B carry an extended chain of atoms on the top axis so that the off-axis atoms are remote from HX. In these examples, the graphs of De/σminversus EHX for different Lewis bases B, but having the same terminal atom acting as a hydrogen bond acceptor, fall on a single straight line (the gradient of which defines a reduced nucleophilicity of B). The question that arises is: can a reduced nucleophilicity be defined when B is an asymmetric-top molecule or a symmetric-top molecule in which the acceptor atom might lie closer to the off-axis atoms of the top?We begin with complexes in which the oxygen atom in an asymmetric-top molecule is the hydrogen-bond acceptor atom. The Lewis bases chosen for this category are oxirene (oxacyclopropene), dimethyl ether (CH3)2O, formaldehyde H2C![[double bond, length as m-dash]](https://www.rsc.org/images/entities/char_e001.gif) O, ketene H2C
O, ketene H2C![[double bond, length as m-dash]](https://www.rsc.org/images/entities/char_e001.gif) C
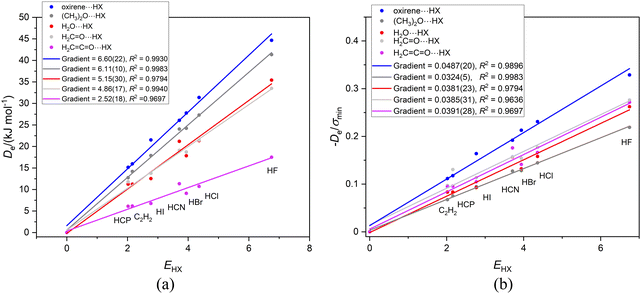
C![[double bond, length as m-dash]](https://www.rsc.org/images/entities/char_e001.gif) O and water H2O. Fig. 7(a) and (b) exhibit the Deversus EHX and De/σminversus EHX graphs, respectively, for this series involving oxygen as the hydrogen-bond acceptor atom. Fig. 7(a) reveals that the graphs of Deversus EHX are again good straight lines when the origin is included as a point.
O and water H2O. Fig. 7(a) and (b) exhibit the Deversus EHX and De/σminversus EHX graphs, respectively, for this series involving oxygen as the hydrogen-bond acceptor atom. Fig. 7(a) reveals that the graphs of Deversus EHX are again good straight lines when the origin is included as a point.
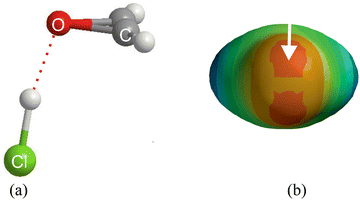
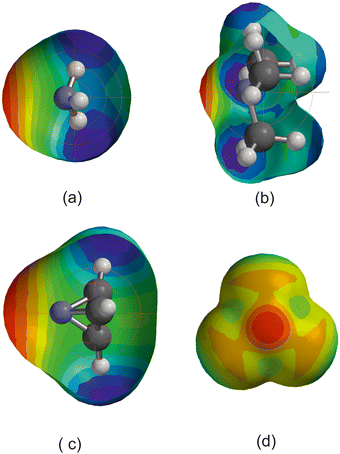
The complexes involved in Fig. 7 all have a plane of symmetry which includes the oxygen atom, as is clear for the example of oxirene⋯HCl drawn to scale in Fig. 8(a). The principal axis coordinates of the five types of complex B⋯HX (X = F, Cl, Br, I, CN, CCH and CP) discussed in Fig. 7 are available in the ESI† (Table S1). The HX molecule in oxirene-HX forms a hydrogen bond to one of the two non-bonding electron pairs carried by the oxygen atom. This is clear from the molecular electrostatic surface potential (MESP) of oxirene, which is shown in Fig. 8(b) and was calculated at the M06-2X/aug-cc-pVDZ level with the SPARTAN program.41 The two deepest red regions of that surface are the most negative (and therefore most nucleophilic) areas and clearly are associated with the O atom non-bonding pairs. The half of the angle between the n-pair centres is about 60° and is in agreement with the angle 64.6° made by the H⋯O line with the oxirene C2 axis. The geometry of (CH3)2O⋯HCl admits of a similar interpretation, while H2O⋯HCl also has a pyramidal configuration43 at O. H2C![[double bond, length as m-dash]](https://www.rsc.org/images/entities/char_e001.gif) O⋯HCl and H2C
O⋯HCl and H2C![[double bond, length as m-dash]](https://www.rsc.org/images/entities/char_e001.gif) C
C![[double bond, length as m-dash]](https://www.rsc.org/images/entities/char_e001.gif) O⋯HCl are planar with the angle C
O⋯HCl are planar with the angle C![[double bond, length as m-dash]](https://www.rsc.org/images/entities/char_e001.gif) O⋯H close to 120° consistent with a hydrogen bond to one of the O atom non-bonding electron pairs.
O⋯H close to 120° consistent with a hydrogen bond to one of the O atom non-bonding electron pairs.
Fig. 7(b) reveals that the gradients of the De/σminversus EHX graphs for H2C![[double bond, length as m-dash]](https://www.rsc.org/images/entities/char_e001.gif) O, H2C
O, H2C![[double bond, length as m-dash]](https://www.rsc.org/images/entities/char_e001.gif) C
C![[double bond, length as m-dash]](https://www.rsc.org/images/entities/char_e001.gif) O and H2O are similar to those noted in Section 3.4 for O
O and H2O are similar to those noted in Section 3.4 for O![[double bond, length as m-dash]](https://www.rsc.org/images/entities/char_e001.gif) C
C![[double bond, length as m-dash]](https://www.rsc.org/images/entities/char_e001.gif) O⋯HX and S
O⋯HX and S![[double bond, length as m-dash]](https://www.rsc.org/images/entities/char_e001.gif) C
C![[double bond, length as m-dash]](https://www.rsc.org/images/entities/char_e001.gif) O⋯HX as the Lewis bases, namely ∼0.038, but that when (CH3)2O is the Lewis base the value is slightly lower (0.032), while that for B = oxirene is much higher at 0.049. The reason for the behaviour when oxirene is the Lewis base is not clear, but we note that in Fig. 7(a) the intercept on the De axis for the B = oxirene line has the high value +1.6 kJ mol−1.
O⋯HX as the Lewis bases, namely ∼0.038, but that when (CH3)2O is the Lewis base the value is slightly lower (0.032), while that for B = oxirene is much higher at 0.049. The reason for the behaviour when oxirene is the Lewis base is not clear, but we note that in Fig. 7(a) the intercept on the De axis for the B = oxirene line has the high value +1.6 kJ mol−1.
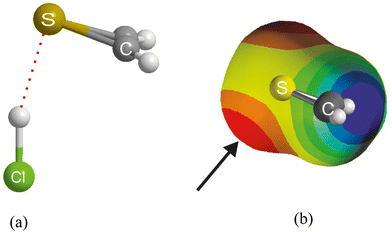
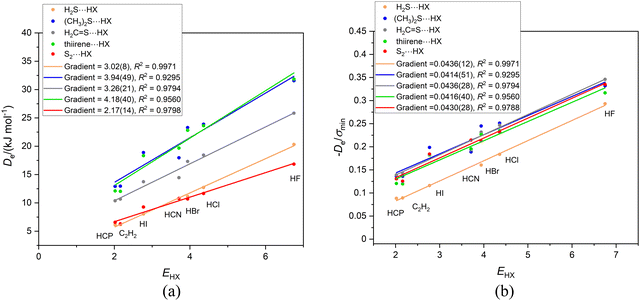
We now examine the corresponding series of asymmetric-top molecules B in which S is the hydrogen-bond acceptor atom in place of O, namely dimethyl sulfide, (CH3)2S, thiirene (or thiacyclopropene), hydrogen sulfide, H2S and thioformaldehyde, H2C![[double bond, length as m-dash]](https://www.rsc.org/images/entities/char_e001.gif) S. In each case, the HX forms a hydrogen bond to S and makes an angle of close to 90° with the C2 axis of B, as is known experimentally from a rotational spectroscopic investigation of the H2S⋯HCl complex,44 for example, and is confirmed by the results of the ab initio calculations conducted here (see ESI† for atomic coordinates). Fig. 9(a) shows the ab initio calculated geometry of thiirene⋯HCl. The angle H⋯S-* made by the hydrogen bond with the C2 axis of thiirene is ∼90° (* is the centre of the C
S. In each case, the HX forms a hydrogen bond to S and makes an angle of close to 90° with the C2 axis of B, as is known experimentally from a rotational spectroscopic investigation of the H2S⋯HCl complex,44 for example, and is confirmed by the results of the ab initio calculations conducted here (see ESI† for atomic coordinates). Fig. 9(a) shows the ab initio calculated geometry of thiirene⋯HCl. The angle H⋯S-* made by the hydrogen bond with the C2 axis of thiirene is ∼90° (* is the centre of the C![[double bond, length as m-dash]](https://www.rsc.org/images/entities/char_e001.gif) C bond), The angle Cl–H⋯S is ∼ 170° and suggests a weak, secondary non-covalent interaction of Cl with the two electrophilic hydrogen atoms of thiirene. The molecular electrostatic surface potential (MESP) of thiirene calculated at the M06-2X/aug-cc-pVDZ level is displayed in Fig. 9(b). The front surface has been cut away to reveal the model of thiirene inside in a similar orientation to that shown in Fig. 9(a). The most nucleophilic (negative) region is coloured red and corresponds to the non-bonding electron pair direction below S at ∼90° to the molecular plane, as indicated by the arrow. The blue surfaces near to the two H atoms are the most positive (electrophilic) regions of the thiirene molecule and are responsible for the weak secondary interaction involving Cl.
C bond), The angle Cl–H⋯S is ∼ 170° and suggests a weak, secondary non-covalent interaction of Cl with the two electrophilic hydrogen atoms of thiirene. The molecular electrostatic surface potential (MESP) of thiirene calculated at the M06-2X/aug-cc-pVDZ level is displayed in Fig. 9(b). The front surface has been cut away to reveal the model of thiirene inside in a similar orientation to that shown in Fig. 9(a). The most nucleophilic (negative) region is coloured red and corresponds to the non-bonding electron pair direction below S at ∼90° to the molecular plane, as indicated by the arrow. The blue surfaces near to the two H atoms are the most positive (electrophilic) regions of the thiirene molecule and are responsible for the weak secondary interaction involving Cl.
The graphs of Deversus EHX and De/σminversus EHX for the group of complexes B⋯HX (X = F, Cl, Br, I, CN, CCH, CP) in which hydrogen bond is to the sulfur atom of the Lewis base B are in Fig. 10(a) and (b), respectively. In these diagrams, the origin was not fitted as a point because it is obvious that, when extrapolated, the calculated points for at least three of the series would not pass close to zero. Also included in Fig. 10 for interest is the graph for the series S2⋯HX, in which S2 is treated as a 1Σg+ molecule (instead of the observed ground state 3Σg−). It fits the pattern exhibited by the other B⋯HX complexes in the Fig. 10. One possible reason why some of the straight lines in Fig. 10(a) and (b) do not pass through the origin is that in these complexes there is larger dispersion contribution to De. The Lewis bases B contain the second row atom S and their complexes have a right-angled geometry (see Fig. 9(a)) which could also lead to an increased dispersion energy resulting from contiguity of X and B. It seems unlikely that division of De by the electrostatic quantity σmin would allow for any dispersion contribution to De. Another possible factor is that the right-angled geometry gives more weight than in linear geometries to an interaction of electrophilic regions in B with the electrophilic atom in X (see Fig. 9(a) and (b)). Note that the gradients of the De/σmin straight lines when the second row atom S is involved in the hydrogen bond are larger than found for the O analogues.
3.7 Symmetric-top complexes in which the hydrogen bond is to a pyramidal nitrogen or phosphorus atom
In this section, the complexes to be discussed are of the type R3M⋯HX, in which M = N or P, R = Cl, H or CH3, and X = F, Cl, Br, I, CN, CCH and CP. Calculations of (CH3)3N⋯HX for X = Cl, Br and I at the CCSD(T)(F12c)/cc-pVDZ-F12 level led to optimised geometries that were of the ion-pair type (CH3)3NH+⋯X− and points for these complexes were not included in the graph for the series. To compensate for this shortfall, the series in which another tertiary amine of C3V symmetry, aza-tetrahedrane, is the Lewis base was also included. Fig. 11(a) is a plot of Deversus EHX for the four series (CH3)3N⋯HX, 1-aza-tetrahedrane⋯HX, H3N⋯HX and Cl3N⋯HX, with X = F, Cl, Br, I, CN, CCH and CP as before. This set of nitrogen bases has groups attached to N that are electron-donating (CH3) and electron-withdrawing (Cl) relative to H. The gradients of the straight lines in Fig. 11(a) yield the nucleophilicities of the Lewis bases and these are in the order (CH3)3N⋯HX > H3N > Cl3N, as expected. The nucleophilicity of 1-aza-tetrahedrane is smaller than that of NH3.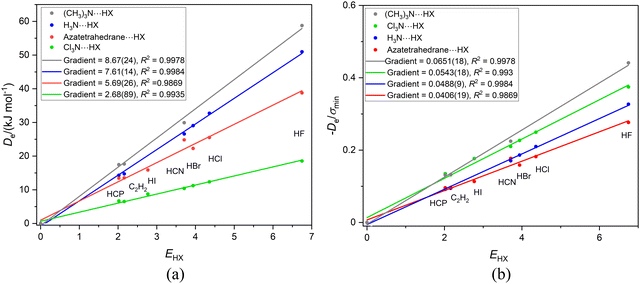 | ||
| Fig. 11 Graphs of (a) Deversus EHX and (b) De/σminversus EHX for the series of hydrogen-bonded complexes B⋯HX, where B = (CH3)3N, 1-aza-tetrahedrane, H3N or Cl3N and X = F, Cl, Br, I, CN, CCH and CP. | ||
It is clear from Fig. 11(b) that, unlike other complexes involving N as the hydrogen-bond acceptor atom, such as N2⋯HX and PN⋯HX (see Section 3.3 and Fig. 4), the division of De by σmin does not yield a set of straight lines of the same gradient and consequently a reduced nucleophilicity ИR3N cannot be assigned to the pyramidal N atom in these species. Is there a reason for this?
Fig. 12 compares the MESPs of the four Lewis bases under discussion, all calculated at the M06-2X/aug-cc-VDZ level. Fig. 12(b) shows trimethylamine, in which the blue (electrophilic) regions associated with the H atoms are close to the central nucleophilic red region on the C3 axis associated with the nitrogen n-pair, and they are also close to and surround the H atom of HX. For ammonia in Fig. 12(a) the blue electrophilic regions near to the H atoms are also quite close to the H atom of HX in the H3N⋯HX complex by virtue of the very short N–H bonds. The geometry of 1-aza-tetrahedrane (shown in Fig. 12(c)) is such that the three H atoms are held well away from the pyramidal N atom and therefore these electrophilic (blue) regions are unlikely to have such a serious effect on the H atom of HX in the azatetrahedrane⋯HX complex. NCl3 (Fig. 12(d)) has off-axis (orange-red) nucleophilic regions associated with the Cl atoms that presumably reinforce the effect of the axial nucleophilic region associated with the N atom. Thus, it seems that the value of the reduced nucleophilicity ИR3N for pyramidal N in symmetric-top molecules (i.e. the gradient of the De/σminversus EHX plot) most likely to be correct is 0.0406(19) determined for the aza-tetrahedrane complex. This value is similar within the error of the linear regression fits to (but not quite identical with) those determined [mean 0.0375(10)] for the linear complexes N2⋯HX and PN⋯HX involving N as the H-bond acceptor.
If the proximity of the electrophilic H atoms of ammonia or trimethylamine to the H atom of HX in complexes H3N⋯HX and (CH3)3N⋯HX causes problems with obtaining a reduced nucleophilicity ИR3N for ammonia and trimethylamine, it is possible that substitution of N by a P atom and the consequent greater H–P and C–P distances in H3P and (CH3)3P, respectively, will remove this impediment. Fig. 13(a) shows the Deversus EHX points for the H3P⋯HX and (CH3)3P⋯HX series of complexes. As expected from the +I effect of CH3 relative to H, the gradient of the linear regression fit to the points for the trimethylphosphine complexes (and hence the nucleophilicity) is greater than that for the phosphine complexes. Fig. 13(b) demonstrates that division of De values by the minimum value of the MESP (which occurs on the C3 axis just outside the P atom and is a property of the non-bonding electron pair of P) causes the two straight-line fits to have essentially equal gradients and suggests a reduced nucleophilicity of ИR3P = 0.0441(17) for the (CH3)3P and H3P Lewis bases. Interestingly, the mean value for five complexes B⋯HX in which the hydrogen bond is to an S atom of B is 0.0426(10). See Section 3.6 and Fig. 10(b).
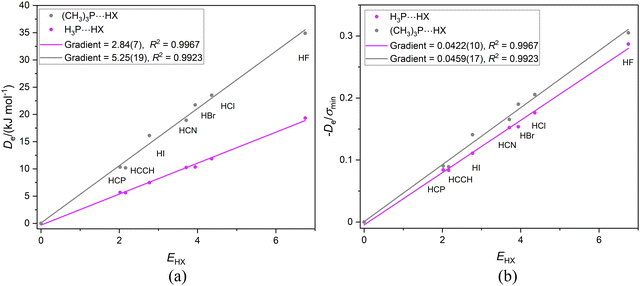 | ||
| Fig. 13 (a) Deversus EHX and (b) De/σminversus EHX for the two series of complexes H3P⋯HX and (CH3)3P⋯HX (X = F, Cl, Br, I, CN, CCH, CP). | ||
4. Conclusions
In this article, we have used ab initio calculations at the CCSD(T)(F12c)/cc-pVDZ-F12 level to determine the equilibrium dissociation energies De of a large number (∼190) of hydrogen-bonded complexes of the type B⋯HX, where B is a simple Lewis base molecule and X = F, Cl, Br, I, CN, CCH, CP. Plots of Deversus EHX, where EHX is the electrophilicity32 of the molecule HX, are in most cases reasonably good straight lines through the origin. The gradient of each straight line gives a measure of the nucleophilicity NB of the Lewis base B, as discussed in the Introduction in connection with eqn (1)–(4). This definition of the nucleophilicity of B applies to the weak interaction of B with the series of Lewis acids HX in isolation in the gas phase. As pointed out in an earlier publication42 the values of NB can, in suitable cases, be used to define a numerical scale of the inductive effect of groups attached to the atom directly involved in the B⋯HX hydrogen bond. For example, in this work, the relative inductive effects of CH3 groups and halogen atoms have been compared.The main aim of the investigations reported here was to find whether it is possible to define a reduced nucleophilicity of Lewis base molecules B having a common terminal atom (e.g. N in HCN FCN and CH3CN as discussed in (Section 3.3)) when forming hydrogen bonds to a series of Lewis acids HX. The focus here has been on the particular series in which X = F, Cl, Br, I, CN, CCH and CP. In an analogous approach, reported earlier,32 dissociation energies De of complexes formed by a fixed Lewis acid (e.g. HF) with a series of several different Lewis bases B were plotted against the nucleophilicities NB of the Lewis bases. The resulting straight line through the origin yielded the electrophilicity EHX of the Lewis acid HX. It was discovered that when De was divided by σmax, the maximum value of the molecular electrostatic surface potential of the Lewis acid (and therefore its most electrophilic region for interactions that are mainly electrostatic in character), the graphs of De/σmax against NB for several different Lewis acids (e.g. HF, HCl, HBr, HI) degenerated to a single straight line. The gradient of this line provided a reduced electrophilicity ΞHX that is a property of the electrophilic end H of HX and is independent of X. σmin is the quantity for a Lewis base that corresponds to σmax of a Lewis acid and is the minimum value of the MESP. It is often associated with the direction of the axis of a non-bonding electron pair of B. We have here asked the following question: does a plot of De/σmin against the EHX (i.e. the electrophilicities of a series of Lewis acids HX) lead (as previewed in eqn (4) in the Introduction) to a single straight line of gradient ИB for molecules B having a common terminal atom directly involved in the hydrogen bond from HX to B?
The answer to this question is evident from the graphs displayed in Fig. 1–7, 10, 11 and 13. The gradients of the De/σminversus EHX plots have been abstracted from the various figures and are displayed in Table 3 in categories defined by the terminal atom involved in the hydrogen bond in various B⋯HX complexes. The order of the categories is the order of the terminal atoms in the Periodic Table. The conclusion is clear, namely that the gradients of the linear regression fits to points for a given category of Lewis base B are identical or nearly so (within the error of the fit) when the molecules B are different but when the same atom is directly involved in the hydrogen bonds to HX. This seems to be established, even though the errors associated with the fits are larger than desirable in some cases. The exception to this conclusion is the series in which the Lewis bases are asymmetric-top molecules carrying an oxygen atom, the results for which are not included in Table 3. Some possible reasons for the exceptional behaviour have been tentatively presented. In Table 3, the final column carries the mean of the values (and the quoted error is the mean of the error of the various fits) in each separate category. The following striking conclusion is available from Table 3: not only is the reduced nucleophilicity ИB independent of the remainder of the molecule B attached to the atom involved in the hydrogen bond with HX, but also there is evidence that the quantity is very similar for all the first row atoms and that these appear to be smaller than those of the second row atoms investigated, that is S and P. It seems reasonable that second row atoms should have a larger nucleophilicity that their first row counterparts in view of their greater numbers of electrons. Thus, we have established the existence of the reduced nucleophilicity ИB of Lewis bases B to match the earlier conclusion32 that there exists a reduced electrophilicity ΞA of Lewis acids A.
| Molecular type | H-bond acceptor atom | Complex | Reduced nucleophilicity, Иa | Mean value of Иb |
|---|---|---|---|---|
| a И is the gradient of the linear regression fit to the points of the De/σminversus EHX graph in each case (see Fig. 1–7 and 10–13). HX is Lewis acid H-bond donor, with X = F, Cl, Br, I, CN, CCH, CP. ИB is defined as the reduced nucleophilicity of the Lewis base B. b The mean value of ИB for the indicated group of complexes. The error given is the mean of the errors generated in the linear regression fit of each of the relevant De/σminversus EHX plots. | ||||
| Linear/sym. top | Boron | H3CB⋯HX | 0.0380(8) | 0.0368(10) |
| HB⋯HX | 0.0370(9) | |||
| FB⋯HX | 0.0354(13) | |||
| Linear | Carbon | OC⋯HX | 0.0346(26) | 0.0349(17) |
| SC⋯HX | 0.0355(15) | |||
| SeC⋯HX | 0.0345(11) | |||
| Linear/sym. top | Carbon | CH3NC⋯HX | 0.0343(16) | 0.0337(18) |
| HNC⋯HX | 0.0337(18) | |||
| FNC⋯HX | 0.0332(19) | |||
| Linear/sym. top | Nitrogen | CH3CN⋯HX | 0.0337(23) | 0.0333(23) |
| HCN⋯HX | 0.0329(24) | |||
| FCN⋯HX | 0.0333(23) | |||
| Linear | Nitrogen | PN⋯HX | 0.0386(21) | 0.0374(25) |
| N2⋯HX | 0.0363(30) | |||
| Linear | Oxygen | OCO⋯HX | 0.0372(36) | 0.0376(36) |
| SCO⋯HX | 0.0380(37) | |||
| Asym. top | Oxygen | H2O⋯HX | 0.0381(23) | 0.0386(27) |
| H2CO⋯HX | 0.0385(31) | |||
| H2CCO⋯HX | 0.0391(28) | |||
| Asym. top | Sulfur | H2S⋯HX | 0.0436(12) | 0.0427(33) |
| (CH3)2S⋯HX | 0.0414(51) | |||
| H2CS⋯HX | 0.0436(28) | |||
| Thiirene⋯HX | 0.0416(40) | |||
| S2⋯HX | 0.0430(28) | |||
| Sym. top | Phosphorus | H3P⋯HX | 0.0459(17) | 0.0441(14) |
| (CH3)3P⋯HX | 0.0422(10) | |||
Conflicts of interest
There are no conflicts of interest to declare.Acknowledgements
A. C. L. thanks the University of Bristol for the award of a University Senior Research Fellowship. I. A. thanks the Ministerio de Ciencia e Innovación of Spain (PGC2018-094644-B-C22 and PID2021-125207NB-C32) and Comunidad de Madrid (P2018/EMT-4329 AIRTEC-CM) for financial support.References
- R. S. Drago and B. B. Wayland, J. Am. Chem. Soc., 1965, 87, 3571–3577 CrossRef CAS.
- M. K. Kroeger and R. S. Drago, J. Am. Chem. Soc., 1981, 103, 3250–3262 CrossRef CAS.
- D. Gurka and R. W. Taft, J. Am. Chem. Soc., 1969, 91, 4794–4801 CrossRef CAS.
- M. R. Abraham, P. P. Duce, P. L. Grellier, D. V. Prior, J. J. Morris and P. J. Taylor, Tetrahedron Lett., 1988, 29, 1587–1590 CrossRef CAS.
- M. H. Abraham, P. L. Grellier, D. V. Prior, R. W. Taft, J. J. Morris, P. J. Taylor, C. Laurence, M. Berthelot and R. M. Doherty, et al. , J. Am. Chem. Soc., 1988, 110, 8534–8536 CrossRef CAS.
- M. H. Abraham, Chem. Soc. Rev., 1993, 22, 73–83 RSC.
- J. Marco, J. M. Orza, R. Notario and J.-L. M. Abboud, J. Am. Chem. Soc., 1994, 116, 8841–8842 CrossRef CAS.
- J. A. Platts, Phys. Chem. Chem. Phys., 2000, 2, 973–980 RSC.
- J. A. Platts, Phys. Chem. Chem. Phys., 2000, 2, 3115–3120 RSC.
- O. Lamarche and J. A. Platts, Chem. – Eur. J., 2002, 8, 457–466 CrossRef CAS.
- O. Lamarche and J. A. Platts, Phys. Chem. Chem. Phys., 2003, 5, 677–684 RSC.
- T. Steiner and W. Saenger, Acta Crystallogr., Sect. B: Struct. Sci., 1994, 50, 348–357 CrossRef.
- T. Steiner, J. Chem. Soc., Chem. Commun., 1995, 1331–1332 RSC.
- T. Steiner, J. Phys. Chem. A, 1998, 102, 7041–7052 CrossRef CAS.
- H. Benedict, H.-H. Limbach, M. Wehlan, W.-P. Fehlhammer, N. S. Golubev and R. Janoschek, J. Am. Chem. Soc., 1998, 120, 2939–2950 CrossRef CAS.
- H. Benedict, I. G. Shenderovich, O. L. Malkina, V. G. Malkin, G. S. Denisov, N. S. Golubev and H.-H. Limbach, J. Am. Chem. Soc., 2000, 122, 1979–1988 CrossRef CAS.
- I. Alkorta and J. Elguero, Struct. Chem., 1999, 10, 157–159 CrossRef CAS.
- M. Ramos, I. Alkorta, J. Elguero, N. S. Golubev, G. S. Denisov, H. Benedict and H.-H. Limbach, J. Phys. Chem. A, 1997, 101, 9791–9800 CrossRef CAS.
- E. Espinosa, I. Alkorta, J. Elguero and E. Molins, J. Chem. Phys., 2002, 117, 5529–5542 CrossRef CAS.
- I. Alkorta, I. Rozas and J. Elguero, Struct. Chem., 1998, 9, 243–247 CrossRef CAS.
- C. K. Ingold, J. Chem. Soc., 1933, 1120–1127 RSC.
- H. Mayr and M. Patz, Angew. Chem., Int. Ed. Engl., 1994, 33, 938–957 CrossRef.
- H. Mayr, Angew. Chem., Int. Ed., 2011, 50, 3612–3618 CrossRef CAS.
- A. C. Legon and D. J. Millen, J. Am. Chem. Soc., 1987, 109, 356–358 CrossRef CAS.
- A. C. Legon, Phys. Chem. Chem. Phys., 2014, 16, 12415–12421 RSC and corrected, 2014, 16, 25199.
- I. Alkorta and A. C. Legon, New J. Chem., 2018, 42, 10548–10554 RSC.
- I. Alkorta and A. C. Legon, Molecules, 2017, 22, 1786–1799 CrossRef.
- I. Alkorta, N. R. Walker and A. C. Legon, Inorganics, 2021, 9, 13 CrossRef CAS.
- I. Alkorta, J. G. Hill and A. C. Legon, Phys. Chem. Chem. Phys., 2020, 22, 16421–16430 RSC.
- A. D. Buckingham and P. W. Fowler, Can. J. Chem., 1985, 63, 2018–2025 CrossRef.
- J. S. Murray and P. Politzer, Wiley Interdiscip. Rev.: Comput. Mol. Sci., 2017, 7, 326 Search PubMed.
- I. Alkorta and A. C. Legon, Phys. Chem. Chem. Phys., 2022, 24, 6856–6865 RSC.
- Dimensionless Physical Quantities in Science and Engineering, ed. J. Kuneš, Elsevier, Amsterdam, 1st Edn, 2010 Search PubMed.
- C. Hättig, D. P. Tew and A. Köhn, J. Chem. Phys., 2010, 132, 231102 CrossRef.
- C. Hättig, W. Klopper, A. Köhn and D. P. Tew, Chem. Rev., 2012, 112, 4–74 CrossRef.
- J. G. Hill and K. A. Peterson, J. Chem. Phys., 2014, 141, 094106 CrossRef.
- S. F. Boys and F. Bernardi, Mol. Phys., 1970, 19, 553–566 CrossRef CAS.
- H.-J. Werner, P. J. Knowles, G. Knizia, F. R. Manby and M. Schütz, Wiley Interdiscip. Rev.: Comput. Mol. Sci., 2012, 2, 242–253 CAS.
- M. J. Frisch, G. W. Trucks, H. B. Schlegel, G. E. Scuseria, M. A. Robb, J. R. Cheeseman, G. Scalmani, V. Barone, G. A. Petersson and H. Nakatsuji, et al., Gaussian 16; Revision, A.03, Gaussian, Inc., Wallingford, CT, USA, 2016 Search PubMed.
- T. Lu and F. Chen, J. Comput. Chem., 2012, 33, 580–592 CrossRef CAS.
- Spartan 20; Wavefunction, Inc.: Irvine, CA, 2020. Spartan is an interface running the Q-Chem engine underneath. Except for molecular mechanics and semi-empirical models, the calculation methods used by Spartan are those of Q-Chem and are documented in: Y. Shao, L. F. Molnar, Y. Jung, J. Kussmann, C. Ochsenfeld, S. T. Brown, A. T. B. Gilbert, L. V. Slipchenko, S. V. Levchenko, D. P. O’Neill, R. A. DiStasio Jr., R. C. Lochan, T. Wang, G. J. O. Beran, N. A. Besley, J. M. Herbert, C. Y. Lin, T. Van Voorhis, S. H. Chien, A. Sodt, R. P. Steele, V. A. Rassolov, P. E. Maslen, P. P. Korambath, R. D. Adamson, B. Austin, J. Baker, E. F. C. Byrd, H. Dachsel, R. J. Doerksen, A. Dreuw, B. D. Dunietz, A. D. Dutoi, T. R. Furlani, S. R. Gwaltney, A. Heyden, S. Hirata, C.-P. Hsu, G. Kedziora, R. Z. Khalliulin, P. Klunzinger, A. M. Lee, M. S. Lee, W. Z. Liang, I. Lotan, N. Nair, B. Peters, E. I. Proynov, P. A. Pieniazek, Y. M. Rhee, J. Ritchie, E. Rosta, C. D. Sherrill, A. C. Simmonett, J. E. Subotnik, H. L. Woodcock III, W. Zhang, A. T. Bell, A. K. Chakraborty, D. M. Chipman, F. J. Keil, A. Warshel, W. J. Hehre, H. F. Schaefer, J. Kong, A. I. Krylov, P. M. W. Gill and M. Head-Gordon, Phys. Chem. Chem. Phys., 2006, 8, 3172 RSC.
- I. Alkorta and A. C. Legon, Phys. Chem. Chem. Phys., 2022, 24, 12804–12807 RSC.
- Z. Kisiel, B. A. Pietrewicz, P. W. Fowler, A. C. Legon and E. Steiner, J. Phys. Chem., 2000, 104, 6970–6978 CrossRef CAS.
- E. J. Goodwin and A. C. Legon, J. Chem. Soc., Faraday Trans. 2, 1984, 80, 51–65 RSC.
Footnote |
| † Electronic supplementary information (ESI) available. See DOI: https://doi.org/10.1039/d2cp03999k |
| This journal is © the Owner Societies 2022 |

