 Open Access Article
Hyperconverged autonomous organic reaction infrastructure (HAORI) driven by SpecSNN, for low dielectric constant polymer research†
Yanheng
Xu
a,
Kaibin
Qiu
a,
Shuyu
Xiao
b,
Jiechun
Liang
a,
Tingchao
He
 *b and
Xi
Zhu
 *a
*a
aSchool of Science and Engineering (SSE), Shenzhen Institute of Artificial Intelligence and Robotics for Society (AIRS), The Chinese University of Hong Kong, Shenzhen (CUHK-Shenzhen), 2001 Longxiang Blvd, Longgang District, Shenzhen, Guangdong, China. E-mail: zhuxi@cuhk.edu.cn
bCollege of Physics and Optoelectronic Engineering, Shenzhen University, Shenzhen, Guangdong 518060, China. E-mail: tche@szu.edu.cn
First published on 10th June 2022
Abstract
We developed a hyper-converged autonomous organic reaction infrastructure (HAORI) that integrates reactions, characterization, and closed-loop optimization, driven by the Spectrum Spiking Neural Network (SpecSNN) architecture. Most of the previous data-driven autonomous lab platforms in organic reactions lack a time-resolved algorithm, which creates a gap with the optimization progress in a non-negligible time. Driven by SpecSNN, HAORI receives in situ spectroscopic feedback from the automatic synthesis unit and outputs the alternated reaction conditions considering time differences. Compared with the previous autonomous lab systems and architecture, HAORI can achieve higher efficiency and accuracy. We showed a working example in HAORI for a relative optimum reaction to synthesize a low dielectric constant polymer, producing a polymerized product with a DC (ε) from 1.32 to 2.56 and ε0 = 2.46, which is also double validated using ab initio calculations. We believe that the SpeccSNN-HAORI could be one of the next-generation autonomous lab architectures.
Introduction
The development of AI in chemistry has been remarkable in the past decade, including property prediction,1–3 synthesis routine planning,4–6 and reaction optimization.7–13 Together with these implementations, lots of assistance in a throughout developing routine, from structure design to compound synthesis and property characterization. However, this workflow has not been widely accepted by researchers worldwide, as there are still plenty of problems that significantly affect the discovery efficiency. The barriers mainly come from the complications of chemical experiments, diversity, and time consumption. Most well-developed deep learning architectures could only handle a minimal amount of information, both for properties and reactions.In chemical experiments, most of the reaction optimization algorithm are per-experiment based, for which they treat an experiment as the minimum analysis unit. This trade-off is acceptable in ultra-fast reactions such as the synthesis of perovskite quantum dots14–17 but would significantly affect the efficiency of relatively long experiments. All chemical reactions should be regarded as time-dependent procedures; however, most reaction optimization algorithms reported18,19 ignored the time factor. For instance, some continuous flow optimization systems20 aim to receive spectroscopic feedback and dynamically alter the reaction conditions. However, during these minutes, massive variations may happen in the reaction mixture, for which the outdated optimizing strategy may not be suitable. In solution, a considerable time gap exists between the extracted and current mixture during this cycle. The dynamic control should not be applied to the condition where the sample represents, but when analysis results come out instead. Previous studies mainly focussed on a few specific parts of the whole workflow but could not provide a thoughtful solution for the entire task. Furthermore, their approaches to particular parts can further be optimized.
Two main requirements are essential to construct a real-time closed-loop reaction system: (1) suitable characterization techniques and (2) a well-tested feedback control algorithm. Previous studies have applied various optical spectroscopies, and the proportion parameter from the spectrum to product quality can be well adjusted.21–23 Aiming to determine the properties of products from spectroscopic feedback, implementing in-line optical spectroscopy such as Fourier transform infrared (FT-IR), ultraviolet-visible (UV-Vis), and Raman spectroscopies is practical. They can be used as a structural indicator for bonds and groups. By applying well-researched deep learning feature extraction models, both dominance and recessiveness spectroscopic features, including peak intensity and broadness, relative position, and even noise distribution, can be further utilized to examine the effectiveness of the current strategy. Here in this work, HAORI focuses on in situ optimization of reactions using a spiking neural network (SpecSNN) based optimizer to perform real-time optimization under FT-IR and transient absorption spectrum (TAS) spectroscopic feedbacks. HAORI aims to handle all processes independently in typical organic reaction optimization tasks, from searching and conducting to optimization. It supports user-defined initial conditions and could alter various environmental parameters during the reaction according to the output of SpecSNN, which is fully time-dependent.
Implementation
HAORI consists of three parts, the potential functional material discovery algorithm, the automatic synthesis unit, and the in situ prediction and optimization system. The potential functional material discovery algorithm implements a functional-group property-based random forest algorithm to search for a series of materials with the desired properties. For the automatic experiment unit period, expert domain knowledge from chemists17 will be set as the initial condition, and two experiments will automatically start in parallel. The network begins with pre-trained reaction procedure results generated during the testing of the autonomous synthesis unit. SpecSNN would keep receiving data from characterization results during the synthesis and dynamically control the reaction conditions. The current experiment would continue until the difference between two adjunct testing results is lower than the threshold or the reaction time exceeds the time limit.The schematic diagram and product picture of HAORI are shown in Fig. 1. This platform mainly consisted of three parts, including liquid preparation, flow reaction module, and characterization (including FT-IR and Femtosecond-TA spectrometers). It supports real-time control of multiple parameters, including temperature and the flow rate, separately in all heat towers, allowing algorithms to optimize the reaction precisely. The characterization procedure of both spectrometers can be performed using a characteristic pump, which is used to extract reactants from all seven channels. Data would be transmitted back to the network immediately after receiving. However, in practice, an unavoidable time gap still exists caused by the setting up of both spectrometers. Details about the hardware, software, and communication protocol of HAORI can be found in ESI S1.†
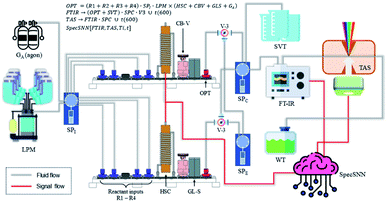 | ||
| Fig. 1 The schematic presentation of HAORI driven by SpecSNN, including liquid preparation, synthesis, and in situ characterization. Symbolic representation of the system can be found in ESI S1.† | ||
The implementation of potential material discovery is based on the random forest algorithm as reported in the previous work.24 The desired low dielectric constant (low DC) polymer generation system consists of two subparts. First, divide all polymers into low, medium, and high DC groups. It aims to select the commonalities of low DC. According to the verification, this progress could reach more than 90% of the accuracy of property prediction. After that, based on the decision tree, a series of possible low DC polymers with similar structures and functional groups would be generated for synthesis. In practice, the autonomous synthesis unit will sequentially perform and optimize all the reactions in the tree. Moreover, the potential material discovery algorithm determines that all the structures in this tree share many commonalities, especially reaction mechanisms and binding sites. Therefore, the learning outcome from previous reactions could be easily transferred to later ones.
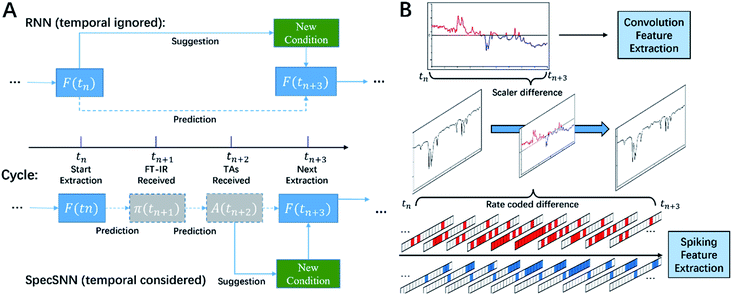
After confirming desired properties and base structures, the autonomous synthesis unit will conduct the self-optimization synthesis procedure. The initial conditions are referenced from previous literature. This optimization algorithm aims to dynamically adjust the conditions, including temperature and stirring speed, during the reaction according to the in situ characterization results and, finally, a better product property and less synthesis time. Like many sequential and time-based training tasks, the chemical reaction procedure is also a time series task suitable for recurrent training architecture. Therefore, directly applying a classical LSTM to these data should also be trainable. However, as shown in Fig. 2A, directly implementing the RNN without considering the time factor cannot precisely predict the changing states during the reaction. Although we can further segment the difference between two spectra to construct a pseudo-time-dependent RNN, as the reactant could not be purified, the quality of the in situ characterization spectra is limited. Only minor differences between each spectrum by applying this dataset to the RNN will cause it to quickly become overfit. Another serious shortcoming of the RNN is its pseudo time dependence, which could not precisely reflect the intensity change rate. As a solution, inspired by Xing,25 we use the spiking coded difference between spectra as the training dataset and replace the traditional RNN with the spiking neural network (SNN), as illustrated in Fig. 2B.
Specifically, the main difference between SpecSNN and the traditional CNN–RNN structure is the way of handling the input spectrum, which is clearly illustrated in Fig. 2 and 3. For SpecSNN, after spectra are inputted into the training network, they will first be (0,1) normalized according to the baseline and max absorption rate. It should be noted that the neuromorphic dataset applied to the SNN only consists of polarities as limited by computational complexity. Recall that the in situ testing interval for the automatic synthesis unit is 10 min for best stability. Therefore, the temporal gap must be narrowed (oversampling) so that rate coding can be used to quantify the intensity change between each testing time point. After transforming from a one-dimensional absolute value coded spectrum into a spiking rate coded sequence, an event-based spiking convolutional network (SCNN) is implemented to extract features from transferred data. Inspired by the spiking convolution operation proposed by Cao,26 we developed a similar method to code and trained our scalar data in a spiking way.
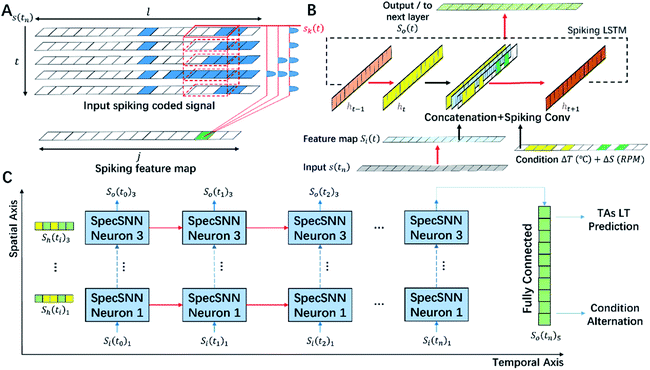
The structure of our optimizer, SpecSNN, is shown in Fig. 3. It receives transferred spiking coded signals from the FT-IR and outputs the quality prediction of target samples and the next condition alternation path. As illustrated in Fig. 2B, the input spiking sequence s(n) will first be separated into s(lx, tn) to get an output tensor shaped in (l, Tmax, P). In this tensor, l is the spatial segment of the spectrum which depends on the spectrum resolution Rs, Tmax is the temporal segment based on a pre-defined time resolution r, and P is the activation trigger (see Fig. 3A and ESI S2† for details).
The s(lx, tn) with the shape of (l, Tmax, P) will then be convoluted with a temporal-based convolutional kernel to generate a spiking feature map. Considering an initial 1D spiking input signal S(tn), for one segment on l, all the spikes will form a spike series sk(t) (k represents the position in the spectrum). For all spike trains to be covered inside one 1D convolutional kernel, we use the model of spike layer error reassignment (SLAYER)27 to handle the generation of the potential of that neuron. For this model, all spike trains sk(t) transmitted at t will be convoluted by a spike response kernel σ(t). With this progress, a spike response signal of the SRM neuron will be generated as a(t) = σ(t)sk(t), after which an input feature map Si(t) with a length of j will form.
Like most deep neural network structures, to further extract features on different scales from existing features, we implement similar multilayer structures to expand the depth of the neural network to 5 layers. This structure is inspired by ConvLSTM28 and SCRNN,25 where the core structure of a single neuron and the whole recurrent framework is presented in Fig. 3C. Specifically, the temporal-based spiking convolution will be applied to both the input-internal stage and the temporal state update stage (see Fig. 3B black arrows). It will generate an input state Si(t) and a hidden state ht, respectively. Finally, three feature maps in Fig. 3B are concatenated to form a single map and further used to generate two output states, current state output So(t) and hidden state ht+1 by the spiking convolution part of the neuron. ht+1 will be directly used as an input for the same neuron at the next time point of the spiking LSTM part, while the So(t) is functional as a further input to the next layer in the deep SNN structure, which is illustrated in Fig. 3C. The details of input pre-processing, the network layer structure, and calculation details are given in ESI S2.†
Experiments
To test the performance of SpecSNN, a trial optimization task was designed to discover new low DC and luminescent materials with a specific wavelength. Furthermore, we have also implemented the most well-researched neural network, CNN–RNN,29 to compare the effectiveness during the in situ optimization. As stated above, unlike entirely data driven conditions, most experiment operations require a period to take effect. In detail, FTIR spectra need 1–2 minutes from sample injection to result collection, and it will be 3–7 minutes for TA spectra. This delay makes the time-dependent optimization module vital in our scenario, which is further discussed in ESI S1.† Back to the in situ optimization, the HAORI will run independently under various conditions for 24 hours to generate an initial map of this set of experiments. Except for this, no prior knowledge is provided to both algorithms. They are currently being tested on the identical product tree with basic BFS search, while they aim to alter reaction conditions to achieve better efficiency continuously. For all experiments in this tree, adjustable conditions are limited to temperature and the flow rate due to the feasibility of experiments and the comparison accuracy between algorithms.For one experiment, excluding two benchmark trials initially, a maximum search number of 18 is also applied due to the same reason. Testing is conducted every 10 minutes during the reaction by extraction from tubes. Finally, the system supports up to three channels simultaneously among all seven due to the number of pumps. The alternation procedure will be triggered every 10 minutes to match the characterization period. The other traditional CNN–RNN algorithm will modify the reaction conditions when two in situ characterization results are available without considering the time factor. The maximum reaction time is set to be 3 hours. However, it could be terminated in advance if the algorithms think that the optimal has been reached.
For the measurement of the optimization objective during the reaction, the dielectric constant could be indirectly derived using the transient absorption lifetime, which can be calculated from the Fermi Golden Rule.30Via the wave functions defined by Dexter,31 where i is the initial state and f is the final state, with the static dielectric constant ε, the lifetime can be expressed as
 | (1) |
Thus, since the absorption peak, i.e., ωif, did not change for the samples measured, one can compare the dielectric constant directly using the lifetime. The longer the lifetime, the lower the dielectric constant.
Discussion
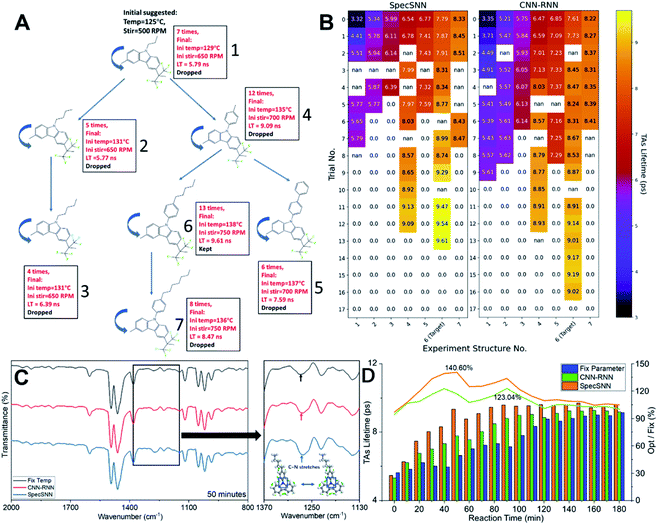
As a result, all the reactions could successfully synthesize the desired monomer of the polymer. We chose to present the key in situ characterization results of the best-optimized reaction (the structure 6 in Fig. 5A) using SpecSNN in Fig. 4A and B. The formula for this specific reaction is shown below. It can be clearly seen that the most noticeable change during the reaction is the formation of C–N stretches, which is also the main spiking weight to be triggered in the SpecSNN. It successfully tracked the FT-IR spectrum change in the fingerprint region and thus successfully optimized the reaction conditions to boost the speed eqn (1).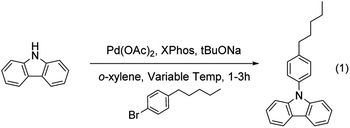 | (2) |
Meanwhile, the TAS lifetime collected also increased rapidly, which indicates a drop in DC using eqn (1). To examine the performance of the final polymer, we manually treated and purified the product above and polymerized it to get the final polymer, which can be viewed in ESI S3.† We chose to conduct it manually because the polymerization is difficult to conduct automatically because of its strong acidity condition, complicated pre-processing requirements, and long reaction time.
The final product is spin-coated and tested for the refractive index using an ellipsometer with a thickness of 200 μm. The dielectric constant ε could then be calculated according to the formula n = √ε; the dielectric constant ε is about 1.32–2.56 and the ε0 = 2.46, which is relatively low and has high potential for use in wireless communication. Compared with PVDF, the most widely discussed polymer used for wireless connections in the 3G/4G/5G era, it has an apparent lower DC in the terahertz area, which is probably the working frequency for 6G. The refractive index for PVDF is nearly 2 for a 200 μm film,32 while for our synthesized polymer, it should be much lower considering expanding the wavelength area to the terahertz area near ε0 as shown in Fig. 4D. A further theoretical calculation has been performed and is illustrated in Fig. S6,† supporting the finding that our synthesized polymer has relatively low DC.
The optimization results clearly show that dynamically altering the reaction conditions guided by algorithms during the organic reaction could improve both the efficiency and quality of the product. Fig. 5C illustrates that reaction efficiency has been improved as the C–N stretch peak grows faster. In a comparison between optimization models, SpecSNN shows relatively better performance. Furthermore, the TAS lifetime trend in Fig. 5B reveals that both the algorithms could automatically learn from previous experiments and improve product quality. This is achieved by applying dynamic reaction conditions, which pushed the reaction optimization to a smart and on-demand era. Almost all experimentally reported conditions are discrete or even static, as only the initial condition would be considered to report and change and then keep it invariant during the whole process. Though the benefits of applying dynamically controlled reactions have been discussed for a long period,33 most proposals could not be completed because of two problems. First, there is a lack of an instrument to control the reaction conditions automatically. Second, it is difficult for human researchers to keep monitoring the reaction at high throughput, which indicates that human optimizers are of low efficiency. These two problems listed above are both solved using SpecSNN we proposed, as it could automatically conduct experiments and automatically suggest condition optimization during the experiments. It would improve if a precise in situ adjustment could be applied to all experiments, and even better, the best condition can be found automatically by the neural network.
We have also compared the efficiency between the two algorithms listed in Fig. 5, which revealed significant differences in performance and efficiency. As a result, SpecSNN performed better for nearly all experiment structures in both aspects, as it could achieve better product quality in fewer trials. In detail, as shown in Fig. 5D, SpecSNN has evident benefits, especially at the beginning of the reaction (<60 min). Considering that the reaction with SpecSNN reaches a relatively steady state after 90 minutes, compared with CNN–RNN, the 30 minute speed advantage boosts the efficiency of this reaction by 25%. SpecSNN can beat its opponent by 5–7% in the product quality. Furthermore, as shown in Fig. 5B, the CNN–RNN spent 11 more trials than SpecSNN, which only performed 60 times of reaction to reach relative optimal. All the comparisons above proved that SpecSNN has a faster optimization speed and higher accuracy in our proposed task.
In principle, many aspects contribute to the final improvement. In our view, the main reason is the non-negligible temporal influence during the experiment. As stated above, most of the in situ characterization techniques cannot be completed inside the reaction tunnel. Instead, it requires the sample to be filled in a testing container. Moreover, the automatic testing procedure of TAS takes several minutes. Considering that it is impossible to remain in a reaction environment outside the tunnel, the characterization result does not represent the state of the current time but the state of extraction time instead. Therefore, it is essential to handle this time gap between states and decide the condition alternation. Otherwise, there will be a significant bias between the optimization strategy and real conditions, which sets up a theoretical upper bound for non-time considered models. This is why the time aspect in SpecSNN takes full advantage.
Another point is the training data volume. The training of CNN–RNN requires a large data volume of spectra with distinguishing features, which is not suitable to handle the minor difference between the in situ testing results. In solution, together with real-time condition input, the temporal segmentation of SpecSNN further increases the data volume in a surrogate approach. Moreover, spiking-based learning would be more efficient in catching slight differences over time. Together, these two reasons secure a better learning outcome for SpecSNN.
Conclusions
To conclude, this work proposed a material synthesis optimizer with an SNN based algorithm (SpecSNN) and autonomous experiment system and used this system to successfully optimize the synthesis of a low DC polymer with alternation of temperature during the reaction. Compared with static temperature or CNN–RNN-based optimizers, our SpecSNN surpassed them mostly in reaction efficiency by shortening the reaction time by at least 25%. This high performance is mainly because of temporal coded spikes, which ensure a real-time-based optimization suitable for inferring the current state when the condition needs to be dynamically controlled. Many targeted pre-processing methods such as conditional normalization, interpolation, and high sensitivity have been applied to the input. Though limited by the in situ characterization speed, only 10 min per sample of the testing rate can be achieved. For now, this algorithm still performed well, which revealed the high potential of SpecSNN in small sample temporal-related optimization tasks. It could be foreseen that the time gap between the tested state and the current state will still be a significant problem to solve in the future of in situ reaction optimization. By conducting a series of experiments to find a low DC polymer and optimize its synthesis for better efficiency, HAORI shows its value in new material discovery and potential for being industrialized in chemical engineering.Data availability
All the SpecSNN model related code can be found at https://github.com/Spider-scnu/Spiking-ConvLSTM.Conflicts of interest
There are no conflicts to declare.Acknowledgements
We acknowledge Mr Xu Shangqian from Soochow University for his valuable help with autonomous reaction system design. We would also appreciate Mr Liu Rulin for his work in TA spectrum fitting and algorithm construction, without which we could not complete an in situ qualitative analysis of the refractive index. This work was supported by the National Natural Science Foundation of China (grant no. 22075240), the Shenzhen Fundamental Research Foundation (JCYJ20210324142213036, JCYJ20180508162801893), and the Shenzhen Institute of Artificial Intelligence and Robotics for Society (AIRS).Notes and references
- A. Mishra, S. Satsangi, A. C. Rajan, H. Mizuseki, K.-R. Lee and A. K. Singh, J. Phys. Chem. Lett., 2019, 10, 780–785 CrossRef CAS PubMed.
- J. Lee, A. Seko, K. Shitara, K. Nakayama and I. Tanaka, Phys. Rev. B, 2016, 93, 115104 CrossRef.
- S. Wu, Y. Kondo, M.-a. Kakimoto, B. Yang, H. Yamada, I. Kuwajima, G. Lambard, K. Hongo, Y. Xu and J. Shiomi, npj Comput. Mater., 2019, 5, 1–11 CrossRef CAS.
- B. A. Grzybowski, S. Szymkuć, E. P. Gajewska, K. Molga, P. Dittwald, A. Wołos and T. Klucznik, Chem, 2018, 4, 390–398 CAS.
- T. Klucznik, B. Mikulak-Klucznik, M. P. McCormack, H. Lima, S. Szymkuć, M. Bhowmick, K. Molga, Y. Zhou, L. Rickershauser and E. P. Gajewska, Chem, 2018, 4, 522–532 CAS.
- B. Mikulak-Klucznik, P. Gołębiowska, A. A. Bayly, O. Popik, T. Klucznik, S. Szymkuć, E. P. Gajewska, P. Dittwald, O. Staszewska-Krajewska, W. Beker, T. Badowski, K. A. Scheidt, K. Molga, J. Mlynarski, M. Mrksich and B. A. Grzybowski, Nature, 2020, 588, 83–88 CrossRef CAS PubMed.
- J. Li, J. Li, R. Liu, Y. Tu, Y. Li, J. Cheng, T. He and X. Zhu, Nat. Commun., 2020, 11, 1–10 CAS.
- B. J. Reizman, Y.-M. Wang, S. L. Buchwald and K. F. Jensen, React. Chem. Eng., 2016, 1, 658–666 RSC.
- C. W. Coley, D. A. Thomas, J. A. M. Lummiss, J. N. Jaworski, C. P. Breen, V. Schultz, T. Hart, J. S. Fishman, L. Rogers, H. Gao, R. W. Hicklin, P. P. Plehiers, J. Byington, J. S. Piotti, W. H. Green, A. J. Hart, T. F. Jamison and K. F. Jensen, Science, 2019, 365, eaax1566 CrossRef CAS PubMed.
- B. J. Shields, J. Stevens, J. Li, M. Parasram, F. Damani, J. I. M. Alvarado, J. M. Janey, R. P. Adams and A. G. Doyle, Nature, 2021, 590, 89–96 CrossRef CAS PubMed.
- D. Angelone, A. J. Hammer, S. Rohrbach, S. Krambeck, J. M. Granda, J. Wolf, S. Zalesskiy, G. Chisholm and L. Cronin, Nat. Chem., 2021, 13, 63–69 CrossRef CAS PubMed.
- C. W. Coley, N. S. Eyke and K. F. Jensen, Angew. Chem., Int. Ed., 2020, 59, 23414–23436 CAS.
- W. Gao, P. Raghavan and C. W. Coley, Nat. Commun., 2022, 13, 1–4 Search PubMed.
- R. W. Epps, M. S. Bowen, A. A. Volk, K. Abdel-Latif, S. Han, K. G. Reyes, A. Amassian and M. Abolhasani, Adv. Mater., 2020, 32, 2001626 CrossRef CAS PubMed.
- K. Abdel-Latif, R. W. Epps, F. Bateni, S. Han, K. G. Reyes and M. Abolhasani, Adv. Intell. Syst., 2021, 3, 2000245 CrossRef.
- J. Li, Y. Tu, R. Liu, Y. Lu and X. Zhu, Adv. Sci., 2020, 7, 1901957 CrossRef CAS PubMed.
- J. Li, M. Hu, Z. Wang, Y. Lu, K. Wang and X. Zhu, J. Mater. Chem. A, 2019, 7, 27241–27246 CAS.
- D. Reker, E. A. Hoyt, G. J. L. Bernardes and T. Rodrigues, Cell Rep. Phys. Sci., 2020, 1, 100247 Search PubMed.
- A. D. Clayton, J. A. Manson, C. J. Taylor, T. W. Chamberlain, B. A. Taylor, G. Clemens and R. A. Bourne, React. Chem. Eng., 2019, 4, 1545–1554 CAS.
- M. Rueping, T. Bootwicha and E. Sugiono, Beilstein J. Org. Chem., 2012, 8, 300–307 CrossRef CAS PubMed.
- A. Rao, M. Schoenenberger, E. Gnecco, T. Glatzel, E. Meyer, D. Brändlin and L. Scandella, J. Phys.: Conf. Ser., 2007, 61, 192 Search PubMed.
- A. E. Vladár and V.-D. Hodoroaba, in Characterization of nanoparticles, Elsevier, 2020, pp. 7–27 Search PubMed.
- T. Li, A. J. Senesi and B. Lee, Chem. Rev., 2016, 116, 11128–11180 CAS.
- J. Liang, S. Xu, L. Hu, Y. Zhao and X. Zhu, Mater. Chem. Front., 2021, 5, 3823–3829 RSC.
- Y. Xing, G. Di Caterina and J. Soraghan, Front. Neurosci., 2020, 14, 1143 Search PubMed.
- Y. Cao, Y. Chen and D. Khosla, Int. J. Comput. Vis., 2015, 113, 54–66 CrossRef.
- S. B. Shrestha and G. Orchard, arXiv preprint arXiv:1810.08646, 2018.
- S. Xingjian, Z. Chen, H. Wang, D.-Y. Yeung, W.-K. Wong and W.-c. Woo, 2015.
- S. Khaki, L. Wang and S. V. Archontoulis, Front. Plant Sci., 2020, 10 Search PubMed.
- D. J. Griffiths and D. F. Schroeter, Introduction to Quantum Mechanics, Prentice Hall, 1994 Search PubMed.
- D. Dexter, in Solid state physics, Elsevier, 1958, vol. 6, pp. 353–411 Search PubMed.
- S. Wang, S. Wang, C. Wang, Q. Li, L. Han and W. Kong, Terahertz Dielectric Properties of Polyvinylidene Fluoride Films, in The International Photonics and Optoelectronics Meeting 2017, OSA Technical Digest (online), Optica Publishing Group, paper ASu3A.5, Wuhan, 2017 Search PubMed.
- C. D. Armstrong and A. R. Teixeira, React. Chem. Eng., 2020, 5, 2185–2203 RSC.
Footnote |
| † Electronic supplementary information (ESI) available. See https://doi.org/10.1039/d2dd00048b |
| This journal is © The Royal Society of Chemistry 2022 |

