Spatial modeling for radon concentrations in subway stations in Seoul, Korea
Dohyeong
Kim
 a,
Seonga
Cho
 b,
Heba
Mohiuddin
a,
Wonboo
Shin
c,
Donghyun
Lee
 d,
Yul
Roh
 *e and
Sungchul
Seo
 *f
*f
aUniversity of Texas at Dallas, 800 W Campbell Road, Richardson, TX 75080-3021, USA
bUC Santa Barbara, Santa Barbara, California 93106, USA
cKorea Evaluation Institute, 90, Jungang-ro, 15-gil, Guro-gu, Seoul, 08239, Republic of Korea
dInstitute for Environment Health and Safety (EHS), Seoul, 04788, Republic of Korea
eChonnam National University, 77, Yongbong-ro, Buk-gu, Gwangju, 61186, Republic of Korea. E-mail: rohy@jnu.ac.kr
fEulji University, 553, Sanseong-daero, Sujeong-gu, Seongnam-si, Gyeonggi-do 13135, Republic of Korea. E-mail: seo@eulji.ac.kr
First published on 6th December 2021
Abstract
This study examined the environmental and geological determinants of radon concentration in subway stations by applying a spatial statistical model to the integrated GIS database. The data were collected for 237 underground subway stations located inside the city of Seoul, South Korea and used for mapping to illustrate the spatial distribution of airborne radon exposure and analysis of potential contribution of station-specific and geological determinants. A Bayesian conditional autoregressive regression (CAR) model was developed to explain the radon concentrations, and the predicted radon surface was generated and visualized to identify hotspot regions where elevated radon exposure is likely to be present in underground settings. The findings include: (1) subway stations located within granite bedrock maintained relatively higher radon concentrations; (2) underground radon emanation is not only controlled by lithology and the associated uranium content of the rocks and soil, but also by structural factors which facilitate easy migration of radon from deeper parts of the earth's crust; (3) radon risks would be elevated if the underground facility is constructed too deep without any control measure; and (4) not only the foundation of an underground facility but also the nature of the soil and rocks in the vicinity helps determine whether or not dangerous levels of radon gas are likely to accumulate inside. This modeling effort is expected to provide guidelines regarding the identification of future station locations with a lower radon risk and the mandatory installation of adequate radon reduction systems for the underground space where people stay or commute for long periods of time.
Environmental significanceConcerns are growing about the potential health threats from exposure to radon in indoor environments, but the roles of natural and built environmental determinants remain unknown. Considering the high frequency of subway use and the long time staying within a station among citizens in Seoul, cumulative radon exposure needs scientific attention, particularly in a station where elevated levels of radon have been reported. Constant monitoring of radon in underground places combined with evidence-based intervention is highly recommended. This study demonstrated the spatial patterns of radon exposure in subway stations and the contributing factors and predicted where and in what settings radon levels would be expected to be higher, which could help prioritize necessary actions for both the existing and future subway stations. |
1. Introduction
Radon (Rn) is a derivative of molecules commonly found in soil and rocks, which can become hazardous by way of excreted radon atoms entering surrounding air or water.1 Extensive epidemiological evidence has established that insistent exposure to radon can cause severe ailments, including lung cancer.2–5 Exposure to radon has also been associated with the development of nonmalignant respiratory disease6 and adverse reproductive outcomes, albeit less explicitly.7,8 Additionally, it has been found that the likelihood of these adverse effects is exponentially heightened in enclosed environments, largely due to the lack of ventilation that is otherwise present in outdoor settings.9 When radon and its decay products are present within indoor environments, the molecules can evenly disperse within the confines of the space to create hazardously high concentrations of radon gas.10 Even when limited to smaller doses, long-term exposure to this environment can largely increase the mortality risk by lung cancer and other diseases among those who frequent or live within the dwelling.10,11 This effect is prevalent within subway stations, where pedestrians and commuters are subjected to extensive exposure to the environmental factors present within the station, including its radon levels.12Given the severe consequences of excessive exposure to radon molecules, radon concentrations for indoor and residential areas are regulated in many countries.13–15 In the United States, there are no federal regulations that govern acceptable levels of radon gas, but EPA recommendations state that homes should be fixed if radon levels exceed 148 Bq m−3, due to established correlations with health risks beyond this threshold.16 In 1998, the Indoor Radon Abatement Act in the U.S. set the goal for the indoor radon concentration threshold to match those of natural outdoor environments – near 14.8 Bq m−3.17 In South Korea, the Korean Ministry of the Environment (KME) set their suggested indoor radon concentration to the same standard of the United States: below or equal to 148 Bq m−3.18 Both the United States and South Korea's standards are lower than those set by Canada and the United Kingdom, who recommend 200 Bq m−3 or below.19,20 The UK also set an action target level of 100 Bq m−3, similar to the US's 1988 goal.20 The lowest threshold concentration for indoor environments was proposed by the World Health Organization in 2009, which recommends the maintenance of radon levels below 100 Bq m−3.17 Overall, western states, including Canada and the United Kingdom, tend to permit slightly higher radon levels as compared to those established by Asian countries, like South Korea, with the exception of the United States. Nonetheless, the intergovernmental organization standard holds the lowest threshold recommendation.
Although these regulations set a standard, they are limited due to the fact that they pertain specifically and exclusively to households, which pose a significantly lower risk of radon gas accumulation than underground settings.13 The risks associated with the exposure to and ingestion of radon gas within indoor spaces become further amplified within underground environments, such as subway stations21 or mining facilities.22 The increased risks of excessive exposure to radon in underground settings can be attributed to multiple factors, including close proximity to the elements releasing radon gas, tightly confined spaces, and aged construction.13 All of these factors work to exacerbate not only the amount of exposure to the gas but also its detrimental effects on the human body. Proximity to elements releasing radon gas is a salient aspect of mitigating radon exposure within underground spaces and is the focus for numerous rising studies.23 In order to properly identify regions particularly vulnerable to excessive radon concentrations, research has been focused on the geological aspects of these radon-dense areas.24 Particular rock types were identified to be high producers of radon, including uriniferous metamorphic rocks and granites, glacial deposits derived from uranium-bearing rocks and sediments, and uranium- and radium-enriched soils.23 The release of radon gas from these rocks is typically mobilized by the radioactive decay process but can also be catalyzed by the agitation of disaggregated samples of these uranium-containing rocks, which can be seen within turbulent underground infrastructure, such as subway stations. The construction and persisting turmoil seen in underground transportation can therefore be conducive to significantly larger concentrations of radon gases and pose larger threats to human health.14 Although research on radon exposure in underground facilities is extensive and has spanned multiple countries, the majority of these studies focused primarily on descriptive portrayals of radon distribution.13,14 These studies describe radon gas mitigation procedures, including installation of ventilation systems and screen doors, but do not discuss geological or facility-related risk factors, particularly in relation to the region at which the underground facilities were developed.
Radon concentrations are a growing concern in the subway stations in South Korea. These subways are a major part of the country's public transportation for individuals of all ages. They have been considered highly susceptible to inflated radon concentrations, due to their intrinsically confined spaces, old buildings, and structural contact with soil, sediment and bedrock, which increased the potential of adverse health effects on the population, particularly on children.13 During the past decade, extensive literature has been dedicated to radon concentrations in subway stations in South Korea.13,21,25 Although these studies generally measured the ongoing levels of radon concentrations or exposure of certain groups within subway stations in South Korea, as well as proposed contributing factors and possible measures to mitigate radiation, they failed to evaluate the relative contribution of multiple factors to explain the spatial distribution of radon concentration levels found in subway stations, leading to limited predictability in identifying the potentially risky areas for radon exposure for mitigation and prevention purposes. Therefore, this study constructed the GIS database by integrating multiple risk factors (both geologic and facility-specific aspects contributing to radon concentrations within subway stations) and applied a Bayesian spatial statistical model to predict the full radon surface in underground settings, as well as identifying the hotspot regions where elevated radon exposure is likely to be present. The purpose of this study is to comprehensively aggregate both the contributing and mitigating factors of radon to identify underground radon hotspots, and possibly discourage the construction of subterranean junctions or recommend installing additional preventive or corrective measures within these regions due to potential health risks associated with exposure to the gas.
2. Materials and methods
2.1 Radon concentration in subway stations in Seoul
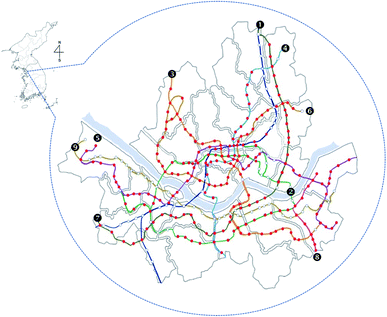
As seen in Fig. 1, there are 9 subway lines in Seoul, South Korea consisting of 409 stations. Except for the on-ground stations as well as a new metro line (Line 9) which is still under construction, both the radon concentration data and station characteristics were collected for 237 underground subway stations located inside the city boundary. The airborne radon concentrations were measured by the Seoul Metro Corporation over three winter months (December to February) every other year since 2007 (2007, 2009, 2011, 2013, 2015, 2017 and 2019) and the data were obtained from their official website (http://www.seoulmetro.co.kr/kr/board.do?menuIdx=495). The latest data (2019) were used for most of the mapping and analysis, while statistical analyses were performed separately in each year.Considering the high indoor concentration of radon during winter time in South Korea like many other countries,26,27 airborne radon measurements were performed for three winter months (December–February) inside each station using a passive sampler (RADUET; Radosys®, Budapest, Hungary) according to the Korean Standard of Process for Measurement of the Indoor Air Quality accredited by the Korean Ministry of Environment.28 The minimum detection limit is 3 Bq m−3. Three detectors were hung from the ceiling at various locations in the platform of each station at a height of 1.5–2.0 meters from the floor and 1.0 meter from the wall. Each detector was placed around both ends and the middle of the platform, respectively. After the measurement of radon for three months, CR-39 detectors of RADUET were chemically etched with 6.25 M NaOH solution for 4.5 h at 90 °C in the laboratory, as proposed by the manufacturer. The track counting was also conducted with a commercial automatic imaging processor, and the specific exposure values in kBq*h m−3 of each chamber were calculated from the specific chamber's track density by matrix multiplication.29 The commercial automatic imaging processor for CR-39 detectors of RADUET was evaluated with accuracy (relative percent error) and precision (coefficient of variation). The relative percent error of the commercial automatic imaging processor was −3.7–6.1% (warning level of the relative percent error of U.S. EPA was ±20%).30 The coefficient of variation (COV) was calculated as: COV (%) = [s/mean] × 100 (where, s = standard deviation and mean = average value of measurement) and ranged from 3.1% to 5.4% (control limit of coefficient of variation of U.S. EPA was ±30%).30 The mean value of three measurements was then calculated and used for statistical analysis.
As summarized in Table 1, a total of 237 stations within the Seoul boundary were included in this study and the mean depth ranged from 9.84 to 22.38 meters. Most stations included in the 2019 data were built during the 1980s and 1990s. The radon concentrations range from 9.0 to 85.3 Bq m−3, which is below the U.S. EPA's action level guideline of 148 Bq m−3 (U.S. EPA, 1993) but higher than the U.S. national goal (14.8 Bq m−3) for indoor radon levels in most stations according to the Indoor Radon Abatement Act.17
| Line 1 | Line 2 | Line 3 | Line 4 | Line 5 | Line 6 | Line 7 | Line 8 | Total | |
|---|---|---|---|---|---|---|---|---|---|
| Stations selected for monitoring | 10 | 37 | 32 | 21 | 51 | 38 | 37 | 11 | 237 |
| Mean depth (m) | 9.84 | 13.30 | 17.29 | 15.79 | 21.77 | 21.28 | 21.50 | 15.41 | 18.39 |
| Radon concentration (Bq m−3) (mean/range) | 24.2 (14.5–37.0) | 27.7 (11.0–53.0) | 29.5 (9.5–85.3) | 28.9 (12.0–73.0) | 28.8 (11.0–55.3) | 30.4 (9.0–75.0) | 31.3 (9.0–81.0) | 16.7 (11.0–25.7) | 28.6 (9.0–85.3) |
2.2 Geological data
Using the five digital geological maps of 1:50![[thin space (1/6-em)]](https://www.rsc.org/images/entities/char_2009.gif) 000 scale (Seoul, Anyang, Ttukseom, Dunjeon, and Uijeongbu) purchased from the Korea Institute of Geoscience and Mineral Resources (https://www.kigam.re.kr/pub/gmNumPage.es?mid=a10708040000), the geologic map was constructed to illustrate the geospatial distribution of underground geological features that may potentially influence radon exposure in subway stations. The data containing a series of station-specific characteristics were integrated with the geological GIS database for comprehensive mapping and analysis of potential contribution to the levels of airborne radon within underground subway stations.
000 scale (Seoul, Anyang, Ttukseom, Dunjeon, and Uijeongbu) purchased from the Korea Institute of Geoscience and Mineral Resources (https://www.kigam.re.kr/pub/gmNumPage.es?mid=a10708040000), the geologic map was constructed to illustrate the geospatial distribution of underground geological features that may potentially influence radon exposure in subway stations. The data containing a series of station-specific characteristics were integrated with the geological GIS database for comprehensive mapping and analysis of potential contribution to the levels of airborne radon within underground subway stations.
The regional geology of Seoul consists of Precambrian metamorphic rocks (gneiss and schist), Jurassic Kwanaksan and Seoul granite, and Quaternary alluvium. Jurassic Kwanaksan granite covers the southern part of Seoul and Jurassic Seoul granite covers the northern part of Seoul. Major parts of Precambrian metamorphic rocks are banded with biotite gneiss, fine grained gneiss, and mica schist. Jurassic plutonic Kwanaksan and Seoul granite is mainly biotite granite with porphyritic granite. Dominantly coarse-grained, sandy alluvium sequence (less than 20 meters thick) occurs along the Han River and its tributaries.31 In the Seoul Metropolitan area, distribution ratios of basement rocks and alluvium decrease in the order of metamorphic rocks (gneiss and schist, 53.1%), igneous rock (granite, 24.0%), and alluvium (loose, unconsolidated soil or sediment, 22.9%).
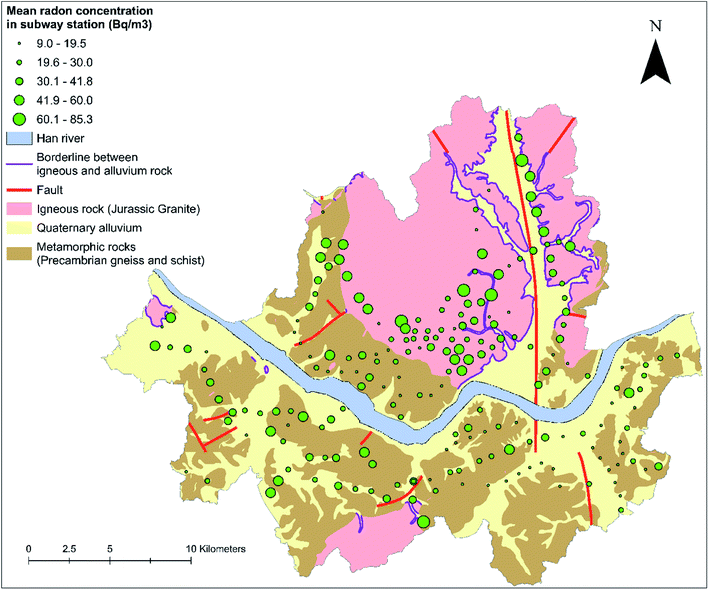
The average U concentrations in Seoul vary according to bedrock types. For example, there is 9.40 ± 10.11 mg kg−1 in the Precambrian metamorphic rocks, 9.08 ± 2.85 mg kg−1 in the Jurassic Kwanaksan granite, and 4.94 ± 1.43 mg kg−1 in the Jurassic Seoul granite.32 Uranium contents in soil samples are 10.30 ± 4.74 mg kg−1 in the Jurassic Kwanaksan granite, 10.10 ± 4.74 mg kg−1 in the Precambrian metamorphic rocks, and 6.69 ± 3.95 in the Jurassic Seoul granite, which closely reflect the content of uriniferous minerals.32 Besides, several preferred faults have developed in Seoul in the south–north, east–west, and north–east directions (see Fig. 2). Faults and other fractures such as joints and shear zones permit efficient transmission of radon gas within underground environments.
2.3 Spatial mapping and modeling
Using the GIS database including radon concentrations for each subway station as well as various station-specific and underground geologic risk factors in Seoul, three analytic steps were undertaken to explore the spatial relationship between the radon concentration and various risk factors spatially distributed in Seoul. First, a map of Seoul was created to show the spatial distribution of radon concentrations in subway stations and geological features such as underground rock type and major faults. A series of exploratory analyses were then performed to illustrate univariate and bivariate relationships between radon concentrations and the risk factors included in the database. The station-specific variables include years since construction (both linear and quadratic effects), depth of station, and area size of station. Based on many simulations, geologic variables were created to determine the measurable influence of geological factors, such as the distance from the borderline between alluvium and igneous rock (meter), proportion of granite in a 1 km radius around each station (%), and distance to the nearest fault (meter). A series of dummy variables were created to indicate Line-specific characteristics, with Line 8 as baseline as the most recent subway line in Seoul. Using a total of 14 independent variables, a Bayesian conditional autoregressive regression (CAR) model was run for each year to explain radon concentrations and the statistical model results were compared. The CAR model, specifying spatial autocorrelation as being in the error term, applies the Bayesian approach to allow for more flexible incorporation of complicated spatial data structure.33 Finally, the predicted radon surface was generated and visualized over the entire area of Seoul by using only significant variables from the CAR model for the depths of 10 and 50 meters below the ground, which should identify hotspot regions where elevated radon exposure is likely to be present in underground settings. The GIS mapping and statistical analyses were done by R 4.0.3 and ArcGIS 10.7.3. Results and discussion
3.1 Spatial distribution of radon concentrations in subway stations in Seoul
Fig. 2 shows the mean radon concentration in each of 237 subway stations in Seoul, along with various geological features such as rock types (igneous rock, quaternary alluvium or metamorphic rock) and fault lines. Although the radon concentrations varied significantly from station to station, it appears from the map that the radon concentrations were relatively high in some stations mainly located within granite bedrock and near the fault zones. Many stations with high concentrations in the northern region of the city are located in a formation of Jurassic Seoul granite and near the south–north directed fault zone on granite, suggesting that radon concentrations were preferentially localized in the granite bedrock near the fault zones. The granite and soils formed from the granite have the highest potential levels for radon production due to uranium-bearing minerals. The presence of faults (shear zones) with their enhanced fluid flow frequently results in high radon concentrations in soil gases and the stations.34 The results suggest that the underground radon emanation is not only controlled by lithology and the associated uranium content of the rocks and soil, but also by structural factors which facilitate easy migration of radon from the deeper parts of the earth's crust.35 The presence of geologic faults near indoor facilities increases their vulnerability to elevated indoor radon by offering favorable pathways from the uranium-rich bedrock to the surface.363.2 Roles of geological and station characteristics
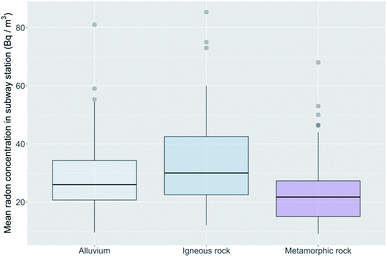
Subway stations located on the igneous rock, mainly Jurassic granite, show the highest mean radon concentration of 33.5 ± 14.5 Bq kg−1, followed by those on Quaternary alluvium (28.5 ± 12.5 Bq kg−1) and metamorphic rock (23.5 ± 11.7 Bq kg−1), mainly gneiss. The differences were statistically tested by one-way ANOVA (F-ratio: 11.17; p <0.0001). Fig. 3 shows a box plot illustrating the full distribution of radon measurements by rock type. These results support the previous findings that indoor radon concentrations are closely related to soil permeability and types of bedrock.13,32,37A number of studies focused on the roles of underlying rock types on which a subway station is located,13,32,38 but there was a huge variation of radon concentrations within the same rock type. Aside from station-specific characteristics, the distance to the borderline between different rock types could contribute as well. Fig. 4 shows a negative association between the radon concentration and distance from the borderline between alluvium and igneous rocks. This result highlights the fact that radon concentrations depend mainly on two factors such as the distance radon must travel from its source and the permeability of the soil through which it travels.37,39 The radon concentration within an underground facility would be substantially diminished if it travels a long distance or large area, because the half-life of radon is only 3.8 days and radon completely decays to polonium, lead, and bismuth within several weeks.37,40
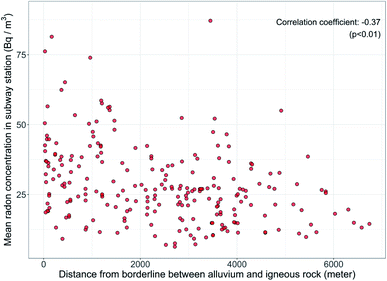 | ||
| Fig. 4 Association between the radon concentration and distance from the borderline between alluvium and igneous rocks. | ||
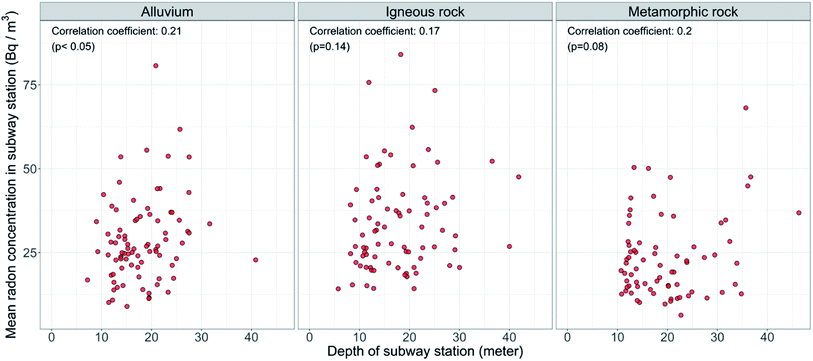
Fig. 5–7 depict the roles of station-specific characteristics in radon concentration inside a subway station, such as the age and depth of the subway station. Fig. 5 shows a positive association between the radon concentration and the depth of station for all three rock types (alluvium, igneous rock and metamorphic rock), but the depth effect was statistically significant only for stations on alluvium (p <0.05), as reflected by a steeper slope. This result indicates that not only the foundation of an underground facility but the nature of the soil and rocks in the vicinity helps determine whether or not dangerous levels of radon gas are likely to accumulate inside. Although radon is likely to be highest where the soils are formed from uranium-bearing parent materials such as granite, pegmatite, and phosphate rock,9 the soil characteristics also play a role in the movement of radon gas from its source in rock and soil minerals to the air inside the facility. Dry, coarse-textured permeable soil or alluvium layers allow much faster diffusion of radon gas than a wet or fine-textured soil or alluvium. If the soil around the underground facility is relatively impermeable, radon movement tends to be slow that almost all of the emitted radon will decay before reaching the foundation of the facility.32,37,39
Although these results correspond to the previous studies reporting elevated radon found in deeper stations,21 this depth effect is winding down among relatively younger stations where various efforts were made to reduce radon concentrations such as installing ventilation systems12 and screen doors.41 Jeon et al. (2012) reported the effect of screen doors on preventing radon gas flowing into platforms, based on the test results from a subway station in Seoul between 2000 and 2006.41 After installing screen doors, the annual average of air radon concentration in platforms was reduced from 51.4 Bq m−3 to 18.9 Bq m−3. In addition, a couple of ventilation systems installed in platforms and tunnels were found to expel radon gas out of the tunnel and reduce the indoor radon concentrations.
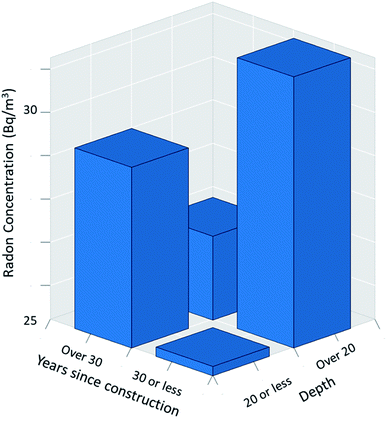
Most of the old stations constructed over 30 years ago in Seoul (Lines 1–4) were located at the depth of less than 20 meters from the ground surface, which could potentially make them farther from uranium-bearing bedrock. Meanwhile, most of the newer subway lines (Lines 5–8) had to go deeper to avoid congestion with the existing underground facilities,42 but their radon concentrations appear low, despite a high depth, in some stations. Of course, some newer stations were constructed not as deep as nearby stations since multiple factors determined the depth of the stations (e.g. connection to underground shopping centers, concourse with other lines, etc.). Fig. 6 illustrates a joint contribution of station age and depth to radon concentrations. The two-way ANOVA test was also performed to determine whether there were statistically significant differences across the four groups by age and depth of stations. The results suggested a significant main effect for station depth (p <0.05) and a significant interaction effect between the station age and depth (p <0.05).
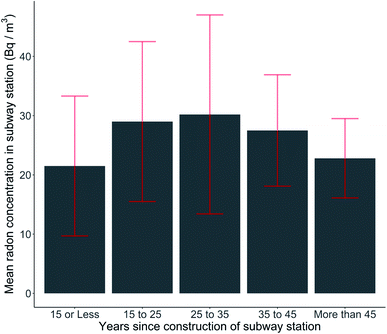
Due to the combined effects of station age and depth along with the recent construction of the radon reduction facilities, it appears that the age effect has an inverse U shape, as shown in Fig. 7. The mean radon concentration among the subway stations aged 15 years old or less was about 21.5 Bq m−3, increased up to 28–30 Bq m−3 for those aged 15–45 years old, and then dropped down to 22.5 Bq m−3 for those aged 45 years old or more. However, given a high level of standard deviation, as depicted by uncertainty bars, the bivariate analysis results did not reach any statistical significance, but highlighted the need of considering several other factors that were jointly associated with this phenomenon, such as geological features. This demonstration requires a multivariate approach for understanding the multifactorial relationships among station-specific and geological characteristics, which were presented later.
3.3 Results of Bayesian statistical modeling
The results of bivariate analyses provided valuable insights on the roles of stations and geologic characteristics in contributing to the radon levels inside subway stations in Seoul. However, they are limited in portraying combined contributions of all the potential determinants while controlling the effects of covariates. Thus, the well-known Bayesian conditional autoregressive regression (CAR) model was used to examine the relative effects of determinants of radon concentration in subway stations, including geological characteristics around the station (distance from the borderline between two different rock types, percent granite in a certain radius around station, distance to the nearest fault), station-specific characteristics (years since construction, depth of station, area size of station), and dummy variables for each subway line (base: Line 8). A series of model specifications were systematically assessed by changing parameters and specification of the model, along with sensitivity analyses. The CAR model captured the spatial dependence among radon concentrations in neighboring subway stations. Although this method is not new, this is the first case applying the model to assess the spatial dynamics of environmental determinants of radon exposure in underground public facilities. The Moran's I measure, the most common global spatial autocorrelation indicator, was found to be 0.1737 (p <0.0001) indicating a significant level of positive spatial autocorrelation among the concentrations. The CAR model helps identify spatial patterns in the determinants, which affect not only radon levels within a station but also levels in neighboring stations. Such spatial dependence is ignored in standard models that assumes independence among observations. The results from the CAR models with the 2007, 2013 and 2019 data are shown in Table 2.| CAR2007 | CAR2013 | CAR2019 | |||||||
|---|---|---|---|---|---|---|---|---|---|
| Coeff. | S. E. | Coeff. | S. E. | Coeff. | S. E. | ||||
| a *p <0.05; **p <0.01. | |||||||||
| Intercept | −120.58 | 50.55 | * | −32.49 | 19.72 | −14.35 | 17.76 | ||
| Years since construction: linear effect | 9.96 | 3.53 | ** | 3.73 | 1.38 | ** | 2.52 | 1.24 | * |
| Years since construction: quadratic effect | −0.16 | 0.06 | ** | −0.06 | 0.03 | * | −0.04 | 0.02 | |
| Depth of station (meter) | 0.49 | 0.20 | * | 0.62 | 0.15 | ** | 0.36 | 0.14 | ** |
| Distance from the borderline between alluvium and igneous rock (meter) | 0.00 | 0.001 | −0.001 | 0.001 | −0.002 | 0.001 | ** | ||
| Distance to the nearest fault (meter) | −0.003 | 0.001 | ** | 0.000 | 0.001 | −0.001 | 0.001 | ||
| Area size of the station (sq. meter) | 0.001 | 0.001 | 0.001 | 0.001 | * | −0.0002 | 0.0002 | ||
| Proportion of granite in a 1 km radius around the station (%) | 0.26 | 0.04 | ** | 0.11 | 0.03 | ** | 0.06 | 0.03 | * |
| Stations in Line 1 | 10.73 | 17.96 | −8.04 | 11.73 | 8.40 | 10.61 | |||
| Stations in Line 2 | −15.63 | 8.03 | −9.30 | 6.09 | 7.40 | 5.48 | |||
| Stations in Line 3 | −16.04 | 7.54 | * | −3.43 | 5.33 | 8.60 | 4.81 | ||
| Stations in Line 4 | −23.06 | 8.14 | ** | −8.42 | 5.94 | 3.67 | 5.36 | ||
| Stations in Line 5 | 12.59 | 6.25 | * | −10.81 | 4.65 | * | 6.52 | 4.19 | |
| Stations in Line 6 | 14.51 | 7.45 | * | −0.16 | 4.96 | 8.27 | 4.48 | ||
| Stations in Line 7 | 9.32 | 6.62 | 7.86 | 4.88 | 8.14 | 4.41 | |||
| Adjusted R-squared | 0.46 | 0.36 | 0.23 | ||||||
Although similar hotspots were identified over the years between 2007 and 2019, we observed a clear temporal trend that the explanatory power of the variables as well as model fit has been significantly reduced over the period. As found in Table 2, most of the variables were found significant in the 2007 model (adjusted R-squared: 0.459), but only four of them remained significant in the 2019 model (adjusted R-squared: 0.228). Although we do not have the data to test or confirm the reason of the change, it is potentially due to the city-wide installation of HVAC systems and screen doors occurred between 2005 and 2009, indicating that the impact of some factors (e.g. distance to the nearest fault, area size of the station, station-specific dummy) could have been reduced or minimized by the potential effect of HVAC or ventilation systems. According to the model results with the latest data (2019), the effects of station depth and distance from the borderline between alluvium and igneous rock on radon concentration were found significant. The proportion of granite in a 1 km radius around the station and the linear effect of years since construction were also found significant. Neither proximity to fault nor station size was found significant in the 2019 model, as well as all dummies for subway lines, possibly due to a growing similarity in indoor subway environments across the stations.
Using the results of the 2019 CAR model, radon exposure concentrations were predicted for the entire area of Seoul which was partitioned into 10 × 10 m2 grids. Assuming the average age of a station as 27.3 years (average years since construction), the 3-dimensional predicted radon surface was generated and visualized over the entire area of Seoul by using only significant variables from the CAR model at two different station depths. Fig. 8 shows the 3-dimensional map illustrating the spatial patterns of potential radon concentration within a subway station if installed at the depth of 10 meters (Fig. 8(a)) and 50 meters (Fig. 8(b)) below the ground. The maps allow for the identification of hotspot regions where elevated radon exposure is likely to be present in underground settings (e.g. Anam, Bonghwasan, Hongje stations, etc.), while also highlighting a higher risk when constructed a deeper underground facility. Fig. 8(b) reveals that most of the areas in Seoul might be subject to potential radon risks if an underground facility is constructed too deep. In fact, the new high-speed express train lines in South Korea, currently under planning, are to be constructed as deep as 40–50 meters.43 These results are expected to provide guidelines regarding not only the identification of future station locations with lower radon risk but also the mandatory installation of adequate radon reduction systems for the underground space where people stay or commute for a long period of time.
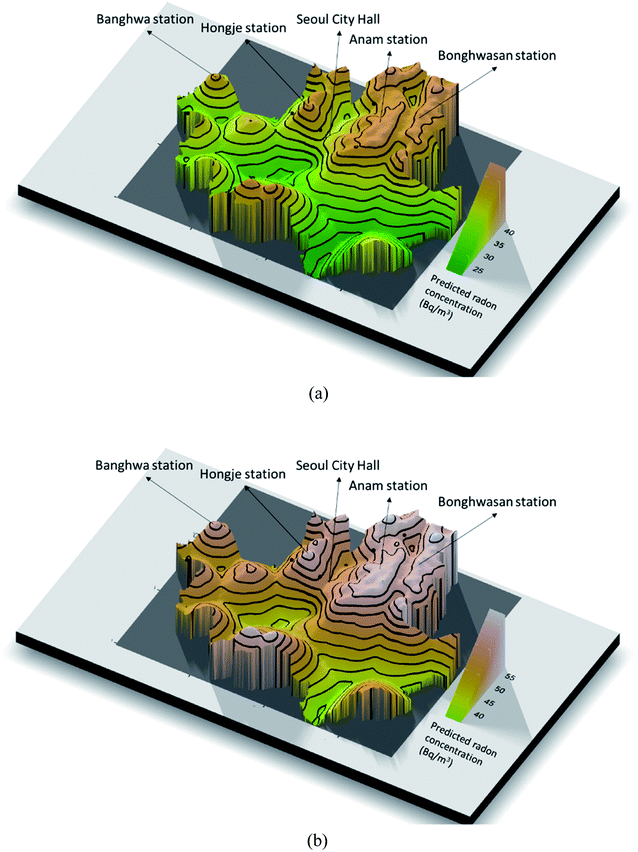 | ||
| Fig. 8 3-dimensional map surface of predicted underground radon concentration (Bq m−3) at the depth of (a) 10 meters, (b) 50 meters. | ||
4. Conclusions
Concerns are growing about the potential health threats from exposure to radon in indoor environments, but the roles of natural and built environmental determinants and their interaction remain unknown. In this study, spatial distributions of radon concentrations in subway stations in Seoul, along with the relative contribution of various geologic and station-specific characteristics, were investigated using GIS-based statistical modeling. However, several limitations should be noted. Despite the potential importance which is supported by the literature,44 the role of mechanical ventilation systems in indoor radon concentration was not considered in this study because there is very minimal variation across all subway stations in Seoul due to the city-wide installation of screen doors and HVAC systems around the same period.45 However, such consistency allowed us to focus on geological and station-related factors in this study. Another limitation would be the need for considering seasonal or yearly variation in the analysis as much as spatial variation. Although similar results were observed in a model with the prior year data (2015 and 2017 data), further investigation would be needed in the future study. Lastly, although the CAR model is theoretically more appropriate in modeling radon variation in underground spaces, its outperformance in terms of model fit and spatial prediction over the OLS model was not found substantial, possibly due to the limited variability in data.It is found that the radon concentration was far below the current Korean action level for indoor facilities of 148 Bq m−3 in all subway stations in Seoul included in this study.13 However, the radon levels were substantially larger than those in subway stations of other comparable cities such as Tokyo (Japan), Barcelona (Spain) and Caracas (Venezuela).46 The low concentration of radon in most of the subway stations in Seoul is majorly attributed to screen doors which were installed to prevent accidents and suicide attempts in most of the platforms between 2005 and 2009. It is reported that screen doors installed in subway stations in Seoul reduced average radon concentrations by 56%.41 In addition, ventilation systems embedded in AC units installed in platforms could also contribute to this reduction.13 Considering the high frequency of subway use and the long time staying within a station among citizens in Seoul, cumulative radon exposure could present a critical environmental health hazard for a longer period of time, particularly in a station where elevated levels of radon have been reported. Following the recommendation of the International Commission on Radiation Protection (ICRP) to make every effort to reduce exposure to all types of radiation to the lowest possible level,47 constant monitoring of radon in underground places combined with evidence-based intervention is highly recommended. The World Health Organization (WHO) and EU directives also recommended that radon-prone areas with even low values of radon concentration should be identified and monitored in dwellings and buildings with public access.48 Identifying potential hotspots of elevated radon exposure in subway stations and the contributing factors allows for scientific prediction on where and in what settings radon levels would be expected to be higher, which could help prioritize policy attention for both the existing and future subway stations and save relevant costs.
Author contributions
Conceptualization, D. K., S. S., and Y. R., investigation, S. C. and D. K., writing—original draft preparation, D. K., S. C., H. M., D. L., Y. R., and S. S., writing—review & editing, all authors.Conflicts of interest
There are no conflicts to declare.Acknowledgements
This study was supported by a grant from the Subway Fine Dust Reduction Technology Development Project of the Korea Ministry of Land Infrastructure and Transport (Project number: 21QPPW-B152306-03).References
- J. D. Appleton, in Essentials of Medical Geology, ed. O. Selinus, Springer, Dordrecht, 2013, pp. 239–277 Search PubMed.
- D. Krewski, J. Lubin, J. Zielinski, M. Alavanja, V. Catalan, W. Field, J. Klotz, E. Letourneau, C. Lynch, J. Lyon, D. Sandler, J. Schoenberg, D. Steck, J. Stolwijk, C. Weinberg and H. Wilcox, Residential radon and risk of lung cancer: a combined analysis of 7 North American case-control studies, Epidemiology, 2005, 16, 137–145 CrossRef PubMed.
- W. Field, A Review of Residential Radon Case-Control Epidemiologic Studies Performed in the United States, Rev. Environ. Health, 2001, 16, 151–167 Search PubMed.
- J. Kang, S. Seo and Y. Jin, Health Effects of Radon Exposure, Yonsei Med. J., 2019, 60, 597–603 CrossRef CAS PubMed.
- J. Gaskin, D. Coyle, J. Whyte and D. Krewksi, Global Estimate of Lung Cancer Mortality Attributable to Residential Radon, Environ. Health Perspect., 2018, 126, 057009 CrossRef PubMed.
- M. Turner, D. Krewski, Y. Chen, A. Pope, S. Gapstur and M. Thun, Radon and COPD mortality in the American Cancer Society Cohort, Eur. Respir. J., 2012, 39, 1113–1119 CrossRef PubMed.
- National Research Council (US) Committee on the Biological Effects of Ionizing Radiations, Health Risks of Radon and Other Internally Deposited Alpha-Emitters: Beir IV, National Academies Press (US), Washington, DC, 1988 Search PubMed.
- E. Silbergeld and T. Patrick, Environmental exposures, toxicologic mechanisms, and adverse pregnancy outcomes, Am. J. Obstet. Gynecol., 2005, 192, S11–S21 CrossRef PubMed.
- G. Kropat, F. Bochud, M. Jaboyedoff, J. Laedermann, C. Murith, M. Palacios and S. Baechler, Major influencing factors of indoor radon concentrations in Switzerland, J. Environ. Radioact., 2014, 129, 7–22 CrossRef CAS PubMed.
- S. Antignani, G. Venoso, M. Ampollini, M. Caprio, C. Carpentieri, C. Carlo, B. Caccia, N. Hunter and F. Bochicchio, A 10-year follow-up study of yearly indoor radon measurements in homes, review of other studies and implications on lung cancer risk estimates, Sci. Total Environ., 2021, 762, 144150 CrossRef CAS PubMed.
- S. Darby, D. Hill, H. Deo, A. Auvinen, J. M. Barros-Dios, H. Baysson, F. Bochicchio, R. Falk, S. Farchi, A. Figueiras, M. Hakama, I. Heid, N. Hunter, L. Kreienbrock, M. Kreuzer, F. Lagarde, I. Mäkeläinen, C. Muirhead, W. Oberaigner, G. Pershagen, E. Ruosteenoja, A. S. Rosario, M. Tirmarche, L. Tomásek, E. Whitley, H. E. Wichmann and R. Doll, Residential radon and lung cancer—detailed results of a collaborative analysis of individual data on 7148 persons with lung cancer and 14
![[thin space (1/6-em)]](https://www.rsc.org/images/entities/char_2009.gif) 208 persons without lung cancer from 13 epidemiologic studies in Europe, Scand. J. Work, Environ. Health, 2006,(32 suppl), 1–83 Search PubMed.
208 persons without lung cancer from 13 epidemiologic studies in Europe, Scand. J. Work, Environ. Health, 2006,(32 suppl), 1–83 Search PubMed. - Y. Wen, J. Leng, X. Shen, G. Han, L. Sun and F. Yu, Environmental and Health Effects of Ventilation in Subway Stations: A Literature Review, Int. J. Environ. Res. Public Health, 2020, 17, 1084 CrossRef PubMed.
- S. Hwang and W. Park, Radon and PM10 concentrations in underground parking lots and subway stations with health risks in South Korea, Environ. Sci. Pollut. Res., 2018, 25, 35242–35248 CrossRef CAS PubMed.
- Y. Alan, B. Akkus and L. Susan, Investigation of radon concentrations of underground metro and Marmaray stations in Istanbul, J. Radioanal. Nucl. Chem., 2019, 322, 291–304 CrossRef.
- H. Zeeb, International Radon Project: Survey on Radon Guidelines, Programmes and Activites, Final Report, World Health Organization, Geneva, 2007 Search PubMed.
- U.S. EPA, Radon, https://www.epa.gov/radon, accessed March 11, 2021.
- Agency for Toxic Substances and Disease Registry, Environmental Health and Medicine Education Standard and Regulations: Radon Toxicity, https://www.atsdr.cdc.gov/csem/radon/standards.html, accessed March 11, 2021.
- B. Djamil, Indoor radon mitigation in South Korea, Int. J. Appl. Eng. Res., 2016, 11, 8521–8523 Search PubMed.
- Health Canada, Guide for Radon Measurements in Residential Dwellings, Canadian Ministry of Health, Ottawa, ON, 2017 Search PubMed.
- A. Denman, R. Crockett and C. Groves-Kirkby, An assessment of the effectiveness of UK building regulations for new homes in Radon Affected Areas, J. Environ. Radioact., 2018, 192, 166–171 CrossRef CAS PubMed.
- S. Yoon, B. Chang, Y. Kim, J. Byun and J. Yun, Indoor radon distribution of subway stations in a Korean major city, J. Environ. Radioact., 2010, 101, 304–308 CrossRef CAS PubMed.
- A. Silva, S. Eston, W. Iramina and D. Francisca, Radon in Brazilian underground mines, J. Radiol. Prot., 2018, 38, 607 CrossRef PubMed.
- J. D. Appleton, Radon: sources, health risks, and hazard mapping, AMBIO A J. Hum. Environ., 2007, 36, 85–89 CrossRef CAS.
- D. Dai, F. Neal, J. Diem, D. Deocampo, C. Stauber and T. Dignam, Confluent impact of housing and geology on indoor radon concentrations in Atlanta, Georgia, United States, Sci. Total Environ., 2019, 668, 500–511 CrossRef CAS PubMed.
- M. Song, B. Chang, Y. Kim and K. Cho, Radon exposure assessment for underground workers: a case of Seoul Subway Police officers in Korea, Radiat. Prot. Dosim., 2011, 147, 401–405 CrossRef CAS PubMed.
- J. C. H. Miles, C. B. Howarth and N. Hunter, Seasonal variation of radon concentrations in UK homes, J. Radiol. Prot., 2012, 32, 275 CrossRef CAS PubMed.
- J. Park, C. Lee, H. Lee and D. Kang, Estimation of seasonal correction factors for indoor radon concentrations in Korea, Int. J. Environ. Res. Public Health, 2018, 15, 2251 CrossRef CAS PubMed.
- H. Ji, J. Yoo, G. Kim, S. Won, S. Kim and J. Lee, A Study on the Concentrations of Indoor Radon for Houses in Chungcheongbuk-do Province, Korea, Journal of Environmental Health Sciences, 2019, 45, 668–674 Search PubMed.
- S. Tokonami, H. Takahashi, Y. Kobayashi and W. Zhuo, Up-to-date radon-thoron discriminative detector for a large-scale survey, Rev. Sci. Instrum., 2005, 76(11), 113505 CrossRef.
- U.S. EPA, National radon proficiency program. Guidance on quality assurance, EPA 402-R-95-012, 1997 Search PubMed.
- B. Choi, S. Yun, S. Yu, P. Lee, S. Park, G. Chae and B. Mayer, Hydrochemistry of urban groundwater in Seoul, South Korea: effects of land-use and pollutant recharge, Environ. Geol., 2005, 48, 979–990 CrossRef CAS.
- Y. Hong, S. Kim and T. Kim, Radon-222 Concentrations of Metropolitan Subway Stations and Soils in the Seoul, Econ. Environ. Geol., 1998, 31, 215–222 Search PubMed.
- F. Dormann, C. McPherson, J. Araujo, M. Bivand, R. Bolliger, J. Carl and R. Wilson, Methods to account for spatial autocorrelation in the analysis of species distributional data: a review, Ecography, 2007, 30, 609–628 CrossRef.
- T. K. Bell, D. G. Cameron, T. B. Colman and P. D. Roberts, Behavior of Radon in the Geological Environment—a Review, Q. J. Eng. Geol. Hydrogeol., 1991, 24, 169–182 CrossRef.
- V. M. Choubey, K. K. Sharma and R. C. Ramola, Preliminary investigations of geology and radon occurrence around Jari in Parvati Valley, Himachal Pradesh, India, J. Environ. Radioact., 1997, 34, 139–148 CrossRef CAS.
- J. Drolet and R. Martel, Distance to faults as a proxy for radon gas concentration in dwellings, J. Environ. Radioact., 2016, 152, 8–15 CrossRef CAS PubMed.
- J. D. Appleton, in Essentials of Medical Geology, ed. O. Selinus, 2013, pp. 239–278 Search PubMed.
- J. S. Jeon and D. C. Kim, Distribution of 222-Rn concentration in Seoul subway stations, J. Korean Soc. Environ. Eng., 2006, 28, 588–595 Search PubMed.
- J. D. Appleton, J. C. H. Miles and M. Young, Comparison of Northern Ireland radon maps based on indoor radon measurements and geology with maps derived by predictive modelling of airborne radiometric and ground permeability data, Sci. Total Environ., 2011, 409, 1572–1583 CrossRef CAS PubMed.
- J. K. Otton, L. Gundersen and R. Schumann, The geology of radon, U.S. Department of the Interior and U.S. Geological Survey, 1992 Search PubMed.
- J. Jeon, J. Yoon, H. Lee, S. Eom and Y. Chae, A Noticeable Change in Indoor Radon Levels After Platform Screen Doors Installation in Seoul Subway Station, J. Korean Soc. Atmos. Environ., 2012, 28, 59–67 CrossRef.
- U. Han, Enforcing Management System for Elevating Convenience Facilities in Subway Stations, Railw. J., 2014, 17, 6–10 Search PubMed.
- L. Karlen, in Handbook on Railway Regulation: Concepts and Practice, ed. M. Finger and J. Montero, Edward Elgar Publishing Limited, Cheltenham, UK, 2020, pp. 132–145 Search PubMed.
- M. Cho, D. Lee, S. Shin, J. Lee and J. Lee, Airborne radon levels of by the depth of subway stations, J. Odor Indoor Environ., 2020, 19, 431–436 CrossRef.
- H. Han, J. Lee and K. Jang, Effect of platform screen doors on the indoor air environment of an underground subway station, Indoor Built Environ., 2015, 24, 672–681 CrossRef CAS.
- S. Hwang and W. Park, Radon and PM10 concentrations in underground parking lots and subway stations with health risks in South Korea, Environ. Sci. Pollut. Res., 2018, 25, 35242–35248 CrossRef CAS PubMed.
- J. Harrison and J. Marsh, ICRP recommendations on radon, Ann. ICRP, 2020, 49, 68–76 CrossRef CAS PubMed.
- F. Bochicchio, Protection from radon exposure at home and at work in the directive 2013/59/Euratom, Radiat. Prot. Dosim., 2014, 160, 8–13 CrossRef CAS PubMed.
| This journal is © The Royal Society of Chemistry 2022 |

