
 Open Access Article
 This Open Access Article is licensed under a Creative Commons Attribution-Non Commercial 3.0 Unported Licence
Protonation-induced fluorescence modulation of carbazole-based emitters†
Essi
Taipale
 a,
Nikita A.
Durandin
b,
Jagadish K.
Salunke
b,
Nuno R.
Candeias
bc,
Tero-Petri
Ruoko
b,
Jas S.
Ward
a,
Arri
Priimagi
*b and
Kari
Rissanen
*a
a,
Nikita A.
Durandin
b,
Jagadish K.
Salunke
b,
Nuno R.
Candeias
bc,
Tero-Petri
Ruoko
b,
Jas S.
Ward
a,
Arri
Priimagi
*b and
Kari
Rissanen
*a
aUniversity of Jyvaskyla, Department of Chemistry, P.O. Box 35, Survontie 9B, 40014 Jyväskylä, Finland. E-mail: kari.t.rissanen@jyu.fi
bFaculty of Engineering and Natural Sciences, Tampere University, P.O. BOX 541, FI-33101 Tampere, Finland. E-mail: arri.priimagi@tuni.fi
cLAQV-REQUIMTE, Department of Chemistry, University of Aveiro, 3810-193 Aveiro, Portugal
First published on 4th January 2022
Abstract
The development of purely organic fluorescence emitters is of great importance for their low cost and high performance. Responding to this demand, carbazole is a promising emitter due to its extensive freedom for functionalisation, high thermal and chemical stability, as well as low cost. Herein, the effect of protonation on the fluorescence of various pyridine-functionalised carbazole-based bipolar host materials was studied both in solution and in the solid-state. The restriction of intramolecular rotation of the molecules upon protonation of the pyridyl-moiety together with easier planarization of the protonated acceptor and the donor moieties and relocalisation of the LUMO orbital on the protonated species was found to increase the fluorescence quantum yield from 16% to 80%. Additionally, in the solid-state, the J-type packing of the molecules further facilitated the increase in the fluorescence quantum yield from 1% to 49%. In both cases, the pronounced bathochromic spectral shift was observed indicating that the gap between the emissive state and the first triplet state of the molecules was diminished upon protonation. Therefore, implementing this strategy could further boost the development of future emitters.
Introduction
Over the last 35 years the field of supramolecular chemistry, studying molecular assemblies held together by weak intermolecular interactions, has become one of the most intriguing fields of chemistry.1 Supramolecular chemistry offers insight into smart molecular design, taking advantage of the directionality of non-covalent bonds and the self-assembling capabilities of molecules. It encompasses a wide variety of applications: weak interactions have been utilised in emission modulation of organic luminescent materials,2 which have widely been applied in fluorescent imaging,3,4 drug release,5–7 sensors,4,8–10 photoelectric devices,11 and organic light-emitting diodes (OLEDs).12The various applications of the purely organic luminescent materials speak for the importance of their development. However, simultaneously achieving high efficiency, long lifetime and low cost with blue organic emitters is still a considerable challenge.13 Additionally, carbazole has commonly been utilised in the design of blue-light emitting diodes for its high triplet energy.14,15 Herein, we have selected it as a central unit due to its extensive freedom for functionalisation, high thermal and chemical stability, as well as low cost.16–18 A relatively new approach to smarter emitter design is bipolar host materials.19–23 They are designed to hold both electron-donating and electron-withdrawing units within the same molecule. The highest occupied molecular orbital (HOMO) and the lowest unoccupied molecular orbital (LUMO) are determined by the electron-donating and electron-withdrawing units, respectively. In comparison to unipolar host materials, bipolar host materials promote balanced charge flux and broaden the exciton recombination.20,21,24 However, the construction of bipolar host molecules with spatially separated donor and acceptor moieties allows the formation of an intramolecular charge transfer (ICT) state, which may exhibit a twisted structure resulting in the excited state energy being consumed by the rotary motion of the molecule.25–27 This results in quenching of the fluorescence and low emission quantum yield.
A way of improving the quantum yield without the tedious work of redesigning the molecular structure is the restriction of the intramolecular rotation by weak interactions.28,29 Intermolecular interactions, such as strong hydrogen-bonding upon protonation, can be used to affect the fluorescence of a compound.30,31 The effect on the fluorescence depends on the strength of the acid, i.e., the stabilising power of the counter-anion involved in the protonation process.32–34 In our previous studies, protonation significantly enhanced the fluorescence intensity of quinoline derivatives over 50-fold increasing the fluorescence quantum yield up to 30%.32 Herein, the effect of the intermolecular interactions on the emission characteristics of the carbazole-based materials upon protonation both in solution and in the solid-state were investigated. Protonation of L1 and L2 (Scheme 1) was found to facilitate the planarization of the pyridyl and the carbazole units, while hindering the complete rotation of the pyridyl moiety. This phenomenon together with changes in the electronic profile due to protonation explain the bathochromic shift in the fluorescence spectra and the enhancement of the fluorescence quantum yield. In L3 and L4, the complete rotation of the pyridyl became more accessible upon protonation, thus leading to fluorescence quenching. However, in solid-state, protonation enhanced fluorescence quantum yield of all the compounds increasing the fluorescence quantum yield of L4 from 1% to a noteworthy 49%.35,36 We envision this strategy to further enhance the development of purely organic emitter materials.
 | ||
| Scheme 1 The compounds L1–L4 studied for the protonation-induced fluorescence enhancement, reference compounds L5–L7, and the acids used in the protonation with their corresponding pKa values.43 | ||
Results and discussion
Materials
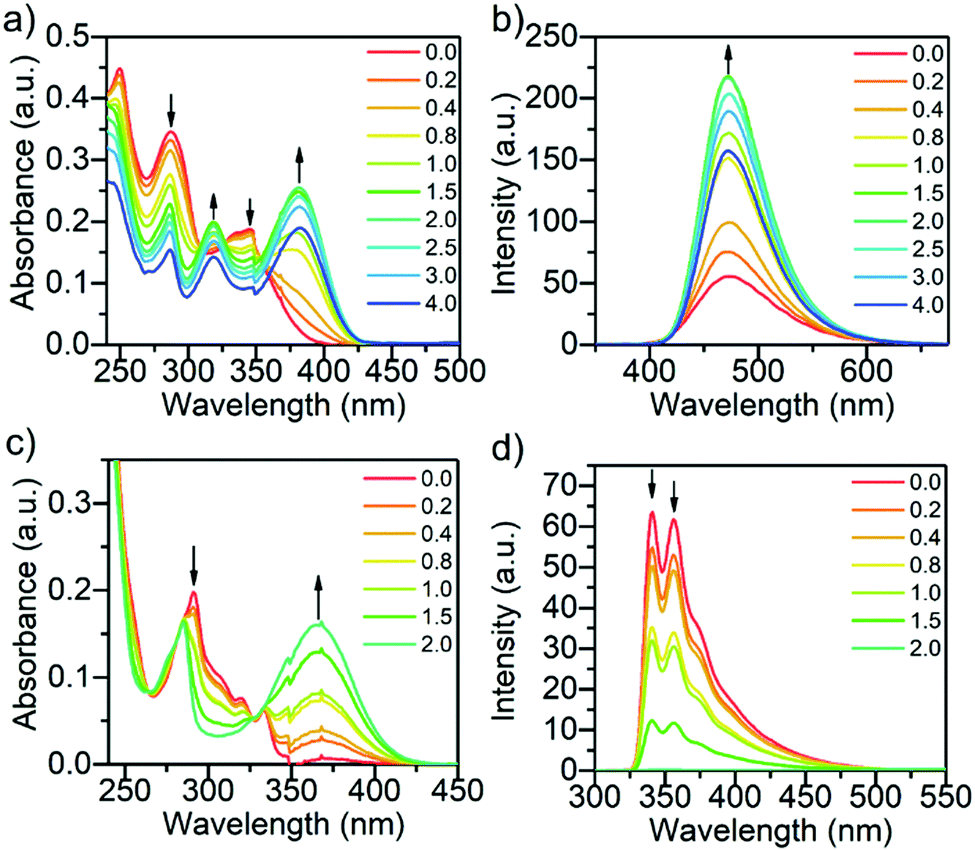
The rationale behind the molecular design is to improve the emission quantum yield by protonation-induced fluorescence enhancement. Therefore, aromatic, moderately electron-accepting benzophenyl and pyridyl groups were introduced to the electron-rich carbazole core to achieve donor–acceptor bipolar host materials.19,37,38 Here the benzophenyl unit is chosen as the electron-withdrawing moiety for L1 and L2, but several research groups have opted for other solutions, such as quinoline or pyridine groups.39,40 For compounds L3–L5, pyridyl, phenylpyridyl, and methylpyridinium groups were chosen as the electron-withdrawing moieties. Compound L5 was studied for the intriguing alternative of the methylated pyridyl group with a constant positive charge on the nitrogen instead of protonation by an acid. In all the other compounds, the pyridyl group acts as a Lewis base for the efficient protonation of the compound. The mono-substituted pyridine-functionalised carbazole-based bipolar host emitter (L1) was synthesised by simple two-step synthesis and studied alongside with a similar di-substituted carbazole derivative (L2).19 The N-substituted pyridine-containing carbazole derivatives L3 and L4 were studied for the different position of the electron-withdrawing moiety on the carbazole core.41,42 Compounds L5–L7 were used as reference compounds that do not have pyridyl groups as effective protonation sites. Six different organic acids (A–F) with pKa values ranging from 0.52 to 2.87 (Scheme 1) were used for the protonation of the carbazole derivatives.43 Several acetic acid derivatives were selected to investigate the effect of acidity (pKa) on fluorescence enhancement of the parent compounds via protonation. Additionally, benzenesulfonic acid (C) was selected to study the stability of aromatic vs. aliphatic counter-anions.UV-Vis and fluorescence spectroscopy
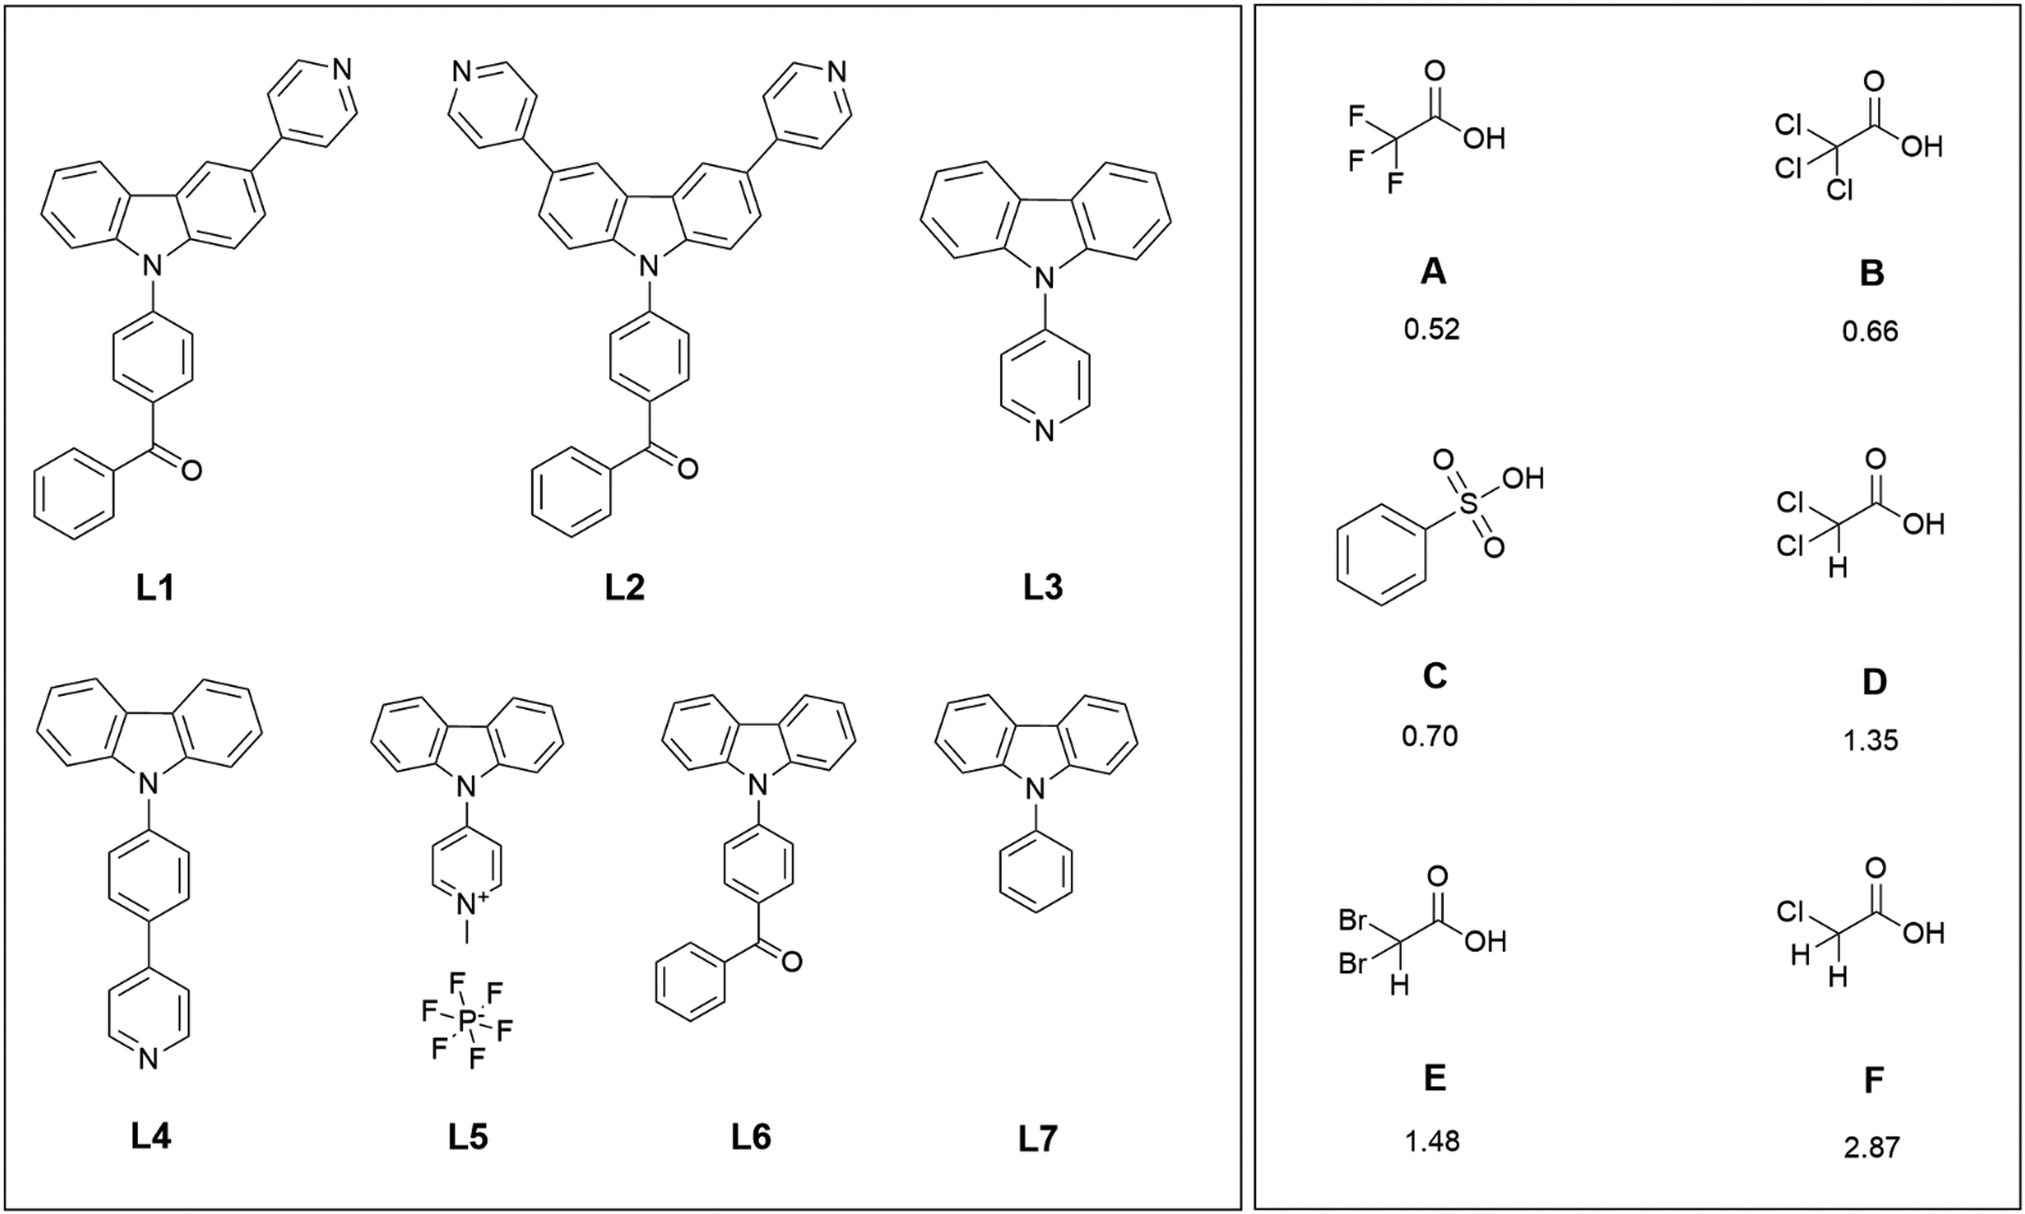
The normalised absorption and fluorescence spectra of compounds L1–L4 are shown in Fig. 1 (see Fig. S1 and S2 in the ESI† for absorption and fluorescence spectra of other compounds). Compounds L1/L2 show three distinctive absorption bands at 250/260 nm, 287/300 nm, and 345/323 nm, respectively. The additional pyridyl group of L2 slightly changes the electronic structure of the molecule and induces minor changes in the spectrum. According to the time-dependent density functional theory (TDDFT) calculations performed by Rajamalli et al., these absorption bands can be assigned to the intramolecular charge transfer bands from the carbazole moiety to the benzophenyl at 345 nm (L1) and 323 nm (L2), and to the absorption of the pyridylcarbazole donor at 287 nm (L1) and 300 nm (L2). The spectra of L3 and L4 are also structurally similar to each other showing absorption bands at 291 nm (L3) and 292 nm (L4) of the carbazole moiety and bands at 333 nm (L3) and 326–339 nm (L4) attributed to the pyridyl and phenylpyridyl groups.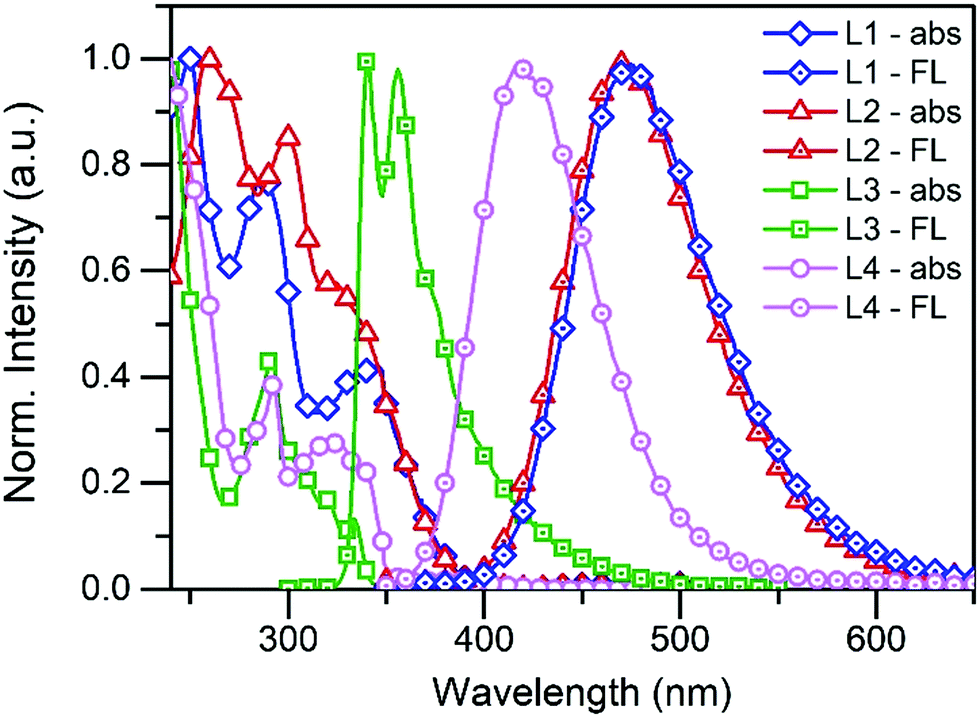 | ||
| Fig. 1 The normalised absorption and fluorescence spectra of L1–L4 in solution (10−5 M in DCM, λex = 340 nm for L1, L2, and L4, and 290 nm for L3). | ||
The fluorescence of L1, L2 and L4 were measured in 10−5 M dichloromethane (DCM) solution using 340 nm excitation and they all display broadband fluorescence reaching a maximum at 474 nm, 473 nm, and 415 nm, respectively. An excitation wavelength of 290 nm was used for L3, which shows two fluorescence maxima at 341 nm and 356 nm. The fluorescence data were also used to calculate the fluorescence quantum yields for L1–L4, and values of 16.1%, 18.1%, 10.5%, and 32.0% were obtained at room temperature.
The titration of compounds L1 and L3 with benzenesulfonic acid (C) from 0 to 2.0 (L3) or 4.0 (L1) equivalents of acid is presented in Fig. 2. Titrations with other acid–base pairs are shown in the SI (see Fig. S3–S14, ESI†). Protonation of L1 with benzenesulfonic acid results in a decrease of the intensity of all original absorption bands, while new bands arise at 319 and 382 nm, from which the latter is characteristic of the cationic species.32 From Scheme 1, it can be seen that L1 has two possible protonation or hydrogen-bond acceptor sites: the pyridyl and the carbonyl group of the benzophenyl. Due to greater basicity of the pyridyl nitrogen compared to the benzoyl oxygen, the protonation occurs predominantly on the pyridyl group. The protonation leads to an observable increase in the fluorescence intensity until the titration reaches 2.0 equivalents of the acid (see Fig. S15a, ESI†). The most significant increase in the fluorescence intensity for L1 was observed while titrating with trichloroacetic acid, reaching a fluorescence enhancement factor of 2.8 due to the protonation of the pyridine unit at 2.0 equivalents of acid (see Fig. S15a, ESI†). Similar results were obtained for L2 (see Fig. S15b, ESI†), with the fluorescence increasing up to 3.0 equivalents of acid due to two pyridyl acceptor units in addition to the benzophenyl unit. A hypsochromic shift of 30 nm of the fluorescence maximum was observed for L2, possibly due to improper hydrogen bonding shortening the length of the interaction between the proton acceptor and donor causing also a reduction in intensity.45 After the saturation point is reached, the fluorescence intensity begins to decrease in the case of L1 and L2 possibly due to change in polarity upon excess acid, which is also supported by the loss of isosbestic points in the absorption spectra beyond the saturation limit.31
 | ||
| Fig. 2 The absorption (a) and fluorescence (b) of L1, and the absorption (c) and fluorescence (d) of L3 while titrating with benzenesulfonic acid (C) from 0.0 to 2.0–4.0 equivalents of acid (10−5 M in DCM, λex = 340 nm (L1) and 290 nm (L3)). The fluorescence intensities have been corrected for inner filter effects.44 | ||
A time-dependent density functional theory (TD-DFT) study was performed to shed light on the different photochemical behaviour of L1 upon protonation, specifically on the observed fluorescence increase. The CAM-B3LYP level theory was selected as the working method as in previous computational studies for carbazole systems,46 which have resulted in similar and acceptable relative deviations between experimental and calculated transition energies (up to 0.6 eV). Analysis of the two less energetic vertical transitions (Table 1) clearly indicates a different absorption profile between the two species. The first vertical transition of L1 is unlikely to be observed, as indicated by its small oscillator strength. The most energetic absorption band experimentally observed should correspond to the second vertical excitation, being mostly composed by an interaction between the frontier molecular orbitals. The first vertical excitation expected upon protonation is largely bathochromically shifted and is associated with a large oscillator strength. In L1H+, the interaction between the frontier molecular orbitals becomes predominant in the transition to S1, whilst the second transition is unlikely to be observed. Graphic inspection of the HOMO and LUMO orbitals (Fig. 3) shows a significant difference in LUMO upon protonation, shifting its location from the benzophenyl to the pyridyl moieties. The observed more energetic absorptions in L1 and its protonated form correspond mostly to intramolecular charge transfer. This occurs in the former case between the carbazole and the benzophenyl moieties and in the latter between the same carbazole and the protonated pyridyl. The enhancement in the fluorescence is likely a result of two factors, the change of the lowest lying electronic transition and the easier planarization of the protonated pyridyl and the carbazole moieties in L1H+ (ca. 1 kcal mol−1, see Fig. S64, ESI†).
| Compound | Electronic transition | λ max | E ex | f | Wave functionsa | CI (%)b |
|---|---|---|---|---|---|---|
| a The wave functions based on the eigenvectors predicted by TD-DFT. H stands for HOMO and L stands for LUMO. b Percentage contribution of the wavefunction configuration interaction to the excitation. | ||||||
| L1 | S0 → S1 | 319 | 3.89 | 0.02 | H−9 → L | 42 |
| H−3 → L | 28 | |||||
| H−6 → L | 11 | |||||
| H → L | 4 | |||||
| H−2 → L | 3 | |||||
| H−9 → L+10 | 3 | |||||
| S0 → S2 | 294 | 4.22 | 0.70 | H → L | 69 | |
| H → L+2 | 7 | |||||
| H−9 → L | 5 | |||||
| H → L+3 | 4 | |||||
| H → L+4 | 3 | |||||
| H−3 → L | 2 | |||||
| L1H+ | S0 → S1 | 335 | 3.70 | 0.86 | H → L | 84 |
| H−4 → L | 5 | |||||
| H−1 → L | 3 | |||||
| S0 → S2 | 319 | 3.89 | 0.00 | H−7 → L+1 | 38 | |
| H−2 → L+1 | 28 | |||||
| H−5 → L+1 | 20 | |||||
| H−7 → L+11 | 3 | |||||
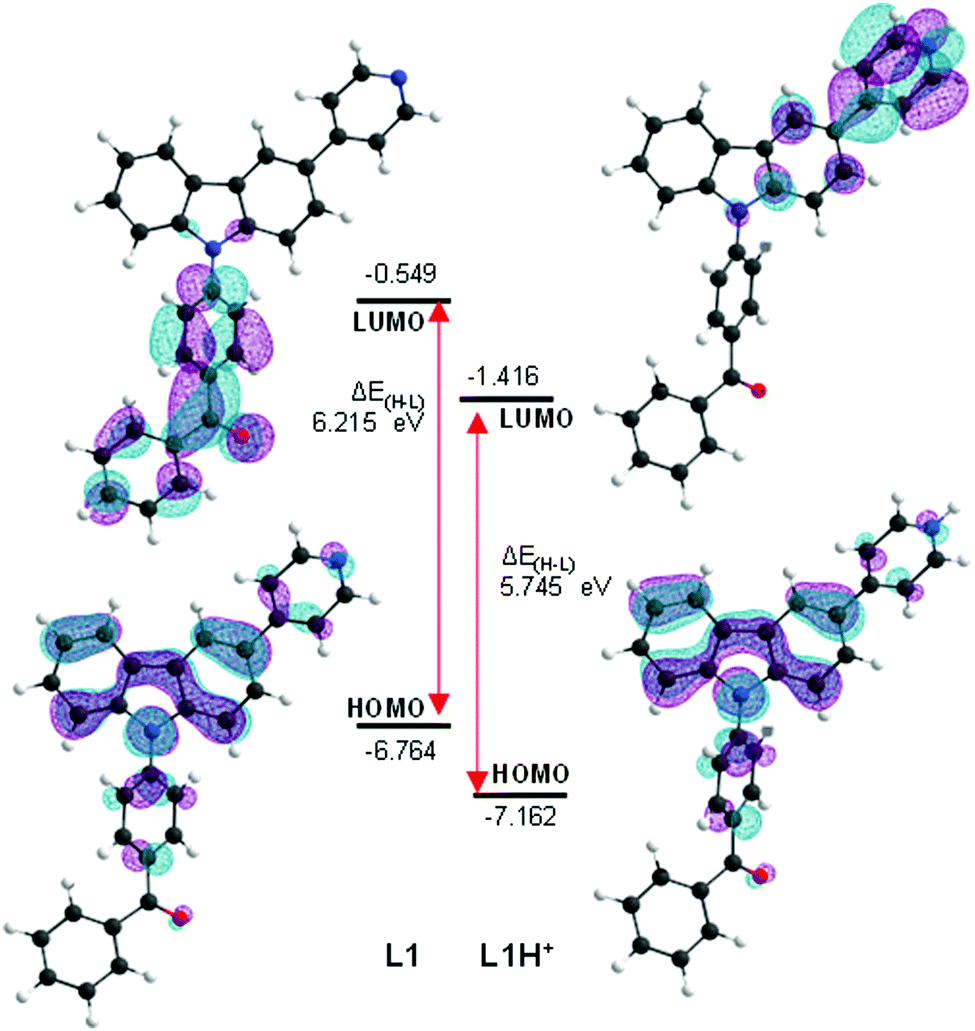 | ||
| Fig. 3 Graphic representation of frontier molecular orbitals and respective energies (eV) of L1 and its protonated congener (L1H+), as determined by TD-DFT at CAM-B3LYP/6-31G(d,p) level. | ||
Compounds L3 and L4 were found to behave conversely to L1 and L2 as they do not exhibit fluorescence enhancement upon protonation. The case of L3 is discussed here in detail. The absorption and fluorescence spectra of L3 upon protonation with benzenesulfonic acid is presented in Fig. 2c and d (For L4 see Fig. S11c, ESI†). Molecules L3 and L4 experience similar changes in their absorption upon protonation as L1 and L2, displaying a band arising at 366 nm (for L3), characteristic of the cationic species (Fig. 2c). Two fluorescence bands were observed for L3 in DCM at 341 and 357 nm. However, due to the greater stability of the aromatic counter anion, benzenesulfonic acid has the greatest effect on the fluorescence of L3, and titration points up to 4.0 were not acquired since the fluorescence of L3 is completely quenched upon addition of 2.0 equivalents of acid. Compound L4 depicts similar effects as L3, only not as prominently due to the extra phenyl spacer separating the pyridyl from the carbazole core. Compound L4 also displays a new broad low-intensity red-shifted fluorescence band arising at 575 nm likely as a result of a charge transfer state of the protonated species.
Inspection of the vertical transitions of L3 and L4, (TD-DFT/CAM-B3LYP/6-31G(d,p)), reveals that the most energetic transitions correspond to local excitation states (π–π*), with the orbitals located over the carbazole and its N-substituents. Protonation of these species results in stabilization of the frontier molecular orbitals (and a decrease on the HOMO–LUMO gap by 1–1.2 eV) accompanied with moving of the electron acceptor orbital, almost exclusively, to the carbazole N-substituent (Tables S5, S6 and Fig. S61, S62, ESI†).
The fluorescence quantum yield (Φf) of all the compounds were determined during the acid titrations. Titration with benzenesulfonic acid (C) shows a saturation point at 2.0 achieving a remarkable increase in the Φf of L1 from 16% to 80% (Table S1 and Fig. S16a, ESI†). With the exception of benzenesulfonic acid, the acids follow the expected trend of their respective pKa values, trifluoro- and trichloroacetic acid each time having very similar effects and chloroacetic acid (F) barely having any effect on the Φf. Similar results were obtained also for L2 (see Fig. S16b, ESI†). Compounds L6 and L7 were studied for the sole purpose of demonstrating that the observed effects were due to protonation and no other interactions. As expected, neither of the compounds show changes in fluorescence upon protonation (see Fig. S12–S14, ESI†), assuring that the observed effects for L1–L4 are due to protonation of the pyridyl group.
1H NMR spectroscopy
Protonation of the pyridyl group of L3 with benzenesulfonic acid was further studied with 1H NMR spectroscopy (Fig. 4) in order to elaborate the difference leading to quenching of the fluorescence compared to the fluorescence enhancement of L1 and L2. The 1H NMR of other compounds are shown in the ESI† (see Fig. S17–S30). The spectra showed characteristic behaviour of protonation, with chemical shifts moving to a lower field due to the deshielding effect upon protonation. Saturation can be seen at 1.0 equivalents of acid, as expected, Additionally, Hc experiences an unusually large change in its chemical shift of up to 0.61 ppm upon 2.0 equivalents of acid, indicating a strong interaction between L3 and benzenesulfonic acid compared to the 0.20 ppm shift in L1 at 1.0 equivalents of the same acid (see Fig. S23, ESI†). Natural population analysis of L3 and its protonated form (Fig. 5a), taken at the same DFT level of theory as above, showed a 0.05 increase in the natural charge of Ha upon protonation. This is accompanied by a more significant change in the natural charge of the Ha-bound carbon due to the proximity to the established N–H bond. The NMR shift change of Hc is also reflected by the 0.03 change in the natural charges. Inspection on the bond lengths and strengths through Wiberg indexes (WI) analysis shows that protonation results in the N–C bond between the carbazole and the pyridyl moiety to shorten (1.41 Å in L3vs. 1.38 Å in L3H+) and to strengthen (WI = 0.99 in L3vs. 1.08 in L3H+). The changes in the length of pyridyl endocyclic bonds indicate the reorganisation of the electron density in the pyridyl to accommodate the extra positive charge, with only a slight disturbance on the carbazole moiety (Fig. S71, ESI†). The significant change in the chemical shift of Hc can also be attributed to the easier rotation about the carbazole-pyridyl N–C bond in solution upon protonation (Fig. 5b). Moreover, the placement of the pyridyl unit out of the carbazole plane decreases 3.0 kcal mol−1 in the protonated species, thus making the complete rotation about the N–C bond even more accessible. The easier pyridyl rotation out of the carbazole plane in L3 (and in L4 to some extent) results in lower fluorescence quantum yield in solution (<1%).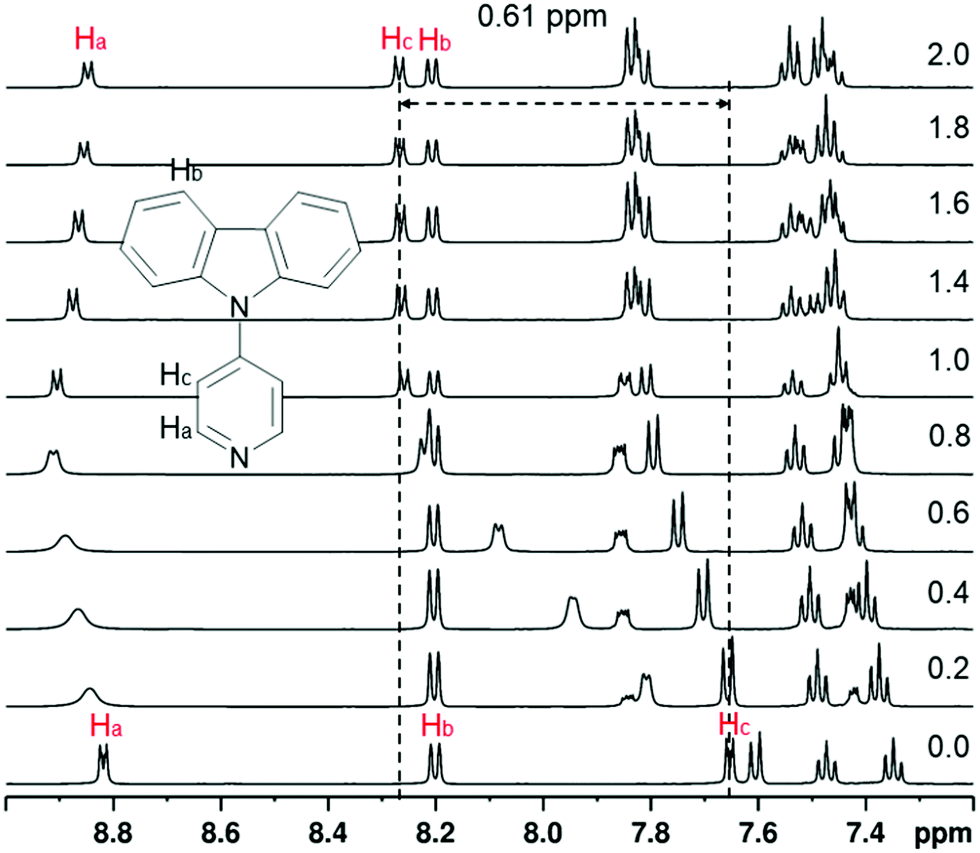 | ||
| Fig. 4 The 1H NMR spectra of L3 while titrating with benzenesulfonic acid from 0.0 to 2.0 equivalents of acid (30 mM in CD3CN, 500 MHz at 303 K). | ||
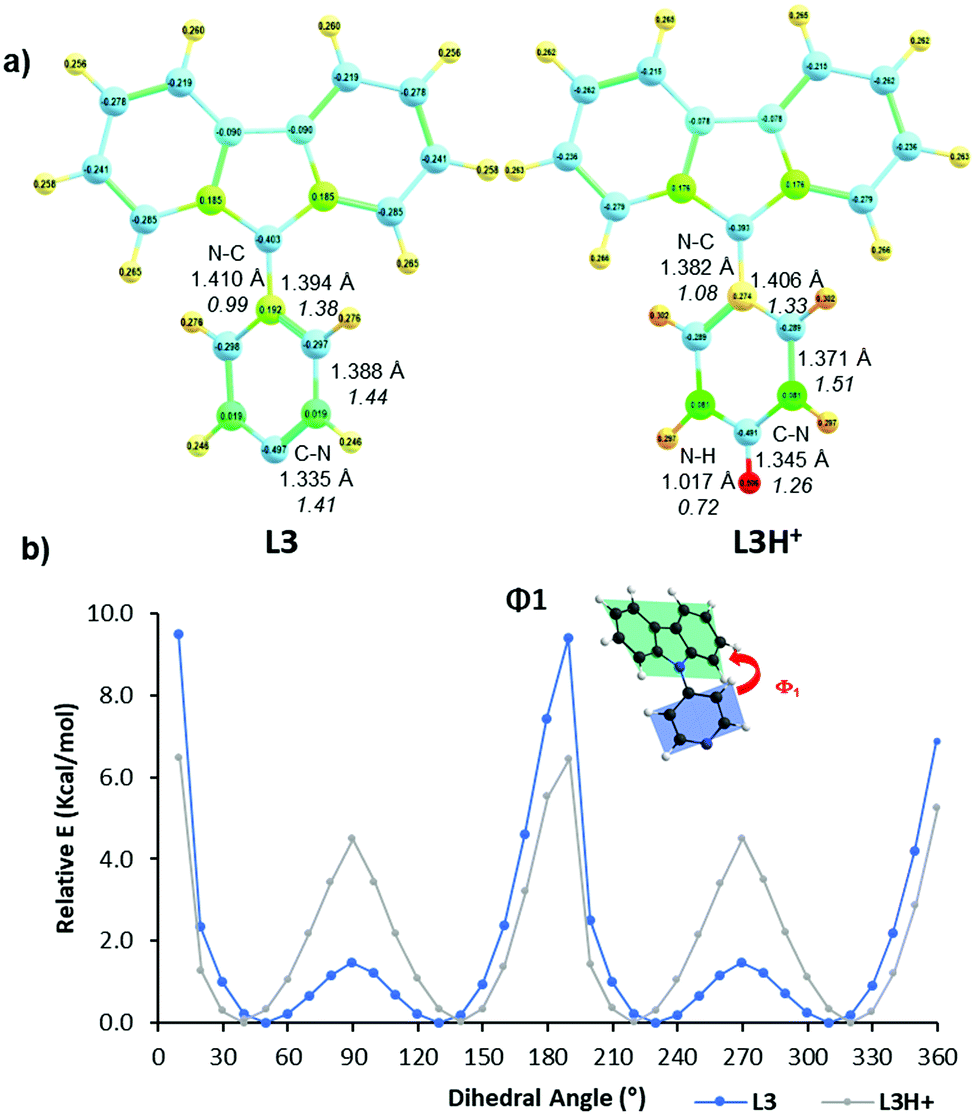 | ||
| Fig. 5 Selected electronic and conformational parameters of L3 and its protonated form (L3H+) as determined by TD-DFT at CAM-B3LYP/6-31G(d,p) level: (a) Natural charges determined from natural population analysis. The lengths (in Å) and Wiberg index (in italics) of selected bonds are indicated; (b) plane figure optimised structures, dihedral angle and energy profiles for rotation of pyridyl. | ||
Solid-state fluorescence
From the perspective of applications, the compounds were also studied in the solid state. For the purpose of discussing solid-state samples, the salts were named consistent with the ligand numbering (L1–L7) with an added H to describe proton transfer and with letters (a–f) representing the anion resulting from the deprotonation of the acid (A–F) and in square brackets to indicate a salt. The solid-state fluorescence spectra of L1, L3, L4 (and their corresponding benzenesulfonate salts) and L5 are shown in Fig. 6 and listed in Table 2. Compound L2 was not studied in solid state due to the insolubility of the protonated salt at higher concentrations. Similarly, L5 was not studied in solution due to its solubility only in high polarity solvents making the comparison to other compounds measured in DCM ineffectual.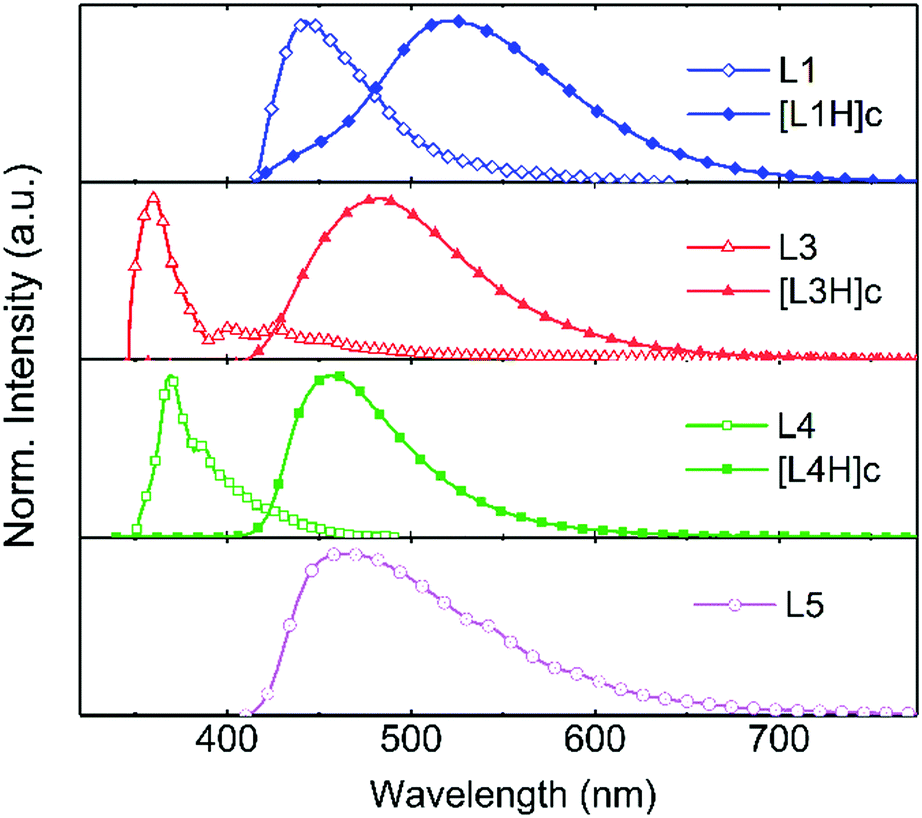 | ||
| Fig. 6 Fluorescence of the solid-state samples of L1, L3, L4, and L5, and the acid complexes of L1, L3, and L4, at an excitation wavelength of 330 nm, 333 nm, 331 nm, 303 nm, 326 nm, 310 nm, and 320 nm, respectively. | ||
| Compound | In dichloromethanea | Solid state | ||||
|---|---|---|---|---|---|---|
| λ ex (nm) | F max (nm) | Φ f (sol) | λ ex (nm) | F max (nm) | Φ f (SS, %) | |
| a Measured at the concentration of 1.0 × 10⁻⁵ M at 25 °C. b Reported at 1.0 or 2.0 equivalent of benzenesulfonic acid according to the number of protonation sites. c Reported at 4.0 equivalent of benzenesulfonic acid for the protonated ligands, except for [L3H]c at 2.0. d Not soluble in dichloromethane, hence no solution studies were performed. | ||||||
| L1 | 340 | 474 | 16.14 | 330 | 442 | 1.51 |
| [L1H]c | 340 | 472 | 79.45 | 326 | 521 | 15.81 |
| L2 | 340 | 473 | 18.06 | — | — | — |
| [L2H]c | 340 | 451 | 79.18 | — | — | — |
| L3 | 290 | 341, 356 | 10.52 | 333 | 360 | 2.46 |
| [L3H]c | 290 | 341, 356 | 0.97 | 310 | 483 | 25.09 |
| L4 | 340 | 415 | 32.03 | 331 | 369 | 1.21 |
| [L4H]c | 340 | 420 | 0.14 | 320 | 457 | 49.02 |
| L5 | — | — | — | 303 | 469 | 21.65 |
The fluorescence maxima (Fmax) of the ligands and their respective benzenesulfonate salts in solution remain almost identical for all compounds during the titration. When changing to solid state, the Fmax of the pure ligand experiences a hypsochromic shift, or stays invariable, whereas the protonated ligand in the solid state displays a bathochromic shift compared to the Fmax in solution. In contrast to solution, the fluorescence quantum yield of L3 and L4 increases in solid state and L4 experiences a remarkable increase from 1% to 49% in the protonated form.35,36 The bathochromic shift of the fluorescence maxima observed for all the protonated ligands (Fig. 6) in the solid state suggests J-type packing for these compounds. This type of packing is described as having a large Stokes shift, which readily limits self-absorption and leads to strong fluorescence in the solid state.47 The hypsochromic shift, or no change, of the pure ligands indicates that this type of packing is not dominant for these compounds, and results in weak fluorescence in the solid state due to quenching as a result of aggregation.
Crystallography
Crystallisations of all studied compounds were carried out to further analyse the changes in the solid-state fluorescence. The crystallisation of the acid–base pairs was performed with a 1![[thin space (1/6-em)]](https://www.rsc.org/images/entities/char_2009.gif) :1 acid–base ratio in various solvent systems (see ESI,† Fig. S34–S58). Unfortunately, not all crystallisations yielded X-ray diffraction quality crystals, and obtaining the weaker acid–base pairs proved to be difficult. The suitable single crystals obtained were subjected to a single-crystal X-ray diffraction analysis. The molecular packing of L3, L4, [L1H]c, and [L4H]c is shown in Fig. 7 along with the most common packing patterns described as J-type.48 Despite the weaker acids (D–F) having little to no effect on the fluorescence of the compound in solution, in the solid-state the protonation seems to occur regardless of the strength of the acid.
:1 acid–base ratio in various solvent systems (see ESI,† Fig. S34–S58). Unfortunately, not all crystallisations yielded X-ray diffraction quality crystals, and obtaining the weaker acid–base pairs proved to be difficult. The suitable single crystals obtained were subjected to a single-crystal X-ray diffraction analysis. The molecular packing of L3, L4, [L1H]c, and [L4H]c is shown in Fig. 7 along with the most common packing patterns described as J-type.48 Despite the weaker acids (D–F) having little to no effect on the fluorescence of the compound in solution, in the solid-state the protonation seems to occur regardless of the strength of the acid.
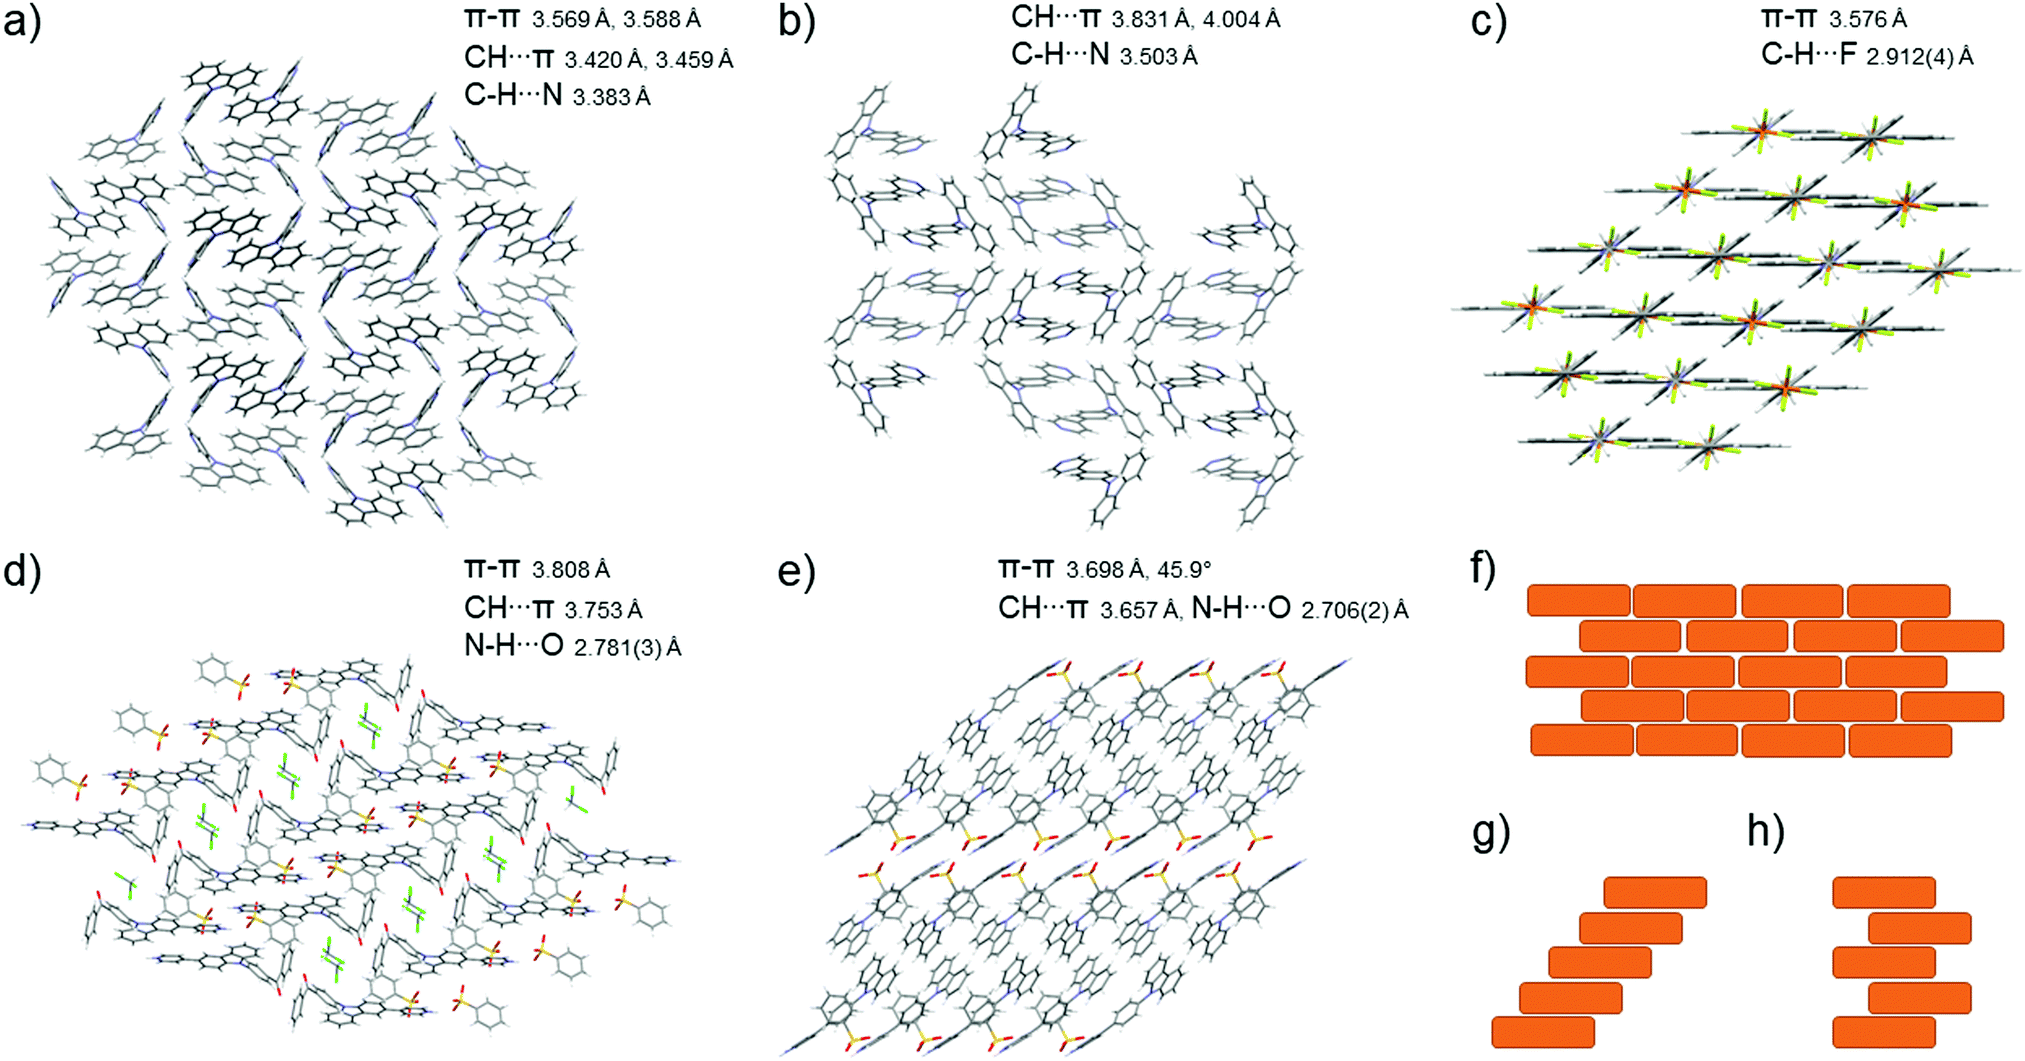 | ||
| Fig. 7 Molecular packing patterns and most dominant interactions of (a) L3 (b) L4 (c) L5 (d) [L1H]c, and (e) [L4H]c determined by single-crystal X-ray diffraction and the schematic presentations of different J-type packing patterns, where (f) brick (g) staircase, and (h) ladder pattern. | ||
All obtained solid-state structures had the expected 1:1 stoichiometry. The charge-assisted hydrogen bond distances between the oxygen of the conjugate base and the protonated nitrogen (O⋯N) were found to be between 2.588(2)–2.784(3) Å (see ESI,† Table S3). The bond lengths were affected by the crystal packing due to the size of the anion. Due to the non-determinable positions of H atoms from X-ray diffraction analysis, all N–H bonds were refined to 1.04 Å based on the average of neutron diffraction studies of similar compounds.49 The structures of [L1H]a and [L4H]b (see Fig. S39 and S51, ESI†) have two independent acid–base pairs in the asymmetric unit cell, whereas other structures were observed with one acid–base pair in the asymmetric unit cell. Additionally, in the structures of [L1H]a–b, [L3H]a, and [L4H]a–b (see ESI,† Fig. S39–S42, S47 and S49–S52, respectively) the counter anion was found to be disordered over two or three positions. Counter anions that are disordered might show that their location is to simply satisfy charge balance, having no preference as to where they were in the packing, i.e., no strong bonding or interaction results from their presence. This again might create differences between the solid-state and solution studies. In addition to these, [L1H]c (see ESI,† Fig. S43) crystallised with a solvent molecule interacting with the carbonyl group of the benzophenyl acceptor [C74–H74⋯O27, 3.437(4) Å].
From the solid-state fluorescence samples, X-ray diffraction quality single crystals could be obtained for compounds [L1H]c, L3, L4, [L4H]c, and L5 (in addition to other acid–base pairs not studied for their solid-state fluorescence). Compound L3 crystallises in the chiral orthorhombic space group P212121 in a dimer-type zigzag packing stabilised by off-centre π–π interactions between the carbazole cores of two molecules with an interplanar distance of 3.6 Å (Fig. 7a). Compound L3 also forms intermolecular interactions through C–H⋯π edge-to-face interactions to the carbazole core (Fig. 7a) and C–H⋯N interactions of the pyridyl nitrogen to the neighbouring hydrogens all together forming a three-dimensional network of intermolecular interactions. Similar to L3, L4 also crystallises in the orthorhombic space group, yet now in centrosymmetric Pbca stabilised by similar off-centre π–π (3.8 Å), C–H⋯π edge-to-face, and C–H⋯N interactions (Fig. 7b). Supported by the hypsochromic shift in the solid-state fluorescence results, compounds L3 and L4 were determined to have H-type packing, which ultimately leads to quenching of the fluorescence. Compound L5 crystallises in the centrosymmetric monoclinic C2/c space group in a J-type packing in a brick pattern (Fig. 7c and f) stabilised by strong π–π (3.6 Å) and C–H⋯F interactions from the surrounding anions. This type of packing induced by the ionic interactions gives rise to fairly strong fluorescence due to restricted intramolecular rotation of the pyridine moiety. However, the methylene group was found to be disordered over two positions possibly leading to some fluorescence quenching. Complex [L1H]c crystallises in the centrosymmetric triclinic P. Space group in a dimer-type head-to-tail packing of the pyridyl-carbazole motif in a staircase pattern (Fig. 7d and g) stabilised by off-centre π–π interactions of two aromatic rings with an interplanar distance of 3.8 Å. The complex [L1H]c is also stabilised by acid–base pair hydrogen bonding (N1–H1⋯O51, 2.781(3) Å), and C–H⋯π edge-to-face interactions (H29) to the aromatic ring of the benzenesulfonate. The complex [L4H]c crystallises in the centrosymmetric monoclinic P21/c space group with weak off-centre π–π interactions and intermolecular interactions between the ligand and the anion (N23–H23⋯O71, 2.706(2) Å) also in a staircase pattern (Fig. 7e and g) inducing strong fluorescence commonly observed in J-type packing, which was also suggested by the bathochromic shift in the solid-state fluorescence maxima for these compounds. In the crystal structure of [L1H]c the packing of the carbazole moiety is coplanar, in contrast to [L4H]c where the carbazoles pack at a 45.9° angle making the off-centre π–π interactions observed for [L4H]c at an interplanar distance of 3.7 Å less effective. For [L4H]c, the π–π interactions are observed between the carbazole core and the phenyl ring attached to the carbazole moiety. The off-centre packing of [L4H]c forces the carbazole backbone to a bent conformation with an angle of 165.7° between the centroid of the central carbazole ring (C3 C4 C9 N10 C11), the carbazole nitrogen (N10), and the carbon of the adjacent phenyl ring (C14), whereas for most of the determined structures the carbazole lies close to parallel to the neighbouring phenyl or pyridyl ring with an angle close to 180°. Molecules of [L4H]c with twisted conformation have to be less densely packed in the highly restricted crystal lattice resulting in weaker intermolecular interactions.50
The protonation of all the compounds shows also an increase in the Φf of solid-state samples due to restricted internal rotation of the molecule, as sterically hindered molecules show stronger fluorescence in solid-state.51 Unfortunately, attempts to crystallise [L3H]c did not yield X-ray diffraction quality crystals, and therefore, could not be compared to [L1H]c and [L4H]c. However, for L3 and L4, the more structural packing induced by the planar conformation of the ligand, strong π–π/C–H⋯π interactions, and hydrogen bonding effectively quench the fluorescence in the solid-state.50 For compounds L5, [L1H]c, and [L4H]c, there is a compromise between the quenching due to intermolecular interactions and both the J-type packing and steric hindrance inducing stronger fluorescence. Additionally, the network of intermolecular interactions in the crystal structure of [L1H]c may dissipate the excited-state energy to some degree through internal conversion,50 a process that does not occur in the less dense packing of [L4H]c, resulting in a much higher Φf in the solid state compared to [L1H]c.
Conclusions
The effect of protonation on the fluorescence of small pyridine-functionalised carbazole donors has been studied in both solution and solid state. In these compounds, a carbazole core acts as a donor, whereas benzophenyl, pyridyl, and phenylpyridyl moieties were chosen for acceptors in the design of bipolar host materials. All compounds showed absorption bands in the UV region and a wide variety of emission wavelengths from 300 to 600 nm. All compounds could be protonated using six different organic acids displaying a diversity of interaction strengths related to the pKa of the acid used in the protonation. The observed bathochromic shift and the increase in the fluorescence intensity of L1 and L2 was explained primarily by the different localisation of the LUMO orbital on the protonated species and secondly by the easier planarization of the protonated pyridyl and the carbazole moieties. The fluorescence quantum yield of L1 increased from 16% to 80% upon protonation in solution. The bathochromic shift upon protonation, in addition to DFT, suggests that the protonation of these compounds effectively lowers the energy of the emissive state lowering the energy gap between the emissive state and the first triplet state, which could facilitate reverse intersystem crossing and result in more efficient TADF. In compound L3, the placement of the pyridyl unit out of the carbazole plane decreased in energy upon protonation making the rotation about the N–C bond even more accessible, thus quenching the fluorescence. In the solid state, the rotation around the N–C bond was restricted in all the compounds upon protonation. All protonated compounds also favoured the beneficial J-type packing resulting in a large bathochromic shift in the fluorescence intensity, with the quantum yield changing from 1% to 49% upon protonation in the best case, whereas all the pure ligands acted much like many other organic compounds in solid state and the fluorescence was quenched due to aggregation effects. Hereby, we have proposed an effective way for fluorescence modulation through protonation-induced restriction of the intramolecular rotation, which could enable the development of future bipolar host materials.Experimental
All reagents and solvents were obtained from commercial suppliers and used without further purification. Absorption spectra were collected using Varian Cary 100, 300 Series II Series UV-Visible Spectrophotometer, and fluorescence spectra were collected using Varian Cary Eclipse Fluorescence Spectrophotometer. The measurements were taken in a 1 cm quartz cuvette and the excitation and the emission bandpasses were set to 2.5 nm and 2.5 nm, respectively. All the measurements were performed at room temperature. The integrated relative intensities were determined in respect to the natural fluorescence of the compound using that as a zero point and 9,10-diphenylanthracene was used as a reference in determination of the fluorescence quantum yield of the compounds.For NMR assignments, 1H and 13C NMR spectra were recorded using either Bruker 300 Avance or Bruker Avance III 500 MHz spectrometer at 303 K. Chemical shifts are reported on the δ scale in ppm using the residual solvent signal as internal standard (CDCl3; δH 7.26, CD2Cl2; δH 5.32, CD3CN; δH 1.94, DMSO-d6; δH 2.50). For 1H NMR spectroscopy, each resonance was assigned according to the following conventions: chemical shift (δ) measured in ppm, observed multiplicity, number of hydrogens, observed coupling constant (J Hz), and assignment. Multiplicities are denoted as s (singlet), d (doublet), t (triplet), q (quartet) m (multiplet), and br (broad).
The absorption, fluorescence, excitation spectra, and absolute fluorescence quantum yield values for the solid-state samples were obtained by using an FLS-1000 spectrofluorometer equipped with a calibrated integrating sphere (Edinburgh Instruments, UK). Absorption spectra did not show sharp peaks hence the initial fluorescence spectra measurements were performed by using 340 nm excitation wavelength as it was done during solution studies. Then by using fluorescence wavelength maxima the excitation spectra were measured and excitation wavelength maxima were detected. These wavelengths were chosen then to measure both fluorescence spectra and absolute fluorescence quantum yields.
The experimental and refinement details for all complexes studied with single-crystal X-ray diffraction are given in the ESI.† All structures were measured using a Bruker-Nonius KappaCCD diffractometer with an APEX-II detector with graphite-monochromatized Mo-Kα (λ = 0.71073 Å) radiation or Agilent Super-Nova dual wavelength diffractometer with an Atlas detector using mirror-monochromated Cu-Kα (λ = 1.54184 Å) radiation. The program CrysAlisPro5 was used for the data collection and reduction on the Super-Nova diffractometer. Data collection and reduction the Bruker-Nonius KappaCCD diffractometer were performed using the program COLLECT52 and HKL DENZO AND SCALEPACK,53 respectively, and the intensities were corrected for absorption using SADABS.54 The structures were solved with intrinsic phasing (SHELXT)55 and refined by full-matrix least-squares on F2 using the OLEX2 software,56 which utilises the SHELXL-2015 module.57 Non-hydrogen atoms were assigned anisotropic displacement parameters unless stated otherwise. Hydrogen atoms bonded to oxygen were located from Fourier difference maps and refined with an O–H distance restraint of approximately 0.84 Å. Other hydrogen atoms were placed in idealised positions and included as riding, with a value of 1.04 Å used for N–H bonds, which was based on an average of neutron diffraction values reported for this moiety with similarly hybridised neighbouring atoms.49 Isotropic displacement parameters for all H atoms were constrained to multiples of the equivalent displacement parameters of their parent atoms with Uiso(H) = 1.2Ueq(parent atom).
All theoretical calculations were carried out using the Gaussian 1658 software package without symmetry constrains. Solvent effects (dichloromethane) were considered in every calculation using the Polarizable Continuum Model (PCM) initially devised by Tomasi and coworkers59–61 as implemented on Gaussian 16, with radii and non-electrostatic terms for Truhlar and coworkers’ SMD solvation model.62 Density Functional Theory (DFT) and Time-Dependent DFT (TD-DFT) were used for the ground and vertical excitations of L1, L3, L4 and their corresponding cationic forms, respectively. All calculations have been performed using the CAM-B3LYP63 functional and 6-31G(d,p)64–68 basis set. The ground state geometry of L1, L3, L4 and their corresponding cationic forms has been fully optimised with default cut-offs on forces and step size to determine convergence. The analytical calculation of the vibrational frequencies at the same level of theory verified the optimised structure by checking that they corresponded to true minima of the potential energy surface by the absence of imaginary frequencies. The first six low-lying excited states have been determined within the vertical TD-DFT, with the default linear response non-equilibrium solvation procedure. A Natural Population Analysis (NPA)69–76 and the resulting Wiberg indices77,78 were calculated as implemented on Gaussian 16 to study the electronic structure and bonding of the optimised species.
Conflicts of interest
There are no conflicts to declare.Acknowledgements
AP is thankful to the Academy of Finland (SUPREL project, decision numbers 311142 & 326416) for financial support. JSW gratefully acknowledges the Finnish Cultural Foundation Central Fund (Grant number 00201148) for funding. NRC is thankful to Fundação para a Ciência e Tecnologia for the financial support (CEE-CINST/2018), and to CSC–IT Center for Science Ltd, Finland for the allocation of computational resources. NAD acknowledges the financial support from Academy of Finland (Grant number 316893).Notes and references
- J.-M. Lehn, Angew. Chem., Int. Ed. Engl., 1988, 27, 89–112 CrossRef.
- J. K. Salunke, N. A. Durandin, T.-P. Ruoko, N. R. Candeias, P. Vivo, E. Vuorimaa-Laukkanen, T. Laaksonen and A. Priimagi, Sci. Rep., 2018, 8, 14431 CrossRef PubMed.
- X. Zhu, J.-X. Wang, L.-Y. Niu and Q.-Z. Yang, Chem. Mater., 2019, 31, 3573–3581 CrossRef CAS.
- M. Zuo, W. Qian, T. Li, X.-Y. Hu, J. Jiang and L. Wang, ACS Appl. Mater. Interfaces, 2018, 10, 39214–39221 CrossRef CAS PubMed.
- T. Senthilkumar, L. Zhou, Q. Gu, L. Liu, F. Lv and S. Wang, Angew. Chem., Int. Ed., 2018, 57, 13114–13119 CrossRef CAS PubMed.
- R. Chang and X. Yan, Small Struct., 2020, 1, 2000068 CrossRef.
- P. Xing and Y. Zhao, Adv. Mater., 2016, 28, 7304–7339 CrossRef CAS PubMed.
- T. L. Mako, J. M. Racicot and M. Levine, Chem. Rev., 2019, 119, 322–477 CrossRef CAS PubMed.
- X. Chang, Z. Zhou, C. Shang, G. Wang, Z. Wang, Y. Qi, Z.-Y. Li, H. Wang, L. Cao, X. Li, Y. Fang and P. J. Stang, J. Am. Chem. Soc., 2019, 141, 1757–1765 CrossRef CAS PubMed.
- J.-X. Wang, L.-Y. Niu, P.-Z. Chen, Y.-Z. Chen, Q.-Z. Yang and R. Boulatov, Chem. Commun., 2019, 55, 7017–7020 RSC.
- Y. Cai, A. Qin and B. Z. Tang, J. Mater. Chem. C, 2017, 5, 7375–7389 RSC.
- C.-H. Lee, M.-H. Tang, W.-L. Cheung, S.-L. Lai, M.-Y. Chan and V. Yam, Chem. Sci., 2018, 9, 6228–6232 RSC.
- Z. Xu, B. Z. Tang, Y. Wang and D. Ma, J. Mater. Chem. C, 2020, 8, 2614–2642 RSC.
- W. Li, J. Li, D. Liu, F. Wang and S. Zhang, J. Mater. Chem. C, 2015, 3, 12529–12538 RSC.
- W. Li, J. Li, D. Liu and Q. Jin, ACS Appl. Mater. Interfaces, 2016, 8, 22382–22391 CrossRef CAS PubMed.
- B. Wex and B. R. Kaafarani, J. Mater. Chem. C, 2017, 5, 8622–8653 RSC.
- W. Liu, C.-J. Zheng, K. Wang, M. Zhang, D.-Y. Chen, S.-L. Tao, F. Li, Y.-P. Dong, C.-S. Lee, X.-M. Ou and X.-H. Xhang, ACS Appl. Mater. Interfaces, 2016, 8, 32984–32991 CrossRef CAS PubMed.
- D. Zhang, M. Cai, Y. Zhang, D. Zhang and L. Duan, ACS Appl. Mater. Interfaces, 2015, 7, 28693–28700 CrossRef CAS PubMed.
- P. Rajamalli, D. R. Martir and E. Zysman-Colman, J. Photonics Energy, 2018, 8(3), 032106 Search PubMed.
- Y. Shirota, M. Kinoshita, T. Noda, K. Okumoto and T. Ohara, J. Am. Chem. Soc., 2000, 122, 11021–11022 CrossRef CAS.
- A. Chaskar, H.-F. Chen and K.-T. Wong, Adv. Mater., 2011, 23, 3876–3895 CrossRef CAS PubMed.
- K. S. Yook and J. Y. Lee, Chem. Rec., 2016, 16, 159–172 CrossRef CAS PubMed.
- S. M. Kim, J. H. Yun, S. H. Han and J. Y. Lee, J. Mater. Chem. C, 2017, 5, 9072–9079 RSC.
- M. Sarma and K. T. Wong, Chem. Rec., 2019, 19, 1667–1692 CrossRef CAS PubMed.
- A. Endo, K. Sato, K. Yoshimura, T. Kai, A. Kawada, H. Miyazaki and C. Adachi, Appl. Phys. Lett., 2011, 98, 083302 CrossRef.
- Z. Shi, D. Zhang, J. Huo, H. Wang, J. Yu, H. Shi and B. Z. Tang, Mater, 2019, 34(17), 3000–3010 CAS.
- N. L. C. Leung, N. Xie, W. Yuan, Y. Liu, Q. Wu, Q. Peng, Q. Miao, J. W. Y. Lam and B. Z. Tang, Chem. – Eur. J., 2014, 20, 15349–15353 CrossRef CAS PubMed.
- W. Sun, Z. Wang, T. Wang, L. Yang, J. Jiang, X. Zhang, Y. Luo and G. Zhang, J. Phys. Chem. A, 2017, 121, 4225–4232 CrossRef CAS PubMed.
- L. Xie, G. Han, Y. Chen, H. Wang, X. Kong, X. Wei, J. Liu, Y. Yi, B. Chen, P. Wang and Y. Wang, J. Mater. Chem. C, 2016, 4, 10776–10780 RSC.
- M. Li, Y. Yuan and Y. Chen, ACS Appl. Mater. Interfaces, 2018, 10, 1237–1243 CrossRef CAS PubMed.
- S. Achelle, J. Rodríguez-López., C. Katan and F. Robin-le Guen, J. Phys. Chem. C, 2016, 120, 26986–26995 CrossRef CAS.
- E. Tervola, K.-N. Truong, J. S. Ward, A. Priimagi and K. Rissanen, RSC Adv., 2020, 10, 29385–29393 RSC.
- N. Mataga and S. Tsuno, Bull. Chem. Soc. Jpn., 1957, 30, 368–374 CrossRef CAS.
- N. Mataga, Bull. Chem. Soc. Jpn., 1958, 31, 459–462 CrossRef CAS.
- A. Aguilar-Granda, S. Pérez-Estrada, A. E. Roa, J. Rodríguez-Hernández, S. Hernández-Ortega, M. Rodriguez and B. Rodríguez-Molina, Cryst. Growth Des., 2016, 6, 3435–3442 CrossRef.
- J. Jiao, J.-X. Kang, Y. Ma, Q. Zhao, H. Li, J. Zhang and X. Chen, Front. Chem., 2019, 7, 768 CrossRef CAS PubMed.
- Q. Wei, N. Fei, A. Islam, T. Lei, L. Hong, R. Peng, X. Fan, L. Chen, P. Gao and Z. Ge, Adv. Opt. Mater., 2018, 6, 1800512 CrossRef.
- B. Huang, X. Ban, K. Sun, Z. Ma, Y. Mei, W. Jiang, B. Lin and Y. Sun, Dyes Pigm., 2016, 133, 380–386 CrossRef CAS.
- C.-H. Chen, L.-C. Hsu, P. Rajamalli, Y.-W. Chang, F.-L. Wu, C.-Y. Liao, M.-J. Chiu, P.-Y. Chou, M.-J. Huang, L.-K. Chu and C.-H. Cheng, J. Mater. Chem. C, 2014, 2, 6183–6191 RSC.
- X.-H. Zhao, Z.-S. Zhang, Y. Qian, M.-D. Yi, L.-H. Xie, C.-P. Hu, G.-H. Xie, H. Xu, C.-M. Han, Y. Zhao and W. Huang, J. Mater. Chem. C, 2013, 1, 3482–3490 RSC.
- S. J. Nemat, H. Jedrzejewska, A. Prescimone, A. Szumna and K. Tiefenbacher, Org. Lett., 2020, 22, 5506–5510 CrossRef CAS PubMed.
- K. Leduskrasts, A. Kinens and E. Suna, Chem. Commun., 2019, 55, 12663–12666 RSC.
- Acid Dissociation Constants, CRC Handbook of Chemistry and Physics, retrieved on 20.12.2018.
- T. Larsson, M. Wedborg and D. Turner, Anal. Chim. Acta, 2007, 583, 357–363 CrossRef CAS PubMed.
- B. J. van der Veken, W. A. Herrebout, R. Szostak, D. N. Shchepkin, Z. Havlas and P. Hobza, J. Am. Chem. Soc., 2001, 123, 12290–12293 CrossRef CAS PubMed.
- Z. Zara, J. Iqbal, K. Ayub, M. Irfan, A. Mahmood, R. A. Khera and B. Eliasson, J. Mol. Struct., 2017, 1149, 282–298 CrossRef CAS.
- C. Maeda, T. Todaka, T. Ueda and T. Ema, Chem. – Eur. J., 2016, 22, 7508–7513 CrossRef CAS PubMed.
- F. Würthner, T. E. Kaiser and C. R. Saha-Möller, Angew. Chem., Int. Ed., 2011, 50, 3376–3410 CrossRef PubMed.
- F. H. Allen and I. J. Bruno, Acta Crystallogr., Sect. B: Struct. Sci., 2010, 66, 380–386 CrossRef CAS PubMed.
- D.-E. Wu and M. Lu, New J. Chem., 2015, 39, 6465–6473 RSC.
- K. Shirai, M. Matsuoka and K. Fukunishi, Dyes Pigm., 1999, 42, 95–101 CrossRef CAS.
- R. W. W. Hooft, COLLECT, Nonius BV, Delft, the Netherlands, 1998 Search PubMed.
- Z. Otwinowski and W. Minor, in Methods in Enzymology, Macromolecular Crystallography, Part A, ed. C. W. Carter Jr and R. M. Sweet, Academic Press, New York, 1997, vol. 276, pp. 307–326 Search PubMed.
- G. M. Sheldrick, SADABS, Version 2008/2, University of Göttingen, Germany, 1996 Search PubMed.
- G. M. Sheldrick, Acta Crystallogr., Sect. A: Found. Adv., 2015, 71, 3–8 CrossRef PubMed.
- O. V. Dolomanov, L. J. Bourhis, R. J. Gildea, J. A. K. Howard and H. Puschmann, J. Appl. Crystallogr., 2009, 42, 339–341 CrossRef CAS.
- G. M. Sheldrick, Acta Crystallogr., Sect. C: Struct. Chem., 2015, 71, 3–8 Search PubMed.
- M. J. Frisch, G. W. Trucks, H. B. Schlegel, G. E. Scuseria, M. A. Robb, J. R. Cheeseman, G. Scalmani, V. Barone, G. A. Petersson and H. Nakatsujiet al., Gaussian 16, Revision C.01, Gaussian, Inc., Wallingford CT, 2019 Search PubMed.
- E. Cancès, B. Mennucci and J. Tomasi, J. Chem. Phys., 1997, 107(8), 3032 CrossRef.
- B. Mennucci and J. Tomasi, J. Chem. Phys., 1997, 106(12), 5151 CrossRef CAS.
- M. Cossi, V. Barone, B. Mennucci and J. Tomasi, Chem. Phys. Lett., 1998, 286(3–4), 253 CrossRef CAS.
- A. V. Marenich, C. J. Cramer and D. G. Truhlar, J. Phys. Chem. B, 2009, 113(18), 6378 CrossRef CAS PubMed.
- T. Yanai, D. P. Tew and N. C. Handy, Chem. Phys. Lett., 2004, 393(1–3), 51 CrossRef CAS.
- R. Ditchfield, W. J. Hehre and J. A. Pople, J. Chem. Phys., 1971, 54(2), 724 CrossRef CAS.
- W. J. Hehre, R. Ditchfield and J. A. Pople, J. Chem. Phys., 1972, 56(5), 2257 CrossRef CAS.
- P. C. Hariharan and J. A. Pople, Mol. Phys., 1974, 27(1), 209 CrossRef CAS.
- M. S. Gordon, Chem. Phys. Lett., 1980, 76(1), 163 CrossRef CAS.
- P. C. Hariharan and J. A. Pople, Theor. Chim. Acta, 1973, 28(3), 213 CrossRef CAS.
- J. E. Carpenter, PhD thesis, University of Wisconsin, 1987.
- J. E. Carpenter and F. Weinhold, J. Mol. Struct., 1988, 46, 41 CrossRef CAS.
- J. P. Foster and F. Weinhold, J. Am. Chem. Soc., 1980, 102(24), 7211 CrossRef CAS.
- A. E. Reed and F. Weinhold, J. Chem. Phys., 1983, 78(6), 4066 CrossRef CAS.
- A. E. Reed and F. Weinhold, J. Chem. Phys., 1985, 83(4), 1736 CrossRef CAS.
- A. E. Reed, R. B. Weinstock and F. Weinhold, J. Chem. Phys., 1985, 83(2), 735 CrossRef CAS.
- A. E. Reed, L. A. Curtiss and F. Weinhold, Chem. Rev., 1988, 88(6), 899 CrossRef CAS.
- F. Weinhold and J. E. Carpenter, The Structure of Small Molecules and Ions, Plenum, 1988 Search PubMed.
- K. B. Wiberg, Tetrahedron, 1968, 24(3), 1083 CrossRef CAS.
- K. B. Wiberg and J. R. Snoonian, J. Org. Chem., 1998, 63(5), 1390 CrossRef CAS.
Footnote |
| † Electronic supplementary information (ESI) available. CCDC 2080281–2080294. For ESI and crystallographic data in CIF or other electronic format see DOI: 10.1039/d1ma00438g |
| This journal is © The Royal Society of Chemistry 2022 |