
 Open Access Article
 This Open Access Article is licensed under a
 Creative Commons Attribution 3.0 Unported Licence
Synthesis of few-layer MoS2@N-doped carbon core–shell hollow spheres using a cationic surfactant as a template for highly stable lithium-ion storage†
Faze
Wang
 a,
Fanggang
Li
b,
Jun
Wang
*a and
Maojun
Zheng
*b
a,
Fanggang
Li
b,
Jun
Wang
*a and
Maojun
Zheng
*b
aJiangsu Provincial Key Laboratory of Solar Energy Science and Technology, School of Energy & Environment, Southeast University, Nanjing, 210096, China. E-mail: 101010980@seu.edu.cn
bKey Laboratory of Artificial Structure and Quantum Control, Ministry of Education, Department of Physics and Astronomy, Shanghai Jiao Tong University, Shanghai, 200240, China. E-mail: mjzheng@sjtu.edu.cn
First published on 13th October 2021
Abstract
Molybdenum disulfide (MoS2) is a promising anode material for lithium-ion batteries (LIBs) because of its high theoretical capacity. But its rapid capacity decay due to poor conductivity, structure pulverization, and polysulfide dissolution presents challenges for practical applications. In this work, an innovative cationic surfactant templating route to one-step synthesizing epitaxial few-layer MoS2@N-doped carbon (EF-MoS2@NC) core–shell hollow structures is developed via an electrostatic interaction S+X−I+ pathway. Compared with general hard-template strategies, the soft-template method proposed here is simplified, avoiding the cumbersome coating and template removal process. The internal hollow space and outer NC protective layer can accommodate the large volumetric expansion of MoS2 and preserve the structural integrity of the electrode preventing polysulphide dissolution. When evaluated as anode materials for LIBs, the core–shell EF-MoS2@NC hollow spheres achieve a high discharge capacity of 928 mA h g−1 after 100 cycles at 0.1 A g−1. More importantly, a reversible capacity of 829 mA h g−1 could be obtained at 1.0 A g−1 after 1000 cycles, which demonstrates good stability.
1. Introduction
Rechargeable lithium-ion batteries (LIBs) are extensively used as energy storage devices for various applications such as electric vehicles and renewable energy systems due to their intrinsic advantages of high energy and power density, long lifespan and environmental friendliness.1–3 Although LIBs predominantly use graphite as anode materials, its low theoretical specific capacity (372 mA h g−1) cannot meet the demand of large-scale next-generation energy applications such as advanced electric vehicles.4 Two-dimensional molybdenum disulfide (MoS2) has attracted much interest as anode materials for LIBs because of its high theoretical lithium storage capacity and graphene-like layered structure.5,6 The practical application of MoS2 in LIBs is greatly restricted due to its large volumetric expansion and poor intrinsic conductivity.7 The aggregation of MoS2 sheets and the dissolution of intermediate polysulphides during lithiation and delithiation processes lead to poor cycle stability.Core–shell nanostructures are an ideal architecture of functional materials.8–11 The integration of different materials in the form of core/shell exhibits superior properties over single components.12,13 In particular, core–shell hollow nanostructure materials with nanoscale interior cavities and functional shells provide potential applications in LIBs.14,15 The inner hollow space alleviates the mechanical strain and buffers the volume variation during cycling. Meanwhile, the exterior shell with high surface area prevents the core from structural pulverization and maintains the electrode integrity. Several MoS2 based core–shell materials have been reported for enhanced lithium storage such as TiO2@MoS2,16,17 CNT@MoS2,18 CNT@MoS2@C,19 TiO2@NC@MoS2,20 C@MoS2,21 CuS@MoS222 and C@TiO2@MoS2.23 Due to their high electronic conductivity and considerable flexibility, carbonaceous materials are always considered as crucial components in hybrid anode materials to ameliorate the electric conductivity and stability of the overall electrode with inspiring results.24–26 Although several core–shell structures with MoS2 nanosheets supported on carbon have been synthesized, MoS2/carbon materials still suffer from poor reversible capacity, which is attributed to the exfoliation of MoS2 from the inner carbon. Polysulfides dissolve in electrolytes, leading to the shuttle effect. Furthermore, a typical strategy for the preparation of hollow core–shell nanostructures involves a multistep synthetic process, which may hinder the application of this approach.
Here, we develop a one-step cationic surfactant templating route to synthesizing epitaxial few-layer MoS2@N-doped carbon core–shell structures that differ from the previous hard-templating pathways. Compared to general strategies, the preparation process proposed here is simplified avoiding the tedious coating process, and selection and removal of the template. The advantages of core–shell hollow structures lie in the presence of the internal hollow space and the outer NC protective layer, which can accommodate the large volumetric expansion of MoS2 and preserve the structural integrity of the electrode, thus preventing polysulphide dissolution.
2. Experimental section
2.1. Synthesis of few-layer MoS2@N-doped carbon core–shell hollow spheres
Typically, 100 μL of pyrrole and 60 mg of hexadecyltrimethylammonium bromide (CTAB) were fully mixed in 100 mL of deionized water by stirring for 1 h. Then, 10 mL of ammonium tetrathiomolybdate ((NH4)2MoS4) solution (1 wt%) was added into the above solution, followed by the dropwise addition of 20 mL of 0.26 M ammonium persulfate (APS). After 4 h of stirring, the black suspension was transferred into a 200 mL Teflon-lined stainless-steel autoclave and then placed in an oven at 180 °C for 24 h. The black precipitate was collected by filtration and washed with deionized water and ethanol several times. Finally, the as-obtained EF-MoS2@PPy was calcined at 500 °C for 3 h under a high vacuum atmosphere, during which period PPy was carbonized to an N-doped carbon shell. The samples prepared using different amounts of pyrrole were denoted as PPY-50 (50 μL of pyrrole), PPY-100 (100 μL of pyrrole) and PPY-150 (150 μL of pyrrole).2.2. Materials characterization
The morphology information was determined using an FEI Sirion 200 scanning electron microscope (SEM) and a JEOL 2100F transmission electron microscope (TEM). The crystal structure and composition were examined by X-ray diffraction (XRD, Rigaku Ultima IV X-ray Diffractometer) equipped with Cu Kα radiation. The surface composition of the sample was analyzed by X-ray photoelectron spectroscopy (XPS, AXIS ULTRA DLD, Kratos, Japan). Raman spectra were recorded using a Renishaw in Via-reflex system at room temperature. A laser wavelength of 532 nm was used as the excitation source. Thermogravimetric analysis was performed using a thermogravimetric analyzer (TGA, SDT Q600 V8.2 Build 100) from room temperature to 800 °C at a heating rate of 10 °C min−1 in air. Surface areas and pore size distributions were measured using an Autosorb-IQ3 instrument.2.3. Electrochemical measurements
Electrochemical tests were carried out in 2016-type coin cells. The working electrode consisted of 80 wt% of active material, 10 wt% of conductive carbon black, and 10 wt% of polymer binder (polyvinylidene fluoride, PVDF). The typical mass loading of active materials is about 1 mg cm−2. The lithium disc was used as both the counter electrode and reference electrode. The electrolyte was 1 M LiPF6 in a mixture of ethylene carbonate (EC), dimethyl carbonate (DMC) and diethyl carbonate (DEC) (1![[thin space (1/6-em)]](https://www.rsc.org/images/entities/char_2009.gif) :1:1 by volume). The cell assembly was carried out in an Ar-filled glove box with moisture and oxygen concentrations below 1.0 ppm. Charge–discharge tests were performed on a Land CT2001A battery test system. Cyclic voltammograms (CV) were obtained on a CHI 660D electrochemical workstation. For the working electrode, all the specific capacities reported and current densities used were based on the total mass of EF-MoS2@NC.
:1:1 by volume). The cell assembly was carried out in an Ar-filled glove box with moisture and oxygen concentrations below 1.0 ppm. Charge–discharge tests were performed on a Land CT2001A battery test system. Cyclic voltammograms (CV) were obtained on a CHI 660D electrochemical workstation. For the working electrode, all the specific capacities reported and current densities used were based on the total mass of EF-MoS2@NC.
3. Results and discussion
Epitaxial few-layer MoS2@N-doped carbon core–shell hollow spheres were prepared via a one-step surfactant templating method. Nitrogen-doped carbon was obtained from the carbonization of a shape-controlled polypyrrole (PPy) precursor. Che et al. prepared enantiopure chiral carbonaceous nanotubes through the carbonization of self-assembled polypyrrole using N-acylamino acid surfactants based on the electrostatic interaction between the negatively charged head group and the positively charged imine nitrogen site.27 Lipid amphiphilic molecules with hydrophobic alkyl chains self-assemble to form helical nanostructures, which can be used as a template for the oriented polymerization of pyrrole monomers. Considering that negatively charged MoS42− is used as the precursor of MoS2, anionic surfactants would not be suitable as a template. Thus, the cationic surfactant CTAB is selected as the soft-template due to its structural characteristics, which make core–shell formation more favorable. Although cationic surfactants have been applied for the direct self-assembly of PPy, the final products are in solid state and no hollow/mesoporous structures were obtained, because the required electrostatic interaction between the positively charged template and positively charged pyrrole monomers could not be achieved.28–33 Pyrrole would be located between the hydrophobic alkyl chains of cationic surfactants through hydrogen bonding and hydrophobic nature34,35 leading to the formation of solid nanoparticles and nanofibers.28,32,33 Our approach is based on the creation of an electrostatic interaction S+X−I+ pathway (Fig. 1b).36–38 The interactions between the pyrrole monomer nitrogen site and the CTAB head group are mediated by the MoS42− inorganic ions. Fig. 1a depicts the fabrication process in an aqueous solution. The PPy hollow sphere and epitaxial few-layer MoS2 were templated by the self-assembly of the CTAB vesicle and the subsequent polymerization of pyrrole monomers and degradation of MoS42−. After calcination under a high vacuum atmosphere, MoS2@PPy can be carbonized to a MoS2@NC core–shell hollow structure, and the EF-MoS2 is effectively encapsulated in nitrogen-doped carbon. The preparation of a few-layer MoS2 hollow sphere by using only CTAB and MoS42− was not successful, indicating that the PPy hollow sphere acts as a substrate to confine the in situ epitaxial growth of MoS2. To further verify the formation mechanism of EF-MoS2@NC through a facile cationic surfactant templating method, PPy was also prepared under the same condition without the addition of (NH4)2MoS4. The PPy shows a sphere-like structure with a smooth surface (Fig. S1a and b, ESI†). This result indicates that the sphere structure of PPy can be induced by the CTAB vesicle. However, from the high-resolution TEM images (Fig. S1c and d, ESI†), we can see that the PPy spheres show solid structures and no hollow structure is observed in the interior space indicating that the pyrrole monomers are located in the vesicles. The electrostatic interaction between the CTAB and the pyrrole cannot be achieved without MoS42− ions, which is in accordance with the above-mentioned formation mechanism. | ||
| Fig. 1 (a) Schematic illustration of the synthetic procedure of the EF-MoS2@NC hollow sphere. (b) Schematic illustration of the electrostatic interactions between the pyrrole and cationic surfactant head groups. (c–e) SEM images of the EF-MoS2@NC hollow sphere after annealing with different magnification. | ||
Fig. 1c–e show the scanning electron microscopy (SEM) images of the EF-MoS2@NC hollow sphere templated with CTAB. It can be seen that the sample has a connected nanosphere morphology with an outer diameter of ca. 100 nm. Hollow nanostructures can be observed from the broken nanosphere in the higher magnification SEM image (Fig. 1e). The high-resolution transmittance electron microscopy (HRTEM) images in Fig. 2a and b further indicate that the EF-MoS2@NC possesses a hollow center with an average diameter of ca. 50–100 nm. The obvious contrast between the layered MoS2 and the NC confirms the double-shelled structure with an inner MoS2 and an outer NC layer. The few-layer (ca. 10 layers) MoS2 is about 5 nm thick and the interplanar distance is about 0.62 nm, corresponding to the lattice spacing of (002) planes of hexagonal MoS2. Interestingly, after the hydrothermal reaction, the growth of MoS2 resulted in the formation of an in-plane epitaxial orientation (002) lamellar structure on the inner surface of NC, achieving a maximum intimate interfacial contact between MoS2 and NC. Fig. 2c and d show the TEM energy dispersive X-ray (EDX) mapping profile of a single EF-MoS2@NC with N, C, Mo and S elements. All elements are evenly distributed throughout the whole sphere. The EDX line scan along the diameter of PPY-100 was carried out to further confirm the core–shell hollow structure. As shown in Fig. 2c, the profiles of N and C elements are less intense in the center than that in the shell, which indicates that this structure is hollowed. And at the inner surface of the hollow sphere, a high contrast thin layer profile was observed in the HAADF-STEM image, demonstrating the existence of MoS2 through the Mo and S element distribution measurement. Combined with the SEM images, we can confirm the core–shell hollow structure of PPY-100. The MoS2 and carbon contents in EF-MoS2@NC are determined by thermogravimetric analysis (TGA) shown in Fig. S2 (ESI†). The weight loss in the range of 350–500 °C is due to the oxidation of MoS2 and carbon. The remaining content after 500 °C is pure MoO3, which has a weight percentage of 36.4%. The content of the MoS2 is calculated to be 40.5%.
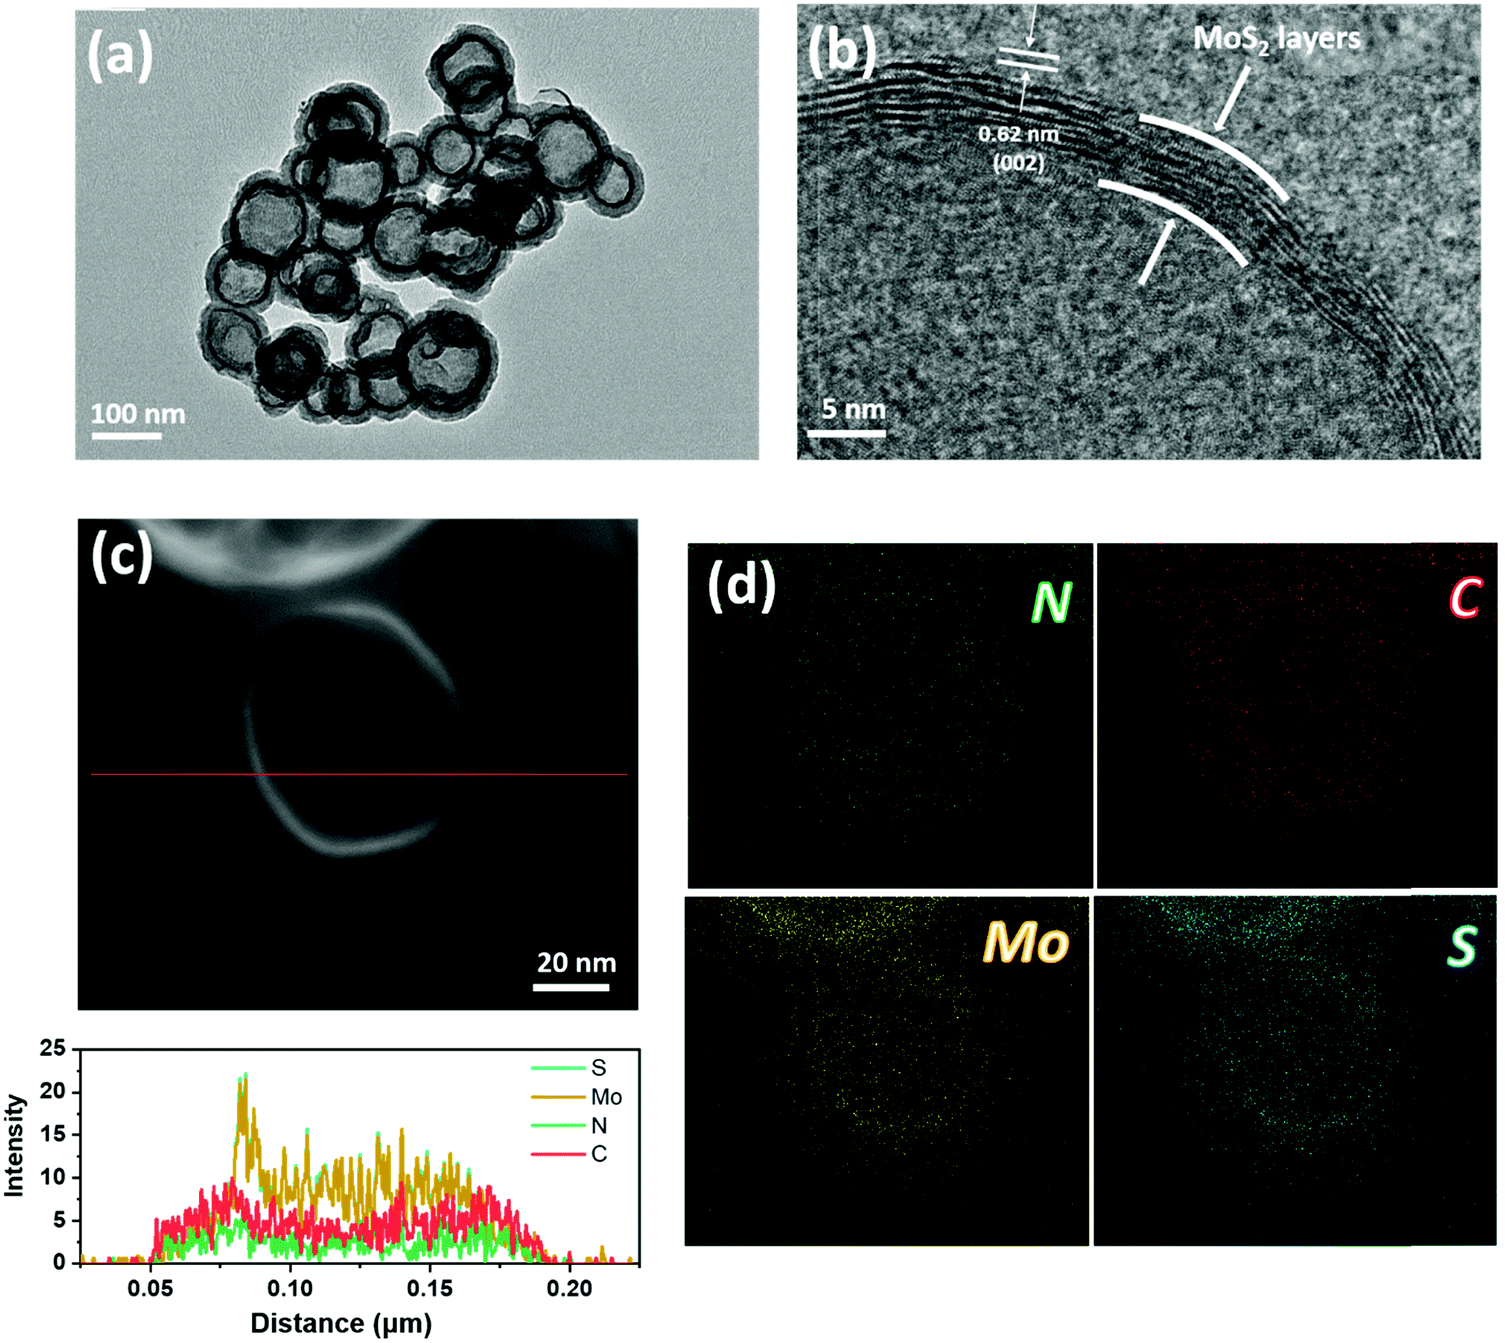 | ||
| Fig. 2 (a) TEM and (b) HRTEM images of the EF-MoS2@NC hollow sphere. (c and d) HRTEM EDX mapping images of the EF-MoS2@NC hollow sphere with N, Mo, C and S elements. | ||
The crystal structure characteristics of EF-MoS2@NC were examined by Raman spectroscopy and X-ray diffraction (XRD). Fig. 3a shows the characteristic Raman bands at around 1364 cm−1 and 1573 cm−1, corresponding to sp3-hybridized carbon (D-band) and sp2-hybridized carbon (G-band), respectively. There are only minor differences in the Raman spectra, indicating a similar degree of graphitization for the three samples. Because the nitrogen-doped carbon shell was fabricated through the carbonization of PPy at the same temperature and with the same duration, the graphitization degree is nearly identical for the three samples. The two characteristic peaks of MoS2 in the Raman spectra are not observed implying a uniform coating of amorphous NC shell. Fig. 3b presents the XRD pattern of EF-MoS2@NC samples before and after carbonization. Three diffraction peaks of the EF-MoS2@PPy sample at 2θ = 33.2°, 39.5° and 58.5° were observed, which can be indexed to the (100), (103) and (110) planes of hexagonal 2H-MoS2 (JCPDF 37–1492), respectively. After carbonization, the intensity of the diffraction peaks becomes relatively weak and is most likely suppressed by the carbon shell. A broad peak in the range of 20°–30° originates from the carbonized PPy. Note that the XRD patterns of the as-prepared samples show a strong (100) diffraction peak and a typical (002) diffraction peak of MoS2 is not exhibited, indicating that the composite contains few-layer MoS2.39–41 This result is in agreement with the HRTEM observation.
 | ||
| Fig. 3 (a) Raman pattern of the EF-MoS2@NC hollow sphere. (b) XRD spectra of the EF-MoS2@NC (PPY-100) hollow sphere before and after annealing. | ||
X-Ray photoelectron spectroscopy (XPS) was conducted to understand the chemical state of the elements in EF-MoS2@NC. Fig. 4a shows the high-resolution XPS spectra of C 1s; the peak at 284.7 eV is typical of graphitic carbon. The peaks at 285.5, 286.6 and 288.9 eV can be attributed to the oxygen-containing carbonaceous bands. The Mo XPS spectra consist of two peaks at 232.4 and 235.7 eV corresponding to Mo6+ 3d5/2 and 3d3/2, which can be ascribed to the slight oxidation of Mo atoms during carbonization (Fig. 4b). The S 2p high-resolution XPS spectrum displays two spin–orbit doublet peaks at 162.0 and 163.3 eV (Fig. 4c). The XPS high-resolution spectrum of N 1s verifies the doping of N in the carbon shell. The binding energies for the three types of nitrogen atoms in the NC layer are found at 398.6, 399.8 and 400.6 eV corresponding to pyridinic-N, pyrrolic-N, and graphitic-N, respectively (Fig. 4d). The contents of N in EF-MoS2@NC determined from the quantitative analysis of XPS is 2.15 at%. The presence of nitrogen in the carbon matrix can enhance the long-term cycle performance of lithium–sulfur batteries since Li2S2 is prone to form a favorable chemical bond with N-atoms. After N is introduced, the carbon can effectively capture the sulfur and polysulfide intermediates in the electrode by chemical binding, and thus promote the cycle stability.42,43 The specific surface area for PPY-100 is 23.98 m2 g−1 obtained by Brunauer–Emmett–Teller (BET) analysis (Fig. 4e and f). The three samples prepared with different amounts of PPy show similar surface areas. The pore size distribution plot shows a broad peak in the range of 10–100 nm, originating from the inner hollow void. This large distribution of the cavity diameter is ascribed to the characteristically wide size distribution of surfactant vesicles. The self-assembly process does not give a strong size selection mechanism for vesicle radii.44
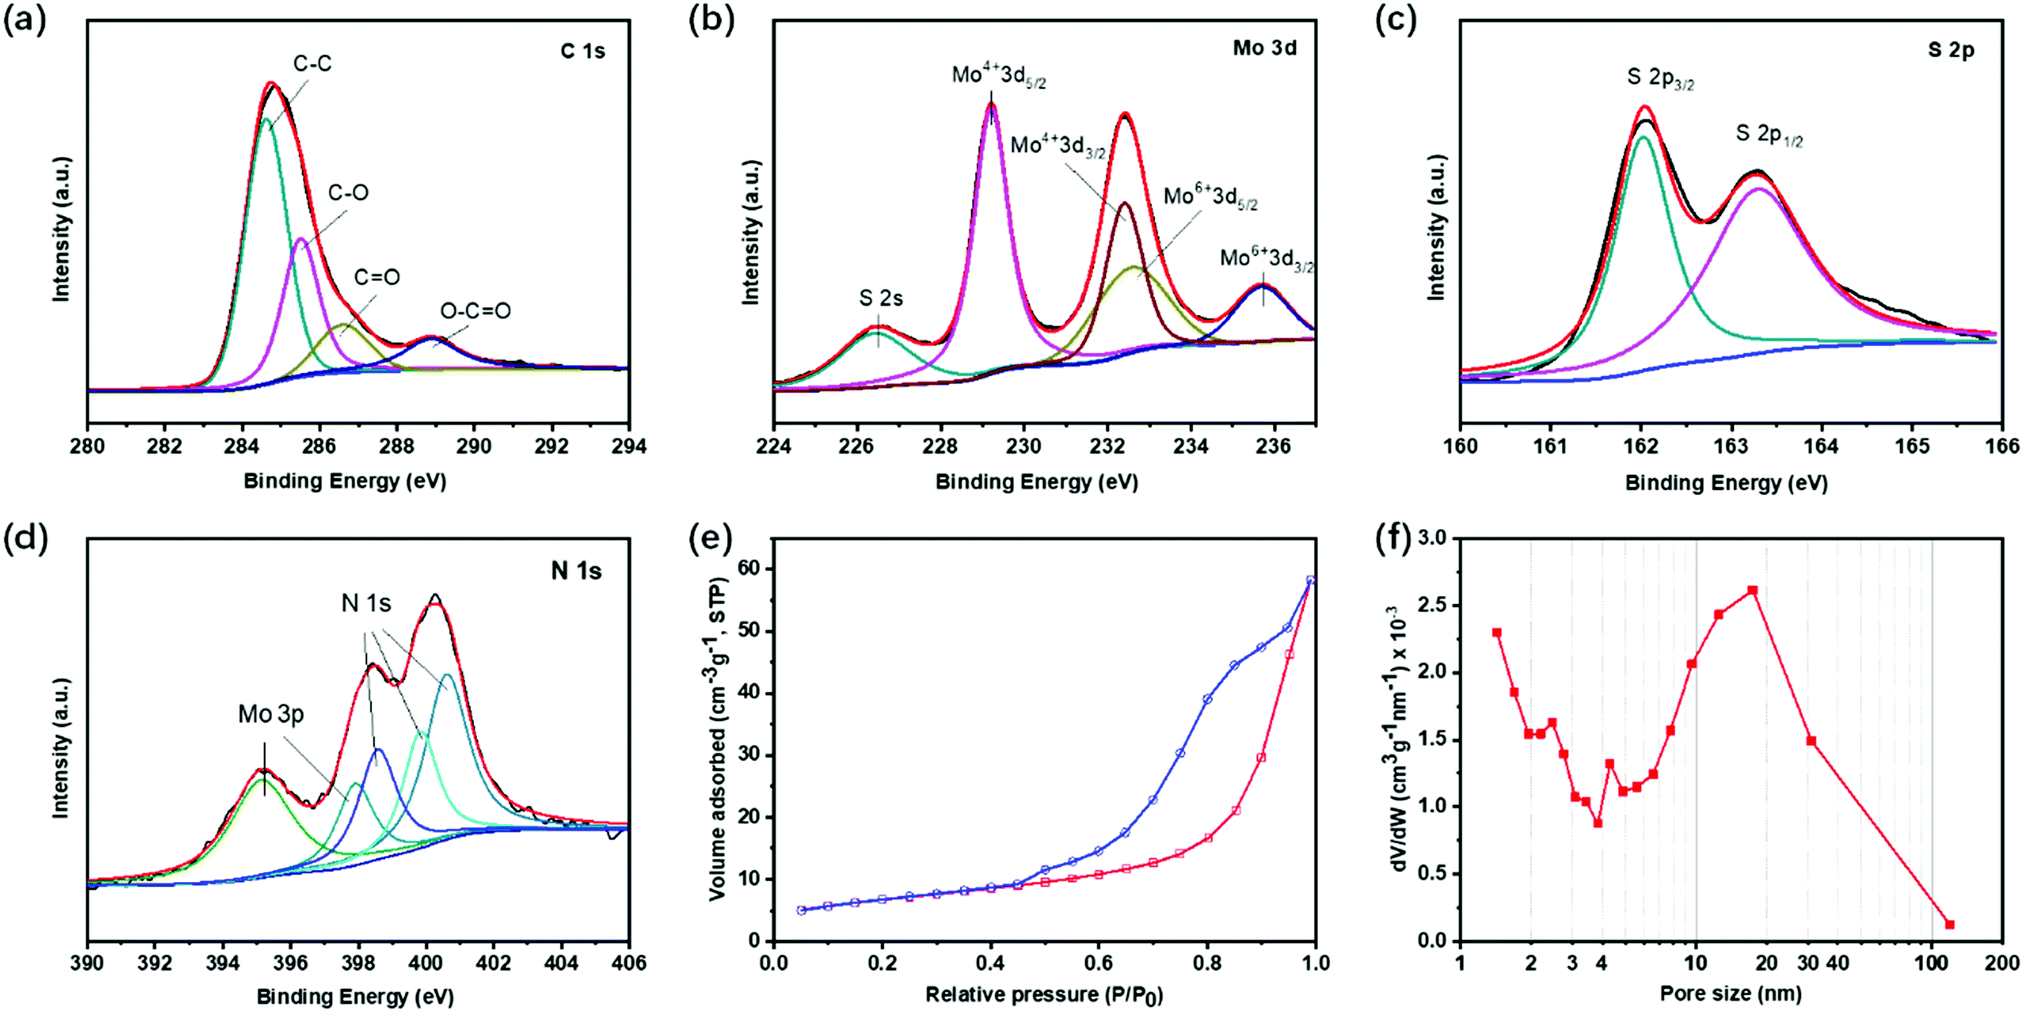 | ||
| Fig. 4 XPS high-resolution spectra of the (a) C 1s, (b) Mo 3d, (c) S 2s and (d) N 1s of the EF-MoS2@NC hollow sphere. (e) N2 adsorption and desorption isotherms and (f) the pore size distribution of PPY-100. | ||
The core–shell hollow structure of the as-prepared EF-MoS2@NC shows its potential as anode materials for lithium-ion batteries (LIBs). Fig. 5a shows the first three cyclic voltammograms (CVs) of PPY-100 at a scan rate of 0.1 mV s−1. In the first cycle, two cathodic peaks at 0.70 and 1.31 V are observed. The peak at 1.31 V is related to the insertion of Li+ into the MoS2 interlayers to form LixMoS2, whereas the other peak at 0.70 V can be attributed to the subsequent conversion reaction of LixMoS2 to metallic Mo and Li2S. In the first anodic scan, a broad anodic peak centered at about 1.20 V and a peak at 2.20 V, which could be assigned to the partial oxidation of Mo atoms and the delithiation of Li2S to S, respectively. After the first cycle, it is proposed that the reversible reaction of S to Li2S mainly dominates the redox process. Therefore, in the following cycles, two new cathodic peaks at 1.06 and 1.89 V appeared, corresponding to the formation of LixMoS2 and Li2S. The galvanostatic charge–discharge voltage profiles for the 1st, 20th, 40th, 60th, 80th, and 100th cycles are shown in Fig. 5b. In the first cycle, PPY-100 delivered initial discharge and charge capacities of 1330 and 950 mA h g−1, respectively, leading to a Coulombic efficiency (CE) of 71%. The charge and discharge curves in the following cycles are almost overlapped indicating that the EF-MoS2@NC has excellent cycle stability and reversibility during the charge and discharge process.
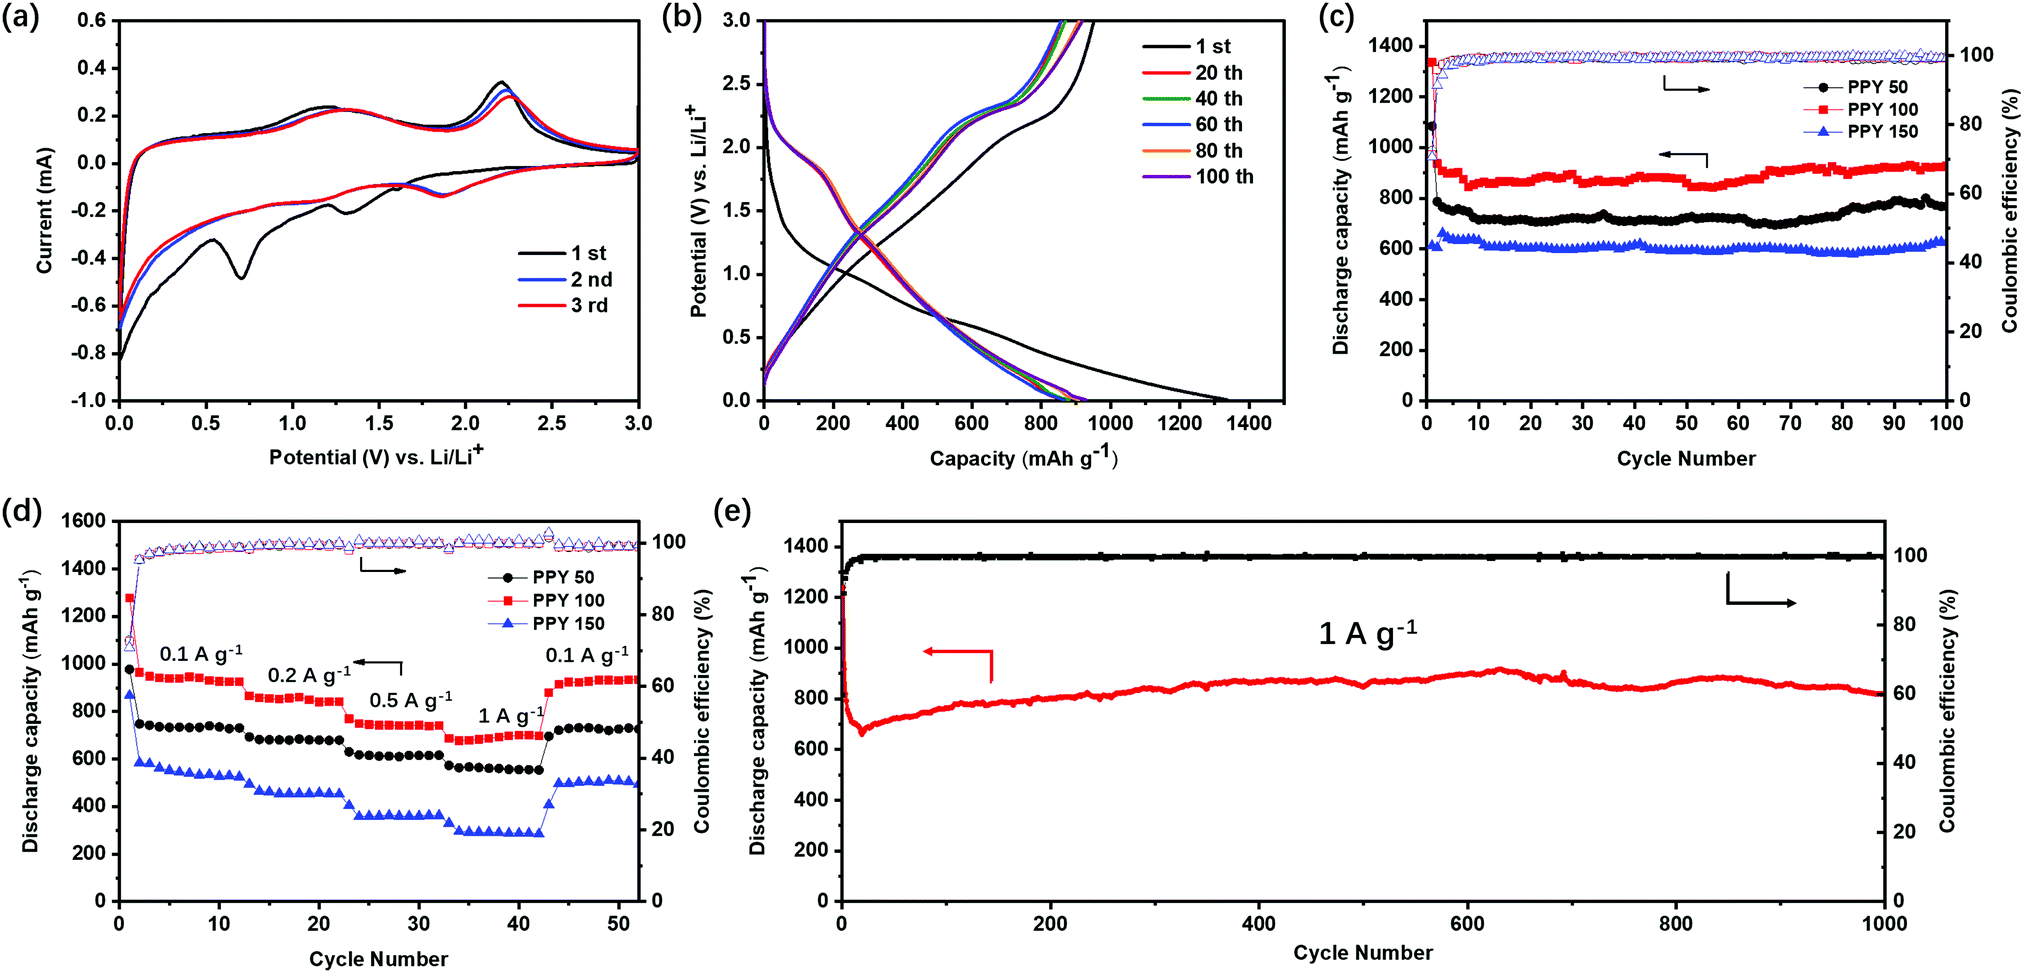 | ||
| Fig. 5 (a) CV curves of the EF-MoS2@NC (PPY-100) in the initial three cycles. (b) Charge/discharge curves of the EF-MoS2@NC (PPY-100) in the potential range of 0.01–3 V for the 1st, 20th, 40th, 60th, 80th and 100th cycles. (c) Cycle performance of PPY-50, PPY-100 and PPY-150 at a current density of 0.1 A g−1. (d) Cycle performance of PPY-50, PPY-100 and PPY-150 at various current densities of 0.1, 0.2, 0.5 and 1.0 A g−1. (e) Long-term cycle performance of the EF-MoS2@NC (PPY-100) at a current density of 1.0 A g−1. | ||
In order to investigate the influence of the morphology of the composites on the capacity and cycle stability, the cycle stabilities of EF-MoS2@NC samples with different amounts of pyrrole were measured at a current density of 0.1 A g −1, as shown in Fig. 5c. Notably, all the samples exhibit excellent cycle stability over 100 cycles, which is attributed to the peculiar core–shell architecture of the MoS2 encapsulated in the hollow space of the nitrogen-doped carbon network. Among the aforementioned samples, PPY-100 exhibits a high reversible capacity of 928 mA h g−1 after 100 cycles. The better lithium-storage performance can be attributed to the sufficient carbon coating and optimized carbon shell thickness. Compared to the PPY-50 sample, the improved performance of PPY-100 is due to the successful carbon coating as shown in Fig. S3 (ESI†). Although PPY-50 contains a higher content of MoS2, the thin and porous carbon layer cannot prevent the dissolution of intermediate polysulphides. When the pyrrole amount increases to 150 μL, the carbon shell becomes dense and thick, which is unfavorable for Li ion transmission. The lower content of active MoS2 is also another factor that limits the performance of PPY-150. Hence, PPY-100 shows the best performance in the three samples. The rate performance of the EF-MoS2@NC samples is compared in Fig. 5d. The PPY-100 electrode delivers reversible capacities of 925, 842, 742 and 698 mA h g−1 at 0.1, 0.2, 0.5 and 1.0 A g−1, respectively. When the current density returns back to 0.1 A g−1, the discharge capacity of PPY-100 rapidly resumes to 931 mA h g−1 indicating the good rate performance of the core–shell EF-MoS2@NC composite.
In addition, even at a higher current density of 1.0 A g−1, the core–shell EF-MoS2@NC hollow spheres show outstanding cycle performance. After 1000 cycles, the discharge capacity of PPY-100 still remains at 829 mA h g−1 with a CE close to 100% (Fig. 5e). To further understand the effect of the core–shell hollow structure on the cycle performance, the cells of the EF-MoS2@NC composite are decomposed after cycling. The morphology is characterized by TEM, as shown in Fig. S4 (ESI†). The structural integrity of the carbon hollow nanospheres is clearly well preserved, in which MoS2 is well confined in the inner buffer void space. This further demonstrates that the core–shell EF-MoS2@NC hollow spheres have an excellent structural advantage for long-term cycle stability. The stable cycle performance of the EF-MoS2@NC electrode can be attributed to two important characteristics of the core–shell hollow design. First, the hollow structure provides sufficient space for the large volume expansion of MoS2 preventing structural exfoliation from the interior surface of the carbon coating layer. Second, the intact carbon shell with a high nitrogen doping concentration serving as a conductive protective layer can maintain structural integrity and prevent polysulphide dissolution (Fig. S5, ESI†). Such unique EF-MoS2@NC hollow sphere nanostructure materials are also promising electrode candidates for the emerging potassium-ion batteries which is a significant advantage over LIBs.45,46 MoS2 is an ideal electrode material for potassium-ion storage. The 2D MoS2 in EF-MoS2@NC can provide a large number of redox sites and K+ transfer channels with a larger interlayer distance.47 Meanwhile, the conductive N-carbon shell endows the reliable protection of hollow structures and superior electrochemical kinetics for fast ion and electron transfer.
4. Conclusions
In summary, to the best of our knowledge, this work represents the successful preparation of a hollow core–shell MoS2/N-carbon composite through a one-step synthesis. The hollow PPy spheres can be templated with a self-assembled cationic surfactant via S+X−I+ electrostatic interactions, providing new nanostructured MoS2/carbon materials for a large variety of surfactant systems. The core–shell EF-MoS2@NC hollow spheres exhibited a high discharge capacity of 928 mA h g−1 after 100 cycles at 0.1 A g−1. Moreover, a reversible capacity of 829 mA h g−1 at 1.0 A g−1 with a coulombic efficiency close to 100% could be obtained up to 1000 cycles, owing to the co-presence of the interior buffer space and conductive nitrogen-doped carbon shell. Through new insight gained in this work, this method may open up future avenues for the development of nanostructured electrode materials for energy storage and conversion applications.Conflicts of interest
There are no conflicts to declare.Acknowledgements
This work was supported by the Natural Science Foundation of China (Grant No. 22109022), the Fundamental Research Funds for the Central Universities (Grant No. 2242021k30028), and the Open Project of Key Laboratory of Artificial Structure and Quantum Control (Ministry of Education), Shanghai Jiao Tong University.References
- S. Chu and A. Majumdar, Nature, 2012, 488, 294 CrossRef CAS PubMed
.
- B. Scrosati, J. Hassoun and Y.-K. Sun, Energy Environ. Sci., 2011, 4, 3287–3295 RSC
- B. Dunn, H. Kamath and J.-M. Tarascon, Science, 2011, 334, 928–935 CrossRef CAS PubMed
- C. K. Chan, H. Peng, G. Liu, K. McIlwrath, X. F. Zhang, R. A. Huggins and Y. Cui, Nat. Nanotechnol., 2007, 3, 31 CrossRef PubMed
- G. Zhang, H. Liu, J. Qu and J. Li, Energy Environ. Sci., 2016, 9, 1190–1209 RSC
- T. Stephenson, Z. Li, B. Olsen and D. Mitlin, Energy Environ. Sci., 2014, 7, 209–231 RSC
- B. Li, Q. Su, L. Yu, J. Zhang, G. Du, D. Wang, D. Han, M. Zhang, S. Ding and B. Xu, ACS Nano, 2020, 14, 17285 CrossRef CAS PubMed
- L. Su, Y. Jing and Z. Zhou, Nanoscale, 2011, 3, 3967–3983 RSC
- K.-C. Ho and L.-Y. Lin, J. Mater. Chem. A, 2019, 7, 3516–3530 RSC
- R. Ghosh Chaudhuri and S. Paria, Chem. Rev., 2012, 112, 2373–2433 CrossRef CAS
- S. Zhang, W. Xia, Q. Yang, Y. Valentino Kaneti, X. Xu, S. M. Alshehri, T. Ahamad, M. S. A. Hossain, J. Na, J. Tang and Y. Yamauchi, Chem. Eng. J., 2020, 396, 125154 CrossRef CAS
- N. Harpak, G. Davidi, Y. Melamed, A. Cohen and F. Patolsky, Langmuir, 2020, 36, 889 CrossRef CAS
- Y. V. Kaneti, Y. Guo, N. L. W. Septiani, M. Iqbal, X. Jiang, T. Takei, B. Yuliarto, Z. A. Alothman, D. Golberg and Y. Yamauchi, Chem. Eng. J., 2021, 405, 126580 CrossRef CAS
- X. Wang, J. Feng, Y. Bai, Q. Zhang and Y. Yin, Chem. Rev., 2016, 116, 10983–11060 CrossRef CAS PubMed
- J. Hu, M. Chen, X. Fang and L. Wu, Chem. Soc. Rev., 2011, 40, 5472–5491 RSC
- B. Guo, K. Yu, H. Fu, Q. Hua, R. Qi, H. Li, H. Song, S. Guo and Z. Zhu, J. Mater. Chem. A, 2015, 3, 6392–6401 RSC
- X. Xu, Z. Fan, S. Ding, D. Yu and Y. Du, Nanoscale, 2014, 6, 5245–5250 RSC
- Y. M. Chen, X. Y. Yu, Z. Li, U. Paik and X. W. Lou, Sci. Adv., 2016, 2, e1600021 CrossRef PubMed
- Z. Zhang, H. Zhao, Y. Teng, X. Chang, Q. Xia, Z. Li, J. Fang, Z. Du and K. Świerczek, Adv. Energy Mater., 2018, 8, 1700174 CrossRef
- S. Wang, B. Y. Guan, L. Yu and X. W. Lou, Adv. Mater., 2017, 29, 1702724 CrossRef PubMed
- X.-Y. Yu, H. Hu, Y. Wang, H. Chen and X. W. Lou, Angew. Chem., Int. Ed., 2015, 54, 7395–7398 CrossRef CAS PubMed
- H. Zhou, Z. Lv, H. Liu, M. Liang, B. Liu and H. Guo, Electrochim. Acta, 2017, 250, 376–383 CrossRef CAS
- J. Pei, H. Geng, E. H. Ang, L. Zhang, X. Cao, J. Zheng and H. Gu, Nanoscale, 2018, 10, 17327–17334 RSC
- H.-P. Feng, L. Tang, G.-M. Zeng, J. Tang, Y.-C. Deng, M. Yan, Y.-N. Liu, Y.-Y. Zhou, X.-Y. Ren and S. Chen, J. Mater. Chem. A, 2018, 6, 7310–7337 RSC
- S. Zhang, Q. Yang, X. Xu, X. Liu, Q. Li, J. Guo, N. L. Torad, S. M. Alshehri, T. Ahamad, M. S. A. Hossain, Y. V. Kaneti and Y. Yamauchi, Nanoscale, 2020, 12, 15611 RSC
- J. Balamurugan, T. T. Nguyen, N. H. Kim, D. H. Kim and J. H. Lee, Nano Energy, 2021, 85, 105987 CrossRef CAS
- S. Liu, Y. Duan, X. Feng, J. Yang and S. Che, Angew. Chem., Int. Ed., 2013, 52, 6858–6862 CrossRef CAS PubMed
- L. Liang, G. Chen and C.-Y. Guo, Mater. Chem. Front., 2017, 1, 380–386 RSC
- Mahnaz M. Abdi, N. F. W. Mohd Azli, H. N. Lim, P. M. Tahir, G. Karimi, Y. B. Hoong and M. Khorram, RSC Adv., 2018, 8, 2978–2985 RSC
- S. Peshoria and A. K. Narula, J. Mater. Sci., 2018, 53, 3876–3888 CrossRef CAS
- C. Sasso, D. Beneventi, E. Zeno, D. Chaussy, M. Petit-Conil and N. J. B. Belgacem, BioResources, 2011, 6, 3585–3620 Search PubMed
- Q. Tian, Z. Zhang, L. Yang and S.-I. Hirano, J. Mater. Chem. A, 2014, 2, 12881–12887 RSC
- Q. Tian, Z. Zhang, J. Chen, L. Yang and S.-I. Hirano, J. Power Sources, 2014, 246, 587–595 CrossRef CAS
- K.-J. Ahn, Y. Lee, H. Choi, M.-S. Kim, K. Im, S. Noh and H. Yoon, Sci. Rep., 2015, 5, 14097 CrossRef CAS PubMed
- J. Jang, J. H. Oh and X. L. Li, J. Mater. Chem., 2004, 14, 2872–2880 RSC
- Q. Huo, D. I. Margolese, U. Ciesla, D. G. Demuth, P. Feng, T. E. Gier, P. Sieger, A. Firouzi and B. F. Chmelka, Chem. Mater., 1994, 6, 1176–1191 CrossRef CAS
- Q. Huo, D. I. Margolese, U. Ciesla, P. Feng, T. E. Gier, P. Sieger, R. Leon, P. M. Petroff, F. Schüth and G. D. Stucky, Nature, 1994, 368, 317–321 CrossRef CAS
- S. Che, A. E. Garcia-Bennett, T. Yokoi, K. Sakamoto, H. Kunieda, O. Terasaki and T. Tatsumi, Nat. Mater., 2003, 2, 801–805 CrossRef CAS PubMed
- G. Huang, T. Chen, W. Chen, Z. Wang, K. Chang, L. Ma, F. Huang, D. Chen and J. Y. Lee, Small, 2013, 9, 3693–3703 CrossRef CAS PubMed
- K.-K. Liu, W. Zhang, Y.-H. Lee, Y.-C. Lin, M.-T. Chang, C.-Y. Su, C.-S. Chang, H. Li, Y. Shi, H. Zhang, C.-S. Lai and L.-J. Li, Nano Lett., 2012, 12, 1538–1544 CrossRef CAS PubMed
- H. S. S. Ramakrishna Matte, A. Gomathi, A. K. Manna, D. J. Late, R. Datta, S. K. Pati and C. N. R. Rao, Angew. Chem., Int. Ed., 2010, 49, 4059–4062 CrossRef PubMed
- Q. Pang and L. F. Nazar, ACS Nano, 2016, 10, 4111–4118 CrossRef CAS PubMed
- J. S. Lee and A. Manthiram, J. Power Sources, 2017, 343, 54–59 CrossRef CAS
- J. R. Howse, R. A. L. Jones, G. Battaglia, R. E. Ducker, G. J. Leggett and A. J. Ryan, Nat. Mater., 2009, 8, 507 CrossRef CAS PubMed
- Y. Liu, Z. Tai, J. Zhang, W. K. Pang, Q. Zhang, H. Feng, K. Konstantinov, Z. Guo and H. K. Liu, Nat. Commun., 2018, 9, 3645 CrossRef PubMed
- S. Zhang, Q. Fan, Y. Liu, S. Xi, X. Liu, Z. Wu, J. Hao, W. K. Pang, T. Zhou and Z. Guo, Adv. Mater., 2020, 32, 2000380 CrossRef CAS PubMed
- J. Zhou, Y. Liu, S. Zhang, T. Zhou and Z. Guo, InfoMat, 2020, 2, 437 CrossRef CAS
Footnote |
| † Electronic supplementary information (ESI) available: It includes PPY preparation, characterization, TGA curves and TEM images for PPY before and after cycles. See DOI: 10.1039/d1ma00504a |
| This journal is © The Royal Society of Chemistry 2022 |