 Open Access Article
Creative Commons Attribution 3.0 Unported Licence
Sub-layer rationale of anomalous layer-shrinkage from atomistic simulations of a fluorinated mesogen†
Kristian
Poll
 and
Mark T.
Sims
 *
*
Department of Applied Sciences, Faculty of Health and Life Sciences, Northumbria University, Newcastle Upon Tyne NE1 8ST, UK. E-mail: mark.sims@northumbria.ac.uk
First published on 10th December 2021
Abstract
Partially-fluorinated mesogens exhibit some of the most significant de Vries behaviour (anomalously low layer shrinkage at the SmA–SmC transition) reported experimentally, making them of particular interest for technological applications. Force constant parameterisation and subsequent atomistic simulations of the mesogen 3M 8422 enabled experimental trends in layer spacing, tilt angle and order parameter to be successfully replicated in silico. Analysis of the simulations demonstrated inconsistencies with conventional models of de Vries behaviour, but analysis of the hydrocarbon and fluorinated sub-layers showed clear evidence that contraction of the hydrocarbon sub-layers was offset by simultaneous expansion of the fluorinated sublayers. Most notably, the behaviour was entirely consistent with that recently reported for the non-fluorinated mesogen 9HL, in which a sub-layer remains “SmA-like”, even in the SmC phase. This observation is somewhat at odds with the relatively established theory that it is specifically nanosegregating elements that promote de Vries behaviour, and suggests there is much still to learn about the molecular organisation within these systems.
Introduction
Liquid crystal phases exist as partially ordered fluids that exhibit a mixture of properties associated with the solid crystalline state and the isotropic liquid state. The anisotropic nature of molecules that form liquid crystal phases leads to various structures that find use in many areas of science and technology.1 Numerous liquid crystal phases exist of which the uniaxial nematic phase is considered the simplest, in which molecules are orientationally ordered and align parallel to a single axis, n, known as the director. In contrast, smectic phases possess degrees of translational order in addition to orientational order, as molecules are arranged into a layer structure with period d. Smectic sub-phases of different types exist, and more than one sub-phase may be formed by certain mesogenic compounds, each with distinct material properties and applications.2,3 The most ubiquitous smectic sub-phases are perhaps the smectic A (SmA), in which n is coincident with the vector normal to the smectic layer planes (k), and the smectic C (SmC) phase, in which n is tilted with respect to k by an angle θ.In the chiral smectic C (SmC*) phase molecules are likewise tilted with respect to k, but they also experience an azimuthal twist in adjacent layers, giving rise to a macroscopic helical structure. Due to reduced symmetry of the chiral phase relative to the achiral analogue, chiral smectics exhibit a local a spontaneous polarisation, which results in the emergence of ferroelectric-like properties.4,5 With significant research efforts it was realised these ferroelectric liquid crystals (FLCs) exhibited numerous optical properties that offered potential in high performance electro-optic displays. However, for these applications the helical superstructure must be suppressed so as not to cancel out the local spontaneous polarisation. Surface-stabilised ferroelectric liquid crystals (SSFLCs) provide a common approach to helix suppression within which molecules in the SmC* phase are anchored between two planar surfaces of a liquid crystal cell.6 SSFLC-based devices exhibit fast switching speeds, typically on a microsecond timescale,5,6 and favourable memory effects due to their inherent bi-stable mode of operation,6,7 and as a result they have potential for large scale direct view LCDs capable of high resolution and high frame rates.8–10 The advantages FLC-based devices afford over their more common nematic equivalents resulted in significant research interest after their initial discovery.5 However, FLC technology has so far only found limited use in liquid crystal on silicon (LCOS) microdisplays,11,12 in addition to field sequential colour technology.13,14 Despite success in these areas, serious difficulties associated with the inherent nature of the SSFLC architecture mean widespread adoption of the technology has been so far unachievable.
Many problems associated with SSFLC-based devices are related to the fact that the thickness, d, of the smectic layers decreases at the SmA*–SmC* transition. Layer contraction is a result of the tilt transition, as molecules anchored to the planar surfaces of the cell tilt away from the layer normal by angle θ, which causes layers to buckle into a chevron geometry.15,16 These chevrons seriously affect the characteristics of electro-optic devices largely due to the formation of zigzag line defects that appear at the boundary between regions with opposite fold directions.15,17
Issues of optical quality could be solved if the layer thickness remains essentially constant on cooling to the SmC* phase, and perhaps unexpectedly materials have been discovered that exhibit this behaviour, providing a potential avenue to solving the problems associated with FLC-based devices.17–20 Since their discovery, much research into anomalous reduction of smectic layer contraction has attempted to explain the behaviour, with one of the first models suggested by Adriaan de Vries,21 giving rise to the term ‘de Vries behaviour’ to describe the phenomenon. However, despite the effort to clarify a mechanism for de Vries behaviour,22–26 a general theoretical model remains under debate.
Successful synthesis of new materials that exhibit de Vries character has often focused on compounds comprising similar structural elements, and these include semi-perfluorinated, polysiloxane,27–29 polysilane,30–32 and lactate derivatives.33,34 Fragments such as these are thought to promote separation of rigid aromatic cores and flexible terminal chains within the phase structure, which in turn is thought to result in de Vries-like behaviour.35,36 Some investigations have attempted to design materials that exhibit nanosegregation of immiscible sub-units as well as a low orientational order parameter.37 Of particular note are compounds that contain perfluoropolyether tails,18,19 which have been shown to possess significant de Vries character through experimental investigation and have led many studies to attempt to synthesise compounds with similar levels of reduced layer contraction.38
The design strategy applied to non-layer shrinkage materials is often influenced by several models, which have attempted to break down de Vries behaviour and its possible mechanisms. One of the earliest models, proposed by de Vries, is based upon a diffuse cone molecular distribution,21–23 in which molecules are tilted away from the layer normal in the SmA phase as well as the SmC phase. Molecules within the ‘de Vries’ SmA phase exhibit azimuthal disorder, and the transition to the SmC phase is therefore framed as a disorder-order transition of the azimuthal distribution. Such a model would result in constant layer thickness at the SmA–SmC transition and would preserve the uniaxial nature of the SmA phase.
A second model has been proposed in which the layer contraction normally present at the SmA–SmC transition is proposed to be offset by a change in the average molecular conformation. In such a model the onset of molecular tilt is accompanied by an increase of the effective molecular length, either through terminal chains adopting a different conformation at the join with the mesogenic core,39,40 or through extension of the terminal chains themselves due to reduced temperature in the SmC phase.25,26
An additional model that has been applied to semi-perfluorinated and silicon-containing compounds suggests that the layer thickness at the SmA–SmC transition is heavily influenced by a shift in molecular interdigitation.19,20,32 The packing arrangement of molecules with one flexible and one rigid tail may change as the molecules tilt with respect to the layer normal and a reduction in the degree of interdigitation may cause an increase in the effective layer thickness.
Although the models outlined above provide reasonable explanation for de Vries character at a molecular level, all are based on idealised cases where only a single effect impacts the layer thickness. A realistic explanation of de Vries behaviour is likely to include multiple features from the models.27
Computer simulation methods provide a way to probe the micro- and macroscopic properties of liquid crystals through the development of molecular models. Atomistic simulations have become increasingly feasible as CPU speeds have increased, more efficient algorithms have been developed, and parallelisation methods have improved. Molecular dynamics (MD) simulations have made great strides in recent years, particularly with the replication and prediction of experimental observables such as phase transitions, order parameters and equilibrium properties of nematic liquid crystalline materials,41–43 which proved to be the foundation for simulation of more complex systems and phenomena, including guest–host systems,44 bent–core mesogens,45 and the twist-bend nematic phase.46 In comparison with the nematic phase, the atomistic simulation of smectic phases requires large system sizes to allow the development of transitional order. As the simulation of large systems has become more common studies have attempted to model such behaviour, and have successfully replicated experimental observables in a variety of systems.47–51
The development of modern computational methods and tools has drastically improved the scope of MD simulations when applied to the area of liquid crystals. The effort to reproduce experimental observables with increased accuracy and investigate complex behaviours has necessitated the need for flexible force fields that can maintain a sufficient level of precision. Parameterisation of existing forcefields has therefore become extremely common, relying on experimental and theoretical approaches,52–54 enabling comprehensive studies of a range of compounds. General force fields often provide the ability to simulate a broad array of compounds and represent a strong starting point for further specific parameterisation where required. The General Amber Force Field, GAFF,55 with parameterisation specifically for liquid crystal simulations has the capability to successfully model the phase behaviour of mesogenic compounds.56,57
Remarkably, given the success of simulation techniques in other areas of liquid crystal research, de Vries behaviour has been largely unstudied though the use of computational techniques. Investigation of de Vries behaviour could no doubt benefit from atomistic simulations that can provide the molecular-level and sub-molecular view of phase behaviour that is so hard to obtain directly from experiment. Insights gained into the anomalous reduction in layer contraction in these materials exhibit would serve as a great parallel to the experimental examinations performed previously. To date, one coarse-grained study58 and our previous investigation of de Vries behaviour in 9HL51 appear to be the limit of computer simulation applied to these materials. The study of 9HL describes a relatively efficient method for simulation of phase behaviour in liquid-crystalline materials, applied to a compound well suited to many of the default parameters available within the GAFF forcefield. However, the de Vries behaviour exhibited by 9HL is rather subtle in comparison to many of the materials that exhibit minimal layer shrinkage,27 and 9HL does not possess any of the common structural units reported to promote nanosegregation within the phase structure such as perfluorinated or siloxane terminal chains.19,20 Therefore an improved insight into the mechanisms behind de Vries behaviour more widely requires simulation of materials that combine minimal layer shrinkage with immiscible sub-units.
The aim of this study was to investigate the phase structure present in such a de Vries material as well as the mechanism behind the behaviour, and to make a comparison with the behaviour simulated previously in 9HL. MD simulations of compounds that include structural fragments such as perfluorinated chains have previously proved difficult due to the lack of suitable parameters available in default forcefields, but recent extension of some default forcefields through parameterisation has led to more flexibility in relation to possible simulation targets. Recent work on an all-atom forcefield for perfluoropolyether compounds has yielded non-bonded parameters,59 which have the potential to be utilised in the simulation of compounds exhibiting de Vries behaviour such as 3M 8422, shown in Fig. 1. With replacement of the default non-bonded GAFF parameters assigned to the perfluoropolyether chain with those optimised by J. Black, et al.,59 alongside specific parameterisation of through-bond parameters, it was hoped that the polyperfluoroether chain could be simulated with sufficient accuracy to replicate de Vries behaviour successfully. Hence, the focus of this investigation is the assignment of optimised parameters to the GAFF forcefield and subsequent simulation of the achiral semi-perfluorinated compound 3M 8422,19 as well as an extensive study of the resulting phase behaviour at the SmA–SmC transition through the application of atomistic MD simulations.
Methods
All MD simulations were performed at a fully atomistic level within GROMACS 5.1.2,60–65 using the General Amber Forcefield55 with modified parameters better optimised for simulation of liquid crystal systems56 as well as specific non-bonded parameters that were reported to more accurately capture the behaviour of perfluoropolyether compounds.59 The lowest energy structure of 3M 8422 was established through optimisation at the B3LYP/6-31G(d) level66,67 within Gaussian 09.68 Partial atomic charges within the non-perfluorinated sub-units were calculated from the optimised geometry using the RESP method,69 while partial atomic charges within the perfluoropolyether chain were modified to align with previous studies of such systems,59 as partial charges generated through the RESP method were found to significantly underestimate the values. Topology files for MD simulations were generated using Antechamber70 within the Amber18 software package,71 and were converted into a GROMACS readable file format using Acpype.72 Finally, dihedral force constants within the perfluoropolyether chain were fitted against the results of potential energy scans performed in Gaussian 09. Relaxed potential energy scans were performed at the B3LYP/6-31G(d) level, and subsequent single point energy calculations, performed at the MP2/6-31G(d) level, were carried out at for each step of the scan. Force constants were fitted to minimise the difference between the MP2 energy profiles and MD energy profiles employing no force constants.The force constants were fitted using R,73 and datapoints were weighted using a Boltzmann distribution at 298 K calculated from the MP2 energy values with a minimum weighting of 1 × 10⁻⁴ to preserve accuracy at high energies. This process enabled an accurate description of the torsions near the energetic minimum, whilst preserving the general shape of the energy profiles at all angles. This fitting procedure was performed for all non-equivalent angles in the backbone of the perfluoropolyether chain, and the improved force constants were added to the relevant topology file. Results of the parameterisations are given in Fig. S1 and S2 in the ESI.†
MD simulations were performed using a 2 fs time step, periodic boundary conditions, and all bonds were constrained at their equilibrium bond lengths using the LINCS algorithm.74 Short range van der Waals interactions were truncated after 1.2 nm, and long range electrostatic interactions were calculated through the particle mesh Ewald method,75 also with a 1.2 nm cut-off. Initial system configurations were constructed with a gas phase lattice of 16 molecules with random head–tail orientations. Each system was gradually compressed with the Berendsen isothermal–isobaric algorithim,76 which allowed all artificial order to be lost before a liquid phase density was achieved, which was verified by the orientation order dropping below 0.1. This process established an unbiased, isotropic initial structure for the phases simulated thereafter, and further details of the process are given in the ESI.† Throughout subsequent simulations the temperature was controlled via a Nosé–Hoover thermostat,77,78 while a pressure of 1 bar was maintained with an anisotropic Parrinello–Rahman barostat,79 allowing the relative dimensions of the periodic box to vary throughout the simulation. MD simulations were performed at 10 K intervals between 280 K and 330 K, employing an identical scale-up method to that described in the previous computational study of 9HL.51 Simulations were performed until the phase structure, characterised through determination of the orientational and translational order, appeared to be fully equilibrated. This corresponded to a minimum simulation time of 500 ns and a maximum simulation time of 900 ns in the 1024-molecule configurations. Equilibration times, average values and their associated errors were determined using the method described by Chodera.80
The second-rank orientation order parameter, P2, and the director, n, at each trajectory frame in each simulation were calculated in a consistent way to previous studies.41–43 The molecular axes from which these order parameters were calculated are defined in the main text. Translational order parameters, τ, were calculated using the method described in detail in previous studies.43,81
The simulated layer normal, k, calculated at each trajectory frame, was obtained by determination of a local layer normal for each molecular reference position, i, followed by diagonalisation of the associated ordering tensor, as reported previously.82,83 The layer spacing, d, was defined as the distance corresponding to the maximum density fluctuation of the molecular reference positions along the calculated layer normal. The central aromatic carbon atom directly attached to the pyrimidine ring was defined as the position of the molecular centre of 3M 8422.
Coordinate files and MD trajectories were visualized with VMD v1.9.3.84
Results and discussion
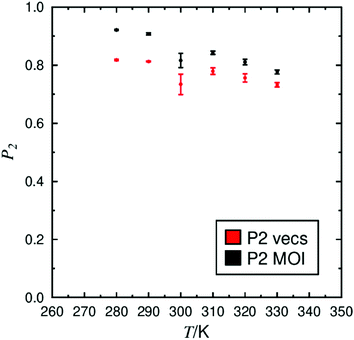
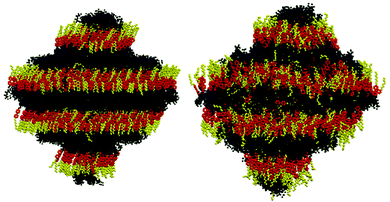
Fully atomistic MD simulations were performed on systems of pure 3M 8422 at 10 K intervals between 280 K and 330 K, encompassing the experimentally reported SmA and SmC phase range.85 The orientational order exhibited by a system generally provides a reliable indicator of mesophase formation in MD simulations, such as those performed in this study, and the presence of significant order was confirmed at each simulated temperature. The P2 values determined at each temperature are plotted in Fig. 2, which shows a general decrease in orientational order as the temperature is increased, consistent with conventional behaviour of liquid crystal systems. The simulated values of ca. 0.8–0.95 are higher than those of ca. 0.56 reported experimentally from X-ray scattering investigation of a chiral analogue of 3M 8422,18,86 but such discrepancies have been addressed in previous work.34,51 In this work two sets of P2 values were calculated, determined from two different axes within the molecule. The principle molecular axis was defined as that calculated from the minimum moment of inertia (MOI) of the whole molecule, while the second axis was determined from the MOI of only those atoms in the aromatic core. The P2 values plotted in Fig. 2 suggest that the mesogenic core is less ordered than the molecule as a whole at all simulated temperatures. In addition, the terminal chains of 3M 8422 appear to become increasingly more ordered, with respect to the mesogenic core as the temperature decreases. These trends appear to be in agreement with recent experimental studies, which focused on the orientational distribution functions of a number of de Vries materials, including the chiral analogue of determined from various experimental techniques.86Snapshots of the simulations at 280 K and 330 K are presented in Fig. 3, showing a substantial degree of orientational order at both temperatures as well as the formation of distinct layers. Fig. 3 suggests that the phase is significantly more ordered at 280 K than at 330 K, consistent with the P2 values plotted in Fig. 2. The snapshots also indicate that molecules are tilted relative to the layer normal at 280 K, whereas this does not appear to be the case at 330 K, suggesting that the simulated SmA–SmC tilt transition lies within this temperature range.
The extent of translational order within a system is a key indicator of smectic phase formation. A quantitative measure of translational order can be obtained through calculation of the order parameter, τ, which is determined from the density fluctuations of the molecular positions along the layer normal.87 Values of τ may vary between 0 when a system exhibits no layering, and 1 in a system with a perfect layer structure.
The τ values calculated at each simulated temperature are plotted in Fig. 4, and are fairly consistent across the temperature range. Average values of ca. 0.6–0.8 suggest the formation of a well-defined layer structure at all temperatures, and the higher values at the two lowest temperatures are consistent with the visualisations discussed above. These values are in close agreement with those derived from a X-ray scattering study of 3M 8422, from which τ values were determined to be ca. 0.7–0.9 in the SmA phase.88 The relatively high degree of translational order exhibited in 3M 8422 is typical of materials reported to display de Vries behaviour,88 in which the development of translational order has been reported to be the primary mechanism that promotes mesophase formation.89,90
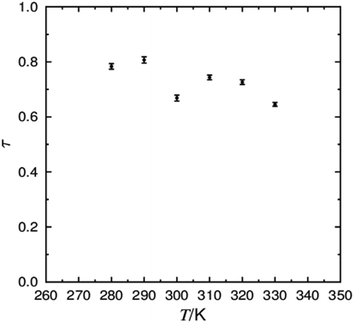 | ||
| Fig. 4 Plot of the average translational order (τ) determined from simulations between 280 K and 330 K, with associated error bars. | ||
The transition between the SmA and SmC phases occurs when the director tilts with respect to the layer normal. As the temperature decreases, molecules tilt on average away from the layer normal, resulting in the formation of the SmC phase. The tilt within a smectic phase can be quantified by measuring the angle between the vectors n and k. The average tilt exhibited at each simulated temperature is shown in Fig. 5, demonstrating an overall decrease in tilt with increasing temperature. A major change in the tilt angle occurs between 290 K and 300 K, which suggests a simulated SmA–SmC transition between these two temperatures, approximately 20–30 K lower than the experimentally reported transition temperature at 321 K.85 Two separate tilt measurements are plotted in Fig. 5 to represent different axes within the molecule, matching the analysis of orientational order shown in Fig. 2. In the SmC phase, the average tilt of the molecular axis, determined as the MOI of the whole molecule, is shown to be significantly lower than the axis determined from mesogenic core labelled as the optical tilt in Fig. 5. This difference indicates that parts of the molecule may not tilt equivalently as assumed by the ‘rigid-rod’ approximation. The calculated tilt angle for the mesogenic core of ca. 21° is similar to the experimentally derived optical tilt of 25° reported within the scientific literature.19 Likewise, the molecular tilt of ca. 12–15° in the SmC phase is in good agreement with the experimental tilt angle of ca. 10–15°, derived from X-ray diffraction data.19
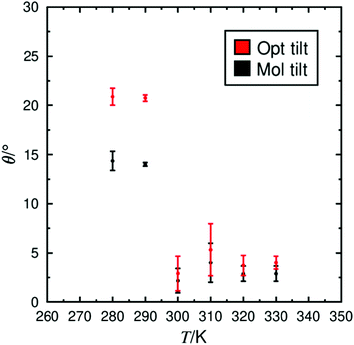 | ||
| Fig. 5 The average tilt between the layer normal (k) and the director (n), for the mesogenic core (red) and the whole molecule (black), determined from simulations between 280 K and 330 K. | ||
In Fig. 5, the simulated SmA phase also appears to exhibit a low tilt (≤5°) angle with no significant difference between the molecular tilt and that of the mesogenic core. The non-zero tilt may be due to tilt small fluctuations in the SmA phase which are widely reported in de Vries materials through the observation of the electroclinic effect in dielectric investigations.17 Such a non-zero molecular tilt in the SmA phase of de Vries materials has been proposed with the ‘diffuse cone’ model, in which tilted molecules are azimuthally unbiased in the SmA phase and produce a uniaxial phase, with an average tilt of 0°, in the bulk material. However, the difference between the tilt angles at 280 K and 290 K and those at 300 K and above are not consistent with the diffuse cone model. A non-zero tilt angle in the SmA phase may also be an artefact of the small simulation size relative to the dimensions of the experimental samples, i.e. fluctuations in the layer structure on the order of the simulated system size will appear significant in the simulation analysis, but would cancel out over the dimensions of a bulk sample.
The effect of the tilt angle on the layer thickness is the ultimate indicator of de Vries behaviour. The calculated layer thickness for simulations of 3M 8422 is plotted in Fig. 6, showing a fairly consistent thickness across all simulated temperatures. The calculated layer thickness appears to decrease from 3.39 nm at 290 K to 3.36 nm at 300 K, exhibiting the opposite correlation to that expected from the conventional SmA–SmC transition. These values are similar to those reported experimentally, where consistent values of ca. 3.2 nm19 and 3.3 nm27,86 were reported across the SmA–SmC temperature range from X-ray scattering experiments. The overall behaviour of the smectic layer thickness reported experimentally also appears to be in close agreement with Fig. 6, as the layer thickness increases in the SmA phase approaching the SmA–SmC transition, likely due to the decrease in temperature causing elongation of the flexible terminal chains. The smectic layer shrinkage, commonly used as a benchmark for de Vries materials, appears to be negative with a smaller layer thickness in the SmA phase compared to that in the SmC phase. As a layer shrinkage at TA–C of ≤ 1% is often quoted as significant de Vries behaviour, the simulations of 3M 8422 successfully capture this property of the material.
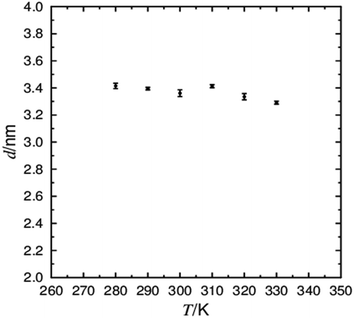 | ||
| Fig. 6 The average layer thickness determined from simulations of 3M 8422 between 280 K and 330 K, with associated error bars. | ||
To gain further insight into the tilt behaviour at each simulated temperature, histograms were generated from the angles between the layer normals and the director orientations, which are presented in Fig. 7. The histograms show a significant shift in the tilt angle population between 290 K and 300 K, consistent with the average tilt angle values shown in Fig. 5. In addition, Fig. 7 suggests that tilt fluctuations are significantly smaller in the SmC phase than in the SmA phase, as expected due the temperature difference. Average tilt angle values of ≤10° in the SmA phase could be the result of small layer fluctuations, but it is difficult to separate small artefacts from real features of the system. The data plotted in Fig. 5 and 7 clearly demonstrate a transition from a phase with minimal tilt at ≥300 K to a phase with significant tilt at ≤290 K. The theoretical layer shrinkage associated with such an increase in tilt angle is not reflected in Fig. 6, again demonstrating the simulated de Vries character of 3M 8422.
The average orientation of molecules within the smectic phase can have a significant impact on the layer thickness. As a result, a significant change in the P2 value at the SmA–SmC transition could provide a way to compensate the reduction in layer thickness caused by the increase in tilt angle. The general trend in P2 values from simulation, plotted in Fig. 2, suggests that although molecules are more orientationally ordered within the SmC phase the increase is likely not sufficient to fully compensate the reduction in layer thickness, consistent with reported results for several other compounds.91–95
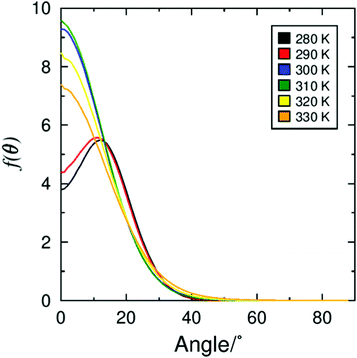
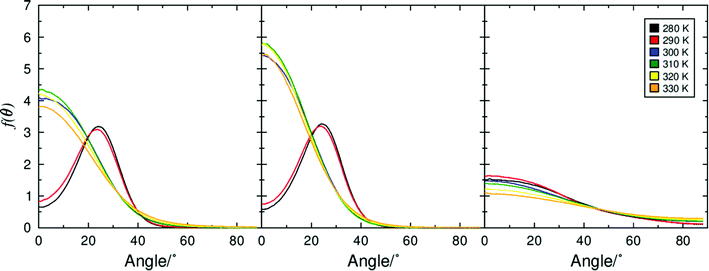
Although the P2 value provides a reliable measure of orientational order within a phase, certain molecular arrangements can result in a similar overall value and are therefore difficult or impossible to distinguish. Orientational distribution functions (ODFs) provide an improved insight into the specific distribution of molecules in a liquid crystal phase. ODFs determined from the MOI axes of the molecules are presented in Fig. 8, and show a distribution centred at 0° in the SmA phase (≥300 K) and a broader non-zero centred distribution in the SmC phase (≤300 K). These ODFs suggest that the most probable molecular orientation is parallel to the layer normal above the SmA–SmC transition, in agreement with the conventional model of the SmA phase. However, below the SmA–SmC transition, most probable alignment is tilted away from the layer normal, typical of a conventional SmC phase.
These ODFs for 3M 8422 appear to be inconsistent with a diffuse cone SmA phase, in which molecules are tilted but without azimuthal ordering, and is consistent with the results of simulations of 9HL.51 Visualisations of the SmA phase structure, shown in Fig. 3, also show little overall molecular tilt and this is further backed up by the high P2 values derived from simulations of the SmA phase.
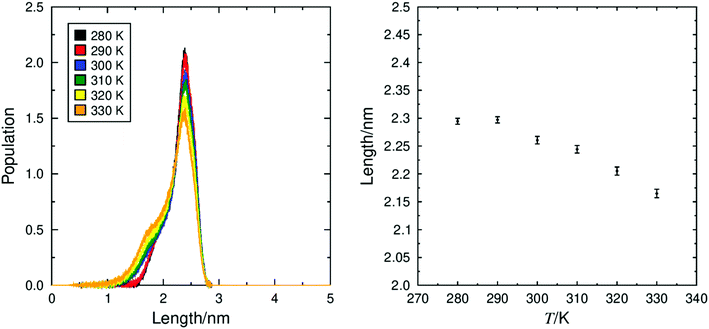
The thickness of the smectic layers is inherently determined by the effective length of the constituent molecules. These molecules or individual molecular sub-units may adopt a different average conformation in the SmA phase than in the SmC phase.39 The layer contraction, caused by the onset of molecular tilt, can be at least partially compensated by a simultaneous increase in the effective molecular length. The calculated molecular lengths, defined as the length of the vector between the terminal CH3 carbon atom on the C8 aliphatic chain and the terminal CF3 carbon atom on the perfluoropolyether chain, at all simulated temperatures are plotted in Fig. 9, showing an increase in the average length of molecules as the temperature is decreased. In addition, Fig. 9 shows a slight change in the population of molecular lengths between the SmA and SmC phases, with molecules more likely to adopt a longer conformation in the SmC phase. It is comparable in magnitude to the elongation exhibited by 9HL in our previous study.51
Major conformational changes in 3M 8422 across the simulated temperature range were also investigated by analysis of the dihedral angle distributions. All dihedrals other than those involving hydrogen atoms or directly substituted to an aromatic ring were analysed and these distributions are shown in Fig. S4 in the ESI.† The results indicate that no major conformational changes occur between 280 K and 330 K, but dihedral angles are generally demonstrated to favour an extended conformation on cooling, consistent with the molecular elongation exhibited in Fig. 9. However, in isolation this elongation is insufficient to account for the layer spacing shown in Fig. 6 given the calculated molecular tilt: l![[thin space (1/6-em)]](https://www.rsc.org/images/entities/char_2009.gif) cos(θ) at 280 K is just 0.06 nm greater than the equivalent value at 330 K, which is less than half the increase in layer spacing between these two temperatures.
cos(θ) at 280 K is just 0.06 nm greater than the equivalent value at 330 K, which is less than half the increase in layer spacing between these two temperatures.
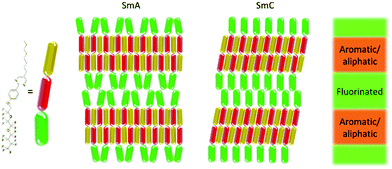
Fig. 10 shows the positions of atoms within the 3 M 8442 molecules along the layer normal, k, at the lowest and highest simulated temperatures. The molecules are defined as “up” or “down” defined by whether the projection of the molecular long axis on to the layer normal is positive or negative. The atoms selected are those at each end of the molecules, as well as those at the boundaries between aromatic and aliphatic regions and between aromatic and perfluorinated regions. These projections demonstrate that the C26 (CF3 carbons) and C11 carbons (CH2 carbons adjacent to the pyrimidine) are roughly coincident for molecules oriented in either direction, matching the bilayer structure evident from the visualisations in Fig. 3, and showing that the C26 and C11 atoms roughly coincide with the centre of the perfluorinated and aromatic/aliphatic sub-layers, respectively. In contrast, the O1 (conjugated oxygens) and C18 (CH3 carbons) in oppositely oriented molecules are out of phase, showing that these atoms roughly coincide with the interface between perfluorinated and aromatic/aliphatic sub-layers. The distributions are very similar between the two temperatures and therefore between the SmA and SmC phases, other than the distributions of the atoms along k, which are slightly broader at the higher temperature. Analysis of interdigitation also shows only minor differences between the SmA and SmC phases, as shown in Fig. S3 in the ESI.†
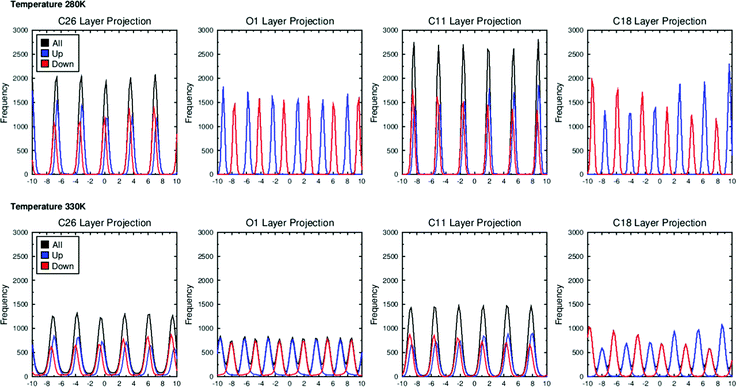 | ||
| Fig. 10 Layer projections for atoms C26, O1, C11 and C18 shown from left to right, respectively, for the simulations at 280 K (top) and 330 K (bottom). | ||
The results presented thus far suggest that the behaviour of 3M 8422 is largely consistent with the previous study of de Vries behaviour in simulations of 9HL.51 The striking result from the simulations of 9HL was the SmA-like nature of the lactate chains in the SmC phase. For this reason, analysis of the sub-unit behaviour of 3M 8422 was carried out in an equivalent manner.
Separation of immiscible chemical domains into distinct sub-layers is a common feature of liquid crystal compounds which exhibit de Vries behaviour. It has been proposed that the behaviour of sub-layers may not be uniform and individual molecular fragments may contribute differently to the overall layer thickness.25 3M 8422 contains a flexible perfluoropolyether tail known to promote nanosegregation in mesogenic phases, and this is consistent with the clear aromatic and perfluoropolyether sub-layers visible in Fig. 3 and discussed above. Numerous studies of de Vries materials have reported that the tilt angle is not typically uniform across the whole molecule, as molecular sub-units may exhibit different tilt behaviour at the SmA–SmC transition.19,25,27 The ODFs of the minimum MOI axes of all atoms that make up the aliphatic chains, the aromatic cores, and the polyperfluoroether chains are shown in Fig. 11, and their respective order parameters are listed in Table S1 in the ESI,† enabling a comparison of the tilt behaviour of the different molecular sub-units across the simulated temperature range.
The ODFs presented in Fig. 11 show that molecules are not tilted uniformly in the SmA or SmC phase and that different molecular sub-units exhibit very different distribution functions. In the SmC phase (280–290 K) the aromatic and aliphatic groups both exhibit ‘volcano-like’ distribution functions with non-zero maximum probability, which is typical of tilted phases. However, the perfluoropolyether groups within 3M 8422 exhibit much broader distribution functions with a maximum at 0° even at the temperatures at which a SmC phase was characterised. As a result, these distributions are largely indistinguishable from the ODFs in the simulated SmA phase, suggesting that the perfluoropolyether sub-unit remains largely un-tilted with respect to k in the SmC phase and therefore does not contribute to a contraction of the smectic layers at the tilt transition.
The substantially different tilt behaviour between the perfluoropolyether sub-unit and the rest of the molecule in 3M 8422 is consistent with the behaviour observed in simulations of the de Vries material 9HL.51 This behaviour provides a rationale for de Vries-like behaviour in 3M 8422, as a significant proportion of the layer structure remains untilted in the SmC phase, hence the layers will shrink to a lesser degree than predicted by the rigid-rod model.
Fig. 12 shows a schematic illustration of the layer structure simulated in 3M 8442, based on the layer projections shown in Fig. 10, illustrating the contrasting nature of molecular organisation between the perfluorinated chains and the aromatic/aliphatic regions. The nature of the behaviour of these sub-units was investigated further by analysing the lengths alongside the tilts of the aromatic and perfluorinated sub-units. Values of l![[thin space (1/6-em)]](https://www.rsc.org/images/entities/i_char_2009.gif) cos(θ), where l is the length of the sub-unit and θ is the angle between the axis defining the sub-unit and k, are indicative of the thicknesses of the respective regions as measured along the layer normal. These values are plotted in Fig. 13, and clearly illustrate that the thickness of the sub-layer comprising aromatic sub-units reduces at the SmA–SmC transition on cooling from 300 K to 290 K, consistent with conventional SmC materials and the rigid-rod model. The sub-layers comprising the perfluorinated units show an increase in thickness on cooling in the SmA phase, consistent with the ODFs in Fig. 11 and the order parameters given in Table S1 in the ESI.† In contrast to the aromatic sub-layer, this increase continues on cooling to the SmC phase at 290 K in which the sub-layer remains SmA-like in character. It is this increase in the sub-layer thickness that appears to offset the shrinkage of the aromatic sub-layer, giving rise to the simulated de Vries behaviour.
cos(θ), where l is the length of the sub-unit and θ is the angle between the axis defining the sub-unit and k, are indicative of the thicknesses of the respective regions as measured along the layer normal. These values are plotted in Fig. 13, and clearly illustrate that the thickness of the sub-layer comprising aromatic sub-units reduces at the SmA–SmC transition on cooling from 300 K to 290 K, consistent with conventional SmC materials and the rigid-rod model. The sub-layers comprising the perfluorinated units show an increase in thickness on cooling in the SmA phase, consistent with the ODFs in Fig. 11 and the order parameters given in Table S1 in the ESI.† In contrast to the aromatic sub-layer, this increase continues on cooling to the SmC phase at 290 K in which the sub-layer remains SmA-like in character. It is this increase in the sub-layer thickness that appears to offset the shrinkage of the aromatic sub-layer, giving rise to the simulated de Vries behaviour.
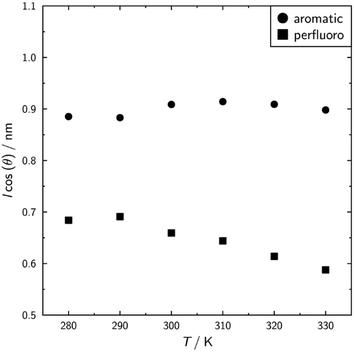 | ||
Fig. 13 Plot of l![[thin space (1/6-em)]](https://www.rsc.org/images/entities/i_char_2009.gif) cos(θ) for the aromatic and perfluoro subunits where l is the average length of the subunit and the value of cos(θ) was calculated from the respective average P2 values in Table S1 in the ESI.† cos(θ) for the aromatic and perfluoro subunits where l is the average length of the subunit and the value of cos(θ) was calculated from the respective average P2 values in Table S1 in the ESI.† | ||
Conclusions
Atomistic MD simulations of smectic phases of the compound 3M 8422 were able to replicate experimental trends such as orientational and translational order parameters, layer spacings and tilt angles over a broad temperature range. Analysis of the simulations demonstrated that de Vries behaviour was replicated and provided an insight into the phase behaviour of the material. A significant change in the average molecular tilt at the simulated SmA–SmC transition was not reflected in the thickness of the smectic layers, which appeared to be largely independent of the tilt. The conventional models proposed to account for de Vries behaviour were not fully consistent with the results of the study. Slight elongation of individual molecules was found to contribute to the lack of layer contraction but was calculated to only partially explain the lack of observed layer shrinkage, and no significant changes in molecular interdigitation were evident.Investigation into the behaviour of molecular sub-units, equivalent to that carried out on 9HL,51 was performed, and provided further details about the phase structure of 3M 8422. Orientational distribution functions (ODFs) and tilt measurements of the individual sub-units indicated that molecules only partially exhibit a net tilt upon transition to the SmC phase. The aromatic cores and aliphatic chains of molecules appear to exhibit conventional behaviour, with a significant tilt transition between 290 K and 300 K. In contrast, the ODFs for the perfluoropolyether chain were shown to remain largely unchanged between the SmA and SmC phase. The factors outlined above are likely to combine to produce the minimal layer contraction observed in simulations of 3M 8422, as well as those reported in experimental investigations of the same compound.19,27 The importance of the sub-unit behaviour we report here is consistent with experimental studies25,96 of siloxane-terminated mesogens, which also showed minimal change in orientational order of certain sub-units at the SmA – SmC transition. The simulations of these fluorinated mesogens did not provide evidence of any net tilt of sub-units in the SmA phase observed for the siloxanes experimentally, but despite this, indicated that the expansion of the fluorinated sub-layers was still sufficient to offset the shrinkage of the aromatic cores.
De Vries behaviour is often thought to be due to incompatibility of subunits such as the perfluoropolyether chain with the aromatic core in 3M 8422. This nanophase segregation of molecular sub-units is clearly evident in the simulations of 3M 8422, which exhibit distinct perfluoropolyether and aromatic sub-layers across the simulated temperature range. However, the formation of such sub-layers is not unique to polyperfluoroether mesogens, with similar results observed in our simulation study of lactate-based 9HL.51 The consistency of the simulated behaviour of 9HL and 3M 8422 seems particularly noteworthy, in that the former contains no groups that promote nanophase segregation beyond the ubiquitous aliphatic and aromatic groups, and therefore appears to be somewhat at odds with the notion that de Vries behaviour is promoted by nanosegregating elements. De Vries behaviour is also exhibited in numerous siloxane-containing mesogens,29,86 which are the subject of ongoing work.
We believe that is study is the first attempt to simulate a perfluoropolyether-based mesogen, which exhibits de Vries behaviour, at an atomistic resolution. This study is complementary to the previous study of de Vries behaviour in 9HL, and the results of both are in good agreement. The analyses performed here illustrate the ability of atomistic simulations to provide insight into complex phase behaviours at a molecular level. It is evident that multiple contributions to the layer spacing can result in de Vries-like behaviour, and it seems likely the extension of computational modelling to such materials will help further elucidate the behaviour, as well as potentially aid the development of new materials.
Conflicts of interest
There are no conflicts to declare.Acknowledgements
The authors thank Northumbria University for the award of a PhD studentship to KP.References
- D. Andrienko, J. Mol. Liq., 2018, 267, 520–541 CrossRef CAS.
- I. W. Hamley, Introduction to Soft Matter– Revised Edition, 2007 Search PubMed.
- P. J. Collings and M. Hird, Introduction To Liquid Crystals – Chemistry and Physics, 2009 Search PubMed.
- R. B. Meyer, Mol. Cryst. Liq. Cryst., 1977, 40, 33–48 CrossRef CAS.
- S. T. Lagerwall, Ferroelectrics, 1984, 59, 25–67 CrossRef.
- N. A. Clark and S. T. Lagerwall, Appl. Phys. Lett., 1980, 36, 899 CrossRef CAS.
- N. A. Clark, T. Bellini, R. F. Shao, D. Coleman, S. Bardon, D. R. Link, J. E. MacLennan, X. H. Chen, M. D. Wand, D. M. Walba, P. Rudquist and S. T. Lagerwall, Appl. Phys. Lett., 2002, 80, 4097–4099 CrossRef CAS.
- J. C. Jones, M. J. Towler and J. R. Hughes, Displays, 1993, 14, 86–93 CrossRef CAS.
- J. R. Hughes, F. C. Saunders, M. J. Towler, P. J. Ayliffe, M. J. Birch, W. A. Crossland, P. W. Ross, P. W. H. Surguy, M. F. Bone and I. Coulson, Ferroelectrics, 1991, 122, 63–79 CrossRef.
- W. J. A. M. Hartmann, Ferroelectrics, 1991, 122, 1–26 CrossRef CAS.
- D. Vettese, Nat. Photonics, 2010, 4, 752–754 CrossRef CAS.
- Z. Zhang, Z. You and D. Chu, Light: Sci. Appl., 2014, 3, 1–10 Search PubMed.
- T. Takahashi, H. Furue, M. Shikada, N. Matsuda, T. Miyama and S. Kobayashi, Jpn. J. Appl. Phys., Part 1, 1999, 38, 534–536 CrossRef.
- J. Bergquist and C. Wennstam, SID Symp. Dig. Tech. Pap., 2006, 37, 1594 CrossRef.
- T. P. Rieker, N. A. Clark, G. S. Smith, D. S. Parmar, E. B. Sirota and C. R. Safinya, Phys. Rev. Lett., 1987, 59, 0–3 CrossRef CAS PubMed.
- N. A. Clark and T. P. Rieker, Phys. Rev. A: At., Mol., Opt. Phys., 1988, 37, 1053–1056 CrossRef PubMed.
- F. Giesselmann, P. Zugenmaier, I. Dierking, S. T. Lagerwall, B. Stebler, M. Kaš, V. Hamplová and M. Glogarová, Phys. Rev. E: Stat. Phys., Plasmas, Fluids, Relat. Interdiscip. Top., 1999, 60, 598–602 CrossRef CAS PubMed.
- J. P. F. Lagerwall, F. Giesselmann and M. D. Radcliffe, Phys. Rev. E: Stat., Nonlinear, Soft Matter Phys., 2002, 66, 1–11 CrossRef PubMed.
- M. D. Radcliffe, M. L. Brostrom, K. A. Epstein, A. G. Rappaport, B. N. Thomas, R. Shao and N. A. Clark, Liq. Cryst., 1999, 26, 789–794 CrossRef CAS.
- M. S. Spector, P. A. Heiney, J. Naciri, B. T. Weslowski, D. B. Holt and R. Shashidhar, Phys. Rev. E: Stat., Nonlinear, Soft Matter Phys., 2000, 61, 1579–1584 CrossRef CAS PubMed.
- A. de Vries, Mol. Cryst. Liq. Cryst., 1977, 41, 27–31 CrossRef CAS.
- A. de Vries, Mol. Cryst. Liq. Cryst., 1979, 49, 179–185 CrossRef CAS.
- A. de Vries, A. Ekachai and N. Spielberg, Mol. Cryst. Liq. Cryst., 1979, 49, 143–152 CrossRef CAS.
- A. Gradišek, V. Domenici, T. Apih, V. Novotná and P. J. Sebastião, J. Phys. Chem. B, 2016, 120, 4706–4714 CrossRef PubMed.
- K. Merkel, A. Kocot, J. K. Vij, P. J. Stevenson, A. Panov and D. Rodriguez, Appl. Phys. Lett., 2016, 108, 243301 CrossRef.
- K. Merkel, Phase Transitions, 2018, 91, 1000–1006 CrossRef CAS.
- J. P. F. Lagerwall and F. Giesselmann, ChemPhysChem, 2006, 7, 20–45 CrossRef CAS PubMed.
- J. Naciri, J. Ruth, G. Crawford, R. Shashidhar and B. R. Ratna, Chem. Mater., 1995, 7, 1397–1402 CrossRef CAS.
- G. Galli, M. Reihmann, A. Crudeli, E. Chiellini, Y. P. Panarin, J. Vij, C. Blanc, V. Lorman and N. Olsson, Mol. Cryst. Liq. Cryst., 2005, 439, 245–257 Search PubMed.
- K. M. Mulligan and R. P. Lemieux, Liq. Cryst., 2015, 42, 1229–1235 CrossRef CAS.
- S. P. Sreenilayam, D. Rodriguez-Lojo, D. M. Agra-Kooijman, J. K. Vij, V. P. Panov, A. Panov, M. R. Fisch, S. Kumar and P. J. Stevenson, Phys. Rev. Mater., 2018, 2, 025603 CrossRef CAS.
- Z. Ahmed, C. Müller, J. J. Johnston, K. Nguyen, C. P. J. Schubert, K. Abitaev, S. Marino, F. Giesselmann and R. P. Lemieux, Liq. Cryst., 2019, 46, 896–904 CrossRef CAS.
- B. Das, A. Pramanik, M. K. Das, A. Bubnov, V. Hamplová and M. Kašpar, J. Mol. Struct., 2012, 1013, 119–125 CrossRef CAS.
- A. Sanchez-Castillo, M. A. Osipov, S. Jagiella, Z. H. Nguyen, M. Kašpar, V. Hamplová, J. MacLennan and F. Giesselmann, Phys. Rev. E: Stat., Nonlinear, Soft Matter Phys., 2012, 85, 1–18 CrossRef PubMed.
- C. P. J. Schubert, C. Müller, A. Bogner, F. Giesselmann and R. P. Lemieux, Soft Matter, 2017, 13, 3307–3313 RSC.
- K. M. Mulligan, A. Bogner, Q. Song, C. P. J. Schubert, F. Giesselmann and R. P. Lemieux, J. Mater. Chem. C, 2014, 2, 8270–8276 RSC.
- J. C. Roberts, N. Kapernaum, Q. Song, D. Nonnenmacher, K. Ayub, F. Giesselmann and R. P. Lemieux, J. Am. Chem. Soc., 2010, 132, 364–370 CrossRef CAS PubMed.
- Q. Song, A. Bogner, F. Giesselmann and R. P. Lemieux, Chem. Commun., 2013, 49, 8202–8204 RSC.
- V. Domenici, M. Lelli, M. Cifelli, V. Hamplová, A. Marchetti and C. A. Veracini, ChemPhysChem, 2014, 15, 1485–1495 CrossRef CAS PubMed.
- D. J. Photinos and E. T. Samulski, Science, 1995, 270, 783–786 CrossRef CAS.
- J. Peláez and M. R. Wilson, Phys. Chem. Chem. Phys., 2007, 9, 2968–2975 RSC.
- G. Tiberio, L. Muccioli, R. Berardi and C. Zannoni, ChemPhysChem, 2009, 10, 125–136 CrossRef CAS PubMed.
- M. F. Palermo, A. Pizzirusso, L. Muccioli and C. Zannoni, J. Chem. Phys., 2013, 138, 204901 CrossRef PubMed.
- M. T. Sims, L. C. Abbott, S. J. Cowling, J. W. Goodby and J. N. Moore, J. Phys. Chem. C, 2016, 120, 11151–11162 CrossRef CAS.
- J. S. Lintuvuori, G. Yu, M. Walker and M. R. Wilson, Liq. Cryst., 2018, 45, 1996–2009 CrossRef CAS.
- D. Chen, J. H. Porada, J. B. Hooper, A. Klittnick, Y. Shen, M. R. Tuchband, E. Korbloèa, D. Bedrov, D. M. Walba, M. A. Glaser, J. E. Maclennan and N. A. Clark, Proc. Natl. Acad. Sci. U. S. A., 2013, 110, 15931–15936 CrossRef CAS PubMed.
- M. Böckmann, C. Peter, L. D. Site, N. L. Doltsinis, K. Kremer and D. Marx, J. Chem. Theory Comput., 2007, 3, 1789–1802 CrossRef PubMed.
- A. Pizzirusso, M. Savini, L. Muccioli and C. Zannoni, J. Mater. Chem., 2011, 21, 125–133 RSC.
- Y. Olivier, L. Muccioli and C. Zannoni, ChemPhysChem, 2014, 15, 1345–1355 CrossRef CAS PubMed.
- F. Yan and D. J. Earl, Soft Matter, 2011, 7, 10266–10273 RSC.
- K. Poll and M. T. Sims, J. Mater. Chem. C, 2020, 8, 13040–13052 RSC.
- I. Cacelli, G. Prampolini and A. Tani, J. Phys. Chem. B, 2005, 109, 3531–3538 CrossRef CAS PubMed.
- I. Cacelli and G. Prampolini, J. Chem. Theory Comput., 2007, 3, 1803–1817 CrossRef CAS PubMed.
- I. Cacelli, A. Cimoli, L. De Gaetani, G. Prampolini and A. Tani, J. Chem. Theory Comput., 2009, 5, 1865–1876 CrossRef CAS PubMed.
- J. Wang, R. M. Wolf, J. W. Caldwell, P. A. Kollman and D. A. Case, J. Comput. Chem., 2004, 25, 1157–1174 CrossRef CAS PubMed.
- N. J. Boyd and M. R. Wilson, Phys. Chem. Chem. Phys., 2015, 17, 24851–24865 RSC.
- N. J. Boyd and M. R. Wilson, Phys. Chem. Chem. Phys., 2018, 20, 1485–1496 RSC.
- F. Jenz, M. A. Osipov, S. Jagiella and F. Giesselmann, J. Chem. Phys., 2016, 145, 134901 CrossRef PubMed.
- J. E. Black, G. M. C. Silva, C. Klein, C. R. Iacovella, P. Morgado, L. F. G. Martins, E. J. M. Filipe and C. McCabe, J. Phys. Chem. B, 2017, 121, 6588–6600 CrossRef CAS PubMed.
- H. J. C. Berendsen, D. van der Spoel and R. van Drunen, Comput. Phys. Commun., 1995, 91, 43–56 CrossRef CAS.
- E. Lindahl, B. Hess and D. van der Spoel, J. Mol. Model., 2001, 7, 306–317 CrossRef CAS.
- D. van Der Spoel, E. Lindahl, B. Hess, G. Groenhof, A. E. Mark and H. J. C. Berendsen, J. Comput. Chem., 2005, 26, 1701–1718 CrossRef CAS PubMed.
- B. Hess, C. Kutzner, D. van der Spoel and E. Lindahl, J. Chem. Theory Comput., 2008, 4, 435–447 CrossRef CAS PubMed.
- S. Pronk, S. Páll, R. Schulz, P. Larsson, P. Bjelkmar, R. Apostolov, M. R. Shirts, J. C. Smith, P. M. Kasson, D. Van Der Spoel, B. Hess and E. Lindahl, Bioinformatics, 2013, 29, 845–854 CrossRef CAS PubMed.
- M. J. Abraham, T. Murtola, R. Schulz, S. Páll, J. C. Smith, B. Hess and E. Lindah, SoftwareX, 2015, 1–2, 19–25 CrossRef.
- A. D. Becke, J. Chem. Phys., 1993, 98, 5648–5652 CrossRef CAS.
- C. Lee, W. Yang and R. G. Parr, Phys. Rev. E: Stat. Phys., Plasmas, Fluids, Relat. Interdiscip. Top., 1988, 37, 785–789 CrossRef CAS PubMed.
- M. J. Frisch, G. W. Trucks, H. B. Schlegel, G. E. Scuseria, M. A. Robb, J. R. Cheeseman, G. Scalmani, V. Barone, B. Mennucci, G. A. Petersson, H. Nakatsuji, M. Caricato, X. Li, H. P. Hratchian, A. F. Izmaylov, J. Bloino, G. Zheng, J. L. Sonnenberg, M. Hada, M. Ehara, K. Toyota, R. Fukuda, J. Hasegawa, M. Ishida, T. Nakajima, Y. Honda, O. Kitao, H. Nakai, T. Vreven, J. J. A. Montgomery, J. E. Peralta, F. Ogliaro, M. Bearpark, J. J. Heyd, E. Brothers, K. N. Kudin, V. N. Staroverov, R. Kobayashi, J. Normand, K. Raghavachari, A. Rendell, J. C. Burant, S. S. Iyengar, J. Tomasi, M. Cossi, N. Rega, J. M. Millam, M. Klene, J. E. Knox, J. B. Cross, V. Bakken, C. Adamo, J. Jaramillo, R. Gomperts, R. E. Stratmann, O. Yazyev, A. J. Austin, R. Cammi, C. Pomelli, J. W. Ochterski, R. L. Martin, K. Morokuma, V. G. Zakrzewski, G. A. Voth, P. Salvador, J. J. Dannenberg, S. Dapprich, A. D. Daniels, Ö. Farkas, J. B. Foresman, J. V. Ortiz, J. Cioslowski and D. J. Fox, Gaussian 09, Revision B.01, Guassian Inc., Wallingford, CT, 2009 Search PubMed.
- C. I. Bayly, P. Cieplak, W. D. Cornell and P. A. Kollman, J. Phys. Chem., 1993, 97, 10269–10280 CrossRef CAS.
- J. Wang, W. Wang, P. A. Kollman and D. A. Case, J. Mol. Graphics Modell., 2006, 25, 247–260 CrossRef CAS PubMed.
- D. A. Case, I. Y. Ben-Shalom, S. R. Brozell, D. S. Cerutti, T. E. Cheatham, V. W. D. Cruzerio, T. A. Darden, R. E. Duke, D. Ghoreishi, M. K. Gilson, H. Gohlke, A. W. Goetz, D. Greene, R. Harris, N. Homeyer, S. Izadi, A. Kovalenko, T. Kurtzman, T. S. Lee, S. LeGrand, P. Li, C. Lin, J. Liu, T. Luchko, R. Luo, D. J. Mermerlstien, K. M. Merz, Y. Miao, G. Monard, C. Nguyen, H. Nguyen, I. Omelyan, A. Onufriev, F. Pan, R. Qi, D. R. Roq, A. Roitberg, C. Sagui, S. Schott-Verdugo, J. Shen, C. L. Simmerling, J. Smith, R. Salomon-Ferrer, J. Swails, R. C. Walker, J. Wang, H. Wei, R. M. Wolf, X. Wu, L. Xiao, D. M. York and P. A. Kollman, AMBER 2018, University of California, San Francisco, 2018 Search PubMed.
- A. W. Sousa Da Silva and W. F. Vranken, BMC Res. Notes, 2012, 5, 1–8 CrossRef PubMed.
- R. Core Team ( 2014), R: A Langauge and Environment for Statistical Computing, R Foundation for Statistical Computing, Vienna, Austria, Available online at https://www.R-project.org/ Search PubMed.
- B. Hess, H. Bekker, H. J. C. Berendsen and J. G. E. M. Fraaije, J. Comput. Chem., 1997, 18, 1463–1472 CrossRef CAS.
- T. A. Darden, D. York and L. Pedersen, J. Chem. Phys., 1993, 98, 10089–10092 CrossRef CAS.
- H. J. C. Berendsen, J. P. M. Postma, W. F. van Gunsteren, A. Dinola and J. R. Haak, J. Chem. Phys., 1984, 81, 3684–3690 CrossRef CAS.
- S. Nosé, Mol. Phys., 1984, 52, 255–268 CrossRef.
- S. Nosé, J. Chem. Phys., 1984, 81, 511–519 CrossRef.
- M. Parrinello and A. Rahman, J. Appl. Phys., 1981, 52, 7182–7190 CrossRef CAS.
- J. D. Chodera, J. Chem. Theory Comput., 2016, 12, 1799–1805 CrossRef CAS PubMed.
- M. T. Sims, L. C. Abbott, J. W. Goodby and J. N. Moore, Soft Matter, 2019, 15, 7722–7732 RSC.
- I. M. Withers, C. M. Care and D. J. Cleaver, J. Chem. Phys., 2000, 113, 5078–5090 CrossRef CAS.
- R. Pecheanu and N. M. Cann, Phys. Rev. E: Stat., Nonlinear, Soft Matter Phys., 2010, 81, 1–17 CrossRef PubMed.
- W. Humphrey, A. Dalke and K. Schulten, J. Mol. Graphics, 1996, 14, 33–38 CrossRef CAS PubMed.
- G. S. Iannacchione, Liq. Cryst., 1999, 26, 51–55 CrossRef CAS.
- P. Rudquist, M. A. Osipov and F. Giesselmann, Liq. Cryst., 2018, 45, 2097–2108 CrossRef CAS.
- C. Zannoni, in The Molecular Dynamics of Liquid Crystals, ed. G. R. Luckhurst and C. A. Veracini, Kluwer Academic, Dordrecht, 1994, pp. 11–40 Search PubMed.
- N. Kapernaum and F. Giesselmann, Phys. Rev. E: Stat., Nonlinear, Soft Matter Phys., 2008, 78, 1–3 CrossRef PubMed.
- M. V. Gorkunov, M. A. Osipov, N. Kapernaum, D. Nonnenmacher and F. Giesselmann, Phys. Rev. E: Stat., Nonlinear, Soft Matter Phys., 2011, 84, 1–13 CrossRef PubMed.
- K. Saunders, Phys. Rev. E: Stat., Nonlinear, Soft Matter Phys., 2008, 77, 1–13 CrossRef PubMed.
- N. Hayashi, A. Kocot, M. J. Linehan, A. Fukuda, J. K. Vij, G. Heppke, J. Naciri, S. Kawada and S. Kondoh, Phys. Rev. E: Stat., Nonlinear, Soft Matter Phys., 2006, 74, 1–11 CrossRef PubMed.
- R. Korlacki, V. P. Panov, A. Fukuda, J. K. Vij, C. M. Spillmann and J. Naciri, Phys. Rev. E: Stat., Nonlinear, Soft Matter Phys., 2010, 82, 1–7 CrossRef PubMed.
- U. Manna, J. K. Song, J. K. Vij and J. Naciri, Appl. Phys. Lett., 2009, 94, 2007–2010 CrossRef.
- D. Nonnenmacher, S. Jagiella, Q. Song, R. P. Lemieux and F. Giesselmann, ChemPhysChem, 2013, 14, 2990–2995 CrossRef CAS PubMed.
- M. V. Gorkunov, M. A. Osipov, J. P. F. Lagerwall and F. Giesselmann, Phys. Rev. E: Stat., Nonlinear, Soft Matter Phys., 2007, 76, 1–16 CrossRef PubMed.
- H. Yoon, D. M. Agra-Kooijman, K. Ayub, R. P. Lemieux and S. Kumar, Phys. Rev. Lett., 2011, 106, 087801 CrossRef PubMed.
Footnote |
| † Electronic supplementary information (ESI) available. See DOI: 10.1039/d1ma00714a |
| This journal is © The Royal Society of Chemistry 2022 |


