 Open Access Article
Elucidating the effect of the spacer and the luminescence mechanism of SRB hosted in a LDH interlayer
Paul
Legentil
a,
Fabrice
Leroux
 *a,
Rachid
Mahiou
a,
Sandrine
Therias
a,
Damien
Boyer
 a,
François
Reveret
b,
Lionel
Nauton
a,
Vincent
Thery
a,
Rodolphe
Valleix
a,
François
Reveret
b,
Lionel
Nauton
a,
Vincent
Thery
a,
Rodolphe
Valleix
 a and
Geneviève
Chadeyron
 *a
*a
aUniversité Clermont Auvergne, CNRS, Clermont Auvergne INP, ICCF, F-63000 Clermont–Ferrand, France. E-mail: genevieve.chadeyron@sigma-clermont.fr; fabrice.leroux@uca.fr
bUniversité Clermont Auvergne, CNRS, Clermont Auvergne INP, Institut Pascal, F-63000 Clermont–Ferrand, France
First published on 29th November 2021
Abstract
The optical properties of sulforhodamine B (SRB) hosted in surfactant-modified layered double hydroxide (LDH) are explored using quantum yield efficiencies and temporal variations in luminescence. The effect of the spacer, known to provide a suitable SRB dilution in the solid state, is studied in-depth with respect to its relative content and its alkyl chain length. Counter-intuitively, considering the nature of such a “passive” spacer, the study reports the effect on the luminescence of the optically active molecules for a large series of surfactants. Spacer intercalation enables the distance between adjacent LDH sheets to be adjusted to the size of the luminescent molecule guest, as exemplified here using a series of surfactant molecules: (CH3)(CH2)nSO4Na with odd values 7 ≤ n ≤ 17 and a fixed amount of SRB at 0.05% of the total anion content in the surfactant and SRB. The effect of the surfactant on the optical properties of SRB is investigated, and the best performance is obtained for n = 11, corresponding to the powder LDH–DS/SRB-5. A computational approach evaluating the packing and structural arrangement present in the series of interleaved surfactants helps to interpret the effect of the length of the alkyl chain on the distribution of the SRB within the LDH interlayer. Silicon composite films were elaborated with different LDH loadings, and the composite film with a loading of 40 wt% of LDH–DS/SRB-5 exhibited the maximum absolute photo-luminescence quantum yield (PL QYabs), as high as 60.0 ± 3.0%, being recorded at 570 nm. Furthermore, an in-depth study of fluorescence lifetimes enables us to highlight a rarely-observed phenomenon of delayed fluorescence, and to distinguish for the first time between the location of SRB, either on or inside the LDH platelets.
Introduction
Sulforhodamine B (SRB), a derivative of rhodamine B, is a hydrophilic luminescent organic molecule belonging to the xanthene family. Although rhodamine B is well described in the literature,1–6 there are currently only a few studies on the properties of its derivative, sulforhodamine B, most of which focus almost exclusively on its properties as a biological tracer.7–10 However, we can mention other applications, such as the use of SRB as a representative dye pollutant, where the fast photocatalytic degradation of SRB has been studied using ZnO: Cu nanorods.11 More recently, Takahiro Suzuki et al.12 focused on the SRB–polymer interaction using a Fe(II)-based metallo-supramolecular polymer (polyFe) by exchanging the counter anion. A solid-state device using the obtained polymer (polyFe–SRB) has shown electrochromic properties based on the electrochemical redox of Fe(II) ions.The use of SRB to monitor drug delivery is often mentioned in the literature.13 Indeed, even when many articles report SRB as a probe, the optical properties of SRB are mostly studied in solution. For instance, Wittman and Penzkofer14 investigate the absorption and emission properties of SRB in ethylene glycol at different concentrations.
Similarly to most organic dyes, SRB exhibits interesting luminous emission properties in dilute solution, but due to π–π stacking or excessive non-radiative energy transfer, SRB suffers from intense self-quenching in its solid state. Therefore, to fluoresce in its solid state, the phenomenon of self-quenching should be strongly limited or better still totally inhibited. The strategy is to avoid direct contact between SRB molecules to inhibit non-radiative energy transfer. As shown in previous studies,15,16 it is possible to co-immobilize dye molecules in a host lattice such as layered double hydroxide (LDH) and to restore a dilution state in the solid state.
Concerning LDH, their structure, which is the same as that of the natural hydrotalcite mineral, is described by the general formula, [MII1−x MIIIx (OH)2][Am−x/m·nH2O], where MII and MIII are divalent and trivalent metal cations, Am− is the interlayered anion to compensate for the positive charge of the hydroxide layers, the value of x determines the charge density of the LDH and water molecules are also present. Indeed, the isomorphic substitution of MII with MIII cations within the brucite-like sheet results in positive electrical net charges balanced by exchangeable anions (Am−) leading to the well-known anion exchange/uptake ability of LDH.
Pioneering work carried out by the group of U. Costantino17 helps to understand the host/guest interaction and highlights the additional photo-physical behaviour of intercalated dye molecules in a two dimensional (2D) confined environment in solution. Since then, the interest in trapping organic molecules in the LDH interlamellar space cannot be denied, as with the intercalation of the xanthene dye fluorescein, surface-immobilized or intercalated into LDH (Zn2Al)18 or phenolphthalein Zn2Al hybrid materials, for which space-resolved fluorescence was used to image the distribution of the dyes and their interactions with LDH platelets.19
In previous studies, the benefits in terms of optical performance of incorporating concomitantly two organic molecules, dodecylsulftate (DS) as the surfactant molecule and SRB in a restricted space like LDH have been underlined20 and can be summed up as follows: increase in photoluminescence quantum yield, increase in thermal stability, possibility of elaborating luminescent coatings on quartz substrates21 or by mixing the HDL-spacer/SRB composite powder into a silicone matrix. As evidenced by Costantino et al.,18 organic molecules may sometimes be simply adsorbed onto the surface of HDL sheets, and intercalation requires the distance between each HDL matrix sheet to be adjusted to the size of the luminescent molecule guest; this being reminiscent of the recently-developed “size-matching interlayer space” (SMIS) approach.22
Here, the effect of the surfactant on the optical properties of sulforhodamine B is investigated using a combination of characterization techniques and a computational approach. Indeed, some questions remain as to whether the surfactant molecules are passive, only dispersing SRB, or if they influence the luminescence properties due their hydrophobic vs. hydrophilic balance. To our knowledge, this question has not yet been addressed. A series of surfactant molecules with various alkyl chain lengths were used as spacers (CH3)(CH2)nSO4Na with odd values 7 ≤ n ≤ 17 and a fixed amount of SRB of 0.05% of the total anion content, 99.95% of surfactant and SRB both interleaved into LDH galleries of formula Zn2Al(OH)6(spacer)0.9995(SRB)0.0005·mH2O. The composite powder LDH-spacer/SRB was characterised by X-ray diffraction.
In addition, simulations were performed to understand the level of packing of the interleaved surfactant molecules and their structural arrangement, in order to clarify the dependence between the alkyl chain length and the luminescence properties of SRB.
To understand the effect of the spacer on the optical properties of sulforhodamine and to scrutinize the luminescence mechanism, the photo-physical properties of the hybrid LDH-spacer/SRB powder were also investigated by recording fluorescence emissions, photoluminescence quantum yield and colour coordinates, as well as luminescence and delayed fluorescence (DF) decay times, thanks to different laser pulse durations (in the fs and ns range) and repetition rates (from a few Hz to several MHz) used to analyse the luminescence kinetics. DF is a rarely-observed phenomenon in organic dyes,23,24 mainly due to the fluorescence from the first singlet excited state, which becomes populated by reverse inter-system crossing (R-ISC) from the triplet excited state, as reported in the case of fluorescein derivatives.25 Composite luminescent films were also prepared by dispersing the LDH-spacer/SRB filler into a silicone-type polymer matrix. The choice of silicone was motivated by the fact that this polymer is widely used in LED devices to disperse luminescent powders.
Experimental section
Materials
Sulforhodamine B sodium salt (C27H29N2NaO7S2), sodium dodecylsulfate, octylsulfate, decylsulfate, tetradecylsulfate, hexadecylsulfate and octadecylsulfate were purchased from Sigma-Aldrich. Zn(NO3)2·6H2O (purity 99.9%), Al(NO3)3·9H2O (purity 99.9%) and NaOH (97%) were obtained from Sigma Aldrich. The two-component silicone elastomer, Bluesil RTV 141 part A (viscous liquid) and part B (catalyser), was supplied by Elkem.Synthesis procedure of LDH hybrid materials
The co-intercalated sulforhodamine B (SRB) and dodecyl sulfate (DS) LDH phases, Zn2Al–DS/SRB, named LDH–DS/SRB-x′ (x′ represents x in ten thousand x′ = 10![[thin space (1/6-em)]](https://www.rsc.org/images/entities/char_2009.gif) 000 × x), were prepared by coprecipitation using various DS/SRB ratios. The synthesis of Zn2Al(OH)6(DS)1−x(SRB)x·mH2O was performed using 50 mL of an aqueous solution containing x mole of sulforhodamine B and (1 − x) mole of dodecylsulfate added dropwise to 50 mL of an aqueous solution of Zn2+ (3.2 mmol) and Al+3 (1.6 mmol) over a period of 3 hours under magnetic stirring and a nitrogen atmosphere at room temperature. For instance, to synthesize a composition with x = 0.001 (x′ = 10), Zn2Al(OH)6(DS)0.999(SRB)0.001·mH2O sample, and 1.6 mmol and 1.6 × 10⁻³ mmol sodium dodecylsulfate and SRB salts were used, respectively. The pH was maintained at 8.5 by adding an aqueous solution of NaOH (0.25 M). The obtained slurries were centrifuged at 5000 rpm for 5 minutes and washed several times with de-ionized water until a clear and transparent supernatant was obtained. The pastes were recovered and dried overnight at room temperature to obtain a powder.
000 × x), were prepared by coprecipitation using various DS/SRB ratios. The synthesis of Zn2Al(OH)6(DS)1−x(SRB)x·mH2O was performed using 50 mL of an aqueous solution containing x mole of sulforhodamine B and (1 − x) mole of dodecylsulfate added dropwise to 50 mL of an aqueous solution of Zn2+ (3.2 mmol) and Al+3 (1.6 mmol) over a period of 3 hours under magnetic stirring and a nitrogen atmosphere at room temperature. For instance, to synthesize a composition with x = 0.001 (x′ = 10), Zn2Al(OH)6(DS)0.999(SRB)0.001·mH2O sample, and 1.6 mmol and 1.6 × 10⁻³ mmol sodium dodecylsulfate and SRB salts were used, respectively. The pH was maintained at 8.5 by adding an aqueous solution of NaOH (0.25 M). The obtained slurries were centrifuged at 5000 rpm for 5 minutes and washed several times with de-ionized water until a clear and transparent supernatant was obtained. The pastes were recovered and dried overnight at room temperature to obtain a powder.
Four samples of Zn2Al(OH)6(DS)1−x(SRB)x·mH2O were prepared according to x values of 0.02, 0.005, 0.002 and 0.0005, resulting in LDH–DS/SRB-x′ where x′ is 200, -50, -20 and -5, respectively.
The influence of the amount of DS on the optical properties of the LDH–DS/SRB-5 matrix was studied. Three levels of DS were tested: 99.9%, 60% and 20%. The anions present in addition to SRB and DS are nitrates, so that their sum is equal to 1. For example, for the sample with 60% DS, the chemical formula is Zn2Al(OH)6(SRB)0.0005(DS)0.6(NO3)0.3995.
A series of surfactant molecules with varying alkyl chain lengths were used as spacers, taking LDH-SRB-5. From C8 to C18, the series was (CH3)(CH2)nSO4Na, with n = 7, 9, 11, 13, 15 and 17. In this series the SRB concentration was fixed at x = 0.0005 and all compositions were prepared in the same manner as LDH–DS/SRB compounds, using the coprecipitation method and the drying process.
Fabrication of silicone/LDH–DS/SRB composite films
LDH–DS/SRB-5 was dispersed in silicone to produce the composite film, with hybrid filler loadings from 5 to 40 wt%. The silicone elastomer was cured by a polyaddition reaction between its two components. Adopting 40 wt% LDH–DS/SRB-5 hybrid LDH filler and 60 wt% silicone, a composite was prepared by mixing 1.16 g of LDH–DS/SRB-5 with part A (2.64 g) using a Thinky Mixer mechanical planetary centrifugal vacuum mixer for 10 min at 1200 rpm. The resulting viscous paste was passed through a rolling mill (EXAKT brand) composed of three rollers (spacing of 30 μm between the first two rollers and 50 μm between the last two rollers) to achieve a suitable dispersion of the LDH platelets by shearing and to obtain a homogeneous hybrid viscous liquid. Part B was added at 10 phr (0.264 g) using a mechanical mixer for 10 min at 1200 rpm. The silicone film and the silicone/hybrid composite film were prepared by casting onto a Teflon sheet using an Elcometer 4340 automatic film applicator. The knife blade height was set to 200 μm and the casting speed was 30 mm s−1. The two-component silicone films were cured at 80 °C for 2 hours and their thickness (90 ± 5 μm) was measured using an Elcometer 456 coating thickness gauge.Characterization techniques
(1) PL QYint = number of emitted photons/number of absorbed photons.
(2) Abs = number of absorbed photons/number of incident photons.
(3) PL QYabs = PL QYint. Abs = number of emitted photons/number of incident photons.
The initial system was stabilized for temperature (NVT ensemble at 293 °K) and pressure (NPT ensemble at 1 atm). Then a MD simulation production was carried out over a period of 20 ns in NPT ensemble, with a time-step of 1 fs. The conditions were the same for each chain length from C8 to C16; C18 was not studied.
Results and discussion
Aggregation of SRB and emission
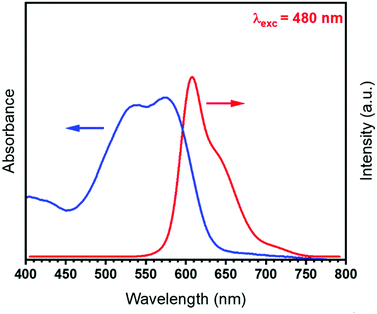
It has previously been shown that dodecylsulfate (DS) anions increase the basal spacing of the host LDH matrix, thus organo-modifying the interlayer space and promoting the intercalation of the optically-active SRB molecules.20It is known that the absorption and emission spectra of the SRB dye in solution are overlapped between 550 and 650 nm (Fig. 2), while both spectra are silent in its solid state.
A reabsorption phenomenon is expected, and should not be excluded, when the overlap area between the emission and absorption bands is non-negligible.
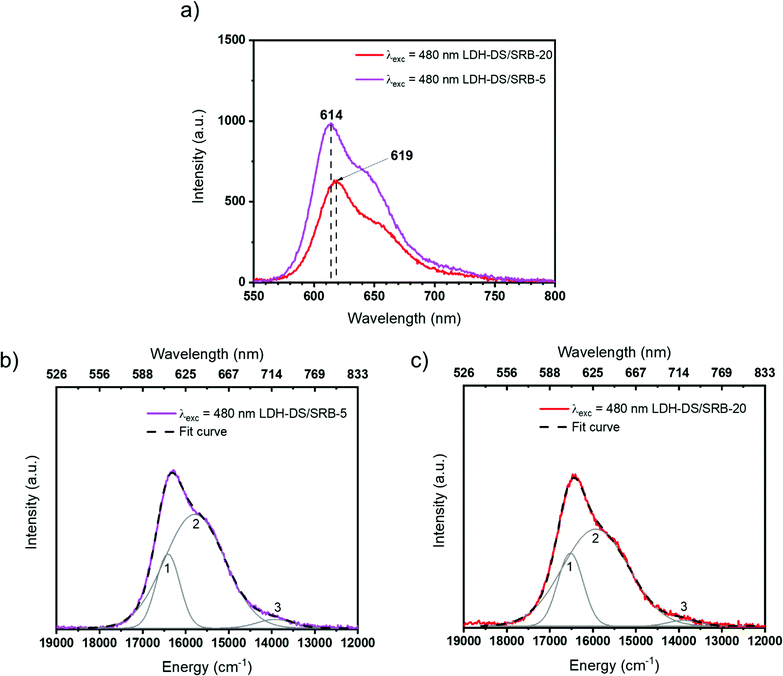
The emission spectra of LDH–DS/SRB-5 and -20, the two lower SRB contents in the series, are displayed in Fig. 3a under blue excitation (480 nm). As expected from a dispersion more suitable with a lower SRB content,20 the LDH–DS/SRB-5 powder presents a higher luminescence intensity between 550 and 750 nm. Moreover, the emission maximum is slightly shifted from one sample to the other (614 nm to 619 nm); LDH–DS/SRB-20 with a higher concentration of SRB is red-shifted compared to LDH–DS/SRB-5.
In both cases, the emission spectrum presents a large asymmetric band with a shoulder near 650 nm. This observation reveals the presence of luminescence that is possibly attributed to specific forms of the SRB dye in the LDH host structure. From a Gaussian-type deconvolution of the emission spectra, three contributions are clearly identified (Fig. 3b and c) in each spectrum and are reported in Table 1. These emission spectra underline that an aggregation is depicted in the powder with relative content of SRB as low as in LDH–DS/SRB-20 (x = 20/10![[thin space (1/6-em)]](https://www.rsc.org/images/entities/char_2009.gif) 000 = 0.002); this behaviour is similar to that described for fluorescein, where J and/or H type aggregates were also observed at very low dye concentrations.22
000 = 0.002); this behaviour is similar to that described for fluorescein, where J and/or H type aggregates were also observed at very low dye concentrations.22
| LDH–DS/SRB-x′ | Contribution | E max (cm−1) and (nm) | Area (a.u.) | FWHM (cm−1) |
|---|---|---|---|---|
| 5 | 1 | 16 412 (609.3) | 318 305 | 653 |
| 2 | 15 789 (633.4) | 1 235 910 | 1 649 | |
| 3 | 13 925 (718.1) | 56 190 | 986 | |
| 20 | 1 | 16 523 (605.2) | 223 367 | 698 |
| 2 | 15 935 (627.6) | 774 282 | 1 816 | |
| 3 | 13 889 (720.0) | 21 409 | 855 |
Contribution 1 at high energy (lower wavelength) is ascribed to the presence of SRB as an isolated molecule (monomer), whereas contributions 2 and 3 are attributed to aggregated forms of SRB (dimer, trimer…). Measuring the contribution area, A1 for contribution 1 and so on, the ratio A1/ΣA (=A1 + A2 + A3) reveals the dispersion rate of the molecules of SRB. The greater the ratio value, the better the dispersion of the SRB molecules. Quantitatively, this ratio is found to be constant from LDH–DS/SRB-5 to -20, with A1 representing about 20% of the total contribution, thus indicating that SRB molecules are not prone to aggregation when present in small quantities.
The normalized CIE XYS 1931 chromaticity diagram of the series of LDH–DS/SRB-x′ is presented in Fig. 4.
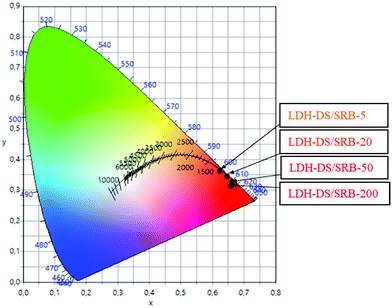 | ||
| Fig. 4 CIE XYZ 1931 chromaticity diagram of the LDH–DS/SRB-x′ powders (x′ = 200, 50, 20 and 5) under blue (480 nm) excitation. | ||
Emission is similar between the powders, and leads to a red/orange emission under blue excitation (480 nm). However, a slight change is observed; the higher the SRB concentration is, the more the emission colour is shifted towards red. This shift in emission colour as a function of dye concentration is in accordance with the above emission spectra and has previously been reported for a series of hybrid LDH phases hosting fluorescein molecules.15
Optical properties as a function of spacer concentration
As mentioned before, DS surfactants increase the interlayer space between the LDH sheets, so easing the ingress of SRB molecules. The effect of their concentration on the optical properties is here further scrutinized. For this purpose, three compositions were selected, as reported in Table 2.| Sample | x SRB | y DS | z NO3 |
|---|---|---|---|
| LDH–DS/SRB-5 | 0.0005 | 0.9995 | 0 |
| LDH–DS/SRB-5a | 0.0005 | 0.60 | 0.3995 |
| LDH–DS/SRB-5b | 0.0005 | 0.20 | 0.7995 |
For this study, the concentration of SRB in the LDH–DS matrix was set at 0.05% (x = 0.0005). This concentration value was identified in a previous study20 as the one leading to the most relevant optical performance.
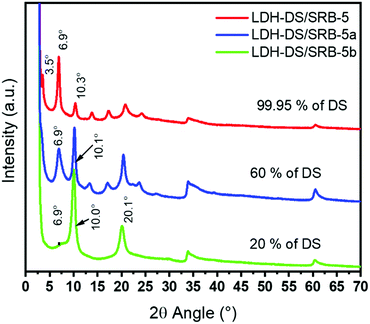
XRD patterns of the samples are reported in Fig. 5. The decrease in the concentration of DS leads to the presence of two crystalized phases, identified as LDH–DS and LDH–NO3 according to the literature.23 The series of harmonics is well observed for LDH–DS, with a DS content of 99.95%, while at a relatively lower content of 20% the diffraction peaks located at 2θ = 10.0° and 20.1° are assigned to LDH nitrate. The basal spacing for the LDH–DS phase is 2.53 nm and that for LDH–nitrate is 0.88 nm. At an intermediate content of 60%, both series are visible, indicating that co-intercalation between nitrate and surfactant anions is not occurring, since the surfactant molecules would have imposed the basal spacing by their size. A mixture of both LDH phases is instead obtained.
To address the effect of surfactant concentration on the optical properties, the absolute photoluminescence quantum yield (PLQYabs) of the three samples is recorded in the 300–600 nm excitation wavelength range (Fig. 6).
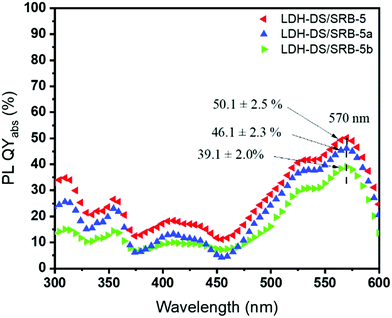 | ||
| Fig. 6 Absolute PLQY in the 360–600 nm excitation wavelength range for samples LDH–DS/SRB-5, 5a and 5b. | ||
The profile is shaped similarly between the samples, with a maximum yield at an excitation wavelength of 570 nm, corresponding to a red emission. Interestingly LDH–DS/SRB-5 exhibits a higher PLQYabs, which is found to decrease slightly when lower amounts of surfactant molecules, a passive component, are used. As shown by Ogawa and Kuroda,31 the alkyl chains of the DS allow a more homogeneous dispersion of the SRB molecules in the interfoliar space (or on the surface of the LDH platelets), avoiding the formation of aggregates responsible for the extinction of the luminescence, even if the amount of SRB remains very low (0.05%).
Effect of spacer alkyl chain length on SRB emission
The effect of the chain length of the spacers was studied, and a series of fatty sulfonate acids from C8 to C18 was intercalated between the LDH layers. The functionalized group is similar, so most probably the host–guest interaction is similar as well, while the change in the alkyl chain length strongly modifies the hydrophobic/hydrophilic balance. The longer the chain, the more hydrophobic it is. In the whole series and as before, the SRB concentration was fixed at 0.0005 (LDH-SRB-5) with 0.9995 for the spacers. The XRD diffractogram patterns are plotted in Fig. 7.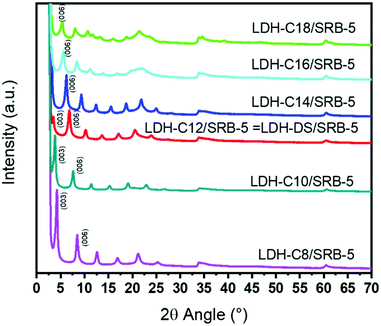 | ||
| Fig. 7 X-Ray diffraction patterns of LDH-Cn/SRB-5 hybrid phases as a function of n (SRB concentration is fixed at 0.0005). | ||
The diffraction peak (003) of the sample LDH-C8/SRB-5 appears at 2θ = 4.2°, corresponding to a 2.11 nm basal spacing. From C8, a linear dependence is then observed between the basal spacing and the increase in alkyl chain length, as shown in Table 3. A linear regression between the basal spacing and the alkyl chain length agrees well with what is reported in the literature.32 An increase in alkyl chain length shifts the series of harmonic peaks (00l) towards a lower diffraction angle. For the samples synthesized using surfactant molecules with an alkyl chain length higher than C12 (n > 11), the diffraction peak (003) is no longer observed, since it is in the steep rise of the X-ray direct beam. Therefore, for n greater than 11 the basal spacing is calculated from the diffraction peak corresponding to the (006) plane and not to the (003) plane.
| Sample | (003) 2θ (°) | (006) 2θ (°) | Basal spacing (nm)ab |
|---|---|---|---|
| a Basal spacing calculated from Bragg relationship: λ = 2d × sinθ (see experimental part). b Linear regression between basal spacing: d-spacing (nm) = 1.06 + 0.13 per (CH2). | |||
| LDH-C8/SRB-5 | 4.2 | 8.4 | 2.11 |
| LDH-C10/SRB-5 | 3.8 | 7.6 | 2.33 |
| LDH-C12/SRB-5 (=LDH–DS/SRB-5) | 3.4 | 6.8 | 2.60 |
| LDH-C14/SRB-5 | — | 6.2 | 2.85 |
| LDH-C16/SRB-5 | — | 5.5 | 3.21 |
| LDH-C18/SRB-5 | — | 5.3 | 3.34 |
For the LDH-Cn/SRB-5 series, the internal PLQY curves are plotted between 300 and 600 nm in Fig. 8. Interestingly, the quantum yield intensity is found to be dependent on the alkyl chain length.
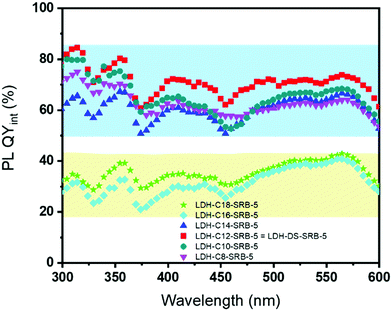 | ||
| Fig. 8 Variations in the PL QYint of LDH powders as a function of the intercalated spacers (SRB concentration is fixed at 0.0005). | ||
It is worth mentioning that the effect of the “passive” spacer regarding optical properties has never been pointed out before. A trend seems to emerge, depending on the alkyl chain length of the spacer. Indeed, for a shorter alkyl chain C8 < Cn < C14, a much higher internal quantum yield (>60% for λexc = 480 nm) than those recorded for the same sample synthesized with a longer alkyl chain n > 12 (for which the PL QYint drops below 45% at 480 nm) is obtained.
The best optical performance is achieved for the C12 chain, regardless of the chosen excitation wavelength, thus revealing an optimal alkyl chain length. To explain the reason why the alkyl length of the «passive» spacer plays a role in the luminescence of SRB, simulations are presented.
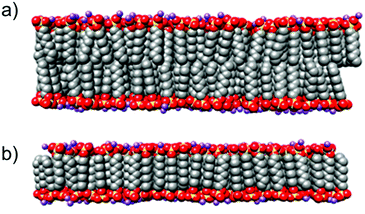
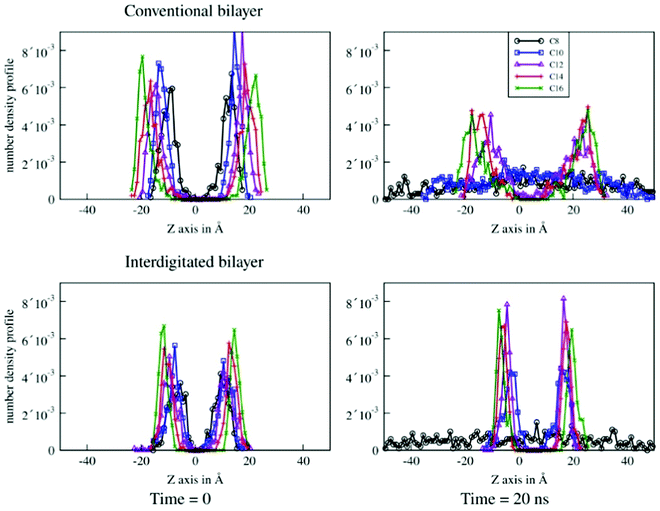
Fig. 9 shows sulfur density along the Z axis, perpendicular to the plane of the bilayer. The top row shows the sulfur density for the conventional bilayer structure and the bottom row shows the interdigitated bilayer structure. The left column shows the simulated system at t = 0 for the production run and the right column shows the simulated system after 20 ns of molecular dynamics. The conventional bilayer structures built from C8 and C10 chains are unstable and denature after 20 ns. This is reflected in Fig. 9 (top right) by a sulfur density which is distributed along the entire Z axis. For the C12–C16 chains, the bilayer structure persists, but the spreading of the peaks on the Z axis reflects the significant flexibility of the bilayer with the beginning of destructuration.
For the interdigitated bilayer structure, the C8 chain quickly becomes completely unstructured. The C10 bilayer persists, but destructuration starts to occur. Fig. 10 (bottom right) shows a broadening of the density peaks. On the contrary, for the C12–C16 chains, the width of the sulfur density peaks is narrow (Fig. 10 (bottom right)) compared to that obtained with the conventional bilayer. This indicates a perfectly stable and well-ordered patterning after 20 ns of the interdigitated bilayer, and thus more stable than the conventional bilayer. These results are consistent with the literature,28 in which the conventional C12 bilayer destructures after 50 ns and evolves into micelles, while the interdigitalised bilayer remains perfectly stable.
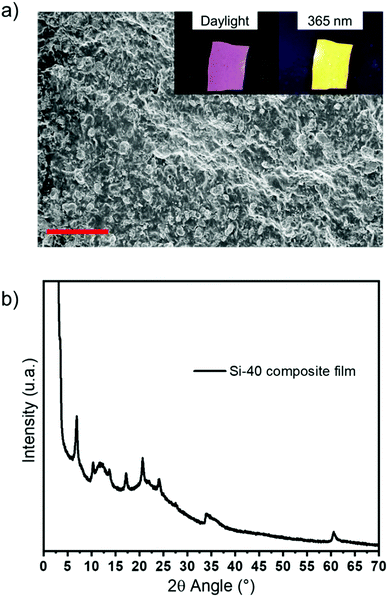 | ||
| Fig. 10 (a) SEM image (scale bar = 20 μm); inset: photographs of the Si-40 composite film under daylight and under UV light at 365 nm and (b) X-ray diffraction pattern of the Si-40 composite film. | ||
The distances between each sulfur plane can be determined, and compared with the basal spacing determined using XRD (Table 4). The basal spacing is equal to the sulfur–sulfur distance measured on the model and twice the S–Zn distance measured at 0.24 nm. In the case of chain C12 we measure a S–S distance of 2.1 nm, compared to 2.3 nm for C14 and 2.7 nm for C16, i.e. a basal spacing of 2.58 nm for C12, 2.78 nm for C14 and 3.18 nm for C16. This confirms the idea that the surfactant molecules are organized between the LDH layers as in an interdigitated bilayer.
| Sample | (003) 2θ (°) | (006) 2θ (°) | Basal spacing (nm) | Distance S–S molecular modelling |
|---|---|---|---|---|
| LDH-C8/SRB-5 | 4.2 | 8.4 | 2.11 | — |
| LDH-C10/SRB-5 | 3.8 | 7.6 | 2.33 | — |
| LDH–DS/SRB-5 | 3.4 | 6.8 | 2.60 | 2.1 |
| LDH-C14/SRB-5 | — | 6.2 | 2.85 | 2.3 |
| LDH-C16/SRB-5 | — | 5.5 | 3.21 | 2.7 |
| LDH-C18/SRB-5 | — | 5.3 | 3.34 | — |
These first results do not explain the differences in fluorescence according to the length of the chains. Indeed, we should have the same PL QYint for C12, C14 and C16, but C16 shows a much weaker PL QYint (Fig. 8). The determination of the type of LDH bilayer is necessary but not sufficient. It is essential to study the interaction of the ternary system: LDH/SDS bilayer/SRB. Firstly the interaction SDS/SRB in micellar form will be necessary to study and then in a second time the interaction of SDS/SRB with LDH.33 It is interesting to note that the LDH-C12/SRB-5 sample, which has the best performance, is the one selected in the further course of this study.
Luminescent composite films
The loading rate of LDH–DS/SRB-5 in silicone is optimized step by step, and up to 40 wt% of LDH hybrid powder is mixed homogeneously with 60 wt% of silicone. Above this value, some agglomerates are observed. It is worth mentioning that 40 wt% is a high loading level, corresponding to a masterbatch in polymer processing.A series of four composite films was prepared with varying rates of optically-active filler loading, and the associated PL QYabs is reported for three excitation wavelengths (570 nm (maximum emission), 480 and 365 nm (Commercial LEDs)) in Table 5.
| Sample | Loading rate (% wt) | PLQYabs 570 nm (%) | PLQYabs 480 nm (%) | PLQYabs 365 nm (%) |
|---|---|---|---|---|
| Powder | — | 57.6 ± 2.9 | 15.6 ± 0.8 | 17.3 ± 0.9 |
| Film Si-5 | 5 | 11.2 ± 0.6 | <1 | 2.3 ± 0.1 |
| Film Si-10 | 10 | 19.8 ± 1.0 | 1.9 ± 0.1 | 4.5 ± 0.3 |
| Film Si-20 | 20 | 50.7 ± 2.6 | 8.4 ± 0.4 | 9.9 ± 0.5 |
| Film Si-40 | 40 | 60.0 ± 3.0 | 11.0 ± 0.6 | 12.6 ± 0.7 |
The films are named according to the LDH loading of x wt% as Si-x. A maximum PL QYabs of 60.0 ± 3.0% is recorded for film-40 using LDH–DS/SRB-5 powder at a loading rate of 40 wt%; above this loading rate, dispersion is no longer possible. This value is slightly higher than that of the powder, showing that dispersion in silicone is beneficial to the optical emission of the SRB molecules, most probably due to the shearing process during film processing, which helps to further disperse the dye molecules.
The homogeneous dispersion of LDH hybrid powder is clearly visible in the SEM image (Fig. 10a) and in those recorded under daylight and under UV radiation (365 nm) with a strong orange emission (inset Fig. 10a). Furthermore, the X-ray diffraction pattern recorded for the Si-40 composite film confirms that the structure of the HDL matrix is well preserved, with the observation of the characteristic (00l) diffraction peaks of the latter (Fig. 10b).
Luminescence decays
The emission spectra of the series were recorded under laser-pulsed excitation. The recorded spectra are unambiguously similar to those recorded under CW excitation provided by a xenon lamp. As mentioned previously, when delayed fluorescence (DF) exists, DF has a spectrum similar to that of prompt fluorescence (PF) but a substantially longer lifetime due to phosphorescence, because the population of the excited singlet state originates mainly from the triplet state.34,35In the literature, the fluorescence decay for SRB is usually recorded in solution (10−5 M), and the lifetime exhibits a mono-exponential decay in the ns range. For instance, Rinafi et al. measure a decay of 2.1 ns (λexc = 570 nm and λem = 590 nm).36 Ray et al. focus on the decay of SRB films in octadecylamine prepared using the Langmuir–Blodgett process37 The decays are then composed of two exponential functions assigned to SRB dimer and SRB monomer contributions. Experimentally, two time constants of 28 ps and 195 ps are measured; the shorter lifetime is attributed to the dimer contribution. We can also mention the study of Thangaraj et al.38 which deals with the quenching of SRB fluorescence on graphene oxides and on boron nitride nanosheets.
Only a few articles report on the lifetime of SRB in lamellar structures like LDH. To date the fluorescence decay of SRB molecules when intercalated into a LDH MgAl structure has been reported by Yan et al.21 The authors suggest, for the best-performing powder, mono- or bi-exponential decays associated with time constants of 3.7 or 8.6 and 4.0 ns, respectively (λexc = 570 nm and λem = 587 nm). The bi-exponential decay is explained21 by considering that the SRB molecules are either intercalated in the interlamellar space (for the longest luminescence lifetime) or surface-adsorbed onto the platelets (for the shorter lifetime).
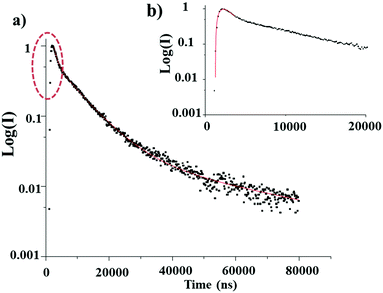
In our case, the luminescence decay of the LDH–DS/SRB-5 powder and the associated Si-40 composite film is recorded using an OPO laser at 300 K with λexc = 400 nm and λem = 604 nm (S1–S0 transition of the SRB). The semi-logarithmic representation of the decay recorded at 300 K highlights the non-exponential feature of the decay and shows the rise time (Fig. 11).
Luminescence lifetimes are obtained by fitting the decay profiles with a triple exponential function. The derived time constants from the fit are reported in Table 6. The lifetimes are found to be longer than those reported in the literature, lying in the μs time range. Time constants of the same order are reported for the decay of triplet states of chromophores belonging to rhodamine family.39
| τ 1 (μs) | τ 2 (μs) | τ 3 (μs) | τ 4 (μs) | R 2 | |
|---|---|---|---|---|---|
| Powder | 1.04 (±0.02) | 7.86 (± 0.01) | 45.77 (± 0.05) | 0.66 (± 0.01) | 0.9989 |
| Film Si-40 | 15.01 (± 0.08) | 98.74 (± 0.09) | 0.9900 |
According to the literature,39 the shorter lifetime constant τ1 is attributed to the triplet excited state (T1) in aggregated forms of SRB molecules, and the longer lifetime constant τ2 to that of T1 monomer SRB molecules.
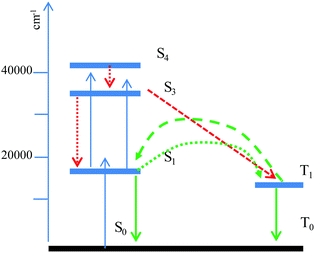
A lifetime constant longer than those reported in the literature is explained by the luminescence de-excitation mechanism occurring in the solid state powder. Indeed, lifetimes in the μs range may be the result of a delayed fluorescence phenomenon (Fig. 12). Following excitation at 400 nm, the S1 level is populated, as is the S3 level, by a two-photon phenomenon (which is possible due to the identical energy gaps between the S0–S1 and S1–S3 levels). There follows a non-radiative de-excitation towards the triplet level which will emit and also transfer part of its energy towards the S1 level, which will then emit in its turn but with a much longer lifetime. The rise time in this mechanism (τ4) is attributed to the reverse inter system crossing T1→S1 energy transfer.
As illustrated in Fig. 13 and Table 7, the decay profile of the Si-40 composite film is slightly different from that of the powder. Although the rise time τ4 of the LDH powder and the composite film is similar, the τ2 and τ3 time constants are longer, indeed about ten times longer, when the powder is dispersed in the silicone film. In addition, the constant τ1, which we had attributed to SRB aggregates37 in the LDH–DS/SRB-5 powder, disappears. This underlines that film processing leads to a disagglomeration of SRB molecules, as previously suggested but not demonstrated so far.20
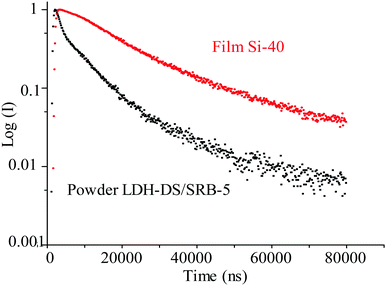 | ||
| Fig. 13 Luminescence decay of LDH–DS/SRB-5 powder and Si-40 composite film (λexc = 400 nm and λem = 604 nm). | ||
| τ 1 (ns) | A 1 | τ 2 (ns) | A 2 | R 2 | |
|---|---|---|---|---|---|
| a A i (i = 1 or 2) is the percentage of τii (+1 or 2). | |||||
| LDH–DS/SRB-5 | 0.42 | 0.12 | 5.04 | 1.07 | 0.9934 |
| ±0.02 | ±0.01 (10%) | ±0.08 | ±0.01 (90%) | ||
| Film Si-40 | 0.40 | 0.11 | 3.96 | 1.07 | 0.9948 |
| ±0.02 | ±0.01 (11%) | ±0.06 | ±0.01 (91%) | ||
To gain better insights into the characterization of the delayed fluorescence, the luminescence lifetimes were measured in the nanosecond time scale, thanks to use of a femtosecond titanium: sapphire laser. The laser duration in this case is short enough to directly measure the decay times of the prompt fluorescence arising from the singlet state S1. Results are reported in Table 7.
Bi-exponential decays are obtained and the derived time constants agree well with the values reported in the literature for SRB singlet state S1.21,38 The lifetime constant τ1 is attributed to the contribution of aggregated forms of SRB molecules and τ2, a longer lifetime, is attributed to SRB monomers. We also note that the time constants recorded for powder and film are of the same order of magnitude.
Referring to the work of Yan et al.,6 the long-time constant τ2 is associated with SRBs in the interlamellar space, while the short time constant τ1 is related to SRB adsorbed onto the LDH sheets. The contributions related to each of these constants are respectively for A1 (A1/A1 + A2) and A2 (A2/(A1 + A2)) of 90 and 10%. This result confirms the efficient intercalation of SRB molecules into the interlamellar space of the LDH sheets and agrees well with the usual surface-adsorption contribution of about 10% when considering a LDH inorganic scavenger.40
Conclusions
The coprecipitation method is an efficient method to synthesize a series of LDH–DS/SRB powders with interesting optical properties. Variations in the spectral distribution are strongly dependent on dye and spacer concentration. Furthermore, rather counter-intuitively when considering the nature of the «passive» spacer, its choice is important for the SRB dye to emit efficiently. Indeed, the chain length of the spacers composed of fatty sulfonate acids, from C8 to C18, significantly affects the PLQY of SRB, and an alkyl length of C12 is found to be the most suitable. This is also supported by simulations, where the interaction of the surfactant molecules within the interlayer space is modelled. It appears that a shorter alkyl chain results in a low hydrophobicity in the vicinity of the LDH platelets, making the medium more predisposed to the diffusion of the water molecules, which favours the possible migration of SRB molecules. For longer chains, a strong hydrophobic character is induced, forcing the SRB molecules to separate from the surfactant molecules and thus aggregating them. For the surfactant with an alkyl chain of C12, a compromise is reached between these different phenomena. When the LDH–DS/SRB powder is dispersed into silicone, a PL QYabs as high as 60% is reached for an excitation wavelength of 570 nm for a loading of 40 wt%.Furthermore, from the luminescence decay time investigated for powders as well as films, it is possible to propose a de-excitation mechanism for the luminescence occurring in the solid-state powder, where lifetimes in the μs range may result from a delayed fluorescence phenomenon where the singlet and triplet levels are involved. The rise time for this mechanism (τ4) is attributed to the reverse inter system crossing T1 → S1 energy transfer.
The optical properties are highly dependent on the entire composition of the “composite” LDH-spacer/SRB powder, and interestingly, not only from the chromophore relative content but also from its accommodation, these are found to be finely tunable by adjusting the hydrophilic/hydrophobic balance in a series of “passive” surfactants.
Conflicts of interest
There are no conflicts to declare.Acknowledgements
This work was supported by CPER DEFI MMASYF through its 2016 «MetaProfile» project. The authors would therefore like to thank the European Union, within the framework of the European Regional Development Fund (ERDF), and the Région Auvergne Rhône-Alpes, which co-funded this project.Notes and references
- S. Das and J. Manam, Opt. Mater., 2018, 79, 259–263 CrossRef CAS.
- C. Zhou and H. Li, New J. Chem., 2019, 43(22), 8439–8443 RSC.
- T. Kajiwara, R. W. Chambers and D. R. Kearns, Chem. Phys. Lett., 1973, 22(1), 37–40 CrossRef CAS.
- N. Tamai, T. Yamazaki and I. Yamazaki, Chem. Phys. Lett., 1988, 147(1), 25–29 CrossRef CAS.
- R. F. Kubin and A. N. Fletcher, J. Lumin., 1982, 27(4), 455–462 CrossRef.
- R. W. Ramette and E. B. Sandell, J. Am. Chem. Soc., 1956, 78(19), 4872–4878 CrossRef CAS.
- Y. P. Keepers, P. E. Pizao, G. J. Peters, J. van Ark-Otte, B. Winograd and H. M. Pinedo, Eur. J. Cancer Clin. Oncol., 1991, 27(7), 897–900 CrossRef CAS.
- K. T. Papazisis, G. D. Geromichalos, K. A. Dimitriadis and A. H. Kortsaris, J. Immunol. Methods, 1997, 208(2), 151–158 CrossRef CAS PubMed.
- A. Van Tonder, A. M. Joubert and A. Duncan Cromarty, BMC Res. Notes, 2015, 47, 1–10 Search PubMed.
- V. Vichai and K. Kirtikara, Nat. Protoc., 2006, 1, 1112–1116 CrossRef CAS PubMed.
- R. Raji and K. G. Gopchandran, J. Phys. Chem. Solids, 2018, 113, 39–49 CrossRef CAS.
- T. Suzuki, T. Sato, J. Zhang, M. Kanao, M. Higuchi and H. Maki, J. Mater. Chem. C, 2016, 4, 1594–1598 RSC.
- E. Polat Baris, S. Lin, J. D. Mendenhall, B. Van Veller, R. Langer and Dl. Blankschtein, J. Phys. Chem. B, 2011, 115(6), 1394–1402 CrossRef CAS PubMed.
- M. Wittmann and A. Penzkofer, Chem. Phys., 1993, 172(2), 339–348 CrossRef CAS.
- P. Legentil, F. Leroux, S. Therias, R. Mahiou and G. Chadeyron, J. Lumin., 2019, 215, 116634–116646 CrossRef CAS.
- P. Legentil, G. Chadeyron, S. Therias, N. Chopin, D. Sirbu, F. Suzenet and F. Leroux, Appl. Clay Sci., 2020, 189, 105561–105567 CrossRef CAS.
- U. Costantino, N. Coletti, M. Nocchetti, G. G. Aloisi and F. Elisei, Langmuir, 1999, 15, 4454–4460 CrossRef CAS.
- U. Costantino, N. Coletti, M. Nocchetti, G. G. Aloisi, F. Elisei and L. Latterini, Langmuir, 2000, 16, 10351–10358 CrossRef CAS.
- L. Latterini, F. Elisei, G. G. Aloisi, U. Costantino and M. Nocchetti, Phys. Chem. Chem. Phys., 2002, 4, 2792–2798 RSC.
- P. Legentil, F. Leroux, S. Therias, D. Boyer and G. Chadeyron, J. Mater. Chem. C, 2020, 8, 11906–11915 RSC.
- D. Yan, J. Lu, M. Wei, D. G. Evans and X. Duan, J. Phys. Chem. B, 2009, 113, 1381–1388 CrossRef CAS PubMed.
- R. Valleix, Q. Zhang, D. Boyer, P. Boutinaud, G. Chadeyron, Y. Feng, H. Okuno, H. Hintze-Bruening and F. Leroux, Adv. Mater., 2021, 33, 2103411 CrossRef CAS PubMed.
- H. Uoyama, K. Goushi, K. Shizu, H. Nomura and C. Adachi, Nature, 2012, 492, 234–242 CrossRef CAS PubMed.
- H. Tanaka, K. Shizu, H. Nakanotani and C. Adachi, Chem. Mater., 2013, 25, 3766–3771 CrossRef CAS.
- X. Xiong, F. Song, S. Sun, J. Fan and X. Peng, Asian J. Org. Chem., 2013, 2, 145–149 CrossRef CAS.
- A. D. MacKerell, N. Banavali and N. Foloppe, Biopolymers, 2001, 56(4), 257–265 CrossRef.
- J. C. Phillips, D. J. Hardy, J. D. C. Maia, J. E. Stone, J. V. Ribeiro, R. C. Bernardi, R. Buch, G. Fiorin, J. Henin, W. Jiang, R. McGreevy, M. C. R. Melo, B. K. Radak, R. D. Skeel, A. Singharoy, Y. Wang, B. Roux, A. Aksimentiev, Z. Luthey-Schulten, L. V. Kale, K. Schulten, C. Chipot and E. Tajkhorshid, J. Chem. Phys., 2020, 153(4), 044130 CrossRef CAS PubMed.
- H. Zhang, S. Yuan, J. Sun, J. Liu, H. Li, N. Dua and W. Hou, J. Colloid Interface Sci., 2017, 506, 227–235 CrossRef CAS PubMed.
- L. Martínez, R. Andrade, E. G. Birgin and J. M. Martínez, J. Comput. Chem., 2009, 30(13), 2157–2164 CrossRef PubMed.
- W. Humphrey, A. Dalke and K. Schulten, J. Mol. Graphics, 1996, 14, 33–38 CrossRef CAS PubMed.
- M. Ogawa and K. Kuroda, Chem. Rev., 1995, 95, 399–438 CrossRef CAS.
- F. Leroux, A. Dalod, M. Hennous, L. Sisti, G. Totaro, A. Celli, C. Coehlo and V. Verney, Appl. Clay Sci., 2014, 100, 102–111 CrossRef CAS.
- B. E. Polat, S. Lin, J. D. Mendenhall, B. VanVeller, R. Langer and D. Blankschtein, J. Phys. Chem. B, 2011, 115(6), 1394–1402 CrossRef CAS PubMed.
- M. N. Berberan-Santos and J. M. M. Garcia, J. Am. Chem. Soc., 1996, 118, 9391–9394 CrossRef CAS.
- J. C. Deaton, S. C. Switalski, D. Y. Kondakov, R. H. Young, T. D. Pawlik, D. J. Giesen, S. B. Harkins, A. J. M. Miller, S. F. Mickenberg and J. C. Peters, J. Am. Chem. Soc., 2010, 132, 9499–9508 CrossRef CAS PubMed.
- M. Rifani, Y. Y. Yin, D. S. Elliott, M. J. Jay, S.-H. Jang, M. P. Kelley, L. Bastin and B. Kahr, J. Am. Chem. Soc., 1995, 17, 7572–7573 CrossRef.
- K. Ray and H. Nakahara, J. Phys. Chem. B, 2002, 106, 92–100 CrossRef CAS.
- V. Thangaraj, J. Bussiere, J.-M. Janot, M. Bechelany, M. Jaber, S. Subramanian, P. Miele and S. Balme, Eur. J. Inorg. Chem., 2016, 2125–2130 CrossRef CAS.
- X. Cui, J. Zhao, Z. Lou, S. Li, H. Wu and K.-l. Han, J. Org. Chem., 2015, 80, 568–581 CrossRef CAS PubMed.
- K. Nava-Andrade, G. G. Carbajal-Arizaga, S. Obregon and V. Rodriguez-Gonzalez, J. Environ. Manage., 2020, 288, 112399–112417 CrossRef PubMed.
| This journal is © The Royal Society of Chemistry 2022 |

