 Open Access Article
Creative Commons Attribution 3.0 Unported Licence
How UV light lowers the conductivity of SrTiO3 by photochemical water splitting at elevated temperature
Alexander
Viernstein
*a,
Markus
Kubicek
 *a,
Maximilian
Morgenbesser
a,
Tobias M.
Huber
 a,
Matthäus
Siebenhofer
 ab and
Jürgen
Fleig
 a
a
aInstitute of Chemical Technologies and Analytics, TU Wien Getreidemarkt 9 164/EC, 1060 Vienna, Austria. E-mail: markus.kubicek@tuwien.ac.at
bCentre of Electrochemical Surface Technology GmbH, Viktor-Kaplan-Straße 2, 2700 Wiener Neustadt, Austria
First published on 7th February 2022
Abstract
Nominally undoped SrTiO3 single crystals were illuminated by UV light at 350 °C in oxidizing as well as reducing atmospheres. In N2/O2 atmospheres, UV irradiation enhances the conductivity of SrTiO3 by several orders of magnitude. In dry H2 atmosphere UV exposure leads to the opposite conductivity effect, i.e., above band gap energy illumination surprisingly lowers the conductivity. This is discussed in the framework of a defect chemical model. We show that a shift in defect concentrations due to UV-driven oxygen incorporation from the gas phase into the oxide is the main cause of the measured conductivity changes. A model is introduced to illustrate the thermodynamic and kinetic drivers of the processes under UV irradiation. Noteably, in reducing H2/H2O atmospheres, the incorporation of oxygen into the investigated oxide under UV light takes place via water splitting. Owing to the predominant electron conduction of SrTiO3 in equilibrium with H2, oxygen incorporation upon UV and thus an increase of the oxygen chemical potential leads to a decrease of the majority electronic charge carrier, here electrons, which lowers the conductivity under UV irradiation.
Introduction
In recent years, the properties of the model perovskite SrTiO31–6 upon above band gap light exposure at elevated temperatures came into the focus of research. Several different phenomena were observed and described, such as UV-induced changes of the oxygen exchange kinetics,7 light induced battery type voltages in solid oxide cells,8 varying photovoltages in SrTiO3 based high temperature solar cells,9 high temperature photochromism,10 and conductivity variations under UV illumination.8,11,12 Many of these observations can be explained by assuming a light driven oxygen incorporation into SrTiO3 and an increase of the oxygen chemical potential in the entire SrTiO3 bulk.10 However, in literature also the formation of oxygen vacancies as a consequence of UV illumination is described.12 Even though different UV-driven defect chemical consequences are not necessarily in contradiction to each other, questions about the factors determining the defect chemical situation under UV irradiation arise from the mentioned findings. Thus, experiments in a large pO2 range are of high interest.In this contribution, we show the effect of UV light on the conductivity of undoped SrTiO3 single crystals for four different gas atmospheres with very different oxygen partial pressures (air, N2 with some residual oxygen, and dry or humidified H2) with special emphasis on measurements under reducing conductions. The results are compared with the defect chemical predictions of a recently developed defect chemical model of the same type of SrTiO3 single crystals.13 In dry H2, measurements reveal that UV light lowers the bulk conductivity of SrTiO3, which is extraordinary, due to the unavoidable contributions of photoconductivity. It indicates that oxygen is driven into the crystal under UV irradiation even in H2/H2O atmosphere. There, however, the oxygen to be incorporated stems from water molecules and the measured conductivity is inseparably connected to UV-induced water splitting at elevated temperature, namely 350 °C.
Experimental
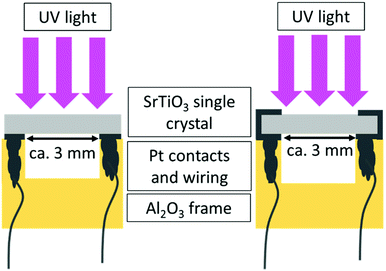
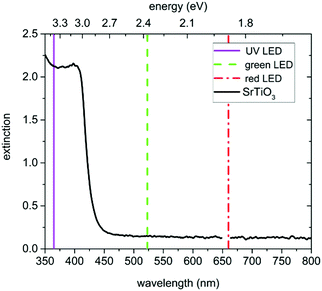
In this study undoped (001) oriented SrTiO3 single crystals (5 × 5 × 0.5 mm3, CrysTec GmbH, Germany) which are indeed slightly p-type due to cation vacancies from growth were used. A detailed investigation on the same batch of single crystals revealed that both charge-neutral defects as well as defect-chemically relevant defects acting as acceptor, donor, or electron/hole trap states are present. The most important charge-neutral defects found were Ca(Sr) (<47 ppm), Ba(Sr) (1.8 ± 0.2 ppm), the most important charged defect were cation vacancies, most probably Ti-vacancies (6 ppm), additionally Al(Ti) (<0.2 ppm), and another yet unidentified (most probably associate-type) defect in similar sub-ppm concentration as Al(Ti) were found.13 In order to prepare the specimens for the in-plane impedance measurements, they were cleaned with ethanol in an ultrasonic bath, subsequently they were annealed for 12 h at 900 °C in air to reduce surface defects and afterwards cleaned again as above. Then, the samples were equilibrated at 700 °C either in air, N2 (containing approx. 70 ppm O2), humidified H2, or dry H2. The strongly reducing atmospheres containing H2 were established using commercially available gas mixtures of Ar and 2% of H2 (Messer, Germany). For humidification, the gas was passed through double-distilled water at room temperature. After annealing, the temperature was lowered to the actual measurement temperature of 350 °C while keeping the atmosphere, and the single crystals were again equilibrated at least for 12 h. Owing to this comparatively low temperature some deviations from equilibrium defect concentrations at 350 °C might still be present. Then the actual electrical measurements were performed.The conductivity before, under and after UV illumination was measured by impedance spectroscopy in an in-plane electrode geometry using Pt paste electrodes applied either only on the back side or on both the back and the front side of the samples (see Fig. 1). For comparison, also illumination by green and red light was performed. A flame polished quartz rod acted as light guide for the UV (365 nm), green (523 nm), and red (660 nm) light emitted by high performance LEDs (LED Engin, USA). The irradiation of SrTiO3 with UV light causes the excitation of electrons from the valence band to the conduction band and consequently leads to the formation of electron–hole pairs. Green and red light are not absorbed by SrTiO3 (compare absorption spectrum in Fig. 2) at 350 °C.
In-plane impedance spectra were recorded at 350 °C and between 1 MHz and 1 Hz using Alpha-A High Performance Analyzers (Novocontrol Technologies, Germany).
Results
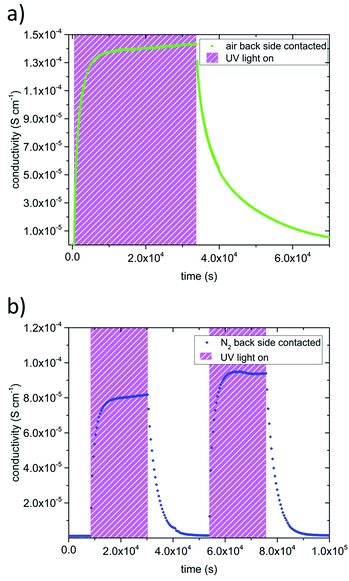
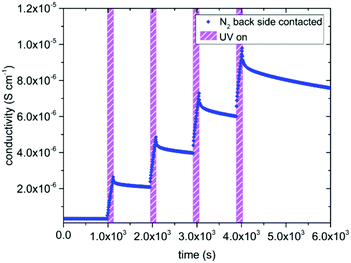
The in-plane conductivities of undoped SrTiO3 single crystals were deduced from the impedance spectra measured before, under, and after UV illumination. In air as well as in N2 we found a dominating high frequency arc (representing the bulk resistance and geometrical capacitance) and some low frequency features due to the electrodes.6,11,14–16 In dry and humidified H2, only one almost ideal semicircle was obtained in the investigated frequency range. Based on their capacitance values the dominating arcs can be attributed to SrTiO3 bulk and were fitted to a resistor in parallel to a constant phase element using Zview (Scribner Associated Inc.). In-plane sample conductivities were derived from the resistance assuming 1D current flow (length approx. 3 mm) and thus neglecting edge effects due to the exact electrode geometry.Fig. 3 displays results of measurement cycles in air and N2 during which the specimens were illuminated by UV light for several hours. The results are very similar, with drastic conductivity increases (up to more than two orders of magnitude) under UV irradiation on a time scale of about an hour. However, the maximum conductivities were lower in N2 than in air. The conductivity remained very high right after the UV light was switched off and then slowly relaxed on the time scales of several hours. The relaxation was slower in air than in N2. These extended relaxation time scales also led to the phenomenon that the conductivity could be driven up to higher values by subsequent short illumination periods (136 s) and longer dark times (832 s) as shown for N2 in Fig. 4. Before UV irradiation, an in-plane conductivity of 3.3 × 10⁻⁷ S cm−1 was measured and driven up to 2.6 × 10⁻⁶ S cm−1 during the first illumination period. This increase was followed by a minimal conductivity decrease to 2.1 × 10⁻⁶ S cm−1 after the UV source was turned off for the first time. Finally, after the fourth and last UV irradiation of SrTiO3, its conductivity reached almost 10−5 S cm−1, which is in total a conductivity increase by a factor of nearly 30. Irradiation with red or green light led only to a very minor conductivity increase, probably due to a small temperature increase when the light was absorbed by the Pt paste and/or corundum frame.
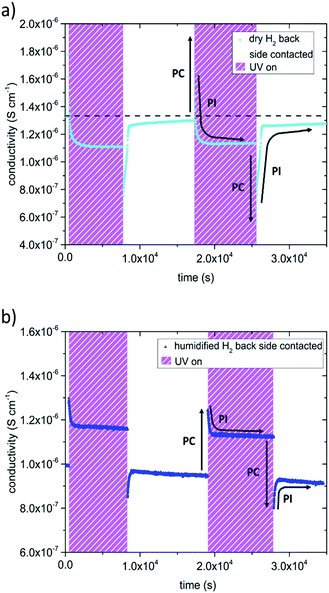
In dry and humidified H2 at 350 °C the SrTiO3 sample is in the electron conducting regime.13 UV induced effects are still present but several differences were found compared to the studies in O2 containing gases (Fig. 5): (i) UV induced effects took place much faster. (ii) They were much less pronounced. (iii) UV may not only increase but also decrease the conductivity. More specific, the in-plane conductivity of a back side contacted SrTiO3 single crystal instantly jumped from 1.3 × 10⁻⁶ S cm−1 to 1.8 × 10⁻⁶ S cm−1 in the first and 2.0 × 10⁻⁶ S cm−1 in the second cycle (cyan triangle Fig. 5a) after the UV light was turned on. It is discussed in more detail below that the instant effect was caused by additional photoconductivity due to electron–hole formation upon UV. This increase became counter-balanced by a moderately fast decrease of the conductivity within a few 100 s until a reproducible plateau at 1.1 × 10⁻⁶ S cm−1 was established, which was approx. 15% below the original conductivity. After switching the UV light off, the conductivity dropped to 4.9 × 10⁻⁷ S cm−1 and to 5.6 × 10⁻⁷ S cm−1, respectively, i.e. less than 50% of the original value, due to the loss of photoconductivity. This immediate decline was followed by a conductivity increase within a few 100 s and finally nearly the initial value before illumination was again reached. Thus, two processes namely the fast-evolving photoconductivity (PC) and a slower photo-ionic (PI) process determined the evolution of the sample conductivity under reducing conditions. A detailed discussion of the photo-ionic effects affecting the entire sample is given below.
A very similar picture resulted for the experiments on back side contacted specimens conducted in humidified H2 atmosphere (compare Fig. 5b). Since the pO2 was three to four orders of magnitude higher compared to dry H2, the initial conductivity of the electron conducting SrTiO3 was lower, and changes were not as distinct. The measurements started at a conductivity of 9.9 × 10⁻⁷ S cm−1, when UV light was turned on it peaked at 1.3 × 10⁻⁶ S cm−1 (1.2 × 10⁻⁶ S cm−1 respectively), and finally reached 1.2 × 10⁻⁶ S cm−1 (1.1 × 10⁻⁶ S cm−1) under UV illumination. After switching the UV light off, the conductivity dropped to 8.5 × 10⁻⁷ S cm−1 (8.0 × 10⁻⁷ S cm−1) and then relaxed to approximately the initial value.
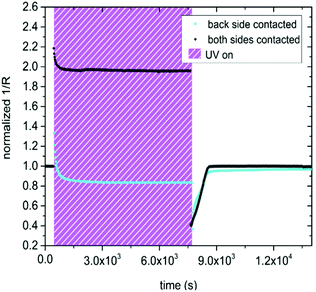
In the following the differences between only back side and both-side contacted samples are shown. Here we consider the inverse resistance (1/R = conductance) of both measurement configurations and for the sake of comparability, the curves were normalized to the initial 1/R values before UV illumination. This eliminates differences in the electrode geometry, defect chemistry due to slow pre-equilibration or atmosphere and temperature.
Contacting the sample on both the front and the back side, led to a substantial change in the observed effect of UV exposure, compared to specimens contacted only on the back side, see Fig. 6. Due to photoconductivity, the inverse resistance of a both-side contacted SrTiO3 single crystal immediately jumped up after UV light was turned on. The jump was much more pronounced for the both-side contacted sample (by a factor of 2.2) compared to the only back side contacted SrTiO3 specimen (by a factor of 1.3). In contrast to the results shown in Fig. 5a the inverse resistance remained far above the initial value for contacts on both sides, and only a small decline by approx. 11% compared to the inverse resistance maximum was detectable. After the UV light was switched off, the inverse resistance of the both-side contacted specimen drastically dropped to approx. 40% of the initial value (PC) and finally relaxed back to the amount obtained before UV irradiation (PI), in accordance with the only back side contacted sample. Also, both specimens seem to exhibit very similar time constants, since the conductivity plateau under UV irradiation as well as the relaxation to the initial value after UV illumination were established nearly after the same time. This suggest that the fast photoconductivity effects were different, while the slower photo-ionic effects were the same. This is not surprising since PC effects take place primarily in the absorption zone close to the surface.
Discussion
Quantitative comparison with the defect chemical model of undoped SrTiO3
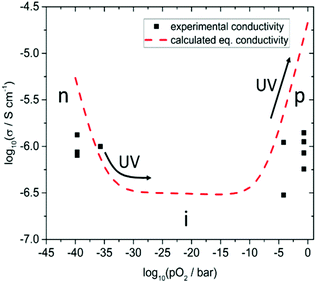
In the following, we discuss the UV light induced changes found in nominally undoped SrTiO3 in more detail. To do so, we start with the conductivity values measured in dark for the different atmospheres. Fig. 7 shows several experimental results (black squares) of various in-plane conductivity measurements obtained in the four described atmospheres at 350 °C before UV illumination.These data are compared with calculated conductivities derived from a detailed defect chemical model recently established for such undoped SrTiO3 single crystals. Among others, the defect model is based on impedance measurements in a wide pO2 range between 500 and 700 °C.13 At these temperatures an equilibration with the gas phase takes place on a reasonable time scale and thus it was possible to extract equilibrium conductivities and chemical capacitances, which both lay the foundation of an extended defect model.13 Essentially, it was shown that cation vacancies, most probably approx. 6 ppm Ti vacancies cause a slight p-type doping in the considered nominally undoped SrTiO3 single crystals. From this data set, we can also predict the equilibrium conductivities for other pO2 and temperatures. For 350 °C we found that hole conductivity dominates above a pO2 of approx. 10−8 bar, electron conduction below 10−32 bar and in between a broad range with constant ionic conductivity due to the oxygen vacancies balancing the acceptor doping, see Fig. 7.
While the conductivity determined in humidified H2 fits excellently to the prediction, measured values are somewhat too small in dry H2, air, and N2. Moreover, those values differ from experiment to experiment, i.e. they depend on the exact prehistory, indicating that equilibrium with the gas phase is hardly well-established at 350 °C, despite all specimens were first annealed at 700 °C and subsequently equilibrated for several hours at 350 °C in the respective atmosphere. This is in accordance with the statements that in SrTiO3 oxygen surface exchange reactions are slow or even frozen-in at lower temperatures.17,18 Many days or even weeks might have been required for complete equilibration. Equilibrium values, however, seem to be reached in humidified H2 at 350 °C, suggesting that the corresponding gas exchange reaction
 | (1) |
Attributing the UV driven conductivity changes to processes in SrTiO3
The time scales on which the conductivity changes under UV irradiation in all four atmospheres are by far too large to be only caused by photoconductivity, e.g. by the formation or recombination of electron–holes in the illuminated zone of the SrTiO3 single crystal. In Cr-doped SrTiO3 such recombination processes take place mostly within approx. 9 μs at room temperature.19 We assume similar time constants in undoped SrTiO3. Furthermore, the used UV light is mostly absorbed approx. within the first few μm.9,20 Thus, the in-plane conductivity changes of all samples cannot be explained by photoconductivity. This is true for the drastic increases of back side contacted specimens by more than (nearly) two orders of magnitude in air (N2), and also for the (somewhat faster) decrease of the conductivity in dry hydrogen. In these cases, the whole bulk has to be affected by the UV illumination via changes of its defect chemistry.In a detailed earlier study on Fe-doped SrTiO3, it was already shown that UV-driven oxygen incorporation into the entire bulk is responsible for severe long-term conductivity changes in air.10 A main reason is the acceleration of oxygen incorporation kinetics into SrTiO3 under UV light.7 The same conclusion was also drawn to explain UV induced voltage measured in an electrochemical cell consisting of undoped SrTiO3/yttria-stabilized-zirconia/Pt in air under UV.8 Accordingly, UV-induced oxygen stoichiometry changes in the entire bulk of SrTiO3 are assumed to be the reason also for the large conductivity increase in air and N2. Below, we discuss in more detail that the same effect is responsible for the conductivity decrease measured here in dry H2. In this discussion, key question to be addressed is whether the chemical potential of oxygen in the bulk of SrTiO3 increases or decreases under UV illumination. Here, Fig. 7 gives a clear indication for the measurements in air and N2 only an increase of the oxygen chemical potential can explain the huge increase of conductivity found in our studies. In air, a nominal pO2 increase of up to about seven orders of magnitude is found, which is also in accordance with electrochemical (battery-type) voltages measured on similar crystals with an ion-conducting bottom layer.8 Oxygen is driven into the samples and by filling oxygen vacancies holes are formed, which increase the conductivity in the entire bulk.5,21–24 The time dependence is governed by the oxygen chemical diffusion coefficient as shown in ref. 10 and as also will be detailed for undoped SrTiO3 in a forthcoming paper.
In the following, we concentrate on the remarkable fact that UV irradiation of SrTiO3 single crystals leads to a reduced in-plane conductivity in dry H2. As already mentioned above, the instant conductivity increase (decrease) observed in H2 when the UV light was turned on (off) are largely due to photo-conductivity (PC). It is manifest to assume that the slower change to lower values upon UV (PI), seen in H2, is the eqivalent to what we also see in air and N2, namely the change of the conductivity due to an oxygen stoichiometry changes in the bulk. From the conductivity vs. pO2 curve in Fig. 7 we can thus again conclude whether oxygen incorporation or oxygen release takes place under UV. Since at such low pO2 SrTiO3 is a n-type semiconductor only the filling of oxygen vacancies and the formation of holes (i.e. annihilation of electrons) can explain the observed lowered conductivity. Hence, like in air and N2, also in H2 UV pumps the crystal to a higher oxygen chemical potential. When the UV illumination stops, an instant drop of the conductivity occurs (PC) and only the photo-ionically decreased bulk conductivity determines the impedance of the specimen which then slowly relaxes by oxygen release. The decrease of the conductivity in H2 due to UV-triggered oxygen incorporation is much less pronounced than the increase measured in air. This can be easily understood from Fig. 7: the conductivity cannot drop beneath the ionic conductivity plateau. Most probably this plateau was reached in our experiments, and we cannot estimate the effective pO2 change in SrTiO3 from the measured conductivity.
This interpretation is also supported by the second measurement mode, i.e. with single crystals being contacted on both the illuminated front and the dark back side. Here the fast increase of the inverse resistance right after the UV light was turned on was more pronounced and the slow decrease of the inverse resistance under UV illumination was by far smaller than if the specimens were only contacted on the back side (see Fig. 6). However, shortly after the UV irradiation the inverse resistance reached approx. 40% of the initial value in both experimental configurations. This is in perfect accordance with our interpretation of a thin top surface region where the UV light is absorbed, and where the conductivity is strongly enhanced due to the photo generation of charge carriers. Below this zone the bulk conductivity is decreased due to a change in the oxygen content/chemical potential. Large parts of the bulk seem to be involved since otherwise an effective conductivity (or conductance) decrease of the entire sample can hardly be explained from the given conductivity pO2 diagram. Thus, when electrodes are placed on the illuminated front side, the UV absorption zone becomes more decisive for the overall in-plane resistance (or conductance) of the investigated sample. In the following section we estimate the current density and the potential distribution in the two regions using finite element calculations.
The question remains, where the incorporated oxygen comes from when SrTiO3 single crystals are under UV illumination in strongly reducing H2 containing atmosphere. The oxygen stems from water, i.e. we face water splitting under UV light and thus hydrogen production rather than oxygen reduction. Accordingly, we suggest that UV illumination of SrTiO3 in H2 enhances the water splitting rate (including the corresponding oxygen incorporation into SrTiO3) without enhancing the reverse reaction in the same manner. This UV effect is not surprising since SrTiO3 is a well-known photocatalyst for water splitting.25–28
Conductivity analysis and current distribution
In accordance with our model introduced in the last section, we estimated the conductivity of the bulk before UV illumination, the photoconductivity in the first μm of the illuminated specimen, and the decreased bulk conductivity under UV light for a SrTiO3 single crystal contacted on both the front and the back side. To do so, a parallel circuit was considered consisting of two resistors representing the bulk (Rbulk) and the UV absorption region (Rsurf). We assume that the bulk does not change significantly during the first five to ten seconds of UV exposure. From the impedance of the first data point (RUV) after the UV light was switched on and the in-plane resistance before UV irradiation (Rbulk,dark), the resistance of the thin UV region (Rsurf) can be calculated. According to | (2) |
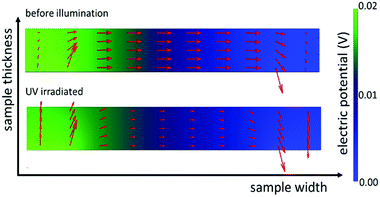
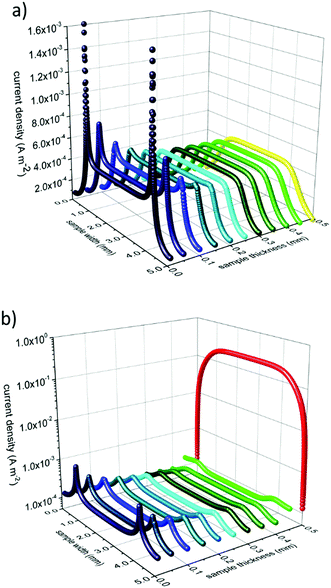
Subsequently we used these numbers to perform finite element simulations (compare Fig. 8). Assuming an applied voltage of 0.02 V between the two electrodes at the back side of the sample the potential distribution and current flow in the bulk before and during UV illumination can be calculated. Before illumination, the current density between the two electrodes is nearly uniformly distributed over the whole thickness of the sample. During UV irradiation the current density is decreased in the dark bulk and strongly increased (by more than three orders of magnitude) in the UV region (see Fig. 9).
These simulations graphically show the impact of the formation of a zone with an enhanced photoconductivity and of a bulk region exhibiting a lower conductivity due to oxygen incorporation and diffusion. Additionally, it becomes more evident that the differing experimental results in Fig. 6 are caused by the differences in the measurement configurations and support our interpretation.
Quantitative analysis of the time dependency of the conductivity changes
The time dependent changes of undoped SrTiO3 in air upon UV can be described by the equation known from diffusion-limited conductivity relaxation and we can derive a chemical diffusion coefficient of 6.3 × 10⁻⁷ cm2 s−1 More details on this analysis, including temperature dependences will be given in a forthcoming paper. Here, we concentrate on the conductivities measured in nitrogen and hydrogen. Those time dependent conductivity changes under UV are better described by a conductivity relaxation model with surface limitation, i.e. by the eqn (3).29–31 | (3) |
A constant oxygen chemical exchange coefficient kchem is still assumed despite the large chemical potential changes considered here. The symbol σ(0) denotes the initial conductivity, σ(∞) the final conductivity, a is the sample thickness, and t the time of UV illumination.
Applying eqn (3) to our measurement data for N2 with some impurity O2 leads to a surface exchange coefficient of 2.7 × 10⁻⁵ cm s−1 for the oxygen incorporation under UV at 350 °C. The normalized data and fit are displayed in Fig. 10a. Without over-interpreting the fit, we can still state that such a transition of oxygen incorporation during UV illumination from diffusion limitation in air to surface limitation in N2 is in accordance with the fact of having much less oxygen available in the N2 gas phase. A lower limit of the oxygen diffusion coefficient can also be estimated since for an oxygen surface exchange limitation the oxygen chemical diffusion coefficient has to exceed at least kchem × a × 10, here approx. DδO > 1.4 × 10⁻⁵ cm2 s−1. The relaxation of the conductivity after UV irradiation in N2 (and O2) is considerably slower than the conductivity enhancement under UV light, since the latter is based on oxygen incorporation which is accelerated by light. This is also in good agreement with kinetic studies on Fe-doped SrTiO3 upon UV illumination.7
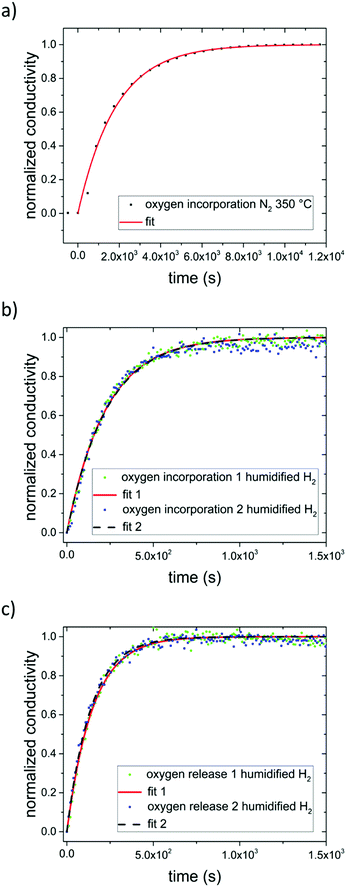 | ||
| Fig. 10 Normalized conductivity of SrTiO3 in N2 (a) and humidified H2 (b) at 350 °C under UV illumination. Fit to eqn (3) are represented by either a solid red line or a dashed black line. (c) Normalized conductivity of SrTiO3 after UV light was turned off in humidified H2 at 350 °C. Eqn (4) was used for fitting the experimental data. | ||
In dry or humidified H2 atmosphere, however, the conductivity relaxation after UV irradiation is on a similar time scale of approx. 900 s (dry H2), or 600 s (humidified H2) respectively, as the changes under UV. Thus, the oxygen incorporation under UV irradiation and the oxygen release after UV are both limited either by diffusion or by the surface exchange kinetics are much faster than in air.29–33 At 350 °C in humidified H2 the fits using eqn (3) match the experimental data (see Fig. 10b). Hence, we suggest oxygen incorporation is limited by the surface reaction. A surface exchange coefficient kchem of 2.2 × 10⁻⁴ cm s−1 was obtained which is about one order of magnitude higher than in N2. Using the same approximation as before DδO thus has to be at least 1.1 × 10⁻⁴ cm2 s−1. This is higher than the equilibrium diffusion coefficient of 9.4 × 10⁻⁶ cm2 s−1 predicted by our defect chemistry model of undoped SrTiO3 in humidified H2 and at 350 °C. This is only plausible, if UV irradiation leads to an increase of the oxygen chemical potential and effective pO2 respectively (compare Fig. 7) since this also enhances DδO.24 For example, the defect chemical model suggests 1.5 × 10⁻⁴ at 10−25 bar pO2.13
In order to describe the oxygen release after the UV light was turned off, eqn (3) has to be slightly modified, since now both the front and the back side are to be considered in the process. Therefore, eqn (4) is introduced:
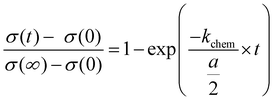 | (4) |
The fits (Fig. 10c) led to kchem values of 1.7 × 10⁻⁴ and 1.8 × 10⁻⁴ cm s−1. This indicate that UV illumination alters the oxygen incorporation in humidified H2 only slightly.
Neither a model assuming diffusion or exchange limitation, nor a mixed regime model were able to describe the experimental data obtained from specimens contacted on both the front and back side properly. We suggest that the additional Pt coverage and the extended three phase boundary (SrTiO3/Pt/H2 atmosphere) may change in the oxygen exchange kinetics10,34 and thus also the diffusion profiles.10
Model of the chemical processes under and after UV irradiation
Finally, we utilize all the consideration made to this point and introduce a model describing the defect chemical changes in SrTiO3 under and after UV illumination in a strongly reducing atmosphere (electrons are the major electronic charge carrier) at elevated temperatures. As SrTiO3 is a mixed conductor, it will adapt to the atmosphere via the oxygen chemical potential μO. In the gas phase, μO is varying with partial pressure and temperature according to eqn (5). | (5) |
Even though there is no neutral oxygen present inside a mixed conducting oxide, the quantity μO can still be defined/calculated inside the material. The following equations show the different possible ways of calculating μO using either the chemical potentials of oxygen ions or oxygen vacancies and those of either electrons (eqn (6)) or holes (eqn (7)).35–37
 | (6) |
 | (7) |
In equilibrium, the rates for oxygen incorporation and oxygen release are balanced, additionally the electronic chemical potentials for electrons and holes are linked (via the Fermi-level). Importantly, also the oxygen chemical potential μO is the same inside SrTiO3 and in the gas phase (compare Fig. 11a). This equalization of μO is the thermodynamic driving force behind the dependence of the oxygen nonstoichiometry of mixed conducting oxides on temperature and oxygen partial pressure.
When UV light is switched on, electron–hole pairs form inside the ∼3.2 eV bandgap semiconductor SrTiO3 thus splitting the Fermi-level into two electronic quasi-Fermi-levels for the now increased concentration of both electrons and holes – as is an established model for semiconductors.38–40 The same double increase of species alongside splitting into quasi chemical potentials is not possible for the ionic species (oxygen ions and oxygen vacancies) as their number is fixed by the lattice sites (3 per formula unit in ABO3 perovskites). Therefore, under illumination, the ionic chemical potentials in eqn (6) and (7) remain the same, but the electronic chemical potentials split. Consequently, also the values for μO split into different values in the illuminated zone of the SrTiO3 when either electrons (eqn (6)) or holes (eqn (7)) are considered.
This generates contradicting driving forces for oxygen exchange at the surface and for oxygen diffusion between the illuminated zone and the bulk, where SrTiO3 at first has the same μO value as the gas phase. As obviously no unified thermodynamic equilibrium can be established anymore, the kinetics of the respective reactions determine what steady state will be established and how. Two individual steady states are establishing at the surface (rates of oxygen incorporation vs. oxygen release) and at the transition from illuminated zone into the bulk (chemical diffusion of nominally neutral oxygen via combined diffusion of either oxygen vacancies plus electrons or oxygen vacancies plus holes).
Fig. 11 is a visualization of the kinetic situation that we encountered for undoped SrTiO3. As described above, it is only one possible steady state for an illuminated mixed conductor and one possible transient to reach it. Before illumination (Fig. 11a), SrTiO3 is in thermodynamic equilibrium with the atmosphere, and μO is equal in both phases, and eqn (5), (6), or eqn (7). Upon switching the UV light on, quasi-chemical potentials form in the illuminated zone for both electrons/holes as well as for μO,e and μO,h but the bulk is not affected yet (Fig. 11b). The hole-related oxygen chemical potential is higher than in the bulk and drives oxygen from the absorption zone into the bulk, while the electron related μO,e does the opposite. Empirically, we find an increased chemical potential in the bulk after UV and thus we suppose that the hole-related chemical diffusion coefficient is predominant in this “competition” (Fig. 11c). According to our measurements, we assume slow surface kinetics and fast diffusion, which leads to a temporary oxygen depletion in the UV absorption zone.
However, also oxygen incorporation (via water splitting) and oxygen release (via water formation from H2) are affected by UV due to the modified charge carrier concentrations. Oxygen incorporation rates due to water splitting are most probably enhanced by the additional photoelectrons in the conduction band and the same is true for oxygen evolution involving (photo)holes in the valence band. Empirically, we find a situation where under UV oxygen is continuously driven into the crystal. Hence, the electron related oxygen incorporation seems to be more accelerated by UV than the hole-related oxygen release (see Fig. 11b and c). The stronger enhanced electron related net incorporation flux (JO,e,in) warrants continuous oxygen supply to the UV zone and the bulk upon UV. Accordingly, the oxygen chemical potentials are successively pumped up inside SrTiO3. Finally, a steady state (not an equilibrium) is reached with equal diffusion fluxes and equal oxygen incorporation and evolution rates (Fig. 11d). The oxygen chemical potential in the bulk is increased by ΔμO compared to the chemical potential in the gas phase. When switching the UV light off, the oxygen quasi-chemical potentials vanish (Fig. 11f), and oxygen is slowly released back into the gas phase. ΔμO declines until equilibrium (μO,eq) is reached again. A very similar qualitative description results for bulk diffusion limitation.
Please note that oxygen exchange via the non-illuminated planes were ignored in this model (as they are considered slow at the given temperature). Additionally, space charge effects were neglected. They may indeed play a role and would complicate the picture, however space charge effects are typically mitigated under UV light by the large number of photo generated charge carriers.
Conclusion
Under strongly reducing H2-containing atmospheres UV irradiation of SrTiO3 led to a decrease in the in-plane conductivity at 350 °C. At the illuminated surface, an approx. 1 μm thick zone was established in which photoconductivity was two to three orders of magnitude higher than the bulk conductivity before UV irradiation. Nevertheless, in the remaining bulk the conductivity decreased gradually upon UV illumination, due to water splitting, subsequent oxygen incorporation and oxygen diffusion. The resulting effective pO2 increase lowered the n-type conductivity of SrTiO3. For back side contacted single crystals, the resulting effects of the bulk conductivity shift were simulated by finite element calculations. Oxygen incorporation under and oxygen release after UV illumination seem both limited by the surface exchange reactions in humidified H2 and did not differ much. A change in the measurement configuration, where electrodes were placed at both the illuminated front side and the dark back side, led to a more pronounced photoconductivity effect which confirmed our interpretation, i.e., the formation of a highly conductive region near the surface and a decreased bulk conductivity. Finally, the changes in the defect chemistry observed for UV illumination in H2 were explained by a model based on oxygen quasi-chemical potential. Mechanistically, UV illumination led to the same effects in air and N2, i.e. to a rise in the oxygen chemical potential. However, there the conductivity increased by orders of magnitude. This is in accordance with the defect chemistry of SrTiO3, since in the p-type conductive region an increased effective pO2 means a higher conductivity.Conflicts of interest
There are no conflicts to declare.Acknowledgements
The authors like to acknowledge the financial support and open access funding provided by the Austrian Science Fund (FWF) project P31654-N37 and funding from the European Union's Horizon 2020 research and innovation program under grant agreement No. 824072 (Harvestore). M. S. was also partly supported by the Competence Center for Electrochemical Surface Technology (CEST) in the framework of the COMET scheme of the Austrian Research Promotion Agency (FFG, project 865864).References
- W. Jung and H. L. Tuller, Adv. Energy Mater., 2011, 1, 1184–1191 CrossRef CAS.
- R. A. De Souza, Curr. Opin. Solid State Mater. Sci., 2021, 25, 100923 CrossRef CAS.
- R. A. De Souza, J. Fleig, R. Merkle and J. Maier, Z. Metallkd., 2003, 69, 218–225 CrossRef.
- R. A. De Souza, Adv. Funct. Mater., 2015, 25, 6326–6342 CrossRef CAS.
- R. Moos and K. H. Härdtl, J. Am. Ceram. Soc., 1997, 80, 2549–2562 CrossRef CAS.
- F. Noll, W. Münch, I. Denk and J. Maier, Solid State Ionics, 1996, 86-88, 711–717 CrossRef CAS.
- R. Merkle, R. A. De Souza and J. Maier, Angew. Chem., Int. Ed., 2001, 40, 2126–2129 CrossRef CAS PubMed.
- G. Walch, B. Rotter, G. C. Brunauer, E. Esmaeili, A. K. Opitz, M. Kubicek, J. Summhammer, K. Ponweiser and J. Fleig, J. Mater. Chem. A, 2017, 5, 1637–1649 RSC.
- M. Morgenbesser, A. Schmid, A. Viernstein, J. d. D. Srivent, F. Chiabrera, N. Bodenmüller, S. Taibl, M. Kubicek, F. Baiutti, A. Tarancon and J. Fleig, Solid State Ionics, 2021, 368, 115700 CrossRef CAS.
- A. Viernstein, M. Kubicek, M. Morgenbesser, G. Walch, G. C. Brunauer and J. Fleig, Adv. Funct. Mater., 2019, 29, 1900196 CrossRef.
- M. Siebenhofer, T. Huber, W. Artner, J. Fleig and M. Kubicek, Acta Mater., 2021, 203, 116461 CrossRef CAS.
- F. V. E. Hensling, D. J. Keeble, J. Zhu, S. Brose, C. Xu, F. Gunkel, S. Danylyuk, S. S. Nonnenmann, W. Egger and R. Dittmann, Sci. Rep., 2018, 8, 8846 CrossRef CAS PubMed.
- M. Siebenhofer, F. Baiutti, J. Sirvent, T. M. Huber, A. Viernstein, S. Smetaczek, C. Herzig, M. O. Liedke, M. Butterling, A. Wagner, E. Hirschmann, A. Limbeck, A. Tarancon, J. Fleig and M. Kubicek, J. Eur. Ceram. Soc., 2022, 42(4), 1510–1521 CrossRef CAS.
- X. Guo, Z. Zhang, W. Sigle, E. Wachsman and R. Waser, Appl. Phys. Lett., 2005, 87, 162105 CrossRef.
- S. Rodewald, J. Fleig and J. Maier, J. Eur. Ceram. Soc., 1999, 19, 797–801 CrossRef CAS.
- S. Rodewald, J. Fleig and J. Maier, J. Am. Ceram. Soc., 2000, 83, 1969–1976 CrossRef CAS.
- M. Stöber, C. Cherkouk, T. Leisegang, M. Schelter, J. Zosel, J. Walter, J. Hanzig, M. Zschornak, S. Prucnal, R. Böttger and D. C. Meyer, Cryst. Res. Technol., 2018, 53, 1800004 CrossRef.
- D. Hertkorn, M. Benkler, U. Gleißner, F. Büker, C. Megnin, C. Müller, T. Hanemann and H. Reinecke, J. Mater. Sci., 2014, 50, 40–48 CrossRef.
- S. Shen, Y. Jia, F. Fan, Z. Feng and C. Li, Chin. J. Catal., 2013, 34, 2036–2040 CrossRef CAS.
- S. Zoller, A. A. Demkov, R. Liu, P. L. Fejes, R. B. Gregory, P. Alluri, J. A. Curless, Z. Yu, J. Ramdani, R. Droopad, T. E. Tiwald, J. N. Hilfiker and J. A. Woodlam, J. Vac. Sci. Technol., B, 2000, 18, 2242–2254 CrossRef.
- C. Ohly, S. Hoffmann-Eifert, X. Guo, J. Schubert and R. Waser, J. Am. Ceram. Soc., 2006, 89, 2845–2852 CrossRef CAS.
- C. Ohly, S. Hoffmann, K. Szot and R. Waser, Integr. Ferroelectr., 2006, 33, 363–372 CrossRef.
- R. Merkle and J. Maier, Angew. Chem., Int. Ed., 2008, 47, 3874–3894 CrossRef CAS PubMed.
- R. Merkle, J. Maier, K.-D. Becker and M. Kreye, Phys. Chem. Chem. Phys., 2004, 6, 3633–3638 RSC.
- B. L. Phoon, C. W. Lai, J. C. Juan, P.-L. Show and G.-T. Pan, Int. J. Hydrogen Energy, 2019, 44, 14316–14340 CrossRef CAS.
- S. Patial, V. Hasija, P. Raizada, P. Singh, A. A. P. Khan Singh and A. M. Asiri, J. Environ. Eng., 2020, 8, 103791 CAS.
- L. Mu, Y. Zhao, A. Li, S. Wang, Z. Wang, J. Yang, Y. Wang, T. Liu, R. Chen, J. Zhu, F. Fan, R. Li and C. Li, Energy Environ. Sci., 2016, 9, 2463–2469 RSC.
- S. Carlotto, Appl. Surf. Sci., 2020, 527, 146850 CrossRef CAS.
- J. Crank, The Mathematics of Diffusion, Oxford University Press, Great Britain, 1956 Search PubMed.
- J. Maier, Physical Chemistry of Ionic Materials Ions and Electrons in Solids, John Wiley & Sons Ltd., Great Britain, 2004 Search PubMed.
- C. B. Gopal and S. M. Haile, J. Mater. Chem. A, 2014, 2, 2405–2417 RSC.
- J. Maier, J. Am. Ceram. Soc., 1993, 76, 1212–1217 CrossRef CAS.
- J. Maier, J. Am. Ceram. Soc., 1993, 76, 1223–1227 CrossRef CAS.
- J. Maier, Solid State Ionics, 2000, 135, 575–588 CrossRef CAS.
- H. Rickert, Electrochemistry of Solids, Springer, 1982 Search PubMed.
- J. Maier, Z. Phys. Chem., 2005, 219, 35–46 CrossRef CAS.
- J. Maier, Z. Phys. Chem., 2012, 226, 863–870 CrossRef CAS.
- W. Shockley, Bell Syst. Tech. J., 1949, 28(3), 435 CrossRef.
- S. M. Sze, Physics of Semiconductor devices, John Wiley and Sons, 2nd edn, 1981 Search PubMed.
- R. van de Krol and M. Grätzel, Photoelectrochemical Hydrogen Production, Springer, 2012 Search PubMed.
| This journal is © The Royal Society of Chemistry 2022 |

