 Open Access Article
Creative Commons Attribution 3.0 Unported Licence
Optimization of structural expansion and contraction for TiS2 by controlling the electrochemical window of intercalation/delithiation†
Xue
Han
a,
Min
Wang
a,
Jingxian
Yu
 b and
Shengping
Wang
 *a
*a
aFaculty of Materials Science and Chemistry, China University of Geosciences, Wuhan 430074, China. E-mail: spwang@cug.edu.cn
bARC Centre of Excellence for Nanoscale BioPhotonics (CNBP), School of Chemistry and Physics, The University of Adelaide, Adelaide, SA 5005, Australia
First published on 16th December 2021
Abstract
A reversible layered structure of TiS2 with relaxation like a spring, can be achieved by controlling the optimized potential range to 0.9–2.8 V (vs. Li+/Li) to yield a high discharge capacity, long cycling life, and excellent rate performance. The discharge capacity density and Coulombic efficiency for TiS2 at the 100th cycle at 0.1 mA cm−1 and 0.9–2.8 V are 321 mA h g−1 and ∼100%, respectively, which are more effective and better than those over potential ranges of 0.8–2.8 V and 1.0–2.8 V. In response to this, the deeper lithiation of TiS2 at 0.8 V leads to the formation of irreversible Ti2S and results in poor cycling performance. The reduced lithiation of TiS2 at 1.0 V results in low capacity density. Therefore, the relationship between the lithiation depth, structural stability, and electrochemical characteristics of TiS2 as an electrode material is clarified. Controlling the optimized potential range for structural stability during discharge/charge is thus an effective way of improving electrochemical performance.
1 Introduction
The electrode materials of lithium-ion batteries (LIBs) determine the energy density and power density of the cells.1–3 TiS2 as an anode material with a four-electron electrochemical reaction demonstrates a high theoretical capacity density of 956 mA h g−1.4,5 The interlayer spacing (5.703 Å) of TiS2 with a layered structure is greater than that (3.4 Å) of graphite.6,7 Therefore, TiS2 exhibits rapid intercalation/deintercalation and diffusion of lithium ions, and good electronic conductivity.8 Therefore, TiS2 has great potential for application as an electrode material.In LIBs, the lithiation/delithiation of TiS2 can be divided into two processes (Equation (S1) and (S2), ESI†).9 The discharge potential of TiS2 is higher than 1.4 V, and a small amount of lithium ions intercalate the TiS2 layers and form LixTiS2 (0 < x ≤ 1). In this process, which is a typical solid solution reaction, the electrode materials exhibit good reversibility. As additional lithium ions intercalate into the LixTiS2 (1 < x ≤ 4), TiS2 gradually transforms into Li2S and Ti, and the layered structure is destroyed. Excessive lithium intercalation of TiS2 causes fracturing of the crystal structure and reduces the cycling stability of the material.10 Therefore, the incompatibility of the capacity density and cycling performance of TiS2 is a key issue. TiS2 with a special morphology, and its composites with other materials, can be effectively used to improve electrochemical performance, but most of these synthesis processes are complex and difficult.11,12 Therefore, it is extremely important to find a simple and convenient way to achieve produce TiS2 that exhibits both a high capacity density and long cycling life.
In previous studies on sulfur13,14 and MnO2,15 it was found that by controlling the discharge/charge potential range of the electrode materials, their cycling lives and capacity densities could be improved. This suggests that it may be possible to achieve increased capacity density and cycling performance by adjusting the lithiation depth of TiS2. Obviously, if the critical point of the stable layered structure of TiS2 during discharge/charge is found, these goals could be achieved. Therefore, the evolution of the crystal structure during discharge/charge and the relationships between the electrochemical window, capacity density and cycling life need to be studied in depth.
In this paper, based on powder X-ray diffraction (XRD), selected area electron diffraction (SAED), and electrochemical methods, the lithiation/delithiation processes of TiS2 over various potential ranges were systematically studied. It was found that lithium ions intercalate to generate Ti2S after a series of phase transitions (TiS2–LiTiS2–Ti2S). The formation of irreversible Ti2S results in TiS2 being produced over 0.8–2.8 V, which promotes poor cycling performance. Therefore, by controlling the potential window to 0.9–2.8 V, the formation of Ti2S is avoided, and the Coulombic efficiency and cycling life of TiS2 are improved. This represents a new approach for enhancing the lithium storage performance of layered transition metal sulfides.
2 Results and discussion
2.1 Morphology and crystal structure
As shown in Fig. S1 (ESI†), the diffraction peaks of the sample are consistent with hexagonal TiS2 (PDF#15-0853). However, it is important to note that the intensity ratios of the (101) and (001) peaks in this work are quite different from those of the standard diffraction pattern. The (001) peak intensity is the strongest among the diffraction peaks. During Rietveld refinement, the preferred orientation was carefully considered, and this was an important step in improving the fitting and minimizing the difference. This result suggests a preferential orientation of the (001) plane of TiS2.16 TiS2 has a typical layered structure, with each layer composed of two hexagonal close-packed S atoms. Ti is located in the center to form an octahedron. The layers of TiS2 are connected via weak van der Waals forces with a layer spacing of 5.691 Å.17 TiS2 has two active sites (octahedral and tetrahedral) for lithium ion storage.18,19 Scanning electron microscopy (SEM) and transmission electron microscopy (TEM) images indicate that TiS2 comprises oval flakes with a particle size of ∼300 nm (Fig. S2, ESI†).2.2 Electrochemical performance
This work aimed to clarify the threshold of the electrochemical windows at which TiS2 could maintain its layered structure and exhibit excellent cycling stability. A wide window (e.g., 0.01–2.80 V) with high specific capacity and poor cycling stability and a narrow window (e.g., 1.50–2.80 V) with low specific capacity and good cycling stability are compared in Fig. S3c (ESI†). The results urged us to think about the threshold of the electrochemical windows in terms of both good cycling stability and high specific capacity. Based on these results, it was necessary for us to conduct full research to identify this threshold.
The ratio of the actual capacity density to the theoretical capacity density of TiS2 from 1.5–2.8 V is 0.79, therefore ∼0.79 mol lithium ions are intercalated in TiS2 when it is discharged to 1.5 V. The good cycling performance of TiS2 over 1.5–2.8 V indicates that its crystal structure is reversible and stable during lithiation/delithiation. Comparing the capacity density and cycling performance of TiS2 over various potential ranges, it was observed that TiS2 with a narrow potential range exhibits increased cycling performance and decreased capacity density. TiS2 with a wide potential range exhibits increased capacity density and poor cycling performance. Therefore, it is necessary to find a suitable discharge/charge potential window for TiS2 to exhibit both a long cycling life and high capacity density.
The cycling characteristics of TiS2 over various potential ranges are shown in Fig. 1a. TiS2 over 0.9–2.80 V exhibits excellent cycling performance, with discharge capacity densities of the first and 100th cycles of 321 and 213 mA h g−1, respectively. The Coulombic efficiency at the 100th cycle is close to 100%. The discharge capacity density and Coulombic efficiency after 100 cycles for TiS2 from 0.8–2.8 V are 58 mA h g−1 and 90%, respectively, and the capacity density is far lower than that of the first cycle (405 mA h g−1). Obviously, TiS2 with a potential range of 0.9–2.8 V exhibits the best electrochemical performance. This is related to the structural evolution of TiS2 during lithiation/delithiation.
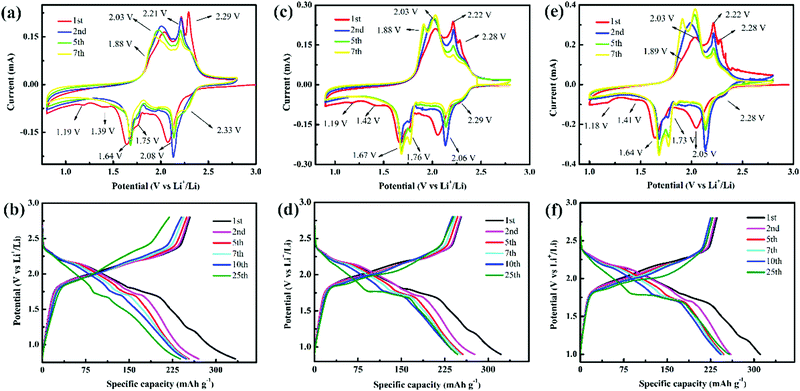
The dQ/dV curves over 0.9–2.8 V and 1.0–2.8 V feature another pair of redox peaks at ∼1.76/∼1.86 V, which indicates an additional lithiation/delithiation process for LixTiS2 (0 < x ≤ 1). However, there are no corresponding peaks at ∼1.76/∼1.86 V in the dQ/dV curves over 0.8–2.8 V, which indicates that the TiS2 crystal undergoes an irreversible phase transition when discharged at 0.8 V. Obviously, this crystal structure and phase change affect the electrochemical behavior during the discharge/charge processes below 0.9 V.
 | ||
| Fig. 2 CV curves at 0.1 mV s−1 and discharge/charge curves at 0.1 mA cm−2 of TiS2 over (a and b) 0.8–2.8 V, (c and d) 0.9–2.8 V, and (e and f) 1.0–2.8 V. | ||
The redox peaks of TiS2 over 0.9–2.8 V can still be observed at ∼1.75/∼1.88 V in the following CV curve (Fig. 2c), and their peak currents increase with increasing cycle number. Therefore, the crystal structure of TiS2 during GDC in the range of 0.9–2.8 V is reversible, and the GDC curves also show the same phenomenon (Fig. 2d). The plateau length of the discharge curve elongates with increasing cycle number, and the plateau potential of 1.71 V is higher than the potential that reaches 1.69 V over 0.8–2.8 V. The CV and GDC curves in the range of 1.0–2.8 V are similar to those in the range of 0.9–2.8 V (Fig. 2e and f), indicating that they show the same lithium storage behavior.
2.3 Electrochemical reaction kinetics
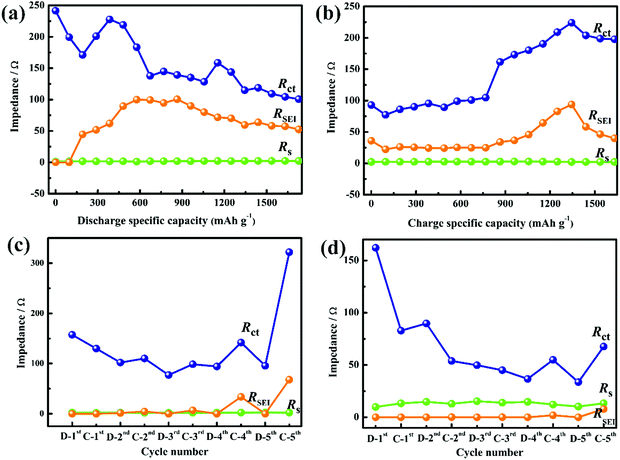
The first discharge/charge curves and EIS curves of TiS2 at various DODs and depths of charge (DOCs) are shown in Fig. S6 (ESI†). The Rct value gradually decreases during the discharge process and increases during the charge process (Fig. 3a and b), and the Rct is related to the lithium molar content in TiS2. The RSEI gradually increases during the early discharge stage, which means that the SEI film is continuously generated. The RSEI value of TiS2 at a DOD of approximately 50% (∼0.8 V vs Li+/Li) is at a maximum, which indicates that the SEI film on the electrode surface is unstable.
 | ||
| Fig. 3 Impedances of TiS2 at various (a) DODs and (b) DOCs during the first discharge/charge processes and at full states of discharge/charge for various cycles over (c) 0.8–2.8 V and (d) 0.9–2.8 V. | ||
The EIS curves of TiS2 from discharge to the cutoff potential (0.8 or 0.9 V) and charge to 2.8 V are shown in Fig. S7 (ESI†). The SEI film over 0.9–2.8 V was generated during the first discharge and basically remained stable throughout the cycle process (Fig. 3c and d). The Rct of the regions 0.8–2.8 V and 0.9–2.8 V gradually decrease with increasing cycle number, which is related to the electrode active material. The exchange current density at 0.9–2.8 V is higher than that at 0.8–2.8 V, indicating that TiS2 at 0.9–2.8 V shows improved reversibility for a low Rct value and a stable SEI film (Fig. S8, ESI†).
 | ||
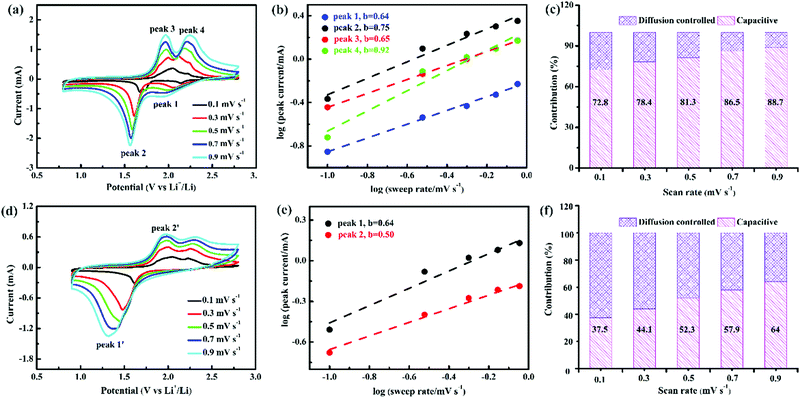
| Fig. 4 CV curves, b values, and capacity ratio of the capacitive (blue) and diffusion-controlled (pink) processesTiS2 at (a–c) 0.8–2.8 V and (d–f) 0.9–2.8 V. | ||
The b values of the reduction and oxidation peaks of TiS2 at 0.9–2.8 V are 0.64 and 0.50, respectively. Therefore, the electrochemical reaction of TiS2 at 0.9–2.8 V is mainly diffusion controlled. Simultaneously, the capacity ratio for the capacitive behavior of TiS2 increases from 37.5% to 64% upon an increase in the scan rate (Fig. 4a–c). The b values of the reduction and oxidation peaks of TiS2 at 0.8–2.8 V are 0.64/0.75 and 0.65/0.92, respectively, and the corresponding electrochemical reactions are dominated by capacitance and diffusion. The proportion of capacitive behavior increases from 72.8% to 88.7% upon an increase in the scan rate (Fig. 4d–f), which is higher than that at 0.9–2.8 V. It is generally believed that capacitive behavior accelerates the kinetics of electrochemical reactions.26 Therefore, the key factor is not the contribution of capacitive behavior, but the integrity of the TiS2 crystal structure during GDC that led to the excellent rate performance of TiS2 at 0.9–2.8 V.
2.4 Lithium storage mechanism
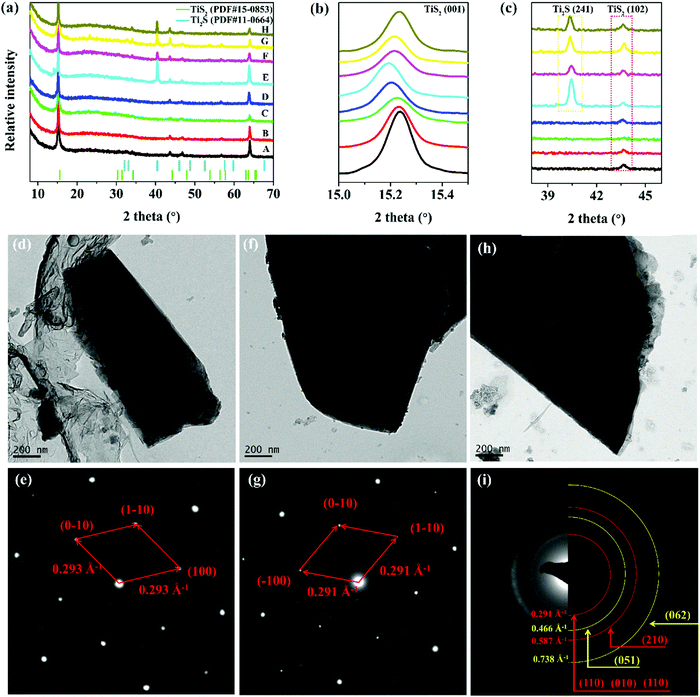
The above results show that TiS2 at 0.9–2.8 V shows improved cycle life and capacity density, and that the poor cycling performance of TiS2 at 0.8–2.8 V is due to the irreversible phase transition of the layered structure (Table S1, ESI†). The XRD patterns of TiS2 at various DODs and DOCs are shown in Fig. 5a–c. Lattice expansion is observed from the XRD patterns. The c value of the TiS2 unit cell during discharge at points A (TiS2, 2.68 V), B (Li0.18TiS2, 2.10 V), and C (Li0.68TiS2, 1.76 V) are 5.69, 5.83 and 6.29 Å, respectively. During the initial discharge process, lithium ions intercalate in the interlayers of TiS2, occupying the octahedral position and resulting in a significant increase in the interlayer distance.27 The layered structure shows excellent reversibility for a charge/discharge process, as evidenced by the shift in the (001) peak. The characteristic peak for Ti2S is also observed when discharged to point E. During the charge process from point E to point H, the peak intensities of Ti2S decrease with increasing DOC, but these peaks do not completely disappear. Therefore, the irreversible Ti2S produced by the partial conversion reaction is the reason for the poor cycling performance of TiS2 at 0.8–2.8 V. The layered-structure of the original TiS2 can be retained by carefully controlling the lithiation depth, e.g., setting a rational electrochemical window of 0.9–2.8 V. A further discharge process leads to an irreversible Ti2S, therefore resulting in poor cycling stability.28 | ||
| Fig. 5 (a–c) Ex situ XRD results at different states collected from Fig. S9 (ESI†). TEM and SAED images of TiS2 at (d and e) the initial state, and upon discharge to (f and g) 0.9 V and (h and i) 0.8 V. | ||
The SAED results of TiS2 during GDC are shown in Fig. 5d–i. The original TiS2 exhibits a typical 1H structure, and the diffraction spots are arranged symmetrically in a hexagon, which indicates that it is single crystalline in nature.29 The interlayer spacing of TiS2 upon discharge to 0.9 V increases for the formation of LixTiS2, and the layered structure is not destroyed (Fig. 5d). Upon discharge to 0.8 V, the electron diffraction pattern changes from diffraction spots to diffraction rings, which indicates that the material is polycrystalline (Fig. 5i). Simultaneously, new diffraction rings appear with interplanar spacings of 2.15 Å and 1.36 Å, related to the (051) and (062) planes of Ti2S, which are consistent with the XRD results. A deep discharge of TiS2 causes it to undergo a conversion reaction.
Theoretical calculations were employed to further investigate the structural evolution. The geometries of LixTiS2 (x = 0–3) were optimized using the SIESTA 4.0 package, and the results are shown in Fig. S10 (ESI†). The expansion in the volume is only 4.5% when one Li+ is inserted into the structure, while an approximately 15.5% change occurs on going from LiTiS2 to Li2TiS2. This result means that Li2TiS2 is unable to maintain its original structure due to drastic structural changes. These results are consistent with the experiment values. The irreversible Ti2S phase was identified by XRD and SAED when 2 Li+ ions were inserted into TiS2.
Here, we provide a detailed summary of the structural evolution of TiS2. The layer spacings of pristine TiS2 and at 0.9 V are 5.70 Å and 5.81 Å. Upon discharge to 0.8 V, a new phase comprising Ti2S is generated, and the layered structure is destroyed. At 0.01 V, Li2S and Ti are produced in a conversion reaction. Over the optimized potential window of 0.9–2.8 V, TiS2 retains its layered structure, therefore exhibiting excellent cycling capability. The irreversible Ti2S at 0.8–2.8 V leads to increased capacity density and reduced cycling performance of TiS2.
3 Conclusions
The layered structure of TiS2 over an optimized potential range of 0.9–2.8 V is retained, and the goals of high capacity density, long cycling life, and excellent rate performance were achieved. The discharge capacity density and Coulombic efficiency of the 100th cycle at 0.1 mA cm−1 are 321 mA h g−1 and ∼100%, respectively. TiS2 upon discharge to 0.8 V generates Ti2S in a conversion reaction, and the irreversible Ti2S leads to poor cycling performance. The discharge capacity of TiS2 at 0.8–2.8 V for the 100th cycle is only 58 mA h g−1.Controlling the potential range of TiS2 during discharge/charge could thus be used to improve the Coulombic efficiency and cycling life of other layered electrode materials, making it an effective and simple method to achieve excellent electrochemical performance of materials by adjusting the depth of lithiation.
Conflicts of interest
There are no conflicts to declare.Acknowledgements
The work was supported by the Key Research and Development Program of Hubei Province, China (2020BHB013). The computational aspects of this work were supported by an award under the National Computational Merit Allocation Scheme for J. Y. on National Computing Infrastructure (NCI) at Australian National University and Pawsey Supercomputing Centre in Western Australia.References
- M. Li, J. Lu, Z. Chen and K. Amine, 30 years of lithium-ion batteries, Adv. Mater., 2018, 30, 1800561, DOI:10.1002/adma.201800561
.
- G. Zhu, L. Wang, H. Lin, L. Ma, P. Zhao, Y. Hu, T. Chen, R. Chen, Y. Wang, Z. Tie, J. Liu and Z. Jin, Walnut-like multicore-shell MnO encapsulated nitrogen rich carbon nanocapsules as anode material for long cycling and soft-packed lithium-ion batteries, Adv. Funct. Mater., 2018, 28, 1800003, DOI:10.1002/adfm.201800003
.
- X. Chen, G. Ge, W. Wang, B. Zhang, J. Jiang, X. Yang, Y. Li, L. Wang, X. He and Y. Sun, In situ formation of ionically conductive nanointerphase on Si particles for stable battery anode, Sci. China: Chem., 2021, 64, 1417–1425, DOI:10.1007/s11426-021-1023-4
.
- M. Fu, Z. Yao, X. Ma, H. Dong, K. Sun, S. Hwang, E. Hu, H. Gan, Y. Yao, E. A. Stachet, C. Wolverton and D. Su, Expanded lithiation of titanium disulfide: reaction kinetics of multi-step conversion reaction, Nano Energy, 2019, 63, 103882, DOI:10.1016/j.nanoen.2019.103882
.
- S.-Y. Chen, Z.-X. Wang, X.-P. Fang, H.-L. Zhao, X.-J. Liu and L.-Q. Chen, Characterization of TiS2 as an anode material for lithium ion batteries, Acta Phys.-Chim. Sin., 2011, 27, 97–102, DOI:10.3866/PKUWHXB20110134
.
- A. H. Whitehead, K. Edstrtöm, N. Rao and J. R. Owen,
In situ X-ray diffraction studies of a graphite-based Li-ion battery negative electrode, J. Power Sources, 1996, 63, 41–45, DOI:10.1016/S0378-7753(96)02440-8
.
- K. Toyoura, Y. Koyama, A. Kuwabara and I. Tanaka, Effects of off-stoichiometry of LiC6 on the lithium diffusion mechanism and diffusivity by first principles calculations, J. Phys. Chem. C, 2010, 114, 2375–2379, DOI:10.1021/jp910134u
.
- H. Wang, Z. Qiu, W. Xia, C. Ming, Y. Han, L. Cao, J. Lu, P. Zhang, S. Zhang, H. Xu and Y.-Y. Sun, Semimetal or semiconductor: the nature of high intrinsic electrical conductivity in TiS2, J. Phys. Chem. Lett., 2019, 10, 6996–7001, DOI:10.1021/acs.jpclett.9b02710
.
- L. Zhang, D. Sun, J. Kang, H.-T. Wang, S.-H. Hsieh, W.-F. Pong, H. A. Bechtel, J. Feng, L.-W. Wang, E. J. Cairns and J. Guo, Tracking the chemical and structural evolution of the TiS2 electrode in the lithium-ion cell using operando X-ray absorption spectroscopy, Nano Lett., 2018, 18, 4506–4515, DOI:10.1021/acs.nanolett.8b01680
.
- B. Kartick, S. K. Srivastava and S. Mahanty, TiS2-MWCNT hybrid as high performance anode in lithium-ion battery, J. Nanopart. Res., 2013, 15, 1950, DOI:10.1007/s11051-013-1950-5
.
- F. N. Sayed, M. B. Sreedhara, A. Soni, U. Bhat, R. Datta, A. J. Bhattacharyya and C. N. R. Rao, Li and Na-ion diffusion and intercalation characteristics in vertically aligned TiS2 nanowall network grown using atomic layer deposition, Mater. Res. Express, 2019, 6, 115549, DOI:10.1088/2053-1591/ab3e19
.
- X. Zang, C. Shen, E. Kao, R. Warren, R. Zhang, K. S. Teh, J. Zhong, M. Wei, B. Li, Y. Chu, M. Sanghadasa, A. Schwartzberg and L. Lin, Titanium disulfide coated carbon nanotube hybrid electrodes enable high energy density symmetric pseudocapacitors, Adv. Mater., 2018, 30, 1704754, DOI:10.1002/adma.201704754
.
- Z. Yang, S. Wang, K. Dong, Y. Dai and X. Lei, Electrochemical characterization of sulfur with low depth of charge/discharge in lithium sulfur batteries, Electrochim. Acta, 2016, 187, 629–635, DOI:10.1016/j.electacta.2015.11.116
.
- S. S. Zhang, A new finding on the role of LiNO3 in lithium–sulfur battery, J. Power Sources, 2016, 322, 99–105, DOI:10.1016/j.jpowsour.2016.05.009
.
- H. Tan, S. Wang and X. Lei, New insights for the cyclic performance of Li/MnO2 batteries using a simple electrochemical process, J. Electrochem. Soc., 2015, 162, A448–A452, DOI:10.1149/2.0781503jes
.
- D. Y. Oh, Y. E. Choi, D. H. Kim, Y.-G. Lee, B. S. Kim, J. Park, H. Sohn and Y. S. Jung, All-solid-state lithium-ion batteries with TiS2 nanosheets and sulphide solid electrolytes, J. Mater. Chem. A, 2016, 4, 10329–10335, 10.1039/c6ta01628f
.
- J. Xu, J. Zhang, W. Zhang and C.-S. Lee, Interlayer nanoarchitectonics of two-dimensional transition-metal dichalcogenides nanosheets for energy storage and conversion applications, Adv. Energy Mater., 2017, 7, 1700571, DOI:10.1002/aenm.201700571
.
- A. Van der Ven, J. Bhattacharya and A. A. Belak, Understanding Li diffusion in Li-intercalation compounds, Acc. Chem. Res., 2013, 46, 1216–1225, DOI:10.1021/ar200329r
.
- S. N. Li, J. B. Liu and B. X. Liu, First principles study of nanostructured TiS2 electrodes for Na and Mg ion storage, J. Power Sources, 2016, 320, 322–331, DOI:10.1016/j.jpowsour.2016.04.122
.
- W. Li, K. Wang, S. Cheng and K. Jiang, An ultrastable presodiated titanium disulfide anode for aqueous “rocking-chair” zinc ion battery, Adv. Energy Mater., 2019, 9, 1900993, DOI:10.1002/aenm.201900993
.
- Z. Li, F. Du, X. Bie, D. Zhang, Y. Cai, X. Cui, C. Wang, G. Chen and Y. Wei, Electrochemical kinetics of the Li[Li0.23Co0.3Mn0.47]O2 cathode material studied by GITT and EIS, J. Phys. Chem. C, 2010, 114, 22751–22757, DOI:10.1021/jp1088788
.
- T. P. Heins, N. Harms, L.-S. Schramm and U. Schröder, Development of a new electrochemical impedance spectroscopy approach for monitoring the solid electrolyte interphase formation, Energy Technol., 2016, 4, 1509–1513, DOI:10.1002/ente.201600132
.
- Y. Teng, H. Zhao, Z. Zhang, Z. Li, Q. Xia, Y. Zhang, L. Zhao, X. Du, Z. Du, P. Lv and K. Świerczek, MoS2 nanosheets vertically grown on graphene sheets for lithium-ion battery anodes, ACS Nano, 2016, 10, 8526–8535, DOI:10.1021/acsnano.6b03683
.
- J. Wu, Z. Lu, K. Li, J. Cui, S. Yao, M. I. Haq, B. Li, Q.-H. Yang, F. Kang, F. Ciucci and J.-K. Kim, Hierarchical MoS2/carbon microspheres as long-life and high-rate anodes for sodium-ion batteries, J. Mater. Chem. A, 2018, 6, 5668–5677, 10.1039/c7ta11119c
.
- X. Xu, R. Zhao, B. Chen, L. Wu, C. Zou, W. Ai, H. Zhang, W. Huang and T. Yu, Progressively exposing active facets of 2D nanosheets toward enhanced pseudocapacitive response and high-rate sodium storage, Adv. Mater., 2019, 31, 1900526, DOI:10.1002/adma.201900526
.
- X. Hu, J. Jia, G. Wang, J. Chen, H. Zhan and Z. Wen, Reliable and general route to inverse opal structured nanohybrids of carbon-confined transition metal sulfides quantum dots for high-performance sodium storage, Adv. Energy Mater., 2018, 8, 1801452, DOI:10.1002/aenm.201801452
.
- J. Chen, Z.-L. Tao and S.-L. Li, Lithium
intercalation in open-ended TiS2 nanotubes, Angew. Chem., Int. Ed., 2013, 42, 2147–2151, DOI:10.1002/anie.200250573
.
- X. Sun, P. Bonnick and L. F. Nazar, Layered TiS2 positive electrode for Mg batteries, ACS Energy Lett., 2016, 1, 297–301, DOI:10.1021/acsenergylett.6b00145
.
- Y. Liu, H. Wang, L. Cheng, N. Han, F. Zhao, P. Li, C. Jin and Y. Li, TiS2 nanoplates: a high-rate and stable electrode material for sodium ion batteries, Nano Energy, 2016, 20, 168–175, DOI:10.1016/j.nanoen.2015.12.028
.
Footnote |
| † Electronic supplementary information (ESI) available. See DOI: 10.1039/d1ma00900a |
| This journal is © The Royal Society of Chemistry 2022 |

