 Open Access Article
Creative Commons Attribution 3.0 Unported Licence
Microwave scattering parameters of ferro–nanocarbon composites for tracking range countermeasures†
Ashwini P.
Alegaonkar
a,
Himangshu B.
Baskey
b and
Prashant S.
Alegaonkar
 *c
*c
aDepartment of Chemistry, Sir Parshurambhau College, Pune 411 030, MS, India
bRF and Microwave Engineering Laboratory, Department of Strategic Materials, DMSRDE-DRDO, GT Road, Kanpur 208013, UP, India
cDepartment of Physics, School of Basic Sciences, Central University of Punjab, Bathinda 151 401, PS, India. E-mail: prashant.alegaonkar@cup.edu.in
First published on 18th December 2021
Abstract
In the strategic sector, frequently, the radar signatures in the microwave frequency region are cluttered, which can be overcome by designing and developing an effective electromagnetic interference (EMI) shield. Herein, we report the analysis of the s-parameter performance of ferro–nanocarbon (FNC) composites tested over the frequency region of 8–12 GHz (X-band). The FNC composite was prepared via a simple, single-pot, solid-state sublimation route with different contents of iron (1–4%). The fabricated material was characterised using X-ray diffractometry, scanning electron microscopy, vibrating sample magnetometry and several spectroscopic techniques such as infrared, UV-visible, and energy dispersive X-ray analysis. S-parameter and reflection loss studies were performed by transforming the composite material into a coaxial- and rectangular-shaped specimen, respectively. In the analysis, the inclusion of iron resulted in the formation of crystalline Fe2O3 (d[110]) and Fe3O4 (d[220]) phases, which were self-dispersed in the nanocarbon structure. The inclusion of iron was responsible for creating an asymmetric bond molecular environment in C–O–Fe, resulting in synergistic magneto-dielectric effects in terms of long-range polarization ordering mainly through the transitions between the O-2p and Fe-3d states to engage the incoming microwave field effectively. This composite showed a good performance of >98% shielding effectiveness with an infinite bandwidth and >99% return loss at a matching frequency of 9.01 GHz.
1. Introduction
Since World War II, microwave radiation, a small frequency band between infrared (IR) and radio (RF) waves in the electromagnetic spectrum, has become increasingly important in military surveillance. Typically, microwaves lie in the frequency range of 0.3–300 GHz with a wavelength of 100–0.1 cm, power of 100 μW–0.01 kW, and carry energy between 10−6–10−3 eV. Microwaves are used as a seeker probe to sense, detect, and track anonymous flying objects that could be disruptive in nature.1 The threat spectrum of these seekers is comprised of long-range frequency surveillance of 0.3–2 GHz (sub-S-band), whereas 2–4 GHz (S) and 4–8 GHz (C) are designated for mid- and short-range tracking purposes, respectively. The characteristic 8–12 GHz (X-band) and 12–18 GHz (Ku-band) bands are used for guidance and high-resolution homing mode, respectively.2 However, in recent years, modern electronic warfare has emerged with the capabilities to clutter these probes, thereby using number of disruptive tactics. Accordingly, several electronic countermeasures have been developed such as stealth, electromagnetic cloak, filter-based frequency selective coatings,3 efficient absorbers,4 and electromagnetic interference (EMI) shielding,5 which minimize radar signatures (RS).6Among these techniques, EMI shielding is one of the most popular measures, which can be achieved with the help of absorption and/or destructive interference of the incident radar beam. The measured shielding effectiveness (SE in dB) of a coating depends on its thickness and density of shield.7 Initially, metal coatings were used; however, the modern architecture demands low weight, flexible, slim compositions. Thus, the use of nanomaterials can be a viable option. The fundamental mechanism behind any shield is the absorption, reflection, multiple reflection, and transmission of microwave radiation. Reflection depends on the electrical conductivity, while absorption is a function the structural architecture and coating thickness. In addition, there are other electromagnetic parameters such wave impendence at the air/shield interface, constitutive parameters, propagation/attenuation constants, skin depth, frequency of the incident waves, and transmission coefficients. All these factors influence the performance of an EMI shield. The design and development of a shield aim to attain low visibility on the radar of enemies, thereby reducing the original radar cross-section of the object. The basic requirements of an efficient EMI shield are as follows: (a) maximum absorption of incident power, (b) lossy dissipation through heat, (c) slim, flexible, corrosion-free, lightweight design, and (d) cover larger bandwidths. Notably, the current shield technology still suffers from a trade-off between a larger bandwidth and the absorber payload.
For EMI shielding applications, traditionally, metallic encasings have been implemented.8 However, major limitations are reported in fulfilling the requirements mentioned in point (c). Thus, in recent years, new porous nanomaterials and nanofiber composites including graphene, its derivatives, and their metal nanomaterial-impregnated counterparts9–13 have been considered as a strong alternative. These materials have been found to be well-suited options due to their combined advantages of lightweight, high surface area, and fabrication convenience. Among them, magnetic metals, particularly, nickel-based systems, have been extensively reported in the literature to exhibit microwave absorption/EMI shielding properties due to their advantages such as permeability, conductivity, eddy current characteristic, fabrication-friendly nature, and economic production. Nickel has been implemented in both individual and composite forms such as core-, yolk–shell, bimetallic (nano-particle/alloy), hollow, and porous/sponge/foam, offering a shielding effectiveness (S(E)) ranging from −15 to −30 (99.96%) dB, reflection loss of >−50 dB and thickness of 1–5 mm.14,15 Hover, their synthesis require expensive starting materials, complex, time-consuming fabrication steps, and ecologically unfriendly and tedious implementation processes. In contrast, nano-carbon (NC) synthesized using camphor (C10H16O, 2-camphanone) has a facile preparation route, which involves the instantaneous sublimation of the precursor compound. Furthermore, it is eco-friendly, easily scalable, and mere solid-state mixing of ferromagnetic complexes can yield ferro-nano-carbon (FNC). Also, although the fabricated powder contains iron, it is free from the corrosion effect and behaves as an organic compound due to the Fe–C bond molecular environment. Further, this type of ferro–nano-carbon-based composite has unique advantages in terms of low density, inherent disorder, and tuneable structural characteristics, which are favourable to enhance the EMI performance by actively contributing to dielectric polarization loss.
Herein, the aim of this study was to design and develop a simple, easy to implement shield architecture with effective microwave scattering parameters. NC and FNC-composites were prepared via the solid-state combustion technique with variable (1–5%) Fe contents. The prepared materials were characterized via X-ray diffraction (XRD), Fourier transform infrared (FTIR), UV-visible, and energy dispersive X-ray spectroscopy, scanning electron microscopy, vibrating magnetometry, and dc conductivity to analyse their structure–property relationship. Subsequently, the NC/FNC samples were transformed into toroidal- and rectangular-shaped specimens and subjected to vector network analyser and reflection loss measurements, respectively. Several scattering parameters such as ports S11 and S12, and constitutive (dielectric/diamagnetic) functions including return loss were measured over the range of 8–12 GHz (X-band). The obtained data were analysed to establish a correlation between the structural architecture of the composite and its property. The calculated electromagnetic variables such as characteristic impedance, skin depth, skin resistance, and standing wave ratio were examined to determine their functional dependence and the physical properties of the composite. Generally, it was revealed that the crystalline phases of Fe2O3@Fe3O4@NC are responsible for inducing long-range ordering due to the electronic polarization within FNC. The addition of Fe to NC tuned the charge carriers to generate optimal magneto-dielectric coupling with the incident microwave power. At a higher Fe fraction, typically 4%, the composite showed almost >98% return loss with a matching frequency of ∼9.01 GHz. The details are presented below.
2. Experimental
Camphor (C10H16O, 1,7,7-trimethylbicycloheptan, 99% pure, Sigma Aldrich, India), iron(III) nitrate trihydride (>98%, Sigma-Aldrich, India), iso-propyl alcohol (99%, Loba Chemie Pvt. Ltd, India), LY-5052 epoxy resin, and hardener (commercially available, Araldite) were used as the fabrication precursors to prepare NC/FNC and their composites.2.1 Fabrication of NC and FNC composites
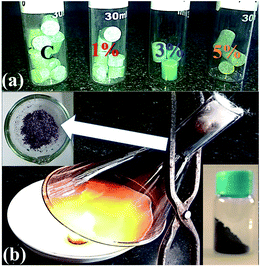
The fabrication of NC and FNC was carried out via the one-step solid-state combustion technique. Initially, a certain quantity of the camphor precursor powder was weighed using a standard weighing balance with a sensitivity of >10 μg. Calibration of the balance was carried out prior to weighing and after two sets of weighings. Using the KBr mould, the obtained powder was pressed in an ASTM hydraulic pressure instrument to obtain pellets, as seen in Fig. 1(a). The preparation of NC was carried out as follows: one pellet was taken at a time in a porcelain dish that was covered with a funnel and a cotton on the top opening, where this arrangement is shown in Fig. 1(b). Under the normal thermodynamic conditions, the combustion of the camphor pellets was carried out and the sublimated NC powder on the inner surface of the funnel was collected (arrow in Fig. 1(b)). Further, for FNC, 1 to 5 wt% of iron(III) nitrate trihydride was weighed, and accordingly added and mixed with camphor in the appropriate proportion. All the prepared compositions were each loaded properly and carefully into a mould and subjected to the hydraulic process. During combustion, extra care was taken not to allow the fluffy FNC/NC powder to diffuse out of the collection setup. After the collection, the powder was stored in a sealed bottle, as seen in Fig. 1(b), bottom right corner. The obtained powder was washed with iso-propanol and dried under normal atmospheric conditions at 300 K for 60 m. The obtained NC/FNC was divided into two parts to perform the characterizations and fabricate specimens for microwave measurements.2.2 Toroidal and rectangular specimens for microwave measurements
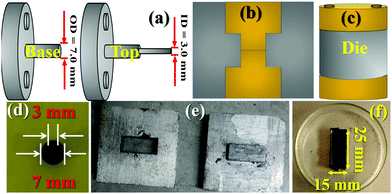
Critically, S-parameter characteristics require an appropriate geometry and shape of the specimen to inject, couple, and exact microwave power. Thus, the measurements were performed in two geometries: (a) co-axial and (b) wave-guide mode. For the co-axial measurements, toroidal specimens, whereas for the waveguide mode, rectangular-shaped specimens were designed and fabricated. Using the blend methodology, these shapes were obtained by converting the NC/FNC powder into polymer nanocomposites. For this purpose, a was made, which was comprised of a bottom and top portion. These two parts were connected by a Teflon-made coaxial prong placed at the middle to cast the co-axial cylinder shape. The outer (OD) and inner (ID) diameters of the prong were, 7.0 and 3.0 mm, respectively, as shown in Fig. 2(a). The synthesized composite was taken in proportion with the volume of the mould and the amount of NC/FNC to be filled together with the weight/volume % proportion of the epoxy content. Accordingly, weighing of the nanocomposite was carried out and it was blended with epoxy/resin.In parallel, epoxy (comprised of resin and hardener) was blended in a ratio of 100![[thin space (1/6-em)]](https://www.rsc.org/images/entities/char_2009.gif) :
:![[thin space (1/6-em)]](https://www.rsc.org/images/entities/char_2009.gif) 40 w/w followed by quick mixing via continuous manual stirring. Notably, utmost care was taken to prevent pre-curing of the epoxy prior to the addition of the NC/FNC powder. Further, wastage of the prepared nanocomposite was avoided by adding the material onto a Teflon platform. The nanocomposite was mixed thoroughly with epoxy for a few minutes to homogenize the paste. Before filling the paste in the mould, the Teflon prong was gently coated with grease to avoid excess sticking and damage to the specimen shape. At the centre of the mould, a metallic rod (ID 3 mm) was positioned and the paste was filled using a spatula. The die was closed and kept for 3–4 h of curing at 300 K. Fig. 2(b) and (c) schematically display the position of the mould and die, respectively. The die was to cure the composite matrix for about 60 min in a hot vacuum at 400 K, and subsequently left to cool. The nanocomposite specimen was separated from the mould by systematically removing the metallic rod and using a hollow cylindrical tube to disengage the co-axial specimen. The raw specimen was polished. A typical polished specimen is shown in Fig. 2(d). Accordingly, a large number of specimens was fabricated for S-parameter measurements. For the reflection loss characteristics, a rectangular-shaped specimen with dimensions of h × l × w ∼ 3 × 25 × 15 mm3 was prepared following identical synthetic protocols. Fig. 2(e) shows a photograph of the empty mould and Fig. 2(f) shows the corresponding unpolished raw specimen, which were polished prior to measurements.
40 w/w followed by quick mixing via continuous manual stirring. Notably, utmost care was taken to prevent pre-curing of the epoxy prior to the addition of the NC/FNC powder. Further, wastage of the prepared nanocomposite was avoided by adding the material onto a Teflon platform. The nanocomposite was mixed thoroughly with epoxy for a few minutes to homogenize the paste. Before filling the paste in the mould, the Teflon prong was gently coated with grease to avoid excess sticking and damage to the specimen shape. At the centre of the mould, a metallic rod (ID 3 mm) was positioned and the paste was filled using a spatula. The die was closed and kept for 3–4 h of curing at 300 K. Fig. 2(b) and (c) schematically display the position of the mould and die, respectively. The die was to cure the composite matrix for about 60 min in a hot vacuum at 400 K, and subsequently left to cool. The nanocomposite specimen was separated from the mould by systematically removing the metallic rod and using a hollow cylindrical tube to disengage the co-axial specimen. The raw specimen was polished. A typical polished specimen is shown in Fig. 2(d). Accordingly, a large number of specimens was fabricated for S-parameter measurements. For the reflection loss characteristics, a rectangular-shaped specimen with dimensions of h × l × w ∼ 3 × 25 × 15 mm3 was prepared following identical synthetic protocols. Fig. 2(e) shows a photograph of the empty mould and Fig. 2(f) shows the corresponding unpolished raw specimen, which were polished prior to measurements.
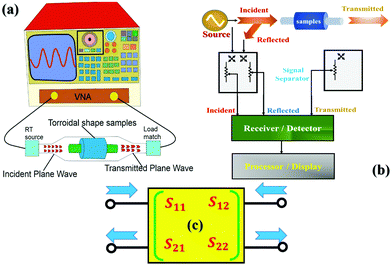
2.3 S-Parameter characteristics: X-band scattering data
Fig. 3 shows details of the two-port, vector network analyser (VNA, model: PNA E8364B) equipped with the corresponding software module (85071E) used to carry out the S-parameters measurements. The VNA was used to measure the scattering parameters including permittivity (ε) and permeability (μ) functions over the 8–12 GHz (X-band) regime. In principle, VNA can perform impedance measurements, both at the resistance (DC) and impedance (AC) levels in the scalar and vector modes, respectively. However, in the microwave regime, impedance data alone gives an incomplete description about the material under investigation. Hence, impedance and incident, reflected, and transmitted microwave power measurements are required for the describing complete behaviour of a shield in the microwave regime. In general, the response of an N-port network is designated as Sij-parameters to a voltage signal obtained at each port, where the first subscript (#) refers to the responding port, while the second refers to the incident port such as S21 – response at 2 due to the signal at 1.Generally, the performed N-port measurements are one-, two-, and three-port network measurements. However, two-port S-parameter measurements also are popular, easy to model, consistent, and unambiguous with the minimum amount of errors and with the advancement in data processing software.16 With the assumption that all the ports terminate with Z0 impedance, the four S-parameters: S11 and S21 are the ratios of reflected to incidence and transmitted to incidence power with the same meaning for S22 and S12, respectively. The mode used in this study was TEM, with ∼1 μW of incident power. Before performing the measurements, calibration and standardization of the instrument were done, which subsequently provided the absolute data.16
2.4 Direct current (dc) conductivity and other characterizations
Direct current (dc) conductivity measurements were performed on the NC and FNC composites by transforming the powder samples into a pellet using one more dies with the dimensions of OD ∼13 mm and height ∼3–4 mm. After preparation, the die was pressed using ASTM hydraulic instrument. Fig. 4 displays the electric connection of the sample to the probes, which were bonded using conducting silver paste. To perform the measurements with reliability, the inter-probe distance was kept between 8–10 mm. The paste bonding with the conducting probes was done using a paint brush and the dimension was maintained at ∼1–2 mm diameter. However, on a few occasions, depending on the surface nature of the composites, the paint was observed to spread, covering a larger area than bonded originally. Thus, utmost care was taken to avoid the spread of the paint and short circuit action. Generally, the conductivity data was noted to vary by about 1–2% due to the paint spreading effect. The inset of Fig. 4 shows the allied auxiliary electronics used during the measurements. The dc voltage was set to 20 V and a current sweep was given accordingly using a source meter (Keithley, India, Model: 2450).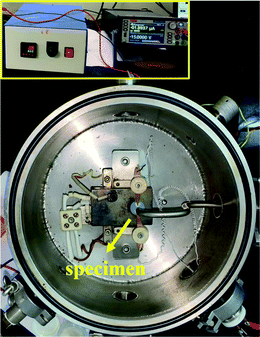 | ||
| Fig. 4 Photographic image of the dc conductivity set up loaded with the NC/FNC sample for performing I–V measurements. Inset shows the auxiliary electronic modules used for measurements. | ||
Further, the NC/FNC samples were examined for their functional groups including estimation of particle size and phases of Fe and C using a Fourier transform infrared (FTIR) spectrometer (Model: Tensor-37, Make: M/s Bruker India) in the wavenumber range of 400–1800 cm−1, UV-visible spectrometer (Make: Shimadzu, Model: UV-2450) in the wavelength range of 250–750 nm, X-ray diffractometer (Make: Rigaku Instruments, India, Model: X-1190) using Cu Kα(λ) 1.5406 Å, in the 2θ range of 10°–80° at a scan rate of 2° min−1 and field emission scanning electron microscope (FESEM)/energy dispersive spectroscopy (EDS) ay 20 kV beam potential with variable working distances and range of magnifications of 5–50k× (Make: Zeiss; Model: 3998A). Magnetometry measurements were performed at 300 K to record the MH curves using a vibrating sample magnetometer (Make: Lake shore, Model: 7410) over a magnetic sweep range of ±20 kOe.
3. Results and discussion
Generally, the interactions of microwaves with shielding materials occur at the molecular level through a number of possibilities such as magneto-dielectric coupling, radiative heating, generating eddy currents, and inducing polarization. Hence, was crucial to examine the molecular environment of the synthesized NC/FNC-composites before quantifying their X-band scattering characteristics. The presence of magnetic inclusion (Fe) in the matrix of NC could affect the physical properties of the fabricated composites. In fact, this may offer evidence to analyse the constitutive elements in sequencing correlation among polarization, conductivity, and S-parameter signatures.3.1 Structure–property analysis of NC/FNC: XRD, FTIR, UV-visible spectroscopy, Magnetometry, and SEM/EDS
The inset in Fig. 5(a) shows the recorded XRD pattern for NC, where two characteristic peaks can be observed. The peak marked with the symbol * at 25° reveals the existence of a graphitic phase with the atomic d spacing of (002). This peak is attributed to the aromatic ring orientation and reticulated graphitic layers in the 3D format.17 Further, the emergence of the peak at 42° corresponds to the d spacing of (100) and assigned to the degree of condensation of the aromatic rings, i.e., slice of the aromatic ring in the carbon mesh. A narrow and high-intensity d(200) peak indicates the better orientation of the aromatic layer, whereas a d(100) peak with similar features reveals the large size of the aromatic layers.The recorded XRD patterns of the FNC-composites show the appearance of the characteristic compounds with an amorphous carbon network, Fe2O3, Fe3O4, and graphitic carbon. The peak located at 23.65° is a *-peak and assigned to the presence of amorphous carbon. The peaks symbolized by • at 25.3° and 42.9° are the fingerprint for the graphitic carbon layers with the (002) and (100) d-planes, respectively.18 We noted that the main peak for NC seemed to be transformed into a peak of amorphous carbon due to the adsorption Fe oxides on the surface region of the graphitic planes. Further, the peaks indicated by § at 33.36°, 41.03°, 52.45°, and 67.06° correspond to d(110), d(113), d(024), and d(216) of the Fe2O3 phase, respectively. Similarly, peaks designated by † at 35.07°, 49.49°, 54.28°, and 63.49° are attributed to the Fe3O4 crystallite, with is comprised of various diffraction planes of d(220), d(311), d(422) and d(440), respectively. The XRD analysis revealed that Fe3O4 with the lattice constants of a = 5.04 and c = 13.77 Å forms hematite, whereas Fe3O4 (JCPDS card 65-3107) with the lattice constant of a = 8.40 Å forms an inverse spinal structure. The average crystallite size for the Fe2O3 and Fe3O4 phases was calculated using the d(110) and d(220) planes, respectively, using the Scherrer–Debye formula:  , where L, is the average crystallite size, β, is the full width at half maximum (FWHM), i.e., line broadening in radians, θ is the Bragg angle, and λ is the X-ray wavelength (CuKα = 1.5406 Å).19 For 1%, the value of L(Fe2O3) was found to be 17.22 nm, while with a subsequent increase in Fe, it was reduced to 16.34 and 15.07 nm, for 3% and 5%, respectively. For L(Fe3O4), the values were estimated to be 9.12, 8.22, and 6.11 nm, respectively, for the 1%, 3%, and 5% compositions, respectively. The analysis revealed that the Fe2O3 and Fe343 crystals seem to be well dispersed in the graphitic and amorphous carbon phases. This is due to the fact that the interaction of molecular iron in the carbonaceous network through surface oxygen complexes may lead to a high amount of dispersion and coverage of Fe atoms on NC. Table 1 shows the assignment of the XRD peaks for NC/FNC.
| S. no. | XRD | FTIR | ||||
|---|---|---|---|---|---|---|
| 2θ° | [d-Plane] | Nature | Peak no. | Band (cm−1) | Functional group | |
| 1 | 23.65 | — | Amorphous carbon | 1 | 457 | Fe2O3 |
| 2 | 25.30 | [002] | Graphitic carbon | |||
| 3 | 33.36 | [100] | α-Fe2O3 | 1 | 542 | ν(Fe–O) |
| 4 | 41.03 | [113] | Fe2O3 | |||
| 5 | 35.07 | [220] | Fe3O4 | 2 | 1224 | ν(O–C–O) and νas(Fe–O–R) |
| 6 | 43.29 | [100] | Graphite | |||
| 7 | 49.49 | [311] | Fe3O4 | 3 | 1363 | ν s(Fe–O–R) |
| 8 | 46.29 | [111] | Fe-Phase | |||
| 9 | 54.28 | [422] | Fe3O4 | 4 | 1738 |
ν
s(R–C![[double bond, length as m-dash]](https://www.rsc.org/images/entities/char_e001.gif) OH) OH) |
| 10 | 63.49 | [440] | FCC FeO | |||
Fig. 5(b) shows the FTIR spectra recorded for the NC and FNC-composites in the range of 400–1800 cm−1 to categorize the chemical band changes in the prepared composites. The doublet peaks at 1 ∼457 and 542 cm−1 are assigned to the stretching vibrations of Fe2O3 and Fe–O, respectively. For NC, the shallow bands at 1224 (peak 2) and 1363 (peak 3) cm-1 are attributed to the –O–C–O– (epoxy) and Fe–O–R– (alkoxy) vibrational deformations, respectively.20,21
Peak 4 appeared at 1738 cm−1 and assigned to R–C![[double bond, length as m-dash]](https://www.rsc.org/images/entities/char_e001.gif) OH is diminished completely in FNC. Table 1 shows the corresponding details.
OH is diminished completely in FNC. Table 1 shows the corresponding details.
In the UV analysis, various solvents such as acetonitrile (C2H3N) and water were used to disperse the NC and FNC powder to record their spectra. It was reported that acetonitrile, in general, reduces the nanocarbons, thereby exfoliating the graphitic layers.21 Thus, we used an aqua base to perform the UV-visible measurements. NC and FNC were sonicated well and dispersed in water before recording the spectra. The spectra recorded for the NC and FNC-composites are provided in the ESI,† Fig. S1. NC showed a prominent and broad peak at 200–440 nm, which is assumed to be superimposition of four distinct peaks at 237, 273, 312, and 361 nm. The first two peaks are attributed to the formation of oxide phases in NC due to the C–C and π–π* transitions. Moreover, the peak at 273 nm is assigned to the n–π* transitions due to the C–O bonding. The remaining two peaks at 312 and 361 are assigned to the conjugated polyenes (CH3–(CH–CH)n–CH3) with n = 4 and n ≥ 6, respectively.19 Typically, for 1% and 2%, due to the presence of FeO and Fe2O3 phases, a small hump at 270–315 nm was observed. Also, the peak at 270 is attributed to the disordered band-based transitions. Due to the defects in the FeO lattice in the form of vacancies created by cations, interstitially trapped oxygen moieties and iron vacancies are produced by the charge transfer between the Fe2+ and Fe3+ ions. However, with an increase in Fe content, this feature seemed to disappear and not observed for 3–5%. Particularly, the emergence of a band between 315–320 nm is due to the transitions between the O-2p to Fe-3d electronic states of the disordered Fe ions from the oxide moieties, with the suppression of the oxide peak related to graphite.20 Generally, the UV absorption spectra indicate the presence of two main transitions, namely, at 315 nm due to the O-2p to Fe-3d states and 220 nm due to the π–π* interactions. With an increase in Fe%, the curve became flat with no prominent peak feature seen for the conjugated polyenes. For NC, broadly, the intensity was found to be reduced with an increase in Fe due to the transfer of charge from NC to Fe. Typically, Fe2+ has a d8 configuration with three identified bands, i.e., 3A2g → 3T2g, 3A2g → 3T1g (F-ground state), and 3A2g → 3T1g (P-ground state). Also, Fe is an amphoteric element in nature. The observed UV bands of Fe overlap with the bands of NC, and hence cannot seen separately. However, the presence of prominent electronic transitions, as discussed earlier, is attributed to the iron oxide inter-band transition and assigned to 3A2g → 3T1g (P-ground state).
Fig. 5(c) shows the profiles of magnetic moment (emu) as a function of magnetic field (at 300 K) for the NC and 1%, 3%, and 5% FNC composites. For NC, no magnetic moment was observed over the magnetic sweep of ±20 kOe. However, with the incorporation of Fe, the net magnetization emerged in the NC matrix. For 1% FNC, the saturation level magnetic moment was observed to be enhanced by 5%, whereas, at highest composition, i.e., 5% FNC, the amount of magnetization was observed to increase by almost 15%. This shows that the magnetic molecular environment in FNC was enriched by the Fe phase, as discussed earlier. The nature of interactions seems to be paramagnetic exchange in origin.
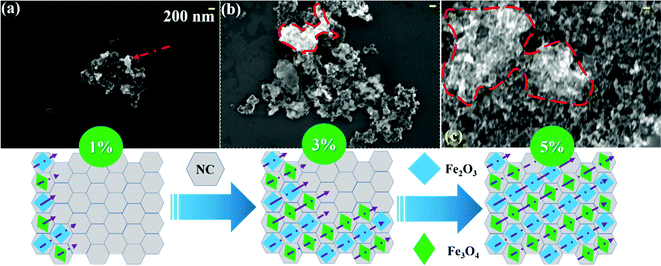
Fig. 6 shows the typical SEM micrographs recorded for 1%, 3%, and 5% FNC at a fixed working distance of ∼5.5 mm and at two magnifications, namely, 30× and 50×. However, here, we have chosen to display and discuss the morphology observed at 30× magnification in detail. Micrograph (a) shows that for 1% FNC, the original shape of NC (i.e., spherical nano-particles) was retained, significantly, with a diameter ranging from 150–200 nm. FNC was found to be aggregated, generating an interconnecting network for charge transportation through the carbon environment. Image (b) shows the 3% FNC composite, where the Fe coverage was comprised of oxide phases (Fe2O3 and Fe3O4) spread on the surface of NC (red dotted line contour). Subsequently, with an increase in the Fe content, we noted that the coverage of Fe/oxide was enhanced dramatically, as seen in the recorded image in (c) for 5%. The coverage scheme is schematically shown at the bottom of Fig. 6.
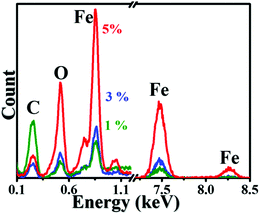
Further, EDS analysis was carried out on the NC and FNC specimens. Before performing EDS, the system was standardized and calibrated for the elemental composition. The area of the scan was kept constant ∼500 × 500 nm2 with a constant acquisition time of ∼60 s. Fig. 7 shows the EDS profiles recorded for the 1%, 3%, and 5% FNC composites. In general, EDS is technique that is surface sensitive in nature.
The graph shows the recorded elemental composition for carbon and the other elements present, where for the Kα electron emission, it is in the 0.1 to 10 keV energy regime. We observed that the % of Fe and O increased with an increase in the weight % of Fe in the precursor NC. This trend is consistent with the coverage of Fe seen in the SEM morphology and discussed for other characterization analysis. Table S2, provided in the ESI,† displays the variations in the recorded elemental composition with their atomic % for the NC and FNC composites. The atomic % of Fe was found to increase from 0.67% to 24.66% with an increase in wt.%, respectively, from 0% to 5%. The changes in the composition of C and O are seen to be somewhat irregular, which is attributed to the nonuniform surface distribution and inhomogeneous coverage of Fe atoms on NC.
3.2 Physical basis of S-parameter for analysing EMI shield character
Generally, the S-parameters are related to the Fresnel coefficients of reflection, refraction, and transmission, which can be analysed by measuring the amount of microwave power reflected and/or transmitted with respect to the incident power. There are several parameters such as frequency, mode, power, geometrical shape/size, and surface composition of the shield on which interaction losses are dependent. Fundamentally, the interaction of these radiations through a medium can be modelled by the four field (Maxwell's) equations, which combined, lead to the wave equation: ∇2ψ − γ2ψ = 0, where ψ, is the electric (Ē) or magnetic (![[H with combining macron]](https://www.rsc.org/images/entities/i_char_0048_0304.gif) ) field and γ, is a propagation constant; with the interfacial boundary condition: γ2 = α2 + β2. Both, α and β are frequency (ω)-dependent functions of permeability (μ), permittivity (ε), and ac/dc conductivity (σac/σdc); and the lossy constitutive parameters.
) field and γ, is a propagation constant; with the interfacial boundary condition: γ2 = α2 + β2. Both, α and β are frequency (ω)-dependent functions of permeability (μ), permittivity (ε), and ac/dc conductivity (σac/σdc); and the lossy constitutive parameters.
The most general form of the solution is given by:  , where |ψ0| is the amplitude, and
 ![[r with combining macron]](https://www.rsc.org/images/entities/i_char_0072_0304.gif) is the propagation vector, which characterizes the medium. This medium is basically categorized (via ac conductivity and dielectric function) into: (i) free space (σac = 0), (ii) lossless (σac ≪ ωε), (iii) lossy dielectrics (σ ≠ 0), and (iv) conducting medium (σac ≈ ∞), which can be practically analysed using the scattering S11, S12, S21, and S22 parameters. The schematic in Fig. 8 shows the scattering S-parameters and related effects. In addition, there are number of intricate properties of the medium such as standing wave ratio (SWR), skin resistance (Rs), skin depth (δ), and characteristic impedance (η) that can be determined to deconvolute the in-depth response of the material to the incident power. In general, these responses are far too complex in reality when they are compared with the four standard categories mentioned earlier. However, to keep the argument simple, the proportion of the incident power that is reflected or transmitted depends on the constitutive parameters ε′(ω), σdc/ac(ω,ε′), and μ(β) of the composite media, whose analysis can shed light on the quantification of the effectiveness of the shield material.
is the propagation vector, which characterizes the medium. This medium is basically categorized (via ac conductivity and dielectric function) into: (i) free space (σac = 0), (ii) lossless (σac ≪ ωε), (iii) lossy dielectrics (σ ≠ 0), and (iv) conducting medium (σac ≈ ∞), which can be practically analysed using the scattering S11, S12, S21, and S22 parameters. The schematic in Fig. 8 shows the scattering S-parameters and related effects. In addition, there are number of intricate properties of the medium such as standing wave ratio (SWR), skin resistance (Rs), skin depth (δ), and characteristic impedance (η) that can be determined to deconvolute the in-depth response of the material to the incident power. In general, these responses are far too complex in reality when they are compared with the four standard categories mentioned earlier. However, to keep the argument simple, the proportion of the incident power that is reflected or transmitted depends on the constitutive parameters ε′(ω), σdc/ac(ω,ε′), and μ(β) of the composite media, whose analysis can shed light on the quantification of the effectiveness of the shield material.
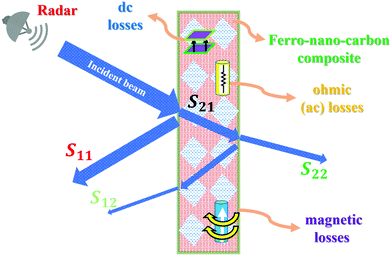 | ||
| Fig. 8 Schematic representation of the interaction of microwave radiations with molecular FNC composite, displaying various scattering losses to the incident power. | ||
3.3 Analysis of constitutive parameters: σdc, ε′(ω), σac(ω, ε′), and β(μ)
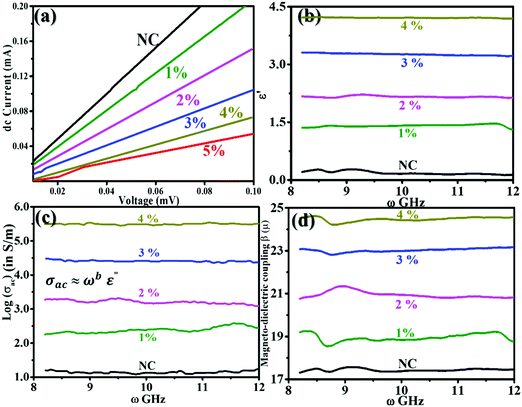
Fig. 9(a) shows the I–V profiles recorded for NC and 1–5% FNC. They are linear over the measured current sweep. According to the I–V profiles, the magnitude of dc conductivity, σdc, was deduced using: σdc = R/A·l, where R, is the calculated resistance, A, and l is the pellet dimensions (i.e., area and thickness). The estimated values are provided in Table 2. For NC, σdc is ∼ 7600 S m−1, which was enhanced almost by >2.5-times and achieved a magnitude of ∼19![[thin space (1/6-em)]](https://www.rsc.org/images/entities/char_2009.gif) 700 S m−1 for the 4% FNC-composite. The incorporation of iron in NC resulted in an increase in the σdc of the composite. It seems that in the molecular environment of NC, iron gets oxidized and forms various phases, mainly, Fe2O3 and Fe3O4. The formed phases participate in electric the conduction process through the sp2 chains. As the content of Fe increases, the effective Fe–O-sp2 network provides long-range ordering to transport the charge carriers, resulting an increase in the dc conductivity. Fig. 9(b) reveals the nature of ε′ in the X-band for the NC and FNC compositions. The variations in ε′ are noted to be nearly frequency independent in the X-band. Moreover, with a sequential increase in Fe (1–4%) a systematic increase in ε′ was seen. For NC, the average value of ε′ was found to be 0.1828 ± 0.0270, which increased by almost twenty-fold to 4.2093 ± 0.0124 for the 4% composition. Fe seems to introduce long-range polarization by connecting carbon through oxygen, resulting in an almost flat dielectric function for the nanocomposites.
700 S m−1 for the 4% FNC-composite. The incorporation of iron in NC resulted in an increase in the σdc of the composite. It seems that in the molecular environment of NC, iron gets oxidized and forms various phases, mainly, Fe2O3 and Fe3O4. The formed phases participate in electric the conduction process through the sp2 chains. As the content of Fe increases, the effective Fe–O-sp2 network provides long-range ordering to transport the charge carriers, resulting an increase in the dc conductivity. Fig. 9(b) reveals the nature of ε′ in the X-band for the NC and FNC compositions. The variations in ε′ are noted to be nearly frequency independent in the X-band. Moreover, with a sequential increase in Fe (1–4%) a systematic increase in ε′ was seen. For NC, the average value of ε′ was found to be 0.1828 ± 0.0270, which increased by almost twenty-fold to 4.2093 ± 0.0124 for the 4% composition. Fe seems to introduce long-range polarization by connecting carbon through oxygen, resulting in an almost flat dielectric function for the nanocomposites.
| S. no. | Composition | σ dc× 102 (S m−1) | ε′ | σ ac × 109 (S m−1) | Average β (H) | ||
|---|---|---|---|---|---|---|---|
| Average σac | Jonscher's coefficient | ||||||
| A | b | ||||||
| 1 | NC | 0.76 ± 0.20 | 0.1828 ± 0.0011 | 1.002 ± 0.031 | 0.437 ± 0.118 | 1.007 ± 0.218 | 17.45 ± 0.06 |
| 2 | 01% | 1.53 ± 0.91 | 1.4002 ± 0.0047 | 2.378 ± 0.042 | 0.488 ± 0.280 | 1.107 ± 0.453 | 18.94 ± 0.17 |
| 3 | 02% | 1.71 ± 0.24 | 2.1594 ± 0.0073 | 3.194 ± 0.083 | 0.403 ± 0.613 | 1.161 ± 0.671 | 20.93 ± 0.15 |
| 4 | 03% | 1.83 ± 0.56 | 3.2579 ± 0.0471 | 4.416 ± 0.254 | 0.444 ± 0.213 | 1.099 ± 0.224 | 23.04 ± 0.07 |
| 5 | 04% | 1.97 ± 0.43 | 4.2093 ± 0.0624 | 5.889 ± 0.881 | 0.341 ± 0.087 | 0.996 ± 0.971 | 24.48 ± 0.15 |
| S. no. | Composition | Reflection loss (%) | δ (nm) | R s (Ω m−2) | SWR (in dB%) | ||
|---|---|---|---|---|---|---|---|
| S 11 | S 12 | ||||||
| 1 | NC | 01.77 | 02.45 | 0.566 ± 0.034 | 501 ± 03 | 423.13 ± 32.89 | ∼04 |
| 2 | 01 | 13.77 | 16.39 | 0.523 ± 0.021 | 575 ± 17 | 357.12 ± 23.43 | ∼21 |
| 3 | 02 | 43.37 | 47.11 | 0.472 ± 0.013 | 799 ± 21 | 243.26 ± 16.97 | ∼33 |
| 4 | 03 | 79.81 | 82.12 | 0.413 ± 0.011 | 982 ± 11 | 202.56 ± 18.77 | ∼59 |
| 5 | 04 | 99.30 | 99.89 | 0.379 ± 0.003 | 1307 ± 23 | 127.45 ± 34.44 | ∼92 |
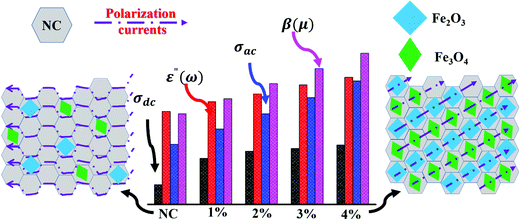
It is worth noting that the flat dielectric response is reflected well in Fig. 5(c), which shows the calculated logσac in the X-band for the nanocomposites. The variation in σac was observed to obey the universal Jonscher's power law.21 The response function, ε(ω), is composed of a real and imaginary part and σac is governed by the classical Debye equation: σac ≈ ωε′′ which is a consequence of the Kramer–Kronig relationship.22 In our system, we found a major departure from the Debye relation, yielding an almost flat ac conductivity response. The average value of σac for NC was found to be 1.002 ± 0.031 × 10⁹ S m−1 and with a subsequent increase in iron content by four times, the value of σac was noted to be increased by more than five-fold to 5.889 ± 0.881 × 10⁹ S m−1@4%. For the other compositions, the corresponding values are displayed in Table 2. In the dielectric loss analysis, for NC, two prominent peaks in the ε′′(ω) vs. ω profile are seen at 9.6 and 11.02 GHz, which are attributed to the relaxation of the polarizable moieties. This response originates from the ratio of the imaginary to real component of ε, which is locally frequency dependent and governed Debye σac-behaviour. The ratio of  gives τ, which is the polarization relaxation time. For NC, the magnitude of τ at 9.60 GHz is ∼2.07 ns, whereas at 11.02 GHz it is ∼0.45 ns. For NC, the discrete polarization seems to evolve with a discontinuous conducting network in the NC layers, yielding a lower magnitude of electric conductivity, as schematically seen in Fig. 10, left. However, the incorporation of iron atoms changes the polarization scenario, inducing polar interconnects, which results in a gradual increase in σac due to the long-range ordering of electronic polarization in a particular direction, as shown in Fig. 10, right portion.
Although the variations in σac are governed by non-Debye behaviour, it led to the assumption that asymmetric and discontinuous electronic polarization exits in NC. However, the inclusion of Fe atoms and their grown oxide phases seem to provide a conducting path that is continuous due to the development of larger and symmetrically charge-loaded domains of polarization (as seen in Fig. 10). The variations in σac were fitted for Jonscher's exponent law, dictated by: σ = σdc + σac = σdc + ωbε′′(ω); with b ∼ 0 within the experimental error, resulting in a frequency-independent response. Therefore, for the iron content, the behaviour of ε′′, which is seen to be frequency independence for the composite materials, follows the law: ε′′(ω) ∝ ωa−1 over the frequency range of 8–12 GHz (X-band). These variations seem to be independent of their physical, chemical, and geometrical properties. Moreover, they also seem to be independent of the nature of the electronically active moieties, resulting in polarization in the form of electronic, ionic, and dipolar polarizations. The exponent fitting of the σac profiles gave the values of the fitted exponent, as presented in Table 2, which confirms Jonscher's exponent law.22,23
The objective behind the iron-based magnetic architecture is to arrest magnetic field wiggles from the incident electromagnetic signal, resulting an increase in the shielding effectivity of a designed shield. According to the calculated values of σac and estimated product of ωε′, the ratio:  was identified to be between 0.1 (NC) to 0.0097(FNC-composites), which is quite small compared to 1. Thus, the typical character of the synthesized material falls in the category of lossy dielectrics, as discussed earlier in Section 3.2. The calculated ac magnetic coupling energy, β(μ), in arbitrary units is given by:
  . Now, quickly revisiting Fig. 9(d) in relation to β(μ) and observing their average magnitudes (Table 2), it is clear that β(μ) gradually and systematically increases with an increase in the content of iron. Generally, the analysis of the constitutive factors indicated significant variations in ε′, dramatic changes in the nature of both, σac and σdc, and a marked increase in β(μ) for the FNC composite in the X-band regime compared to that of NC. Thus, it is of further interest to investigate the S-parameters for NC/FNC.
3.4 S-Parameter analysis for NC/FNC
Broadly, when an incoming microwave field disturbance interacts with the composite interface, part of the field is reflected and part is transmitted. However, the proportion of these two components depends on the estimated constitutive architecture of the nanocomposites. However, one can still reduce the many constitutive variables into a single electrodynamic function dictated by the characteristic impedance, η, which is given the equation: . Also, depending on the geometrical configuration of the incident field (normal/oblique/arbitrary incidence), the amount of field reflected and transmitted can be deduced by solving ψ ≡ f(Ē,
 ![[H with combining macron]](https://www.rsc.org/images/entities/i_char_0048_0304.gif) ). Consequently, this leads to the estimation of Fresnel's coefficients for reflection and transmission, which are expressed in η and given by:
). Consequently, this leads to the estimation of Fresnel's coefficients for reflection and transmission, which are expressed in η and given by:  and
and  , respectively, where ηnc is the characteristic impedance for the nanocomposites and ηair is that for air. This formulation practically reduces every other variable to a single measurable scattering component:
  ; where Sij is the coefficient of scattering at the air (i)/composite (j) interface and expressed as the shielding effectiveness (SE):
  . In its basic structure, |Γ| is the function of η only. However, as discussed earlier, with the advancement in the measurement of the port S-parameters, Sij is the function of permittivity and permeability, which is given by the formulations of Nicholson–Ross.23 In subsequent versions, alterations were made by Nicolson–Ross–Weir considering a homogeneous, isotropic medium directly by examining the measured S-parameters for investigating cellular metamaterial structures. However, this issue is outside the scope of the present analysis.24 The amount of shielding effectiveness (SE) with the corresponding transmission of power (in%) is provided in Table S2 (ESI†). Fig. 11 displays the estimated port S-parameters at (a) S11 and (b) S12 in the 8–12 GHz regime for NC and the (1–4%) FNC-composites. The scheme below profile (a), and (b) displays the absorption mechanism for the minimum (1%) and maximum (4%) iron inclusions in NC, respectively.
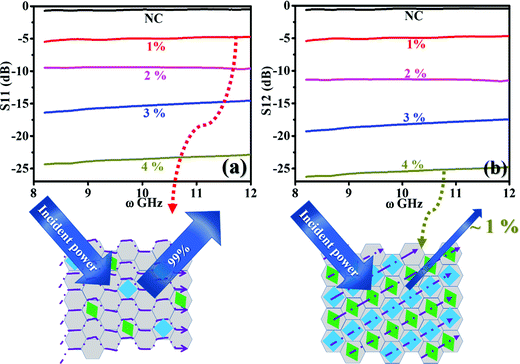 | ||
| Fig. 11 Port S-parameter behaviour recorded at (a) S11 and (b) S12 interface of NC and 1–4% FNC-composites in the X-band regime. Scheme below plot (a) shows ∼80% reflection at 1% FNC, whereas the scheme below plot (b) shows almost ∼99% reduction in reflection at 4% FNC composition. The shielding effectiveness data is tabulated in Table 3. | ||
The analysis of the port S-parameter is based on the following assumptions: (a) the incident microwave field encounters two interfaces, one at entrance and the second at re-exit of the composite, (b) scattering behaviour is compared at the two interfaces, namely, S11 (air/composite) and S12 (composites/air), and (c) the composite possesses a high degree of matrix homogeneity. From Fig. 11(a) and (b), the recorded spectra for S11 and S12, respectively, are observed to be flat with distinct changes in the amount of reflection by the inclusion of iron and its oxide phases. For NC, the overall magnitude of the reflected power is recorded to be the highest with the maximum amount of ∼99% (scheme below plot (a)). It seems that after the Fe atoms are incorporated in NC, they form phases of Fe2O3, Fe3O4, FeO, and amorphous Fe nano-aggregates, which are responsible for introducing electronic carriers. These carriers induce symmetric and anisotropic polarization through the symmetric and asymmetric vibration modes of Fe, C, and the connecting O atoms. This results in the large scattering of the incoming microwave field, mostly though the absorption process, as shown in the scheme below plot (b). With an increase in the Fe content, the entire power at S11 and S12 downshifted over the X-band regime. The estimated average values are provided in Table 3. Further, by virtue of the symmetry in the recorded data, the S21 and S22 data are not provided. The SE (in dB) at the two interfaces, air and re-entry from the composite, was calculated by taking the logarithmic ratios of S12 to S11 at interface-1 (entrance). For NC, SE@interface-1 was computed to be 01.77%, while for 4%, SE@interface-1 was almost >99.00%@X-band with an infinite bandwidth. The data in Table 3 show the reflection loss (in%) obtained from S11 and S12, including other calculated electrodynamic variables such as characteristic impedance, η, skin depth, δ, skin resistance, Rs, and standing wave ratio (SWR) for NC and (1–4%) FNC-composites in the range of 8–12 GHz.
Table 3 shows the calculated reflection loss in % for the power received in air at first and re-entry surface of the composite estimated from S11 and S12, respectively. It is seen that from the second interface, the return losses are bit high for NC and the 1–4% FNC-composites. This clearly and legitimately shows that optimization of the composite architecture can lead to larger losses over the X band, which re advantageous for radar absorption applications. The tabulated  over 8 to 12 GHz for the fabricated composites are provided in Table 3, showing their average values.
For NC, the estimated  is ∼ 0.566 and reduced to ∼ 0.379, i.e., more than 30% for the 4% composition. The FNC composite offered more than one quarter less impedance to the incident power at a higher Fe content compared with that of its pure counterpart. This is quite consistent with the gradually increasing average magnitudes of skin depth, δ, which was calculated using:
  . For NC, the average δ is ∼500 nm, which in turn was enhanced to ∼1.30 μm for the 4% composition. This value is almost enhanced by three fold. In addition, the skin resistance was obtained using:
  for the X-band. The trend observed for
  was found to be similar with that observed for the calculated Rs of NC and the (1–4%) FNC-composites. As discussed earlier, both of them possess identical physical origins. The calculated standing wave ratio was found to be 4% for NC. Notably, for NC, δ is relatively high; however, the pattern of the standing wave is very feeble. This may be attributed to the reflection of most of the microwave power from the skin. After the inclusion of Fe, especially, for the 4% FNC-composite, the ratio was found to reach >90%, which is more than s twenty-fold enhancement.
The inclusion of Fe certainly improved the microwave scattering performance, and thereby absorption compared with that for NC. Fe is a strong ferromagnet having high electrical conductivity. In contrast, carbon is a dielectric material in its bulk form; however, it shows anomalous Pauli enhanced magnetism at 300 K due to the presence of disorder when transformed into a nanostructure. The system of Fe and NC as a composite offered a strong magneto-dielectric coupling property compared to their individual counterparts. This effective medium has the following physical factors: (a) nature of the coupling between NC, Fe, and oxide phases of Fe exhibits high intrinsic magnetic polarization, which is capable of arresting the incident field wiggles, (b) magneto-dielectric synergistic effects increase with Fe content, (c) interfacial polarization and multiple scattering exist in the high frequency regime, typically, 10–12 GHz, which leads to the absorption and exhaustion of the microwave power, and (d) presence of multicomponent elements (Fe, C, and O) results in flat and broad band absorption characteristics, i.e., S11 and S12. This is mainly due to the emergence of magneto-dielectric dipoles at the Fe/NC interface.14–17,25–27
3.5 Dallenbach return loss: the coating characteristics
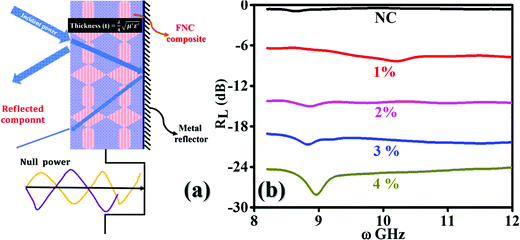
The Dallenbach absorption technique provides a type of onset remedy to reduce the radar signatures of an object from sharp angles, edges, and cones, where these features exist on aircraft, submarines, drones, tanks, etc. These metallic surfaces are the origin of high reflections. Dallenbach absorption measurements were performed on NC and the (1–4%) FNC composite using a typical scattering set up, as schematically shown in Fig. 12(a). Here, a metallic support is attached to one end of the nanocomposite absorber block. By considering the extracted constitutive parameters of the composite, one could minimize the reflection for a preferred frequency there by optimizing the thickness to . Broadly, the return loss is a typical absorption property of a coating with characteristic dip RL (min) at a frequency called the matching frequency, fm, of the coat. The thickness of the absorber can be set by determining the position of fm, given that they are inversely correlated. A value of RL of −10 dB has 90% absorption, −20 dB shows 99% and −30 dB has 99.9% absorption for the transmitted electromagnetic wave reflected back to the receiver.
In a Dallenbach coating, scatterer obeys a destructive interference (null power) condition. Here, the incident signal that gets reflected from the second interface interferes with the incident signal to achieve a destructive interference pattern. In these interactions, the reflection mainly depends on the complex permittivity and permeability functions of the air/composite interface, which can be adjusted to a minimum returned power. The nulling of the power depends on the loss factors of μ′′, ε′′ and the thickness of the coating. This results in a type of resonant absorber, which can be readily be applied as a paint on military objects. In some places, these structures are enormously sharp in their geometrical shape with highly curved surfaces or small areas in terms of wavelength for the transmitted waves. Dallenbach coatings are very slim and trim compared to other similar classes of absorbers such as Salisbury (graded) and Jaumann (resonant) coats. Moreover, these coatings can easily be chosen in the absence of the bandwidth specifications.
Fig. 12(b) displays the RL spectra recorded for NC and the (1–4%) composites in the range of 8–12 GHz. The return loss for NC and 1% FNC are in the range of 0–10 dB, revealing the maximum reflection of the incident power. As the content of iron increased, the magnitude of RL gradually increased. For 2–3% FNC, the RL was observed to be in the range of 15–20 dB, which shows a significant return loss up to 50–60%. Correspondingly, the matching frequency is seen to be quiet broad, covering the entire X-band. For the highest Fe composition, i.e., 4%, the recorded profile is somewhat sharp with >99% power absorption and matching frequency located at ∼9.10 GHz. On incidence, electromagnetic signals interact with the fabricated nanocomposite surface. The charge carriers and polar moieties present in the matrix offer a response to the incident field and show the Coriolis precision. This drift induces a magnetic field, and consequently magnetic currents, which are responsible for inducing losses in the incident field, termed the eddy current loss, producing resistive heating. These loopy currents in the surface region of the composite lead to the emergence of a secondary small magnetic field. This field opposes the incident field, causing the reflection of the incident power. Thus, the observed increase in the loss of reflection magnitude with an increase in the iron content is attributed to the larger and symmetric eddy loops associated with the polarizations of larger carbon chains within the composites. Further, the absorption of power at the air/composite interface can also be attributed to the larger values of the magneto-dielectric losses of the composites, which obey the effective diffraction condition:  , as shown in Fig. 12(a). Therefore, two partially reflected electromagnetic waves are generated with a phase of 180° apart with respect to the transmitted signal, resulting in a response, as shown in Fig. 12(b). In our loss studies, for NC, a very shallow peak was observed below 9 GHz, where for the 1% composite, the peak shifted to 10.00 GHz, whereas for the 2% and 3% composites, the peak emerged below 9.0 GHz and for the 4% composite it is located at ∼9.10 GHz.
Our studies revealed that the molar polarization of the composite matrix is modified with an increase in magnetic inclusions. The obtained constitutive parameters played a pivotal role in analysing the microwave power dissipation, in which the real part represents the storage capability and the imaginary part symbolizes the dissipation of the incident power.19,21,24,28 Both imaginary components were observed to increase with an increase in Fe%, thereby maintaining a flat behaviour of RL without any significant variations. This revealed that the dissipation capability of both the electric and magnetic components is quite stable over 8–12 GHz for the 1–4% FNC composites. The obtained values of ε′′ and ε′ were observed to be in proportion to the ac conductivity and obey Jonscher's exponent law. The individual nanoparticles in NC are connected randomly, resulting a low magnitude of electric conductivity. However, the inclusion of iron enhanced the values of ε′′ and ε′ quite dramatically. We speculate that Fe is responsible for enhancing the interconnections on NC, which in turn optimized the impedance matching condition, thereby prompting the electromagnetic power to enter the composite absorber and dissipate to a greater extent. Briefly, for permeability behaviour, the gradual increase in μ′′ and μ′ reveals strengthening of the magnetic coupling with the dielectric component, which favours impedance match at a high iron content. Consequently, magneto-dielectric polarization seems to be oriented along the iron phases in a charge-symmetric mode, which influenced the behaviour of scattering for the composites at a higher iron content. Broadly, these modes seem to be enhanced the return losses, making the 4% composite the most promising candidate for shield applications.
4. Conclusion
For strategic applications, nanocomposite architectures with superior shielding properties are of utmost importance. Nanocarbon and ferro–nanocarbon composites were prepared via a facile, solid-state sublimation technique and characterized using X-ray diffraction, infrared, UV-visible, and energy dispersive X-ray spectroscopy including scanning electron microscopy, and vibrating sample magnetometry. During the combustion stage, the inclusion of iron generated various oxide phases, which were found to be well dispersed in the NC network to form an asymmetric stretching bond between the iron and carbon molecules through the bridging oxygen. Thus, charge carriers were supplied from iron to the oxygen and carbon, resulting long-range electronic polarization in the FNC network. The field measurements carried out in a coaxially symmetric and a rectangular waveguide mode in the range of 8–12 GHz revealed the scattering behaviour of the fabricated NC/FNC composite. The dc conductivity increased by a factor of two, whereas the dielectric constant and ac conductivity were observed to increase by more than five times in the range of 8–12 GHz. The magneto-dielectric coupling increased by 30+%, whereas the port S11 and S12 analysis showed that the % reflection loss increased from 5% to 99% with a gradual enrichment in the iron content. The impedance value was reduced by ∼33% with more than 50% increase in the skin depth, attaining a value ∼1.3 μm at 4%. The skin resistance was observed to be reduced by almost 30% with a high (i.e., >90%) standing wave ratio. Broadly, the designed shield offers synergistic magneto-dielectric polarization, providing 99+% shielding effectiveness with an infinite bandwidth in the X-band, while the return loss achieved was ∼99% at 9.01 GHz matching frequency.Conflicts of interest
There are no conflicts to declare.Acknowledgements
PSA is thankful to Prof. (Dr) Raghavendra P. Tiwari, Vice-chancellor, and Prof. (Dr) R. K. Wusrika, Dean Academic, CU Punjab for giving permission to carry out research work at DMSRDE-DRDO, Kanpur, UP. PSA and HBB are thankful to Dr Eswara Prasad, Distinguished Scientist, and Director, and Dr S. M. Abbas, Senior Scientist, for giving permissions to conduct experiments and technical work at the establishment of DMSRDE-DRDO, Kanpur, UP. Authors are also thankful to Dr Alok Dixit, Scientist, and Head, Department of Strategic Materials, and Mr Ashish Dubey, Scientist for their scientific discussions in performing these studies.References
- M. Ziegler, Phys. Teach., 2012, 50, 251–252 CrossRef.
- E. F. Knott, J. F. Shaeffer and M. T. Tuley, Radar Cross Section, SciTech, Raleigh, NC, 2nd edn, 2004 Search PubMed.
- L. F. Chen, C. K. Ong, C. P. Neo, V. V. Varadan and V. K. Varadan, Microwave electronics: measurement and materials characterization, John Wiley & Sons. 2004 Search PubMed.
- T. Wang, R. Han, G. Tan, J. Wei, L. Qiao and F. Li, J. Appl. Phys., 2012, 112, 104903 CrossRef.
- J. Sun, W. Wang and Q. Yue, Materials, 2016, 9, 231 CrossRef PubMed.
- J. F. Kiang, Novel Technologies for Microwave and Millimeter—Wave Applications, Springer Science & Business Media, 2013 Search PubMed.
- T. Yun, H. Kim, A. Iqbal, Y. S. Cho, G. S. Lee, M. K. Kim, S. J. Kim, D. Kim, Y. Gogotsi, S. O. Kim and C. M. Koo, Adv. Mater., 2020, 32, 1906769 CrossRef CAS PubMed.
- P. P. Kuzhir, A. G. Paddubskaya, M. V. Shuba, S. A. Maksimenko and S. Bellucci, Electromagnetic Shielding Efficiency in Ka-band: Carbon Foam Versus Epoxy/Carbon Nanotube Composites, J. Nanophotonics, 2012, 6, 061715 CrossRef.
- S. Gupta and N. H. Tai, Carbon Materials and Their Composites for Electromagnetic Interference Shielding Effectiveness in X-band, Carbon, 2019, 14278 Search PubMed.
- F. Shahzad, M. Alhabeb, C. B. Hatter, B. Anasori, S. M. Hong, C. M. Koo and Y. Gogotsi, Science, 2016, 353, 1137 CrossRef CAS PubMed.
- X. Yin, L. Kong, L. Zhang, L. Cheng, N. Travitzky and P. Greil, Int. Mater. Rev., 2014, 59, 326–355 CrossRef CAS.
- W. Duan, X. Yin, C. Luo, J. Kong, F. Ye and H. Pan, J. Eur. Ceram. Soc., 2017, 37, 2021–2030 CrossRef CAS.
- H. Xu, X. Yin, M. Zhu, M. Han, Z. Hou, X. Li, L. Zhang and L. Cheng, ACS Appl. Mater. Interfaces, 2017, 9, 6332–6341 CrossRef CAS PubMed.
- M. Li, X. Fan, H. Xu, F. Ye, J. Xue, X. Li and L. Cheng, J. Mater. Sci. Technol., 2020, 59, 164–172 CrossRef.
- R. C. Che, L. M. Peng, X. F. Duan, Q. Chen and A. X. Liang, Adv. Mater., 2004, 16, 401–405 CrossRef CAS.
- T. H. Lee, T. H. LeePlanar microwave engineering: a practical guide to theory, measurement, and circuits, Cambridge university press, 2004, vol. 1 Search PubMed.
- T. Qiu, J. G. Yang, X. J. Bai and Y. L. Wang, RSC Adv., 2019, 9, 12737–12746 RSC.
- M. Niculescu and P. Budrugeac, Rev. Roum. Chim., 2013, 58, 381–386 CAS.
- Y. Zhang, Z. Yang and B. Wen, Adv. Mater. Interfaces, 2019, 06, 1900375 CrossRef.
- H. Hammani, W. Boumya, F. Laghrib, A. Farahi, S. Lahrich, A. Aboulkas and M. A. El Mhammedi, J. Assoc. Arab Univ. Basic Appl. Sci., 2017, 24, 26–33 Search PubMed.
- M. Sanati and A. Andersson, J. Mol. Catal. B: Enzym., 1993, 81, 51–62 CrossRef CAS.
- S. Uran, A. Alhani and C. Silva, AIP Adv., 2017, 7, 035323 CrossRef.
- A. K. Jonscher, Dielectric Relaxation in Solids, Chelsea Dielectric, London, 1979 Search PubMed.
- A. K. Jonscher, Nature, 1977, 267, 673–679 CrossRef CAS.
- Q. Liu, Q. Cao, H. Bi, C. Liang, K. Yuan, W. She, Y. Yange and R. Che, Adv. Mater., 2016, 28, 486–490 CrossRef CAS PubMed.
- C. L. Bennett and G. F. Ross, Proc. IEEE, 1978, 66, 299–318 Search PubMed.
- W. B. Weir, Proc. IEEE, 1974, 62, 33–36 Search PubMed.
- C. Yang, Y. Qing, K. An, Z. Zhang, L. Wang and C. Liu, Mater. Chem. Phys., 2017, 195, 149–156 CrossRef CAS.
Footnote |
| † Electronic supplementary information (ESI) available. See DOI: 10.1039/d1ma00977j |
| This journal is © The Royal Society of Chemistry 2022 |

