 Open Access Article
Dielectric switching from a high temperature plastic phase transition in two organic salts with chiral features†
Tingting
Ying
,
Yanle
Huang
,
Ning
Song
,
Yuhui
Tan
 *,
Yunzhi
Tang
 *,
Zhen
Sun
,
Jiachang
Zhuang
and
Xingxian
Dong
Faculty of Materials Metallurgy and Chemistry, Jiangxi University of Science and, Technology, Ganzhou 341000, Jiangxi Province, P. R. China. E-mail: tyxcn@163.com; tangyunzhi75@163.com
First published on 21st December 2021
Abstract
Organic ionic plastic crystals (OIPCs) with high-temperature reversible dielectric switching properties, single chiral characteristics, and the potential for various structural phase transformations provide more possibilities for obtaining different functional properties. Here, we successfully synthesized two organic ionic plastic crystals, namely [N(CH2CH3)3(CH2Cl)][ClO4] (1) and [N(CH2CH3)3(CH2Cl)][BF4] (2), which have two continuous reversible transitions triggered by the order and disorder of anions and ammonium ions. Interestingly, the dielectric constant of 2 is significantly higher than that of 1 under the same conditions. Impedance testing suggests that the arc radius of 2 is smaller than that of 1, indicating that 2 has a faster photogenerated charge carrier rate and greater conductivity. In addition, adopting the chiral space group P3221, 1 and 2 showed obvious CD signals. These two chiral compounds with high-temperature dielectric switching provide new ideas for the design of new phase transition compounds and for the exploration of ionic-crystal-based multifunctional organic materials.
Introduction
Solid–solid plastic phase transition materials can be utilized in many interesting fields.1–4 Among the available materials, temperature-triggered responsive dielectric switchable materials that can undergo transitions between high and low dielectric states at a phase transition temperature in response to a temperature stimulus are promising materials for use in data communication, signal processing, tunable dielectric devices, etc.5–8 The construction of hybrid metal halides is usually an effective strategy for the synthesis of plastic phase transition materials, because they provide great opportunities for obtaining temperature-triggered reversible solid–solid phase transitions.9–11 So far, a large number of organic–inorganic hybrid metals have been found to support dielectric switching halides, but most of this family are based on organic ammonium with alkyl side chains, having very low phase transition temperatures and not plastic phase transitions, which restricts their application.12 For example, Liao et al. reported a lead-free hybrid halide semiconductor, [C6N2H18][SbI5], which exhibited marked switchable dielectric properties between low and high dielectric states at low temperatures of around 192.7 K.13 The structural phase transition of 1-methylpiperidinium triiodoplumbate(II) (MPIP) happens at a temperature of around 202 K.14 With 1-(cyclopentyl)-4-aza-1-azo-nia-bicyclo[2.2.2]octane as the organic component, the organic–inorganic hybrid compound C11H22Cl4MnN2 undergoes a reversible solid-state phase transition at 170 K.15Compared with traditional ordered crystals, the molecules and ions in plastic crystals maintain their periodic arrangement while exhibiting rotational movement around this position, and their orientation is disordered. Organic ionic plastic crystals (OIPCs) are usually found in compounds with spherical molecular structures, such as adamantane, tetrachloromethane, and cyclohexane.16–22 Most of the crystals that adopt this plastic phase belong to the cubic crystal system with the highest symmetry point group, Oh, where the molecules exhibit rotational motion and the molecular orientation sequence is lost, just like in a liquid. Plastic crystals usually undergo one or more solid–solid phase transitions when cooled, becoming a crystal phase with lower lattice symmetry in which the orientation of the molecules shows a certain degree of order.18,23,24 In addition to having basic scientific significance, organic ionic plastic crystals have recently attracted considerable interest for use as solid electrolytes because of their high ionic conductivity and good interfacial contact with electrodes. This is due to the inherently advantageous deformable mechanical properties of plastic crystals.25 Unfortunately, there are few reports on single-chiral organic ionic plastic crystal materials showing multistep high-temperature dielectric switching.
Generally speaking, the appearance of dielectric switching characteristics in organic ionic plastic crystals is inseparable from phase transitions. Phase transitions are accompanied by various photoelectric effects. The coupling of dielectric switching properties and other physical properties has introduced new concepts relating to electronic and optoelectronic applications. However, the discovery of organic ionic plastic crystals that combine chirality and dielectric switching characteristics has far-reaching significance and application prospects. Here, we prepared chloromethyl-triethylammonium chloride and synthesized two kinds of OIPCs, [N(CH2CH3)3(CH2Cl)][ClO4] (1) and [N(CH2CH3)3(CH2Cl)][BF4] (2), discussed their phase transition temperatures and structural changes, revealed the causes of switchable dielectric anomalies and plastic phase transitions, and further analyzed the reason why the dielectric constant of 2 is obviously greater than 1 through impedance testing. In addition, adopting the chiral space group P3221, 1 and 2 showed obvious CD signals. This discovery is helpful for the further study of high-temperature multistage switchable dielectrics based on organic plastic materials and can promote the development of diverse multifunctional materials.
Experimental
Synthesis
All reagents and solvents used for synthesis are of reagent grade and can be used without further purification. The experiment is mainly carried out in two steps (Fig. S1, ESI†). The first step is the synthesis of the precursor. 50 mL of triethylamine is measured and poured into a round-necked flask, and then 100 mL of dichloromethane is added as a solvent; the flask is placed in a water bath, heated and stirred at a constant temperature of 343 K for 72 hours, then the mixture is filtered and the clear liquid is left to volatilize into a white solid and dried to become the precursor chloromethyl-triethylammonium chloride. In the second step, 0.2000 g of the precursor is weighed and dissolved in 15 mL of absolute ethanol, then 8–10 drops of perchloric acid are added, and the mixture is stirred for 30 min and filtered to obtain a colorless solution. After a few days, colorless needle-like crystals are obtained, which are compound 1 (Fig. 1a); perchloric acid is replaced with fluoroboric acid to obtain compound 2 (Fig. 1b). Elemental analysis calc. (%) for compound 1 (C7H17Cl2NO4): C, 22.70; H, 4.631; N, 3.785; found (%): C, 22.52; H, 4.712; N, 3.718; compound 2 (C7H17ClNBFO4): C, 23.50; H, 4.794; N, 3.919; found (%): C, 23.36; H, 4.823; N, 3.865.Single-crystal X-ray diffraction
Single crystal X-ray diffraction (SCXRD) analysis of compound 1 was carried out using a Rigaku Oxford diffractometer with Mo Kα radiation (λ = 0.71073 Å). The structures were solved via direct methods and confirmed via the full-matrix method based on F2 using the SHELXTL software packing. The crystallographic information for 1 and 2 determined at 293 K and 450 K/420 K has been deposited in CIF format with the Cambridge Crystallographic Database Center as ESI† (1-I: CCDC 2074878; 1-II: CCDC 2074879; 2-I: CCDC 2074880; 2-II: CCDC 2074881).Solid-state CD spectra
The solid-state CD spectra of the title compounds were recorded using a Jasco-1500 CD spectropolarimeter at 298 K in the wavelength range of 200–250 nm. The CD spectra were obtained from the resulting complexes as crystals (ca. 0.4 mg) in 100 mg of oven-dried KBr made into disks of 0.3 mm thickness.DSC and TGA measurements
DSC measurements were performed using a PerkinElmer Diamond DSC instrument via heating and cooling crystalline samples of compounds 1 (6.2 mg) and 2 (7.6 mg) at a rate of 20 K min−1 over the temperature range of 298–460 K. The samples were placed in aluminum crucibles under nitrogen under atmospheric pressure. Thermogravimetric analysis (TGA) measurements were performed using a TA-Instruments STD2960 system from room temperature to 1050 K under a nitrogen atmosphere at a rate of 10 K min−1.Dielectric constant measurements
Temperature-dependent dielectric measurements were carried out using pressed powder pellets using a TH2828A instrument between 298 and 485 K over the frequency range from 500 Hz to 1 MHz under an applied electric field of 1 V. The sample heating/cooling rate was 10 K min−1 under a nitrogen atmosphere. Pressed powder pellets sandwiched between two parallel copper electrodes with silver-conducting glue were used for dielectric studies.UV-Vis absorption spectra
UV-Vis absorption spectra were obtained using a Shimadzu (Tokyo, Japan) UV-2550 spectrophotometer in the range of 300–700 nm. Powder crystals were used for measurements.Results and discussion
Phase transitions
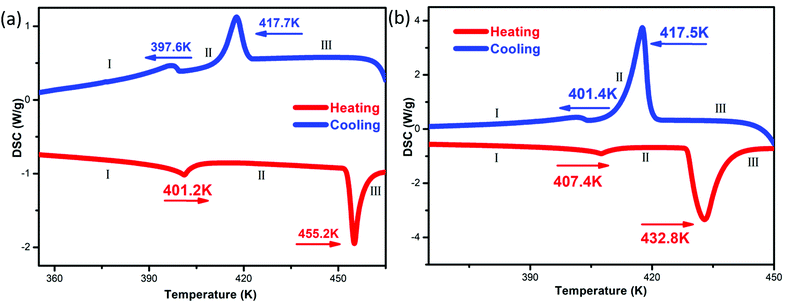
Differential scanning calorimetry (DSC) measurements can be used to measure the endothermic and exothermic processes during reversible phase transition processes.26,27 The DSC curves of compounds 1 and 2 show that they undergo two reversible phase transitions above room temperature, and we recorded the states before and after the second phase transition point of the compounds as I–III (Fig. 2). The corresponding transition temperatures (1![[thin space (1/6-em)]](https://www.rsc.org/images/entities/char_2009.gif) :
:![[thin space (1/6-em)]](https://www.rsc.org/images/entities/char_2009.gif) 401.2/455.2 K; 2
401.2/455.2 K; 2![[thin space (1/6-em)]](https://www.rsc.org/images/entities/char_2009.gif) :
:![[thin space (1/6-em)]](https://www.rsc.org/images/entities/char_2009.gif) 407.4/432.8 K) were estimated during the heating run, and both have larger thermal hysteresis (1: ∼37.8 K; 2: ∼15.3 K) at the second phase transition point. For compounds 1 and 2, phase III is a plastic crystal phase with cubic crystal symmetry. The large entropy change values at the II/III transition (1: ∼13.66 J mol−1 K−1; 2: ∼35.13 J mol−1 K−1) are consistent with this idea. The differences in the DSC curves of 1 and 2 may be due to their different anions. Based on the Boltzmann equation ΔS = R
407.4/432.8 K) were estimated during the heating run, and both have larger thermal hysteresis (1: ∼37.8 K; 2: ∼15.3 K) at the second phase transition point. For compounds 1 and 2, phase III is a plastic crystal phase with cubic crystal symmetry. The large entropy change values at the II/III transition (1: ∼13.66 J mol−1 K−1; 2: ∼35.13 J mol−1 K−1) are consistent with this idea. The differences in the DSC curves of 1 and 2 may be due to their different anions. Based on the Boltzmann equation ΔS = R![[thin space (1/6-em)]](https://www.rsc.org/images/entities/i_char_2009.gif) ln(N), where R represent the gas constant with a value of 8.314 and N is the ratio of the number of respective geometrically distinguishable orientations, during the heating–cooling cycle, the N values of compounds 1 and 2 are both significantly greater than 1, indicating that both compounds 1 and 2 undergo two order–disorder phase transitions. In addition, thermal stability testing of compounds 1 and 2 showed that the melting points of compounds 1 and 2 were 521 K and 496 K, respectively, and based on the TG-DTA curves, it was shown that compounds 1 and 2 did not decompose below 528 K (Fig. S3, ESI†).
ln(N), where R represent the gas constant with a value of 8.314 and N is the ratio of the number of respective geometrically distinguishable orientations, during the heating–cooling cycle, the N values of compounds 1 and 2 are both significantly greater than 1, indicating that both compounds 1 and 2 undergo two order–disorder phase transitions. In addition, thermal stability testing of compounds 1 and 2 showed that the melting points of compounds 1 and 2 were 521 K and 496 K, respectively, and based on the TG-DTA curves, it was shown that compounds 1 and 2 did not decompose below 528 K (Fig. S3, ESI†).
Crystal structures
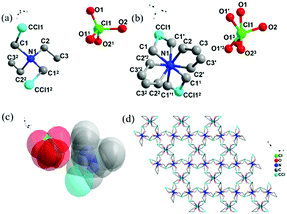
Single-crystal X-ray diffraction analysis shows that phase I and phase II of compound 1 crystallized in different chiral space groups, P3221 and P3121, respectively, while the symmetry elements (E, 2C3, 3C2) did not change, so no symmetry breaking occurred (Table S1, ESI†). As shown in Fig. 2a and b, the asymmetric unit of 1 is composed of perchloric acid and chloromethyl-triethylamine in phases I and II. The two atoms at the end of the carbon chain of the chloromethyl-triethylamine ion in the phase I structure are disordered in terms of the C/Cl orientation, and the other atoms and perchlorate are all ordered. However, [ClO4]− shows a distorted tetrahedral configuration, with Cl–O bond lengths ranging from 1.312(14)–1.390(10) Å and O–Cl–O angles ranging from 91(3)° to 119.8(13)° (Table S1, ESI†).28 In contrast to the phase I structure, the degree of disorder of the phase II structure increases; two oxygen atoms (O1 and O4) on the perchlorate and all the carbon atoms in the ammonium cation are oriented in a disordered manner in two directions. This is the root cause of the reversible phase transition of compound 1 from I–II. Different from compound 1, both phase I and II of compound 2 crystallized in the triangular chiral space group P3221. As shown in Fig. S4a and S4b (ESI†), the asymmetric unit of 2 is composed of tetrafluoroborate acid and a chloromethyl-triethylamine cation in phase I and II. Compared with phase I, phase II has a greater degree of disorder. Except for the tetrafluoroborate anion, which is still double-disordered, the carbon atoms connected to the nitrogen atom have changed from an ordered state to a double-disordered state.Due to the poor quality of the diffraction data from compounds 1 and 2 in phase III, we cannot solve the complete crystal structures; instead we can only obtain a rough highly symmetric structure with highly disordered cations and anions (Fig. 3c and Fig. S4c, ESI†). The orientations of both ions are fully disordered, which was attributed to their isotropic rotator motion in the crystals. Compounds 1 and 2 have undergone orderly and disordered phase transitions and the stacking diagrams of their phase I and II structures also show different patterns, e.g., the stacking of the phase II structures of compounds 1 and 2 along the C axis presents beautiful flower-like patterns (Fig. 3d and Fig. S4d, ESI†).
Powder X-ray diffractometry (PXRD)
Due to the poor crystal quality, phase III single crystals of 1 and 2 of sufficient quality for single-crystal X-ray diffraction analysis were not obtained, so temperature-variable powder X-ray diffractometer analysis was used to confirm the structural phase transitions of compounds 1 and 2 (Fig. 4). Compared with the diffraction peaks at room temperature, the diffraction peaks of compound 1 in phase I and II show almost no obvious changes. It may be that the structures of phase I and II involve no symmetry breaking, so there are no obvious changes in the diffraction peaks. However, for phase III, many diffraction peaks (such as the diffraction peaks at 14.1, 24.8, 26.3, 27.1, 31.3, and 33.6°) disappeared, and when cooling back to 300 K, the PXRD pattern returns to that recorded for the starting material. Similar variations in the PXRD patterns also occur for compound 2, which indicates that for phase III of compounds 1 and 2, after the phase transition, the structure of the lattice is highly symmetrical. Via comparing the PXRD patterns of compounds 1 and 2 tested at room temperature with the calculated patterns from the single crystal data of compounds 1 and 2 measured at 293 K, it can be seen that both compounds 1 and 2 are pure phases (Fig. S5, ESI†).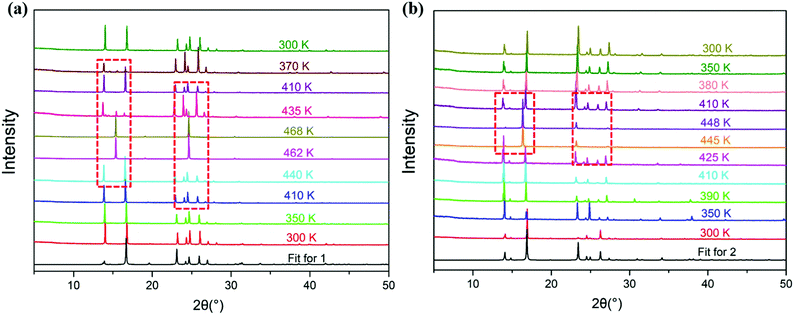 | ||
| Fig. 4 The temperature-dependent powder X-ray diffraction patterns of compounds 1 (a) and 2 (b) (experimental). | ||
Dielectric properties
The study of dielectric anomalies has been proved to be another simple and effective avenue for investigating phase transitions, as the macroscopic dielectric response is sensitive to variations in the microscopic structure. The dielectric constants of polycrystalline pellets of compounds 1 and 2 were measured as a function of temperature in the range of 5 kHz–1 MHz (Fig. 5), and the results indicate that there are two noticeable reversible medium-sized anomalies for both compounds 1 and 2 upon carrying out heating and cooling cycling, corresponding to the DSC results. It is worth noting that the dielectric constants of compound 2 are always significantly greater than those of compound 1.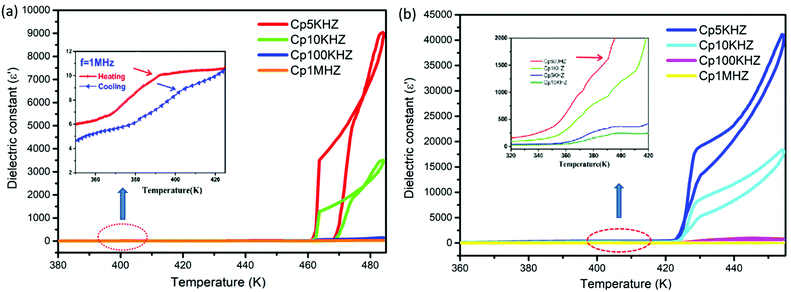 | ||
| Fig. 5 Temperature-dependent dielectric constants at 500 Hz–1 MHz during heating and cooling for compounds 1 (a) and 2 (b). | ||
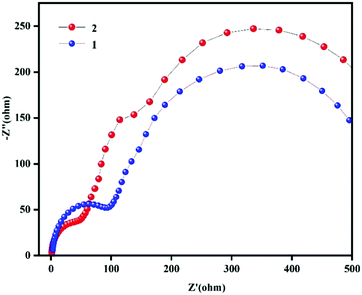
The biggest difference between OIPCs and ordinary ionic liquid crystals is related to plasticity. The ionic motion and ionic conductivity of OIPCs are attributed to vacancies and defects in the materials. The properties of the cations and anions have an impact on the ionic conductivities of plastic crystals. Koops et al. described the dielectric constant as the reciprocal of the square root of resistivity.29 In order to explore the reason why the dielectric constants of compound 2 are significantly greater than those of compound 1, we carried out impedance testing of compounds 1 and 2. From the impedance spectra (Fig. 6), we can see that the radius of the arc of compound 2 is smaller than that of compound 1, which indicates that the charge carrier transfer rate of compound 2 is faster and the conductivity is also faster.30–32 The increase in the dielectric constant can also be understood as an increase in conductivity.33 There is a direct relationship between the charge carrier density and an increase in a large dielectric constant.34–36 Therefore, the increase in the large dielectric constants of compounds 1 and 2 may be caused by an injection of charge carriers due to a plastic phase transition. The application of high-permittivity materials provides the possibility to solve problems related to the limiting of gate oxide thickness due to the shrinking of the size of current semiconductor devices. At the same time, the special physical properties of high-permittivity materials can be used to realize new devices with special properties.37,38
Chiral properties
Single crystal X-ray diffraction data indicate that compounds 1 and 2 were crystallized in the chiral space group P3221 with the Flack parameters 0.06(5) and 0.1(6) at room temperature. The Cotton effect is common in chiral compounds. In order to further verify the single chirality of compounds 1 and 2, the chiral features of compounds 1 and 2 were investigated via solid-state CD spectroscopy. The measured CD spectra of compounds 1 and 2 (Fig. 7) exhibit clustered CD signals (Δε) corresponding to absorption, where a positive Cotton effect indicates that compounds 1 and 2 have single chiral structures, corresponding to the single crystal structure results described above. As is well known, monochiral materials are indispensable materials due to their fragrance and electromagnetic properties,39,40 and examples include [R-MP]PbX3 (R-MP = R-2-methylpiperidinium, X = Br and I) as reported by Liao et al.41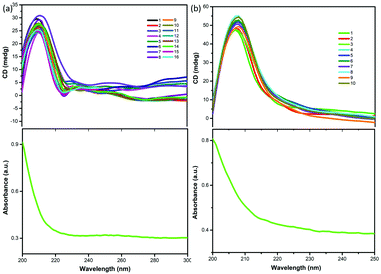 | ||
| Fig. 7 Solid-state CD spectra of compounds 1 (a) and 2 (b) and the corresponding absorption spectra at room temperature. | ||
Conclusions
In summary, we have found two OIPCs, [N(CH2CH3)3(CH2Cl)][ClO4] and [N(CH2CH3)3(CH2Cl)][BF4], which undergo structural phase transitions at high temperatures that are accompanied by obvious medium-sized two-step switchable responses. It is found that 1 and 2 have high-temperature reversible dielectric switching characteristics (1![[thin space (1/6-em)]](https://www.rsc.org/images/entities/char_2009.gif) :
:![[thin space (1/6-em)]](https://www.rsc.org/images/entities/char_2009.gif) 401.2/455.2 K; 2
401.2/455.2 K; 2![[thin space (1/6-em)]](https://www.rsc.org/images/entities/char_2009.gif) :
:![[thin space (1/6-em)]](https://www.rsc.org/images/entities/char_2009.gif) 407.4/432.8 K), single chirality (chiral space group: P3221), and obvious structural phase transitions. Through systematic testing and exploration, the reasons for the phase transitions of compounds 1 and 2 were revealed. This work provides a method for accelerating the search for new organic ionic plastic multifunctional materials with new phase transitions and innovative physical properties, and this will promote the widespread application of new sequentially switchable dielectric materials based on OIPCs for use in energy storage and other fields.
407.4/432.8 K), single chirality (chiral space group: P3221), and obvious structural phase transitions. Through systematic testing and exploration, the reasons for the phase transitions of compounds 1 and 2 were revealed. This work provides a method for accelerating the search for new organic ionic plastic multifunctional materials with new phase transitions and innovative physical properties, and this will promote the widespread application of new sequentially switchable dielectric materials based on OIPCs for use in energy storage and other fields.
Conflicts of interest
There are no conflicts to declare.Acknowledgements
This work was supported by the National Nature Science Foundation of China (Grant nos 21761013, 21671086, 21461010, and 21471070) and the Science and Technology Bureau project of Ganzhou.References
- C. R. Huang, X. Luo, W. Q. Liao, Y. Y. Tang and R. G. Xiong, Inorg. Chem., 2020, 59, 829–836 CrossRef CAS PubMed.
- Y. Z. Tang, Y. Liu, J. X. Gao, C. F. Wang, B. Wang, Y. H. Tan and H. R. Wen, RSC Adv., 2017, 7, 41369–41375 RSC.
- N. Song, S. P. Chen, X. W. Fan, Y. H. Tan, W. J. Wei and Y. Z. Tang, ACS Omega, 2020, 5, 6773–6780 CrossRef CAS PubMed.
- K. Yang, C. S. Yang, X. X. Dong, Y. H. Tan, Y. Z. Tang and W. J. Wei, Chemistry, 2020, 26, 5887–5892 CrossRef CAS PubMed.
- X. X. Dong, N. Song, B. Huang, Y. H. Tan, Y. Z. Tang, W. J. Wei, Y. K. Li and Q. Shu, Inorg. Chim. Acta, 2021, 515, 120051–120058 CrossRef CAS.
- C. F. Wang, H. Li, M. G. Li, Y. Cui, X. Song, Q. W. Wang, J. Y. Jiang, M. M. Hua, Q. Xu, K. Zhao, H. Y. Ye and Y. Zhang, Adv. Funct. Mater., 2021, 31(13), 2009457–2009464 CrossRef CAS.
- T. T. Ying, Y. K. Li, N. Song, Y. Tan, Y. Tang, J. Zhuang, H. Zhang and L. Wang, Chem. – Asian J., 2021, 16, 3664–3668 CrossRef CAS PubMed.
- I. Buta, M. A. Nistor, P. Lönnecke, E. Hey Hawkins, S. G. Muntean and O. Costisor, J. Photochem. Photobiol., A, 2021, 404, 112961–112967 CrossRef CAS.
- H. Y. Zhang, Z. X. Zhang, X. J. Song, X. G. Chen and R. G. Xiong, J. Am. Chem. Soc., 2020, 142, 20208–20215 CrossRef CAS PubMed.
- K. Yang, X. X. Dong, Q. Xu, Y. H. Tan and Y. Z. Tang, Appl. Mater. Today, 2020, 20, 100687–100693 CrossRef.
- X. G. Chen, X. J. Song, Z. X. Zhang, H. Y. Zhang, Q. Pan, J. Yao, Y. M. You and R. G. Xiong, J. Am. Chem. Soc., 2020, 142, 10212–10218 CrossRef CAS PubMed.
- Y. Sui, Y. S. Zhong, J. J. Wang, Q. Xia, L. J. Wang and D. S. Liu, J. Mater. Chem. C, 2019, 7, 14294–14300 RSC.
- J. X. Gao, X. N. Hua, X. G. Chen, G. Q. Mei and W. Q. Liao, Inorg. Chem., 2019, 58, 4337–4343 CrossRef CAS PubMed.
- A. Zeb, Z. Sun, A. Khan, S. Zhang, T. Khan, M. A. Asghar and J. Luo, Inorg. Chem. Front., 2018, 5, 897–902 RSC.
- Z. X. Wang, P. F. Li, W. Q. Liao, Y. Tang, H. Y. Ye and Y. Zhang, Chem. – Asian J., 2016, 11, 981–985 CrossRef CAS PubMed.
- M. Matsuki, T. Yamada, N. Yasuda, S. Dekura, H. Kitagawa and N. Kimizuka, J. Am. Chem. Soc., 2018, 140, 291–297 CrossRef CAS PubMed.
- P. F. Li, Y. Y. Tang, Z. X. Wang, H. Y. Ye, Y. M. You and R. G. Xiong, Nat. Commun., 2016, 7, 13635–13642 CrossRef CAS PubMed.
- J. Harada, Y. Kawamura, Y. Takahashi, Y. Uemura, T. Hasegawa, H. Taniguchi and K. Maruyama, J. Am. Chem. Soc., 2019, 141, 9349–9357 CrossRef PubMed.
- Y. K. Li, D. C. Han, T. T. Ying, Y. Z. Tang, Y. H. Tan, W. J. Wei, P. K. Du and H. Zhang, Cryst. Growth Des., 2021, 21, 4426–4434 CrossRef CAS.
- W. Q. Liao, H. Y. Ye, Y. Zhang and R. G. Xiong, Dalton Trans., 2015, 44, 10614–10620 RSC.
- H. Kimata, R. Sumitani and T. Mochida, Chem. Lett., 2019, 48, 859–862 CrossRef CAS.
- T. Vijayakanth, F. Ram, B. Praveenkumar, K. Shanmuganathan and R. Boomishankar, Angew. Chem., Int. Ed., 2020, 59, 10368–10373 CrossRef CAS PubMed.
- J. Harada, T. Shimojo, H. Oyamaguchi, H. Hasegawa, Y. Takahashi, K. Satomi, Y. Suzuki, J. Kawamata and T. Inabe, Nat. Chem., 2016, 8, 946–952 CrossRef CAS PubMed.
- J. Harada, N. Yoneyama, S. Yokokura, Y. Takahashi, A. Miura, N. Kitamura and T. Inabe, J. Am. Chem. Soc., 2018, 140, 346–354 CrossRef CAS PubMed.
- Y. Sui, G. X. Zhang, W. Q. Wang, F. Hu, C. L. Liu, D. Luo and D. S. Liu, ChemistrySelect, 2019, 4, 3921–3925 CrossRef CAS.
- G. Q. Mei, H. Y. Zhang and W. Q. Liao, Chem. Commun., 2016, 52, 11135–11138 RSC.
- P. P. Shi, Q. Ye, Q. Li, H. T. Wang, D. W. Fu, Y. Zhang and R. G. Xiong, Chem. Mater., 2014, 26, 6042–6049 CrossRef CAS.
- S. Q. Lu, X. G. Chen, J. X. Gao, Y. Lu, X. N. Hua and W. Q. Liao, CrystEngComm, 2018, 20, 454–459 RSC.
- C. G. Koops, Phys. Rev., 1951, 83, 121–124 CrossRef CAS.
- N. A. Liedienov, A. V. Pashchenko, V. A. Turchenko, V. Y. Sycheva, A. V. Voznyak, V. P. Kladko, A. I. Gudimenko, D. D. Tatarchuk, Y. V. Didenko, I. V. Fesych, I. I. Makoed, A. T. Kozakov and G. G. Levchenko, Ceram. Int., 2019, 45, 14873–14879 CrossRef CAS.
- A. Singh, R. Chatterjee, S. K. Mishra, P. S. R. Krishna and S. L. Chaplot, J. Appl. Phys., 2012, 111, 014113–014118 CrossRef.
- P. Liang, Z. Yang, X. Chao, Z. Liu and X. M. Chen, J. Am. Ceram. Soc., 2012, 95, 2218–2225 CrossRef CAS.
- Y. Thakur, B. Zhang, R. Dong, W. Lu, C. Iacob, J. Runt, J. Bernholc and Q. M. Zhang, Nano Energy, 2017, 32, 73–79 CrossRef CAS.
- E. J. Juarez Perez, R. S. Sanchez, L. Badia, G. Garcia-Belmonte, Y. S. Kang, I. Mora-Sero and J. Bisquert, J. Phys. Chem. Lett., 2014, 5, 2390–2394 CrossRef CAS PubMed.
- V. P. Anju and S. K. Narayanankutty, Mater. Sci. Eng. B, 2019, 249, 114418–114428 CrossRef CAS.
- X. Lu, L. Zhang, Y. Tong and Z. Y. Cheng, Composites, Part B, 2019, 168, 34–43 CrossRef CAS.
- Y. Liu, C. L. Zhu, X. Y. Zheng, L. L. Qin, S. X. Yang and Z. Q. Liu, R. Soc. Open Sci., 2018, 5, 180738–180741 CrossRef CAS PubMed.
- H. Y. Ye, J. Z. Ge, Y. Y. Tang, P. F. Li, Y. Zhang, Y. M. You and R. G. Xiong, J. Am. Chem. Soc., 2016, 138, 13175–13178 CrossRef CAS PubMed.
- L. S. Li, Y. H. Tan, W. J. Wei, H. Q. Gao, Y. Z. Tang and X. B. Han, ACS Appl. Mater. Interfaces, 2021, 13, 2044–2051 CrossRef CAS PubMed.
- T. T. Ying, Y. H. Tan, Y. Z. Tang, X. Long, N. Song, Y. K. Li and Z. Sun, CrystEngComm, 2021, 23, 8104–8109 RSC.
- H. Peng, Y. H. Liu, X. Q. Huang, Q. Liu, Z. H. Yu, Z. X. Wang and W. Q. Liao, Mater. Chem. Front., 2021, 5, 4756–4763 RSC.
Footnote |
| † Electronic supplementary information (ESI) available: IR spectra, PXRD patterns, thermogravimetric graphs, piezoelectric test graphs, a table of crystallographic data, and calculations of ΔS and N. CCDC 2074878–2074881. For ESI and crystallographic data in CIF or other electronic format see DOI: 10.1039/d1ma01108a |
| This journal is © The Royal Society of Chemistry 2022 |


