 Open Access Article
Fluorescent Schiff base sensors as a versatile tool for metal ion detection: strategies, mechanistic insights, and applications
Manoj Kumar
Goshisht
 a,
Goutam Kumar
Patra
 b and
Neetu
Tripathi
 *c
*c
aDepartment of Chemistry, Government Naveen College Tokapal, Bastar, Chhattisgarh 494442, India
bDepartment of Chemistry, Faculty of Physical Sciences, Guru Ghasidas Vishwavidyalaya, Bilaspur (Chhattisgarh) 495009, India
cDepartment of Chemistry, Guru Nanak Dev University, Amritsar, Punjab 143005, India. E-mail: neetutripathi1990@yahoo.com; neetuchem1990@gmail.com
First published on 17th February 2022
Abstract
Metal ions exist globally. Therefore, the study of the design strategies, mechanistic insights, and applications of fluorescent Schiff base sensors for metal ion detection constitutes an active topic of research. Further, theoretical studies on these systems using various spectroscopic techniques add new flavor in terms of providing a better understanding of the photo-electronic properties of Schiff base sensors and their complexes with metals. The presented review article starts with the general introduction of fluorescent Schiff base sensors for metal ion detection, and consists of two main sections. The first section illustrates the strategies and different mechanistic insights into metal ion detection using Schiff base sensors. The second section demonstrates the application of fluorescent Schiff base sensors in metal ion sensing, biomedical imaging, environmental monitoring, and optoelectronic systems. Additionally, a summary of the reviewed fluorescent Schiff base sensors is presented in a table format. Finally, the conclusion and future scope of fluorescent Schiff base sensors for metal ion detections are discussed.
1. Introduction
The metal ions constitute an active topic of research owing to their global existence. In the human body, metal ions enjoy special status because of their participation in numerous biological processes. In our surroundings, metal ions are present in food, soil, and water.1 However, the presence of metal ions at concentrations above or below the permissible limit (Table 1) may cause hazardous effects on the environment and human beings.2–5 In the past, various methods such as inductively coupled plasma atomic emission spectroscopy, inductively coupled plasma mass spectroscopy, electrochemical detection, and ion chromatography have been reported for metal ion detection.6–10| Metal ion | In drinking water (mg l−1) | In human body | Ref. |
|---|---|---|---|
| Mg2+ | 50 | ∼300–400 mg day−1 | 3 and 5 |
| Ca2+ | 75 | — | 5 |
| Al3+ | 0.03 mg l−1 | 3–10 mg day−1 | 3 and 4 |
| Sn2+ | 1–2 μg l−1 | — | 2 |
| Pb2+ | 0.05 | 93.5 μg day−1 | 5 |
| Cr3+ | 0.05 | 50–200 mg day−1 | 4 |
| Mn2+ | 0.1 mg/l | 2.3 mg day−1 | 2–4 |
| Fe2+/Fe3+ | 0.3 | 8 mg day−1 | 3–5 |
| Co2+ | 0.001 | 5–40 μg day−1 | 3–5 |
| Ni2+ | 0.0008 | 80–130 μg day−1 | 3–5 |
| Cu2+ | 1.0 | 2 mg day−1 | 3–5 |
| Zn2+ | 5.0 | 8 mg day−1 | 3 and 4 |
| Hg2+ | 0.001–65 | — | 4 and 5 |
| Cd2+ | 0.005 | — | 4 and 5 |
However, these methods suffer from limitations such as inadequate practical applications, expensive instruments, time-consuming processes, complicated procedures, etc. Recently, significant attention has been paid to developing fluorescent chemosensors for metal ion detection owing to their excellent selectivity, sensitivity as well as rapid response time.4,11,12
In recent years, the design and synthesis of fluorescent chemosensors are of central importance because of their straightforward synthesis, tailor-made properties, and rapid, selective, and sensitive detection of the analyte on-site.13–19 Here, positive metal ion detection may result in visible color change, fluorescence color change, a shift in emission wavelength or intensity (blue-shift or red-shift) or may result in the appearance of new emission maxima.20–25 Fluorescent chemosensors for metal ion detection generally contain Schiff base,26–28 pyridine,29,30 pyrene,31,32 anthracene,33,34 quinoline,35,36 naphthalene,37 urea,38,39 coumarin,40,41 phenolphthalein,42,43 and rhodamine44,45 groups as the binding site. Among various fluorescent chemosensors, Schiff base-based sensors have shown outstanding results owing to their simple synthesis, and provide a suitable electronic and geometrical environment for coordination with single metal ions as well as with multiple metal ions simultaneously. Schiff bases commonly include hydrazone, acyl hydrazone, salicylimine, azine, and other groups, and provide nitrogen and oxygen atoms for coordination with metal ions.46–50 Schiff base-based chemosensors may show the aggregation-induced emission (AIE) phenomenon because of the free rotation around the C![[double bond, length as m-dash]](https://www.rsc.org/images/entities/char_e001.gif) N bond. Additionally, the excited-state intramolecular proton transfer (ESIPT) process was exhibited by chemosensors containing the salicylimine group.51–54
N bond. Additionally, the excited-state intramolecular proton transfer (ESIPT) process was exhibited by chemosensors containing the salicylimine group.51–54
Nowadays, Schiff base sensors and their complexes with metal ions have become a hot topic of research owing to their practical application in numerous scientific areas such as in environmental monitoring and in biological cell imaging of target ions within the cells, tissues, and organelles.4,55–59 Furthermore, the tailor-made and multi-stimuli responsive properties of Schiff bases enable their application in optoelectronic systems.60–62 The molecular switching properties of Schiff base sensors have been applied in the construction of molecular keypads and logic gates.63,64
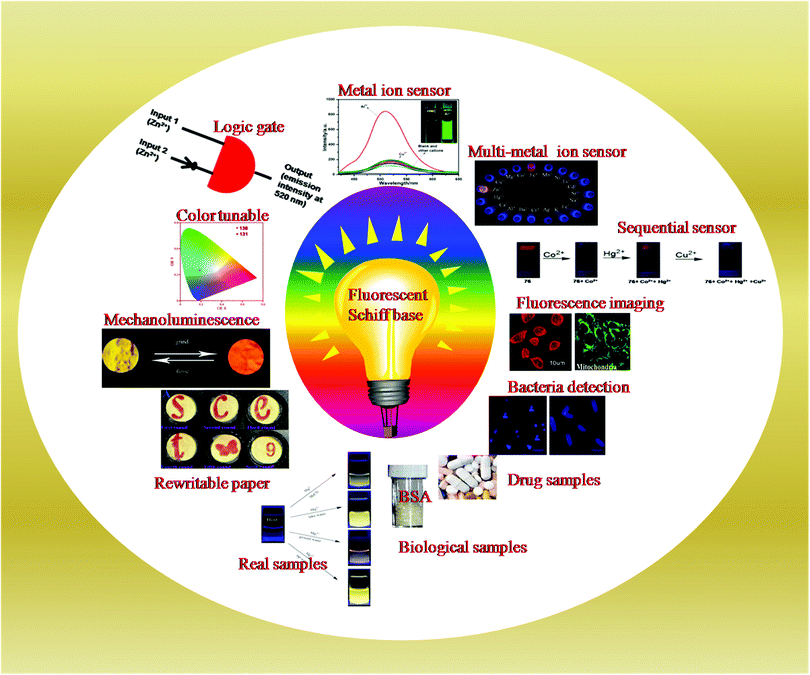
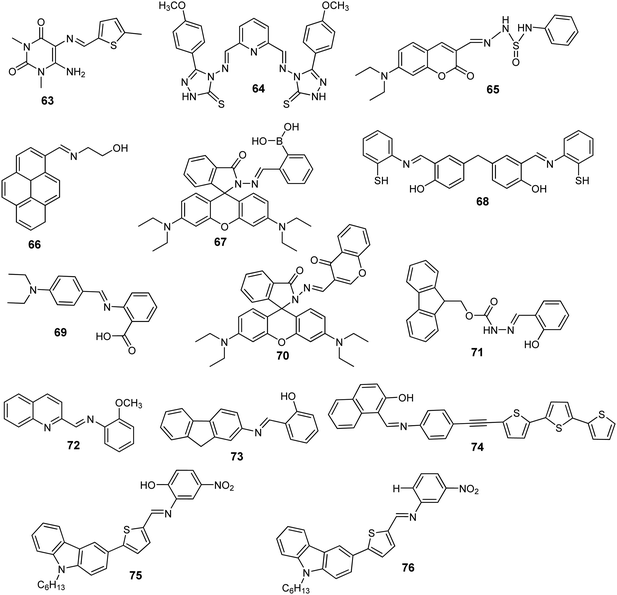
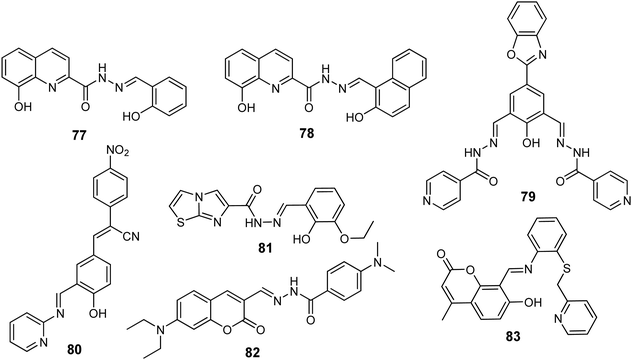
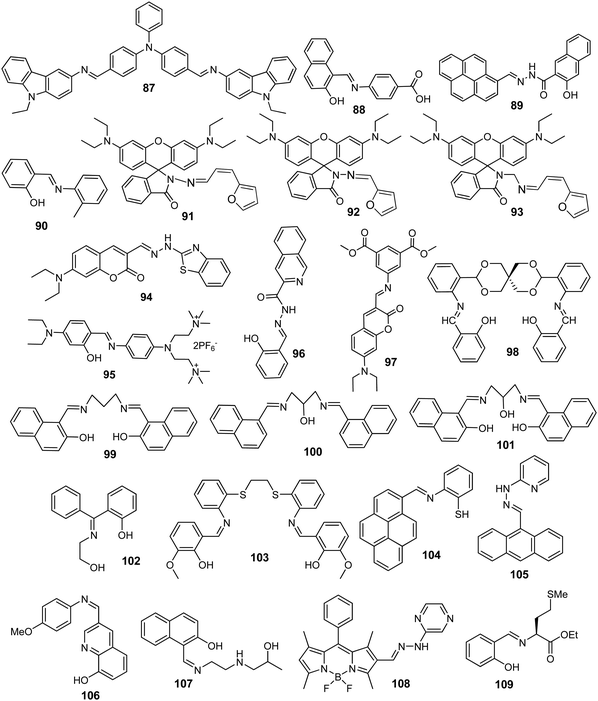
In the past, significant research work has been done in developing fluorescent Schiff base sensors for metal ion detection.63,65–71 However, to the best of our knowledge, no review has been reported on metal ion detection using fluorescent Schiff base sensors. In this review article, we start with the general introduction of fluorescent Schiff base sensors for metal ion detection and then divide the article into main sections. The first section illustrates the strategies and different mechanistic insights into metal ion detection using Schiff base sensors. The second section demonstrates the practical applications of fluorescent Schiff base sensors in metal ion sensing, biomedical imaging, environmental monitoring, and optoelectronic systems (Fig. 1). Additionally, a summary of the reviewed fluorescent Schiff base sensors is presented in a table format (Table 2). Finally, the conclusion and future opportunities of fluorescent Schiff base sensors for metal ion detection are discussed.
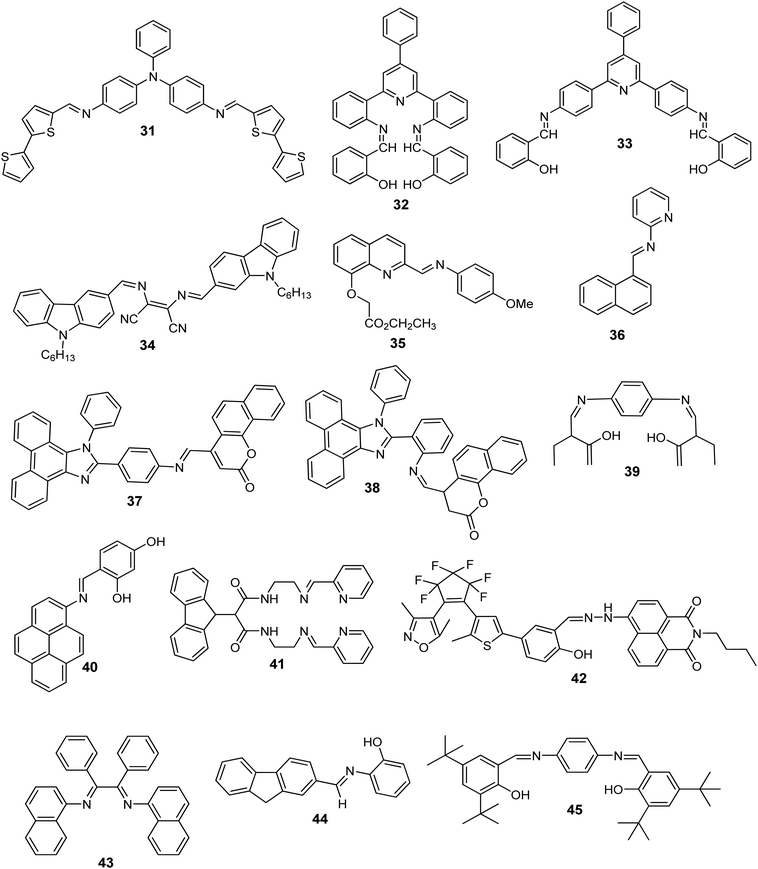
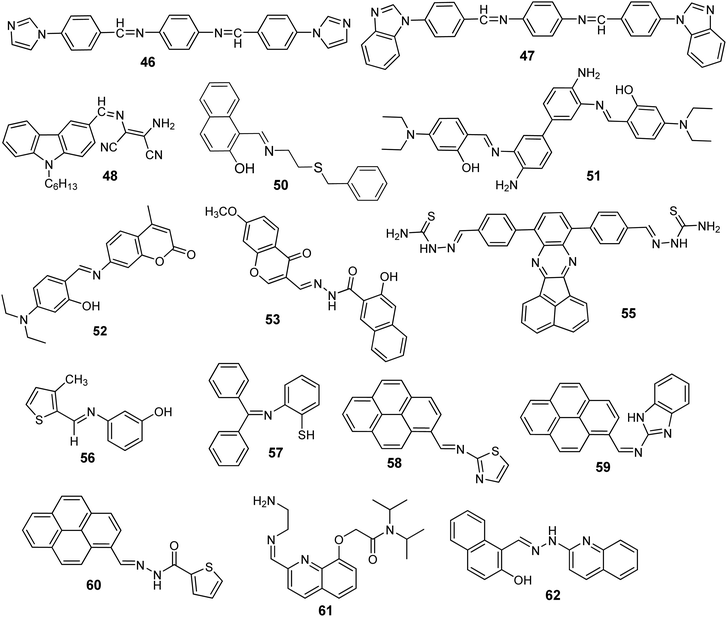
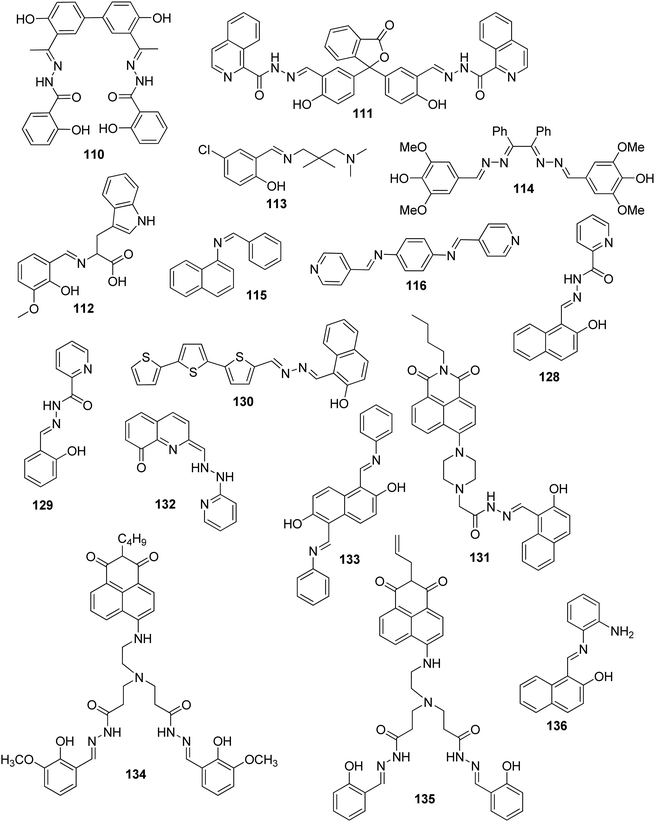
| Sensor | Fluorescence response | Solvent | λ ex (nm) | λ em (nm) | Metal ion | LOD | Recovery rates (%) ± RSD (%) in the spiked samples | Mechanism | Application | Ref. |
|---|---|---|---|---|---|---|---|---|---|---|
| 1 | Turn-on | H2O–DMF (1![[thin space (1/6-em)]](https://www.rsc.org/images/entities/char_2009.gif) : :![[thin space (1/6-em)]](https://www.rsc.org/images/entities/char_2009.gif) 1, v/v) 1, v/v) |
370 | 455 | Cu2+ | 35 nM | — | Cu2+ induced self-assembly | Metal ion sensor, fluorescence imaging of intracellular Cu2+ | 72 |
| 2 | Turn-off | 99% HEPES buffer–CH3CN | 390 | 526 | Cu2+ | 0.261 ppb | 95 to 120 ± <0.5 in tap water, pond water, and industrial waste water | Disassembly of self-assembled aggregates | Metal ion sensor, cell imaging of HeLa cells, logic circuit, TLC strips | 73 |
| 3 | Blue shift of emission, turn-on | CH3CN | 393 | 454.5 | Cu2+ | 2.5 μM | — | Coordination of sensor 3 with Cu2+ blocks the PET process | Metal ion sensor | 32 |
| 4 | Turn-off | H2O/DMSO (v/v, 1![[thin space (1/6-em)]](https://www.rsc.org/images/entities/char_2009.gif) : :![[thin space (1/6-em)]](https://www.rsc.org/images/entities/char_2009.gif) 1) 1) |
400 | 585 | Cu2+ | 32.8 nM | — | Coordination of Cu2+ with sensor 4 caused activation of the PET process between coumarin and Cu2+ | Metal ion sensor, fluorescence imaging of intracellular Cu2+ | 41 |
| 5 | Blue shift of emission, turn-on | Tris–HCl buffer (CH3OH/H2O = 9![[thin space (1/6-em)]](https://www.rsc.org/images/entities/char_2009.gif) : :![[thin space (1/6-em)]](https://www.rsc.org/images/entities/char_2009.gif) 1, v/v) 1, v/v) |
430 | 516 | Zn2+ | 0.144 μM | — | PET and CHEF effect | Metal ion sensor | 74 |
| 6 | Turn-on, red-shift in the case of Cu2+ | CH3OH–tris buffer (1![[thin space (1/6-em)]](https://www.rsc.org/images/entities/char_2009.gif) : :![[thin space (1/6-em)]](https://www.rsc.org/images/entities/char_2009.gif) 1) 1) |
340 | 440 | Cu2+ and Pb2+ | 1.2 μM and 0.9 μM for Cu2+ and Pb2+, respectively | 98.3 to 101.6 ± <1.5 for Cu2+, and 100.7 to 109.8 ± <2 for Pb2+ in water samples | PET and ICT process | Metal ion sensor, logic gate, cell imaging | 75 |
| 7 | Turn-off | THF–H2O (9![[thin space (1/6-em)]](https://www.rsc.org/images/entities/char_2009.gif) : :![[thin space (1/6-em)]](https://www.rsc.org/images/entities/char_2009.gif) 1, v/v) 1, v/v) |
365 | 484 | Cu2+ | Less than 1 μM | — | Metal to ligand charge transfer, CHEQ | Metal ion sensor | 76 |
| 8 | Turn-off | Aqueous medium | 405 | 517 | Cu2+ | 12.3 nM | — | Ligand to metal charge transfer | Metal ion sensor, secondary sensor for CN− (turn-on), logic gate, cellular imaging | 77 |
| 9 | Turn-off | DMF/water mixtures | 400 | 525 and 630 | Cu2+ | 9.12 nM | — | FRET | Metal ion sensor | 78 |
| 10 | Turn-on | PBS buffer at pH 7.4 | 360 | 415 and 548 | Al3+ | 10 nM | — | ESIPT, metal-template aggregation | Metal ion sensor | 79 |
| 11 | Turn-off | Aqueous medium | 350 | 438 | Cr(VI) | 0.175 μM | 99 to 104 ± <2 in ground and tap water, 102.5 ± <2 in human serum, and 101.5 to 105 ± <2 in vitamin C tablets | Inner filter effect | Metal ion sensor, secondary sensor for ascorbic acid (turn-on), tap water, ground water | 80 |
| 12 | Turn-on | CH3CN–H2O (7![[thin space (1/6-em)]](https://www.rsc.org/images/entities/char_2009.gif) : :![[thin space (1/6-em)]](https://www.rsc.org/images/entities/char_2009.gif) 3, v/v) 3, v/v) |
305 | 389 | Al3+ and Cr3+ | 88.7 nM and 63.1 nM for Al3+ and Cr3+, respectively | 97.8 to 103.8 ± <1 for Al3+ and 96.5 to 104.8 ± <1.5 for Cr3+ in tap and deionized water | Metal induced chemical change, C![[double bond, length as m-dash]](https://www.rsc.org/images/entities/char_e001.gif) N isomerization N isomerization |
Metal ion sensor, tap water | 81 |
| 13 | Turn-on | Ethanol | 491 | 547 | Mg2+ | 0.516 μM | — | PET process, CHEF effect | Metal ion sensor | 82 |
| 14 | Ratiometric fluorescence change | HEPES buffer solution (pH = 7.2) | 370 | 545 and 483 | Ca2+ | 0.3 μM | — | ICT process | Metal ion sensor | 83 |
| 15 | Turn-on | HEPES buffer solution | 365 | 488 | Al3+ | 15.0 nM | 94.4 ± 2.2 in tap water | PET process, CHEF effect | Metal ion sensor, test paper, tap water | 84 |
| 16 | Turn-on, blue-shift | Methanol | 316 | 550 | Al3+ | 14 nM | — | CHEF effect | Metal ion sensor | 85 |
| 17 | Turn-on | DMF–H2O (v/v, 9![[thin space (1/6-em)]](https://www.rsc.org/images/entities/char_2009.gif) : :![[thin space (1/6-em)]](https://www.rsc.org/images/entities/char_2009.gif) 1) 1) |
390 | 490 | Al3+ | 6.7 μM | — | ICT process, CHEF effect and C![[double bond, length as m-dash]](https://www.rsc.org/images/entities/char_e001.gif) N isomerization N isomerization |
Metal ion sensor | 86 |
| 18 | Turn-on | Ethanol | 428 | 502 | Al3+ | 38.7 nM | — | PET phenomenon, CHEF effect | Metal ion sensor | 87 |
| 19 | Turn-on | Ethanol | 350 | 391 | Al3+ | 0.1 μM | — | PET process, CHEF effect | Metal ion sensor | 88 |
| 20 | Turn-on | Ethanol | 410 | 480 | Al3+ | 31.9 nM | — | PET process, CHEF effect | Metal ion sensor | 89 |
| 21 | Turn-on | Ethanol–H2O (v/v, 3![[thin space (1/6-em)]](https://www.rsc.org/images/entities/char_2009.gif) : :![[thin space (1/6-em)]](https://www.rsc.org/images/entities/char_2009.gif) 1) 1) |
420 | 475 and 508 | Al3+ | 18.2 nM | — | PET process | Metal ion sensor, solid state sensor | 90 |
| 22 | Turn-on, blue-shift | Aqueous medium | 389 | 460 | Al3+ | 0.6.9 μM | — | ICT phenomenon | Metal ion sensor | 91 |
| 23 | Turn-on | Ethanol | 363 | 420 | Al3+ | 0.2 μM | — | PET phenomenon, CHEF effect | Metal ion sensor | 92 |
| 24 and 25 | Turn-on | DMSO–H2O | 493 and 476 for sensors 24 and 25, respectively | Al3+ | 14.9 nM and 15.1 nM for sensors 24 and 25, respectively | — | PET process, CHEF effect | Metal ion sensor | 93 | |
| 26 and 27 | Turn-on | Methanol | 410 | 506 and 489 for sensors 26 and 27, respectively | Al3+ | 47.9 nM and 82.8 nM for sensors 26 and 27, respectively | — | CHEF effect | Metal ion sensor | 94 |
| 28 | Turn-on | Ethanol | 394 | 478 | Al3+ | 4.2 ppm | — | CHEF effect | Metal ion sensor | 95 |
| 29 | Turn-on | DMF | 378 | 481 | Al3+ | 1.2 μM | — | ICT process, CHEF effect | Metal ion sensor | 96 |
| 30 | Turn-on | Methanol–H2O (9![[thin space (1/6-em)]](https://www.rsc.org/images/entities/char_2009.gif) : :![[thin space (1/6-em)]](https://www.rsc.org/images/entities/char_2009.gif) 1, v/v) 1, v/v) |
334 | 521 | Al3+ | 0.1587 μM | — | PET process, CHEF effect | Metal ion sensor | 97 |
| 31 | Turn-on | DMSO–H2O (1![[thin space (1/6-em)]](https://www.rsc.org/images/entities/char_2009.gif) : :![[thin space (1/6-em)]](https://www.rsc.org/images/entities/char_2009.gif) 1, v/v) 1, v/v) |
320 | 460 | Sn2+ | 0.314 μM | — | PET process, ICT process, C![[double bond, length as m-dash]](https://www.rsc.org/images/entities/char_e001.gif) N isomerization and CHEF effect N isomerization and CHEF effect |
Metal ion sensor | 98 |
| 32 | Turn-on | CH3CN–H2O (95/5%) | 273 | 537 | Cr3+ | 0.22 μM | — | PET process, CHEF effect | Metal ion sensor | 99 |
| 33 | Turn-on | CH3CN–H2O (95/5%) | 360 | 663 | Cr3+ | 0.13 μM | — | PET process, CHEF effect | Metal ion sensor | 100 |
| 34 | Turn-off | DMF | 280 | 356 and 372 | Fe3+ | 37.5 nM | 103 ± 1.9 and 97.5 ± 2.1 in distilled water and tap water, respectively | LMCT | Metal ion sensor | 101 |
| 35 | Turn-on | Aqueous medium | 256 | 505 | Fe3+ | 48.0 nM | — | PET process, CHEF effect | Metal ion sensor | 102 |
| 36 | Turn-on, red-shift | CH3CN–H2O (1![[thin space (1/6-em)]](https://www.rsc.org/images/entities/char_2009.gif) : :![[thin space (1/6-em)]](https://www.rsc.org/images/entities/char_2009.gif) 1, v/v) 1, v/v) |
300 | 370 | Fe2+ | 0.15 μM | 104.8 ± 0.04, 100.8 ± 0.03, 97.0 ± 0.03, and 93.3 ± 0.05 in tap water, tablets, dark chocolate and tomato juice, respectively | ICT process, CHEF effect | Metal ion sensor, tap water, tablets, dark chocolate and tomato juice | 103 |
| 37 and 38 | Turn-off | DMF/HEPES buffer (7![[thin space (1/6-em)]](https://www.rsc.org/images/entities/char_2009.gif) : :![[thin space (1/6-em)]](https://www.rsc.org/images/entities/char_2009.gif) 3, v/v) 3, v/v) |
318 and 304 for sensors 37 and 38, respectively | 446 and 426 for sensors 37 and 38, respectively | Fe3+ | 4.28 μM and 0.83 μM for sensors 37 and 38, respectively | 99.7 to 101.9 ± <1.0 in bottled water, and 100.1 to 100.3 ± <0.8 in tap water | Electron/energy transfer | Metal ion sensor, water samples | 104 |
| 39 | Turn-on | Ethanol | 298 | 350 | Co2+ | 0.782 μM | 97.2 to 98.8 ± <3.5 in lake water, and 99.6 to 102.5 ± <2 in tap water | AIE phenomenon | Metal ion sensor, lake water, tap water | 105 |
| 40 | Turn-off | CH3CN–H2O (9/1, v/v) | 384 | 429 | Cu2+ | 0.503 μM | 102 ± 0.49 in tap water, and 100.5 ± 0.76 in drinking water | LMCT | Metal ion sensor, tap water, drinking water | 106 |
| 41 | Turn-off | DMSO | 278 | 307 | Cu2+ | 0.037 μM | — | Electron transfer | Metal ion sensor | 107 |
| 42 | Turn-off | CH3CN | 296 | 542 | Cu2+ | 2.4 μM | — | — | Metal ion sensor | 108 |
| 43 | Turn-off, blue-shift | CH3CN/H2O (1![[thin space (1/6-em)]](https://www.rsc.org/images/entities/char_2009.gif) : :![[thin space (1/6-em)]](https://www.rsc.org/images/entities/char_2009.gif) 1, v/v) 1, v/v) |
310 | 435 | Cu2+ | 10 μM | — | Nitrogen coordination and cation–π interaction | Metal ion sensor | 109 |
| 44 | Turn-on | CH3CN | 340 | 369 | Cu2+ | 1.54 nM | — | ICT process, C![[double bond, length as m-dash]](https://www.rsc.org/images/entities/char_e001.gif) N isomerization and CHEF effect N isomerization and CHEF effect |
Metal ion sensor | 110 |
| 45 | Turn-off | Aqueous medium | 386 | 554 | Cu2+ | 0.35 μM | — | Electron transfer | Metal ion sensor | 111 |
| 46 and 47 | Turn-on | DMF | 364 and 365 for sensors 46 and 47, respectively | 411 and 416 for sensors 46 and 47, respectively | Cu2+ | 1 nM for sensor 47 | — | CHEF effect | Metal ion sensor | 112 |
| 48 | Turn-on | CH3CN | 298 | 335 and 381 | Cu2+ | 27.4 nM | — | ICT process and C![[double bond, length as m-dash]](https://www.rsc.org/images/entities/char_e001.gif) N isomerization N isomerization |
Metal ion sensor | 113 |
| 49 | Turn-off | CH3CN/PBS (v/v =9/1) | 365 | 624 | Cu2+ | 0.67 μM | — | Ligand to metal charge transfer (LMCT) | Metal ion sensor, fluorescence bio-imaging | 114 |
| 50 | Turn-on | Ethanol/HEPES buffer (95/5, v/v) | 242 | 450 | Zn2+ | 0.5034 μM | — | (i) Restriction in rotation of the C![[double bond, length as m-dash]](https://www.rsc.org/images/entities/char_e001.gif) N group, (ii) blockage of the PET process, (iii) Zn2+ induced disaggregation of sensor 50 N group, (ii) blockage of the PET process, (iii) Zn2+ induced disaggregation of sensor 50 |
Metal ion sensor, fluorescence bio-imaging | 115 |
| 51 | Turn-on | DMF | 430 | 509 | Zn2+ | 8.6 nM | — | CHEF effect and C![[double bond, length as m-dash]](https://www.rsc.org/images/entities/char_e001.gif) N isomerization N isomerization |
Metal ion sensor | 116 |
| 52 | Turn-on | DMF–H2O (9![[thin space (1/6-em)]](https://www.rsc.org/images/entities/char_2009.gif) : :![[thin space (1/6-em)]](https://www.rsc.org/images/entities/char_2009.gif) 1, v/v) 1, v/v) |
380 | 500 | Zn2+ | 2.59 μM | — | PET process and C![[double bond, length as m-dash]](https://www.rsc.org/images/entities/char_e001.gif) N isomerization N isomerization |
Metal ion sensor | 117 |
| 53 | Turn-on | Ethanol | 430 | 498 | Zn2+ | 0.173 μM | — | PET process, C![[double bond, length as m-dash]](https://www.rsc.org/images/entities/char_e001.gif) N isomerization and CHEF effect N isomerization and CHEF effect |
Metal ion sensor | 118 |
| 54 | Turn-on | Water– DMSO (3![[thin space (1/6-em)]](https://www.rsc.org/images/entities/char_2009.gif) : :![[thin space (1/6-em)]](https://www.rsc.org/images/entities/char_2009.gif) 1 v/v) 1 v/v) |
340 | 427 | Ag+ | 3.15 μM | — | PET process, and CHEF effect | Metal ion sensor, real samples | 119 |
| 55 | Turn-off, red-shift | DMSO-buffered H2O (9/1, v/v) | 365 | 500 | Hg2+ | 0.907 μM | — | Intramolecular charge transfer | Metal ion sensor, lake water, tap water, distilled water | 120 |
| 56 | Turn-on | Methanol/H2O (8![[thin space (1/6-em)]](https://www.rsc.org/images/entities/char_2009.gif) : :![[thin space (1/6-em)]](https://www.rsc.org/images/entities/char_2009.gif) 2, v/v) 2, v/v) |
365 | 503 | Hg2+ | 20 μM | — | CHEF effect | Metal ion sensor | 121 |
| 57 | Turn-on | CH3CN–H2O (9/1, v/v) | 349 | 415 and 473 | Hg2+ | 22.68 nM | — | ESIPT process and C![[double bond, length as m-dash]](https://www.rsc.org/images/entities/char_e001.gif) N isomerization N isomerization |
Metal ion sensor | 122 |
| 58 | Turn-on | Aqueous medium | 355 | 417 | Hg2+ | 0.270 μM | 99.5 to 101.0 ± <3 in drinking water and tap water | Metal induced chemical change | Metal ion sensor, drinking water, and tap water | 123 |
| 61 | Turn-on | 10% methanol solution (v/v, 0.2 M PBS, pH 7.0) | 246 | 425 | Cd2+ | 2.7 nM | — | Interaction between Cd2+ and nitrogen containing moieties in sensor 61 | Metal ion sensor | 124 |
| 62 | Turn-on | CH3CN–H2O (8![[thin space (1/6-em)]](https://www.rsc.org/images/entities/char_2009.gif) : :![[thin space (1/6-em)]](https://www.rsc.org/images/entities/char_2009.gif) 2, v/v) 2, v/v) |
380 | 510 | Cd2+ | 14.8 nM | 99.5 to 100.5 ± <1.5 in double distilled water, and 99.2 to 101.0 ± <1.5 in tap water | CHEF effect and C![[double bond, length as m-dash]](https://www.rsc.org/images/entities/char_e001.gif) N isomerization N isomerization |
Metal ion sensor, double distilled water, and tap water | 125 |
| 63 | Turn-off | Ethanol | 341 | 385 | Ag+, Cu2+ and Fe3+ | 0.132 μM, 0.088 μM, and 0.037 μM, for Ag+, Cu2+ and Fe3+, respectively | 99.43 ± 0.14, 100.65 ± 0.38, and 101.4 ± 0.39 for Ag+, Cu2+ and Fe3+, respectively. | PET process | Multi-metal ion sensor, water samples | 126 |
| 64 | Turn-off | THF/water (6![[thin space (1/6-em)]](https://www.rsc.org/images/entities/char_2009.gif) : :![[thin space (1/6-em)]](https://www.rsc.org/images/entities/char_2009.gif) 4, v/v) 4, v/v) |
259 | 622 | Co2+, Cu2+ and Hg2+ | 3.26 nM, 89.1 pM and 0.387 nM for Co2+, Cu2+ and Hg2+, respectively | — | The heavy metal ion effect and paramagnetic behavior triggered non-radiative decay | Multi-metal ion sensor, distilled water, tap water | 127 |
| 65 | Turn-on with Hg2+ and turn-off with Co2+ and Cu2+ | DMSO–H2O (9![[thin space (1/6-em)]](https://www.rsc.org/images/entities/char_2009.gif) : :![[thin space (1/6-em)]](https://www.rsc.org/images/entities/char_2009.gif) 1, v/v) 1, v/v) |
460 | 540 | Co2+, Cu2+ and Hg2+ | 0.007 ppb, 0.29 ppb, and 0.20 ppb, respectively, for Co2+, Cu2+ and Hg2+ | — | The coordination and desulfurization mechanism for Hg2+ and disruption of the intramolecular H-bond in the presence of Co2+ or Cu2+ | Multi-metal ion sensor, tap, lake, drink, ditch and ground water | 128 |
| 66 | Turn-on, red-shift | CH3CN | 355 | 500 | Al3+, Cr3+ and Fe3+ | 0.117 μM, 0.111 μM and 0.106 μM for Al3+, Cr3+ and Fe3+ | — | Excimer formation and PET process | Multi-metal ion sensor, multi-metal ion sensor, living cell imaging | 129 |
| 67 | Turn-on | Ethanol | 510 | 572 and 580 for Zn2+ and Fe3+, respectively | Zn2+, Fe3+ | 0.664 μM and 0.212 μM for Zn2+ and Fe3+, respectively | — | Opening of the lactam ring | Multi-metal ion sensor, distilled water, lake water, running water, well water, and Yangtze river | 130 |
| 68 | Turn-off, red-shift | DMSO–H2O (1![[thin space (1/6-em)]](https://www.rsc.org/images/entities/char_2009.gif) : :![[thin space (1/6-em)]](https://www.rsc.org/images/entities/char_2009.gif) 1, v/v) 1, v/v) |
310 | 550 | Cu2+, Hg2+, Ag+ | 64.8 μM, 52.7 μM and 63.7 μM for Cu2+, Hg2+ and Ag+ | — | Coordination of Cu2+, Hg2+, and Ag+ with phenolic hydroxyl O, imine N atoms and thiol S, hydrogen bonding | Multi-metal ion sensor | 131 |
| 69 | Turn-off | DMF | 341 | 393 | Fe2+, Fe3+ and Cu2+ | 2.06 μM, 2.17 μM, and 2.48 μM for Fe2+, Fe3+ and Cu2+, respectively | — | CHEQ | Multi-metal ion sensor | 132 |
| 70 | Turn-on | Ethanol–HEPES buffer (9![[thin space (1/6-em)]](https://www.rsc.org/images/entities/char_2009.gif) : :![[thin space (1/6-em)]](https://www.rsc.org/images/entities/char_2009.gif) 1, v/v) 1, v/v) |
420 and 520 for Zn2+ and Fe3+, respectively | 490 and 583 for Zn2+ and Fe3+, respectively | Zn2+ and Fe3+ | 0.134 μM and 0.139 μM for Zn2+ and Fe3+ | — | PET process, CHEF effect for Zn2+ and opening of the spirolactam ring for Fe3+ | Multi-metal ion sensor, solid state sensor | 133 |
| 71 | Turn-on, red-shift | CH3CN | 350 | 539 and 565 for Zn2+ and Hg2+, respectively | Zn2+ and Hg2+ | 0.040 μM and 0.011 μM for Hg2+ and Zn2+, respectively | — | ICT process and CHEF effect | Multi-metal ion sensor | 134 |
| 72 | Turn-on | DMSO–H2O (1![[thin space (1/6-em)]](https://www.rsc.org/images/entities/char_2009.gif) : :![[thin space (1/6-em)]](https://www.rsc.org/images/entities/char_2009.gif) 99, v/v) 99, v/v) |
300 | 460 and 434 for Zn2+ and Ga3+, respectively | Zn2+ and Ga3+ | 0.32 μM and 0.01 μM for Zn2+ and Ga3+, respectively | — | PET process | Multi-metal ion sensor | 135 |
| 73 | Turn-on | CH3CN | 333 | 536 | Al3+ and Cr3+ | 0.31 μM and 0.25 μM for Al3+ and Cr3+ | — | ESIPT process and C![[double bond, length as m-dash]](https://www.rsc.org/images/entities/char_e001.gif) N isomerization N isomerization |
Multi-metal ion sensor | 136 |
| 74 | Turn-off response with Cu2+ and turn-on response with Hg2+ | THF–H2O (7![[thin space (1/6-em)]](https://www.rsc.org/images/entities/char_2009.gif) : :![[thin space (1/6-em)]](https://www.rsc.org/images/entities/char_2009.gif) 3, v/v) 3, v/v) |
385 | 537 | Cu2+ and Zn2+ | 70.6 nM and 0.116 μM for Cu2+ and Zn2+, respectively | — | ICT process, CHEQ for Cu2+ and PET process, CHEF for Hg2+ | Multi-metal ion sensor | 137 |
| 75 | Turn-on | CH3CN | 380 | 495 | Fe3+ and Cr3+ | 4.57 μM and 2.75 μM for Fe3+ and Cr3+, respectively | — | ESIPT process and C![[double bond, length as m-dash]](https://www.rsc.org/images/entities/char_e001.gif) N isomerization N isomerization |
Multi-metal ion sensor | 138 |
| 77 and 78 | Turn-on | DMSO–H2O (1![[thin space (1/6-em)]](https://www.rsc.org/images/entities/char_2009.gif) : :![[thin space (1/6-em)]](https://www.rsc.org/images/entities/char_2009.gif) 2, v/v) 2, v/v) |
405 for sensors 77 and 455 for sensor 78 | 505 for sensors 77 and 509 for sensor 78 | Al3+ | 14.8 nM and 42.3 nM for sensors 77 and 78, respectively | — | ESIPT process, C![[double bond, length as m-dash]](https://www.rsc.org/images/entities/char_e001.gif) N isomerization and CHEF effect N isomerization and CHEF effect |
Metal ion sensor, secondary sensor for F− (turn-off), filter paper, cell imaging | 139 |
| 79 | Turn-on | DMSO–H2O (1![[thin space (1/6-em)]](https://www.rsc.org/images/entities/char_2009.gif) : :![[thin space (1/6-em)]](https://www.rsc.org/images/entities/char_2009.gif) 9, v/v, HEPES buffered) 9, v/v, HEPES buffered) |
450 | 525 | Zn2+ | 0.52 μM | — | ICT | Metal ion sensor, secondary sensor for PPi (turn-off), test paper strips and bioimaging of intracellular Zn2+ in HeLa cells | 140 |
| 80 | Turn-off with Co2+ and Cu2+ and turn-on with Hg2+ | THF–H2O (1![[thin space (1/6-em)]](https://www.rsc.org/images/entities/char_2009.gif) : :![[thin space (1/6-em)]](https://www.rsc.org/images/entities/char_2009.gif) 99) 99) |
360 | 620 | Co2+-Hg2+-Cu2+ | 0.0937 μM, 0.0221 μM, and 0.0988 μM for Co2+, Hg2+ and Cu2+, respectively | Metal ion binding in the cavity of the sensor through oxygen and nitrogen atoms | Multi-metal ion sensor, sequential sensor for Co2+-Hg2+-Cu2+, test strip, living cell imaging | 141 | |
| 81 | Turn-on | Ethanol–H2O buffered (9![[thin space (1/6-em)]](https://www.rsc.org/images/entities/char_2009.gif) : :![[thin space (1/6-em)]](https://www.rsc.org/images/entities/char_2009.gif) 1, v/v) 1, v/v) |
330 | 511 | Zn2+ | 1.2 nM | PET process, C![[double bond, length as m-dash]](https://www.rsc.org/images/entities/char_e001.gif) N isomerization and CHEF effect N isomerization and CHEF effect |
Metal ion sensor, secondary sensor for PPi (turn-off), INHIBIT type logic gate | 142 | |
| 82 | Turn-off | H2O–CH3CN (1![[thin space (1/6-em)]](https://www.rsc.org/images/entities/char_2009.gif) : :![[thin space (1/6-em)]](https://www.rsc.org/images/entities/char_2009.gif) 1, v/v) PBS buffered 1, v/v) PBS buffered |
450 | 521 | Cu2+ | 24.0 nM | — | Sensor 82 carbonyl and imino group binding with Cu2+ | Metal ion sensor, secondary sensor for glutathione (turn-on), bio-imaging of Cu2+ in living cells and zebrafish | 143 |
| 83 | Turn-on, blue-shift | Methanol–water (3![[thin space (1/6-em)]](https://www.rsc.org/images/entities/char_2009.gif) : :![[thin space (1/6-em)]](https://www.rsc.org/images/entities/char_2009.gif) 1, v/v) 1, v/v) |
315 | 512 | Zn2+ | 0.078 μM | — | ESIPT and PET process and CHEF effect | Metal ion sensor, secondary sensor for ATP (turn-off), live cell imaging | 144 |
| 84 | Turn-on | Aqueous medium | 350 | 588 | Al3+ | 1.68 μM | — | Al3+ induced hydrolysis of sensor 84, forming the free –CHO group | Metal ion sensor, secondary sensor for CN− (turn-off), Al3+ detection in A549 cells through live cell imaging | 145 |
| 85 | Turn-off | DMSO–HEPES buffer (4![[thin space (1/6-em)]](https://www.rsc.org/images/entities/char_2009.gif) : :![[thin space (1/6-em)]](https://www.rsc.org/images/entities/char_2009.gif) 6, v/v) 6, v/v) |
338 | 419 | Cu2+ | 2.11 ppb | — | Cu2+ induced hydrolysis of the imine functionality of sensor 85 | Metal ion sensor, secondary sensor for PO43− (turn-on), paper strips | 146 |
| 86 | Turn-on | 90% aqueous methanol | 410 | 520 | Al3+ | 1.62 μM | — | CHEF effect and C![[double bond, length as m-dash]](https://www.rsc.org/images/entities/char_e001.gif) N isomerization N isomerization |
Metal ion sensor, secondary sensor for nucleotides and phosphate ions (turn-off), live cell imaging | 147 |
| 87 | Turn-on, red-shift | Ethanol | 400 | 500 | Al3+ | 63.0 nM | — | Schiff base hydrolysis and CHEF effect | Metal ion sensor, live cell imaging in living HeLa cells | 148 |
| 88 | Turn-on | Methanol/H2O (9![[thin space (1/6-em)]](https://www.rsc.org/images/entities/char_2009.gif) : :![[thin space (1/6-em)]](https://www.rsc.org/images/entities/char_2009.gif) 1, v/v) 1, v/v) |
310 | 343 | Al3+ | 0.64 μM | — | ICT process, C![[double bond, length as m-dash]](https://www.rsc.org/images/entities/char_e001.gif) N isomerization and CHEF effect N isomerization and CHEF effect |
Metal ion sensor, live cell imaging | 149 |
| 89 | Turn-on, red-shift | DMSO–H2O (1![[thin space (1/6-em)]](https://www.rsc.org/images/entities/char_2009.gif) : :![[thin space (1/6-em)]](https://www.rsc.org/images/entities/char_2009.gif) 1, v/v) solution 1, v/v) solution |
393 | 467 | Cu2+ | 0.26 μM | — | Strong coordination of sensor 89 with Cu2+ | Metal ion sensor, live cell imaging | 150 |
| 90 | Turn-on | DMSO–H2O (3/7, v/v) solution | 346 | 472 | Zn2+ | 0.018 μM | — | ESIPT, CHEF effect | Metal ion sensor, living cell (African Monkey Vero cells) imaging | 151 |
| 91 | Turn-on | Ethanol–H2O (1/1, v/v) solution | 545 | 584 | Fe3+ | 28.1 nM | — | Opening of the spirolactam ring | Metal ion sensor, living cell (SMMC-7721 cells) imaging | 152 |
| 94 | Turn-off | CH3CN/PBS (1![[thin space (1/6-em)]](https://www.rsc.org/images/entities/char_2009.gif) : :![[thin space (1/6-em)]](https://www.rsc.org/images/entities/char_2009.gif) 1, v/v) 1, v/v) |
450 | 540 | Cu2+ | — | 92.90 to 109.3 ± <2 in water samples | — | Metal ion sensor, live cell (MCF-7 and A549 cells) imaging | 153 |
| 95 | Turn-off | HEPES buffer | 418 | 516 | Cu2+ | 0.16 μM | — | MLCT, LLCT | Metal ion sensor, two-photon fluorescence imaging of Cu2+ in cellular mitochondria and in the liver and intestine of larval zebrafish | 154 |
| 96 | Turn-on | Ethanol | 400 | 458 | Al3+ | 1.11 nM | — | ESIPT | Metal ion sensor, cell (MCF-7) imaging | 155 |
| 97 | Turn-on | CH3CN–water (8![[thin space (1/6-em)]](https://www.rsc.org/images/entities/char_2009.gif) : :![[thin space (1/6-em)]](https://www.rsc.org/images/entities/char_2009.gif) 2) mixture 2) mixture |
440 | 530 | Hg2+ | 1 nM | — | PET and hydrolysis of the C![[double bond, length as m-dash]](https://www.rsc.org/images/entities/char_e001.gif) N group N group |
Metal ion sensor, live cell (MCF-7 cells) imaging | 156 |
| 98 | Turn-on | Buffer solution (ethanol/Tris–HCl, v/v, 4/1) | 380 | 458 | Zn2+ | 1.37 μM | — | PET process, C![[double bond, length as m-dash]](https://www.rsc.org/images/entities/char_e001.gif) N isomerization and CHEF effect N isomerization and CHEF effect |
Metal ion sensor, live cell (A549) imaging | 157 |
| 101 | Turn-on | CH3OH/HEPES buffer (3/7, v/v) | 350 | 435 | Al3+ | 0.05 μM | — | CHEF effect and C![[double bond, length as m-dash]](https://www.rsc.org/images/entities/char_e001.gif) N isomerization N isomerization |
Metal ion sensor, fluorescence imaging in living cells (SW480 cells) | 158 |
| 102 | Turn-on | Ethanol (0.01%)–HEPES buffer | 321 | 450 | Al3+ | 0.1 μM | — | ESIPT process, C![[double bond, length as m-dash]](https://www.rsc.org/images/entities/char_e001.gif) N isomerization and CHEF effect N isomerization and CHEF effect |
Metal ion sensor, fluorescence imaging in living cells (HepG2 cells) | 159 |
| 103 | Turn-on | DMSO/H2O (HEPES buffer, v/v = 3/7) | 346 | 555 | Zn2+ | 60 nM | — | PET process, ESIPT process and CHEF effect | Metal ion sensor, living cell (Vero cells) imaging | 160 |
| 104 | Turn-on, red-shift | DMSO–H2O (7![[thin space (1/6-em)]](https://www.rsc.org/images/entities/char_2009.gif) : :![[thin space (1/6-em)]](https://www.rsc.org/images/entities/char_2009.gif) 3, v/v) 3, v/v) |
347 | 445 | Hg2+ | 2.82 μM | — | Excimer formation and CHEF effect | Metal ion sensor, live cell (HeLa cells) imaging | 161 |
| 105 | Turn-on | CH3CN | 350 | 430 | Cu2+ | 86.3 nM | — | PET process and CHEF effect | Metal ion sensor, live cell (Raw264.7 cells) imaging | 162 |
| 106 | Turn-on | Methanol | 373 | 517 | Al3+ | 0.12 μM | — | PET process | Metal ion sensor, live cell (HeLa cells) imaging | 163 |
| 107 | Turn-on | Methanol | 307 | 430 | Al3+ | 0.137 μM | — | ESIPT process | Metal ion sensor, live cell (HeLa cells) imaging, in vivo bioimaging of Al3+ in zebrafish larvae | 164 |
| 108 | Turn-on | Phosphate buffer–ethanol (7![[thin space (1/6-em)]](https://www.rsc.org/images/entities/char_2009.gif) : :![[thin space (1/6-em)]](https://www.rsc.org/images/entities/char_2009.gif) 3, v/v) solution 3, v/v) solution |
480 | 516 | Au3+ | 60 nM | — | Metal induced chemical change | Metal ion sensor, PC12 cell and zebrafish imaging | 165 |
| 109 | Turn-on | Buffered CH3CN–water (1![[thin space (1/6-em)]](https://www.rsc.org/images/entities/char_2009.gif) : :![[thin space (1/6-em)]](https://www.rsc.org/images/entities/char_2009.gif) 1) 1) |
370 | 450 | Zn2+ | 0.50 μM | — | Complexation of Zn2+ with oxygen, nitrogen and sulfur atoms of sensor 109 | Metal ion sensor, live cell (MCF-7 cells) imaging | 166 |
| 110 | Turn-off | Buffered ethanol–water (1![[thin space (1/6-em)]](https://www.rsc.org/images/entities/char_2009.gif) : :![[thin space (1/6-em)]](https://www.rsc.org/images/entities/char_2009.gif) 1, v/v) 1, v/v) |
400 | 566 | Cu2+ | 15.4 nM | — | Excited state energy/electron transfer | Metal ion sensor, live cell (HeLa cells) imaging | 167 |
| 111 | Turn-on | DMSO–H2O (9![[thin space (1/6-em)]](https://www.rsc.org/images/entities/char_2009.gif) : :![[thin space (1/6-em)]](https://www.rsc.org/images/entities/char_2009.gif) 1, v/v) 1, v/v) |
377 | 479 | Al3+ | 9.79 nM | — | PET process and CHEF effect | Metal ion sensor, live cell (HeLa cells) imaging | 168 |
| 112 | Turn-on, red-shift | Aqueous medium | 350 | 460 | Zn2+ | 10.4 nM | — | C![[double bond, length as m-dash]](https://www.rsc.org/images/entities/char_e001.gif) N isomerization N isomerization |
Metal ion sensor, bacterial cells, viz. Staphylococcus aureus and E. coli | 169 |
| 113 | Turn-on | Methanol–H2O (1/9, v/v) | 392 | 448 | Al3+ and Zn2+ | 0.804 μM | For Al3+, 96.33 and 96.24 in water and suspension, respectively | ESIPT, PET process, C![[double bond, length as m-dash]](https://www.rsc.org/images/entities/char_e001.gif) N isomerization and CHEF effect N isomerization and CHEF effect |
Metal ion sensor, drug samples such as Gelucil and Zincovit, live cell (HeLa cells) imaging | 170 |
| For Zn2+, 98.60 and 95.05 in water and suspension, respectively | ||||||||||
| 114 | Turn-on | Methanol–water (2![[thin space (1/6-em)]](https://www.rsc.org/images/entities/char_2009.gif) : :![[thin space (1/6-em)]](https://www.rsc.org/images/entities/char_2009.gif) 1, v/v) 1, v/v) |
340 | 442 | Pb2+ | 8 nM | 105 ± 1.7, 117 ±1.6, and 93 ±1.3 in tap water, river water and urine samples, respectively | PET process and CHEF effect | Metal ion sensor, BSA medium, environmental samples such as tap water, river water and urine samples | 171 |
| 115 | Turn-on | CH3CN–H2O (1![[thin space (1/6-em)]](https://www.rsc.org/images/entities/char_2009.gif) : :![[thin space (1/6-em)]](https://www.rsc.org/images/entities/char_2009.gif) 1, v/v) 1, v/v) |
360 | 430 | Al3+ | 50 μM | — | PET process, CHEF effect | Metal ion sensor, BSA medium, live cell (human embryonic kidney (HEK)) imaging | 172 |
| 116 | Turn-on | Methanol–water (2![[thin space (1/6-em)]](https://www.rsc.org/images/entities/char_2009.gif) : :![[thin space (1/6-em)]](https://www.rsc.org/images/entities/char_2009.gif) 1, v/v) 1, v/v) |
310 | 373 | Al3+ | 0.903 μM | 98.5% to 101.91% in food samples | PET process, C![[double bond, length as m-dash]](https://www.rsc.org/images/entities/char_e001.gif) N isomerization and CHEF effect N isomerization and CHEF effect |
Metal ion sensor, BSA medium | 173 |
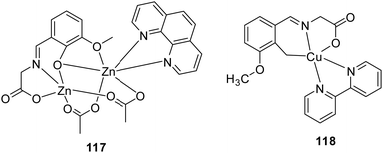
| 117 and 118 | Turn-off | Aqueous medium | 370 | 540 | Cu2+, Fe3+ | — | — | Host–guest interaction | Anticancer | 174 |
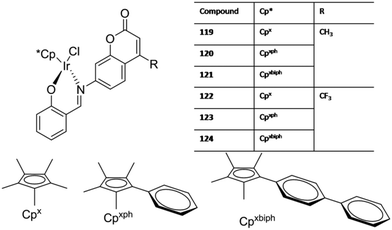
| 119-124 | - | DMSO–H2O (2![[thin space (1/6-em)]](https://www.rsc.org/images/entities/char_2009.gif) : :![[thin space (1/6-em)]](https://www.rsc.org/images/entities/char_2009.gif) 8, v/v) 8, v/v) |
— | 422 nm for 119-121, and 474 nm for 122-124 | — | — | — | Energy dependent, antitumor mechanism of oxidation | Anticancer | 175 |
| 125 | Turn-on | Ethanol–H2O (4![[thin space (1/6-em)]](https://www.rsc.org/images/entities/char_2009.gif) : :![[thin space (1/6-em)]](https://www.rsc.org/images/entities/char_2009.gif) 6, v/v) 6, v/v) |
397 | 550 nm | Fe3+ | 0.8 ppb | — | ESIPT | Cancer cells | 176 |
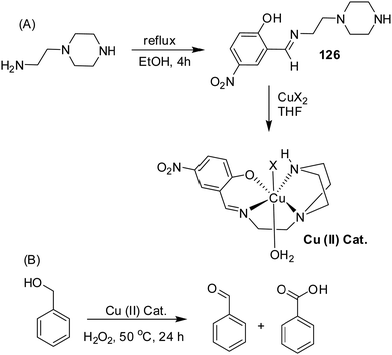
| 126 | Turn-off | DMSO | 360 | 475 | Cu2+ | — | — | PET process and CHEF effect or due to structural change in the ligand upon complexation | Optical sensor, catalytic oxidation, and Lewis acid–base colour indicator | 177 |
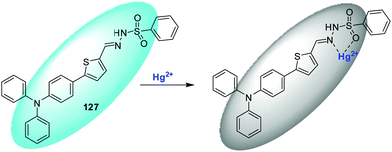
| 127 | Turn-off | DMSO–H2O (1![[thin space (1/6-em)]](https://www.rsc.org/images/entities/char_2009.gif) : :![[thin space (1/6-em)]](https://www.rsc.org/images/entities/char_2009.gif) 1, v/v) 1, v/v) |
414 | 549 | Hg2+ | 0.284 nM | 118.5 to 154.0, 108.0 to 114.0, and 97.7 to 112.0 in lake water, tap water, and mineral water, respectively | Hg2+ interaction with the nitrogen atom of the imine group and with the oxygen atom | Adsorption, real water samples, and logic gate | 178 |
| 128 and 129 | Turn-on | DMF–H2O (v:v = 1![[thin space (1/6-em)]](https://www.rsc.org/images/entities/char_2009.gif) : :![[thin space (1/6-em)]](https://www.rsc.org/images/entities/char_2009.gif) 9) 9) |
360 and 300 for sensors 128 and 129, respectively | 483 and 467 for sensors 128 and 129, respectively | Al3+ | 3.2 nM and 29.0 nM with sensors 128 and 129, respectively | — | PET and ESIPT process, CHEF effect | Metal ion sensor, lake water and tap water | 179 |
| 130 | Turn-off, hypso-chromic shift | DMF/H2O (2/3, v/v) | 450 | 560 | Cu2+ | 28.1 nM | 94 to 105 ± <2 in tap water, 106 to 117 ± <2.7 in river, and 87 to 93 ± <2.6 in simulated urine samples | Paramagnetic nature of Cu2+ and CHQF mechanism | Metal ion sensor, real samples such as water and food | 180 |
| 131 | Turn-on | Methanol | 401 | 524 | Al3+ | 7.4 nM | 100.96 to 101.84 ± <0.5 in ultrapure water and 100.0 to 100.10 ± <1.0 in tap water | ICT process and CHEF effect | Metal ion sensor, ultrapure water, tap water | 181 |
| 132 | Turn-on | CH3CN | 353 | 487 and 532 | Mg2+ | 19.1 ppb | — | C![[double bond, length as m-dash]](https://www.rsc.org/images/entities/char_e001.gif) N isomerization and CHEF effect N isomerization and CHEF effect |
Metal ion sensor, tap, ground and lake water | 182 |
| 133 | Turn-off | THF–H2O (4/1, v/v) | 428 | 565 | Cu2+ | 16.4 nM | 99.10 to 102.90 ± <2.01 in lake water and 98.49 to 102.37 ± <2.07 in tap water | ESIPT process, LMCT | Metal ion sensor, running water, artificial lake | 183 |
| 134 | Turn-on | DMF–HEPES (1![[thin space (1/6-em)]](https://www.rsc.org/images/entities/char_2009.gif) : :![[thin space (1/6-em)]](https://www.rsc.org/images/entities/char_2009.gif) 1, v/v) 1, v/v) |
350 | 531 | Al3+ | 86.5 nM | 99.7 to 101.7 ± <0.5 in yellow river and 99.0 to 103.4 ± <0.5 in tap water | PET process and CHEF effect | Metal ion sensor, yellow river and tap water | 184 |
| 135 | Turn-on | Tris–HCl buffer (1![[thin space (1/6-em)]](https://www.rsc.org/images/entities/char_2009.gif) : :![[thin space (1/6-em)]](https://www.rsc.org/images/entities/char_2009.gif) 1, v/v) solution 1, v/v) solution |
350 | 526 | Al3+ | 0.34 μM | 100.5 to 102.3 ± <0.3 in yellow river and 99.5 to 102.8 ± <0.3 in tap water | PET process and CHEF effect | Metal ion sensor, yellow river and tap water | 185 |
| 136 | Turn-on | Ethanol–HEPES buffer (95![[thin space (1/6-em)]](https://www.rsc.org/images/entities/char_2009.gif) : :![[thin space (1/6-em)]](https://www.rsc.org/images/entities/char_2009.gif) 5, v/v) 5, v/v) |
273 | 473 and 499 | Al3+ | 0.108 μM | — | PET process | Metal ion sensor, live cell (HeLa cells) imaging, lake, river and distilled water | 186 |
| 137 | Turn-on, blue-shift | THF–H2O (1![[thin space (1/6-em)]](https://www.rsc.org/images/entities/char_2009.gif) : :![[thin space (1/6-em)]](https://www.rsc.org/images/entities/char_2009.gif) 1, v/v) mixture 1, v/v) mixture |
490 | 550 | Zn2+ | 38.9 nM | — | ESIPT, PET, non-radiative process and CHEF effect | Metal ion sensor, inkless rewritable paper, self-erasing paper, live cell (SiHa cells) imaging | 187 |
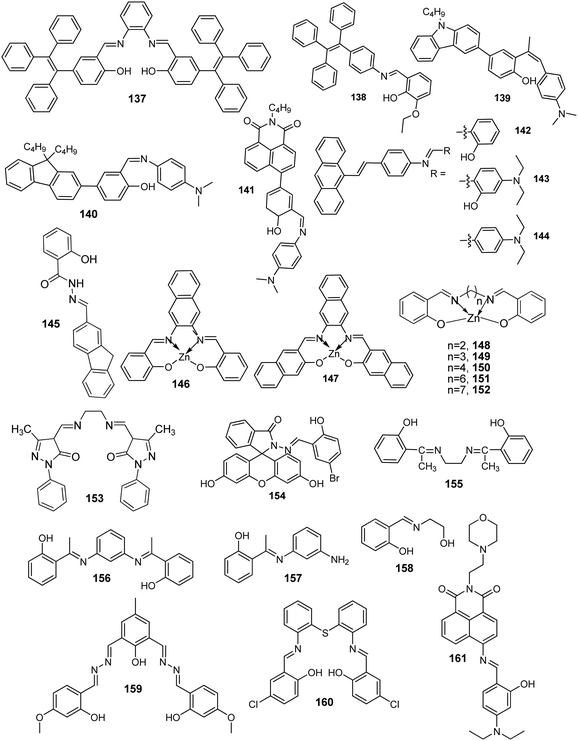
| 138 | Turn-on | — | — | Strong emission band between 550 and 700 | — | — | Enol to keto form photoisomerization | Rewritable paper and UV sensor | 188 | |
| 141 | Turn-on | CH3CN–H2O mixture | 350 | 463 | Cu2+ | 0.23 μM | CHEF effect | Metal ion sensor, mechanochromic fluorescence | 189 | |
| 143 | Turn-off | HEPES buffered methanol–H2O (4/1, v/v) | 432 | 508 | Cu2+ and Zn2+ | 0.212 μM and 71.9 nM for Cu2+ and Zn2+, respectively | — | PET process | Multi-metal ion sensor, solid state piezochromic luminescence | 190 |
| 145 | Turn-on | THF–H2O | 367 | 408 and 481 | — | — | — | AIE, ICT | Anti-counterfeiting and printed electronics | 191 |
| 146 and 147 | Turn-on | DMSO | 372 | 504 and 444 for sensors 146 and 147, respectively | Zn2+ | — | — | ICT process | Color tunable | 192 |
| 148–152 | Turn-on | DMSO | 365 | 447, 440, 436, 433, and 430 for complexes 148, 149, 150, 151, and 152, respectively | Zn2+ | — | — | Relaxation due to intra-ligand transition | Organic white light emitting devices | 193 |
| 153 | Blue fluorescent | CHCl3, THF, ethanol, CH3CN, and solid state | 345–370 | 430–460 | Zn2+ | — | — | Combination of monomer–excimer emission | Blue fluorescent OLED | 194 |
| 154 | Turn-on | HEPES buffered ethanol–H2O (9![[thin space (1/6-em)]](https://www.rsc.org/images/entities/char_2009.gif) : :![[thin space (1/6-em)]](https://www.rsc.org/images/entities/char_2009.gif) 1, v/v) 1, v/v) |
375 | 520 | Zn2+ | 1.59 μM | — | PET process, C![[double bond, length as m-dash]](https://www.rsc.org/images/entities/char_e001.gif) N isomerization and CHEF effect N isomerization and CHEF effect |
Metal ion sensor, logic gate, TLC supported paper strips, and bioimaging of intracellular Zn2+ in Vero cells (African green monkey kidney cells) | 195 |
| 155 | Turn-on | Methanol–water (1![[thin space (1/6-em)]](https://www.rsc.org/images/entities/char_2009.gif) : :![[thin space (1/6-em)]](https://www.rsc.org/images/entities/char_2009.gif) 1, v/v) 1, v/v) |
370 | 464 | Al3+ | 10 μM | — | PET process | Metal ion sensor, secondary sensor for PO43−, logic gate, BSA medium, live cell (rat L6 myoblast cells) imaging | 196 |
| 156 and 157 | Turn-on | Methanol | 375 | 465 and 464 for sensors 156 and 157, respectively | Al3+ | 0.525 μM and 2.38 μM for sensors 156 and 157, respectively | — | CHEF effect | Metal ion sensor, logic gate | 197 |
| 158 | Turn-on | Aqueous medium | 359 | 454 | Zn2+ | 0.477 μM | — | ESIPT process, C![[double bond, length as m-dash]](https://www.rsc.org/images/entities/char_e001.gif) N isomerization, and CHEF effect N isomerization, and CHEF effect |
Metal ion sensor, logic gate, keypad lock, and fluorescence imaging of Zn2+ in rice seedlings | 198 |
| 159 | Turn-on | DMSO–water (9![[thin space (1/6-em)]](https://www.rsc.org/images/entities/char_2009.gif) : :![[thin space (1/6-em)]](https://www.rsc.org/images/entities/char_2009.gif) 1, v/v) 1, v/v) |
482 | With Zn2+ (545) and Cd2+ (560) | Zn2+ and Cd2+ | 2.7 nM (for Zn2+) and 6.6 nM (for Cd2+) | For Zn2+, 83 to 91 in drinking water, and for Cd2+, 103 to 104 in drinking water | CHEF effect | Multi-metal ion sensor, logic gate, TLC plates, and drinking water | 199 |
| 160 | Turn-on | CH3CN | 400 | 542 | Ni2+ | 8.67 nM | 89 to 104.7 ± <0.2 in tap water, 94 to 98.7 ± <0.2 in river water, and 97.3 to 109.5 ± <0.2 in bottled water | CHEF effect | Metal ion sensor, logic gate, live cell imaging (HeLa cells), real samples | 200 |
| 161 | Turn-off | CH3CN–H2O (7![[thin space (1/6-em)]](https://www.rsc.org/images/entities/char_2009.gif) : :![[thin space (1/6-em)]](https://www.rsc.org/images/entities/char_2009.gif) 3) 3) |
344 | 531 | Fe3+ | 0.81 μM | 98.56 ± 0.19, 98.81 ± 0.35, 97.91 ± 0.21, 98.81 ± 1.03, 98.46 ± 0.28, 97.96 ± 0.23, and 94.51 ± 0.26 in tap water, lake, well, mineral water, distilled water, purified water and human serum albumin, respectively | ICT process and C![[double bond, length as m-dash]](https://www.rsc.org/images/entities/char_e001.gif) N isomerization N isomerization |
Metal ion sensor, logic gate, test paper, water samples and fluorescent bioimaging | 201 |
2. Strategies and mechanistic insights into fluorescence-based metal ion detection
The general approach for metal ion detection involves sensor–metal ion coordination interactions. A Schiff base sensor contains a binding functional unit that can coordinate with a metal ion, causing enhancement/quenching of emission intensity, ratiometric fluorescence change, or enhancement/quenching of fluorescence color of the solution, leading to chelation-enhanced fluorescence (CHEF) or chelation-enhanced quenching (CHEQ) effect. The commonly used mechanisms for metal ion detection are formation/disruption of self-assembly/disassembly, aggregation/disaggregation, photo-induced electron transfer (PET), intra/intermolecular charge transfer (ICT), metal to ligand charge transfer (MLCT), ligand to metal charge transfer (LMCT), Förster resonance energy transfer (FRET), excited state intramolecular proton transfer (ESIPT), inner filter effect (IFE), metal-induced chemical change and C![[double bond, length as m-dash]](https://www.rsc.org/images/entities/char_e001.gif) N isomerization.
N isomerization.
2.1 Self-assembly/disassembly
Self-assembled molecules are versatile materials for a variety of applications, including analyte detection and fluorescence imaging. In the sensing system, the fluorescence of the sensor can be modulated by analyte interaction and the self-assembly process. In the literature, various strategies such as self-assembly-disassembly driven detection of metal ions, metal ion-induced disassembly, self-assembly coupled with the AIE phenomenon, etc. have been used for fluorescence-based detection of metal ions.202,203 Herein, we will discuss the self-assembly-based mechanism for metal ion detection using fluorescent Schiff base molecules.Wu et al. developed pyrene-based Schiff base 1 with AEE (Aggregation emission enhancement) properties for fluorescence-based detection of Cu2+.72 In H2O–DMF (1![[thin space (1/6-em)]](https://www.rsc.org/images/entities/char_2009.gif) :
:![[thin space (1/6-em)]](https://www.rsc.org/images/entities/char_2009.gif) 1, v/v) solution, sensor 1 was weakly fluorescent (Fig. 2 and Table 2). In the presence of Cu2+, sensor 1 displayed strong fluorescence enhancement (4.5-fold) at 455 nm (λex = 370 nm). The LOD was 35 nM for Cu2+. The recognition mechanism was attributed to Cu2+ induced self-assembly. TEM and SEM results confirmed the spherical particle morphology and aggregation of sensor 1 in the presence of Cu2+.
1, v/v) solution, sensor 1 was weakly fluorescent (Fig. 2 and Table 2). In the presence of Cu2+, sensor 1 displayed strong fluorescence enhancement (4.5-fold) at 455 nm (λex = 370 nm). The LOD was 35 nM for Cu2+. The recognition mechanism was attributed to Cu2+ induced self-assembly. TEM and SEM results confirmed the spherical particle morphology and aggregation of sensor 1 in the presence of Cu2+.
 | ||
| Fig. 2 The sensing mechanism for Cu2+ detection using sensor 1. Reproduced with permission from ref. 72 Copyright 2018, Elsevier. | ||
2.2 Aggregation/disaggregation
Recently, Schiff base sensors with AIE properties have attracted tremendous attention for metal ion detection. Schiff base-based sensors are excellent AIE active molecules in which free rotation around the C![[double bond, length as m-dash]](https://www.rsc.org/images/entities/char_e001.gif) N band is restricted upon coordination with metal ions, leading to emission change. These sensors are weakly emissive in dilute solution but emit strongly upon aggregation assisted by probe–metal ion interaction in solution or in solid-state.
N band is restricted upon coordination with metal ions, leading to emission change. These sensors are weakly emissive in dilute solution but emit strongly upon aggregation assisted by probe–metal ion interaction in solution or in solid-state.
Singh et al. developed probe 2 with AIE and ESIPT properties for Cu2+ detection in an aqueous medium (Fig. 3A and Table 2).73 On excitation at 390 nm, the fluorescence spectrum of probe 2 displayed green emission at 526 nm, attributed to the AIE + ESIPT process. Upon gradual addition of an increasing concentration of Cu2+, the emission spectrum of probe 2 revealed quenching of emission intensity and saturation was achieved after the addition of 1 μM Cu2+. The limit of detection was 0.261 ppb for Cu2+. The coordination of probe 2 with Cu2+ resulted in the disassembly of self-assembled aggregates of probe 2 from self-assembled nanorods into smaller spherical nanostructures (Fig. 3B).
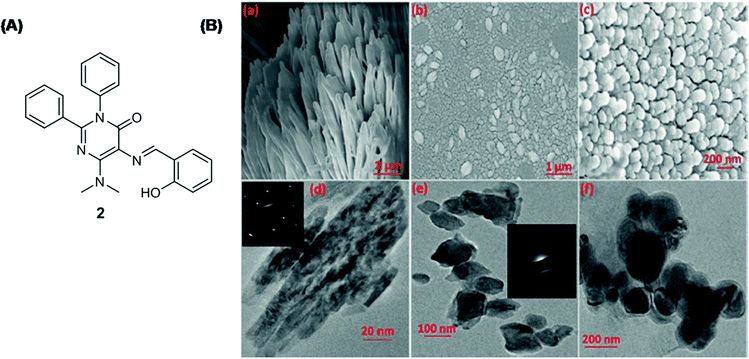 | ||
| Fig. 3 (A) The chemical structure of sensor 2. (B) SEM images of (a) sensor 2; (b and c) sensor 2 + Cu2+; TEM images of (d) sensor 2; (e and f) sensor 2 + Cu2+; (inset) SAED of aggregates. Reproduced with permission from ref. 73 Copyright 2016, Wiley-VCH Verlag GmbH & Co. KGaA, Weinheim. | ||
2.3 Photoinduced electron transfer (PET)
PET is a process where electron transfer occurs from the donor to the acceptor in the excited state. The coordination of metal ions with the Schiff base sensor may favor or disrupt the PET process, resulting in emission change.Chakraborty et al. developed pyrene-based Schiff base 3 with AIE properties for fluorescence-based detection of Cu2+ (Fig. 4 and Table 2).32 Sensor 3 was found to be selective for Cu2+ with an LOD of 2.5 μM. Sensor 3 was weakly fluorescent because of the PET process between the imine bond and the pyrene ring. The complexation of sensor 3 with Cu2+ blocked the PET process and resulted in fluorescence enhancement.
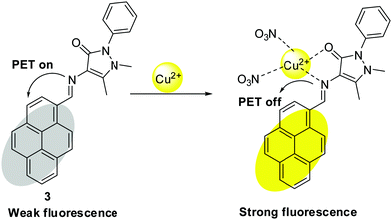 | ||
| Fig. 4 PET-based mechanism for Cu2+ detection with sensor 3. Reproduced with permission from ref. 32 Copyright 2018, Elsevier. | ||
Wang et al. developed coumarin-based Schiff base 4 with AIRE (Aggregation induced ratiometric emission) properties and employed it as a turn-off sensor for Cu2+ detection (Fig. 5 and Table 2).41 The complexation of Cu2+ with sensor 4 caused activation of the PET process between coumarin and the Cu2+ center, resulting in fluorescence quenching.
 | ||
| Fig. 5 PET-based mechanism for Cu2+ detection with sensor 4. Reproduced with permission from ref. 41 Copyright 2018, Elsevier. | ||
Dong et al. synthesized Schiff base 5 as a turn-on sensor for Zn2+ detection.74 Sensor 5 showed excellent sensitivity for Zn2+ over other tested metal ions. In the off-state, the PET process occurs from the HOMO of the azomethine group to the HOMO of the conjugated aromatic ring, whereas in the on-state the PET process is inhibited due to coordination of Zn2+ with the nitrogen atom and oxygen atom of the azomethine group, and electron transfer occurs from the LUMO to the HOMO of the conjugated aromatic ring (Fig. 6A, B and Table 2).
 | ||
| Fig. 6 (A) Sensing mechanism of sensor 5 for Zn2+ detection. (B) Orbital energy diagrams showing (a) fluorescence quenching by the PET process; (b) fluorescence enhancement due to the CHEF effect. Reproduced with permission from ref. 74 Copyright 2017, Elsevier. | ||
2.4 Intra/intermolecular charge transfer (ICT)
In the ICT process, energy relaxation of the excited molecule occurs via the charge transfer phenomenon. Charge transfer can be intramolecular where redistribution of charge occurs within the excited molecule or intermolecular in which charge is transferred from the excited donor molecule to the neighboring acceptor molecule.Rout et al. designed triazole-based Schiff base 6 as a turn-on fluorescent sensor for Cu2+ and Pb2+ detection (Fig. 7 and Table 2).75 In methanol–tris buffer (1![[thin space (1/6-em)]](https://www.rsc.org/images/entities/char_2009.gif) :
:![[thin space (1/6-em)]](https://www.rsc.org/images/entities/char_2009.gif) 1) medium, the free sensor displayed weak emission at 440 nm (λex = 340 nm), attributed to the PET process from the triazole and imine moiety to the fluorophore. In the presence of Cu2+/Pb2+, the fluorescence spectrum of sensor 6 displayed an increase in emission intensity attributed to blockage of the PET process and strengthening of the ICT process. The limit of detection was 1.2 μM and 0.9 μM for Cu2+ and Pb2+, respectively.
1) medium, the free sensor displayed weak emission at 440 nm (λex = 340 nm), attributed to the PET process from the triazole and imine moiety to the fluorophore. In the presence of Cu2+/Pb2+, the fluorescence spectrum of sensor 6 displayed an increase in emission intensity attributed to blockage of the PET process and strengthening of the ICT process. The limit of detection was 1.2 μM and 0.9 μM for Cu2+ and Pb2+, respectively.
 | ||
| Fig. 7 ICT- and PET-based sensing mechanism for Pb2+ and Cu2+ detection with sensor 6. Reproduced with permission from ref. 75 Copyright 2019, Royal Society of Chemistry. | ||
2.5 Metal to ligand charge transfer (MLCT)
Pannipara et al. developed an AIE-active Schiff base 7 as a turn-off sensor for Cu2+ detection (Fig. 8 and Table 2).76 In the THF–H2O (9![[thin space (1/6-em)]](https://www.rsc.org/images/entities/char_2009.gif) :
:![[thin space (1/6-em)]](https://www.rsc.org/images/entities/char_2009.gif) 1, v/v) mixture, sensor 7 showed intense emission at 484 nm. Upon addition of Cu2+ to the solution of sensor 7, a significant decrease in fluorescence intensity was observed, attributed to metal to ligand charge transfer between Cu2+ and sensor 7, resulting in the CHEQ effect.
1, v/v) mixture, sensor 7 showed intense emission at 484 nm. Upon addition of Cu2+ to the solution of sensor 7, a significant decrease in fluorescence intensity was observed, attributed to metal to ligand charge transfer between Cu2+ and sensor 7, resulting in the CHEQ effect.
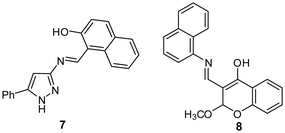 | ||
| Fig. 8 Chemical structure of sensors 7 and 8. Reproduced with permission from ref. 76 Copyright 2017, Elsevier. | ||
2.6 Ligand to metal charge transfer (LMCT)
Bhardwaj et al. developed chromone-based fluorescent organic nanoparticles (FON-8) for Cu2+ and CN− detection in an aqueous medium (Fig. 8 and Table 2).77 The fluorescence spectrum of FON-8 showed a gradual decrease in emission intensity at 517 nm (λex = 405 nm) upon the addition of an increasing concentration of Cu2+, attributed to ligand to metal charge transfer. The limit of detection was 12.3 nM for Cu2+. From the DFT method, for sensor 8, the HOMO was located on the naphthalene moiety and the LUMO was located on the whole sensor 8. However, in the case of the 8-Cu2+ complex, the LUMO was shifted toward the metal center, demonstrating ligand to metal charge transfer.2.7 Förster resonance energy transfer (FRET)
FRET is a non-radiative process where energy transfer occurs from excited donors to acceptor molecules. The metal–Schiff base complexation may inhibit or trigger the FRET process resulting in emission change.Yang et al. developed a novel method for Cu2+ detection through the AIE and FRET strategy in an aqueous medium (Fig. 9 and Table 2).78 The Schiff base sensor 9 exhibited AIE properties with green emission at 525 nm. In the presence of Cu2+, sensor 9 underwent fluorescence quenching and the limit of detection was 0.132 μM. However, through the sensor 9–NiR FRET system, the LOD for Cu2+ was reduced to 9.12 nM upon monitoring emission intensity at 620 nm.
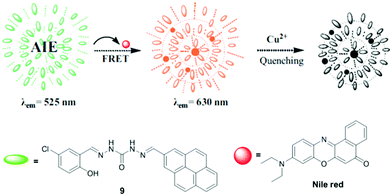 | ||
| Fig. 9 FRET-based sensing mechanism for Cu2+ detection with sensor 9. Reproduced with permission from ref. 78 Copyright 2019, Elsevier. | ||
2.8 Excited-state intramolecular proton transfer (ESIPT)
In the ESIPT process, generally, the transfer of protons occurs from the donor (NH, OH, etc.) to the acceptor (carbonyl, nitrogen, etc.). ESIPT based sensors generally show two emission bands, one due to the enol-form, and the other due to the tautomeric keto-form. Additionally, ESIPT based sensors show a large Stokes shift, high quantum yield, a low energy gap, etc. Usually, salicylimine type Schiff bases exhibit the ESIPT phenomenon because of keto–enol tautomerization.48,49Puri et al. developed Schiff base sensor 10 with AIE properties for fluorescence-based detection of Al3+ in methanol solution.79 On excitation at 360 nm, sensor 10 displayed emission at 548 nm accompanied by a large Stokes shift (188 nm), attributed to the ESIPT phenomena. Upon addition of Al3+ to the solution of sensor 10, further enhancement in emission intensity was observed with emission maxima at 476 nm and a Stokes shift of 116 nm, attributed to metal–template aggregation (Fig. 10 and Table 2).
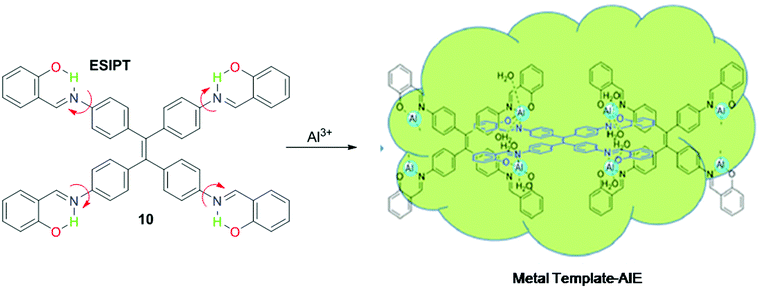 | ||
| Fig. 10 ESIPT based sensing mechanism for Al3+ detection with sensor 10. Reproduced with permission from ref. 79 Copyright 2018, Royal Society of Chemistry. | ||
2.9 Inner filter effect (IFE)
The inner filter effect is a radiative process where the excitation and/or emission energy of the probe is absorbed by the absorber in the sensing system. Earlier, it was considered as a source of error in fluorescence measurements. Nowadays, researchers have shown more interest in developing IFE-based sensors because (i) this approach is simple and straightforward, i.e. it does not require sensor–analyte interaction, and (ii) absorber's absorbance change transforms exponentially into emission change, resulting in increased sensitivity. The basic requirement for IFE to act is spectral overlap between the absorber's absorbance band and the excitation and/or emission band of the sensor.204Abbasi and Shakir et al. developed IFE-based Schiff base sensor 11 for Cr (VI) detection in an aqueous medium (Fig. 11A and Table 2).80 On excitation at 350 nm, sensor 11 showed emission maxima at 438 nm. Upon addition of Cr(VI), the fluorescence of sensor 11 was adequately quenched. The sensing mechanism was attributed to IFE, based on the good overlap between the absorption band of Cr(VI) (centered at 260 nm, 350 nm, and 440 nm) and the excitation band (at 350 nm) and/or emission band (at 438 nm) of sensor 11 (Fig. 11B). The limit of detection for Cr(VI) was 0.175 μM.
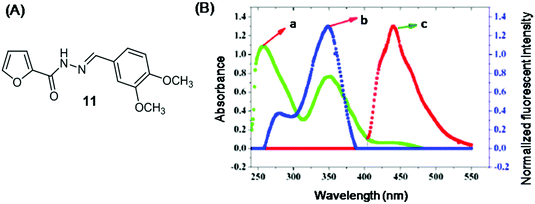 | ||
| Fig. 11 (A) Chemical structure of sensor 11. (B) (a) Absorbance spectrum of Cr(IV); normalized fluorescence (b) excitation and (c) emission spectrum of sensor 11. Reproduced with permission from ref. 80 Copyright 2018, Royal Society of Chemistry. | ||
2.10 Metal-induced chemical change and C![[double bond, length as m-dash]](https://www.rsc.org/images/entities/h3_char_e001.gif) N isomerization
N isomerization
Sometimes, the interaction of metal ions with the sensor results in some chemical reaction that changes the chemical structure of the ligand, resulting in emission change.
Hu et al. developed fluorene-naphthalene-based Schiff base sensor 12 for Al3+ and Cr3+ detection.81 In CH3CN–H2O (7![[thin space (1/6-em)]](https://www.rsc.org/images/entities/char_2009.gif) :
:![[thin space (1/6-em)]](https://www.rsc.org/images/entities/char_2009.gif) 3, v/v) solution, free sensor 12 was weakly emissive (λex = 305 nm). In the presence of Al3+ or Cr3+, sensor 12 underwent fluorescence enhancement 722 times and 923 times, respectively. The limit of detection was 0.887 nM and 0.631 nM for Al3+ and Cr3+, respectively. The recognition mechanism was a reaction-based process, wherein first oxidation of the C
3, v/v) solution, free sensor 12 was weakly emissive (λex = 305 nm). In the presence of Al3+ or Cr3+, sensor 12 underwent fluorescence enhancement 722 times and 923 times, respectively. The limit of detection was 0.887 nM and 0.631 nM for Al3+ and Cr3+, respectively. The recognition mechanism was a reaction-based process, wherein first oxidation of the C![[double bond, length as m-dash]](https://www.rsc.org/images/entities/char_e001.gif) N group of sensor 12 C
N group of sensor 12 C![[double bond, length as m-dash]](https://www.rsc.org/images/entities/char_e001.gif) N to O = C-NH occurred in the presence of Al3+ or Cr3+, and then coordination, which resulted in inhibition of C
N to O = C-NH occurred in the presence of Al3+ or Cr3+, and then coordination, which resulted in inhibition of C![[double bond, length as m-dash]](https://www.rsc.org/images/entities/char_e001.gif) N isomerization and in strong emission (Fig. 12 and Table 2).
N isomerization and in strong emission (Fig. 12 and Table 2).
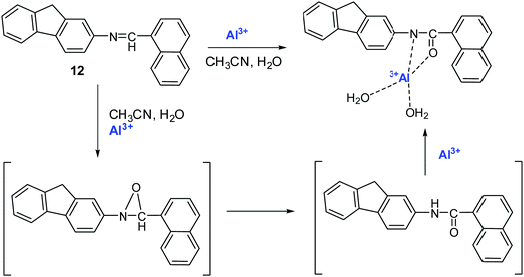 | ||
| Fig. 12 Sensing mechanism of sensor 12 with Al3+. Reproduced with permission from ref. 81 Copyright 2021, Elsevier. | ||
3. Applications
3.1 Metal ion sensors
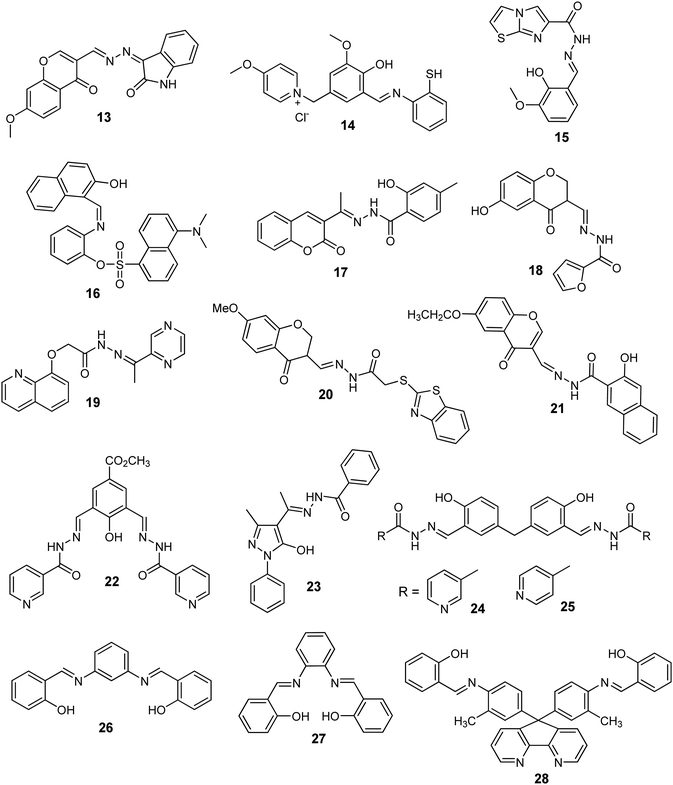
Some metal ions are very crucial for life such as Fe3+, Zn2+, K+, etc., whereas others such as Hg2+, Pb2+, Cd2+, etc., may cause serious environmental and health issues.1 Accordingly, detection of metal ions present in trace amounts is important. Recently, fluorescent Schiff base sensors for metal ion detection have grabbed significant attention because of their simplicity, selectivity, sensitivity, real-time detection, fast response time, and non-destructive properties. In addition, Schiff bases are eminent hard bases and have electron-rich oxygen and nitrogen donor atoms for coordination with metal ions.Wang et al. developed Schiff base 13 as a turn-on sensor for fluorescence-based detection of Mg2+ (Fig. 13 and Table 2).82 In ethanol solution, sensor 13 displayed weak emission at wavelength 547 nm (λex = 491 nm). Upon addition of Mg2+, sensor 13 displayed a 70-fold increase in fluorescence intensity at 547 nm. The detection limit was 0.516 μM for Mg2+. Job's plot showed 1![[thin space (1/6-em)]](https://www.rsc.org/images/entities/char_2009.gif) :
:![[thin space (1/6-em)]](https://www.rsc.org/images/entities/char_2009.gif) 1 (13/Mg2+) stoichiometry and the association constant was 3.33 × 10⁴ M−1 as calculated using the Benesi–Hildebrand equation. The chelation of sensor 13 with Mg2+ through oxygen and nitrogen atoms resulted in blockage of the PET process, causing fluorescence enhancement through the CHEF effect.
1 (13/Mg2+) stoichiometry and the association constant was 3.33 × 10⁴ M−1 as calculated using the Benesi–Hildebrand equation. The chelation of sensor 13 with Mg2+ through oxygen and nitrogen atoms resulted in blockage of the PET process, causing fluorescence enhancement through the CHEF effect.
Saleh et al. reported Schiff base sensor 14 as a ratiometric fluorescent sensor for Ca2+ (Fig. 13 and Table 2).83 In HEPES buffer solution (pH = 7.2), the free sensor showed a broad band with emission maxima at 545 nm (λex = 370 nm). The fluorescence titration with Ca2+ revealed ratiometric fluorescence change with the simultaneous increase in emission intensity at 483 nm and decrease in emission intensity at 545 nm. The limit of detection was 0.3 μM Ca2+ and the stoichiometry of the complex was 1![[thin space (1/6-em)]](https://www.rsc.org/images/entities/char_2009.gif) :
:![[thin space (1/6-em)]](https://www.rsc.org/images/entities/char_2009.gif) 1 (14
1 (14![[thin space (1/6-em)]](https://www.rsc.org/images/entities/char_2009.gif) :
:![[thin space (1/6-em)]](https://www.rsc.org/images/entities/char_2009.gif) Ca2+). The binding of Ca2+ with sensor 14 at the coordination sites, i.e., OH, C
Ca2+). The binding of Ca2+ with sensor 14 at the coordination sites, i.e., OH, C![[double bond, length as m-dash]](https://www.rsc.org/images/entities/char_e001.gif) N, SH, decreases the ICT process present in the sensor and results in ratiometric fluorescence change.
N, SH, decreases the ICT process present in the sensor and results in ratiometric fluorescence change.
Wang et al. synthesized an imidazo[2,1-b]thiazole-based Schiff base (15) as a turn-on sensor for Al3+ detection (Fig. 13 and Table 2).84 In HEPES buffer solution, sensor 15 was almost non-fluorescent. Upon addition of Al3+, the fluorescence spectrum of sensor 15 displayed emission enhancement at 488 nm (λex = 365 nm) along with a color change of the solution from colorless to bluish-green (Fig. 14). The complexation stoichiometry was 1![[thin space (1/6-em)]](https://www.rsc.org/images/entities/char_2009.gif) :
:![[thin space (1/6-em)]](https://www.rsc.org/images/entities/char_2009.gif) 1 (15/Al3+). The limit of detection and the association constant for Al3+ were 15.0 nM and 7.42 × 10⁴ M−1, respectively. The sensing mechanism could be attributed to inhibition of the PET process and the CHEF effect.
1 (15/Al3+). The limit of detection and the association constant for Al3+ were 15.0 nM and 7.42 × 10⁴ M−1, respectively. The sensing mechanism could be attributed to inhibition of the PET process and the CHEF effect.
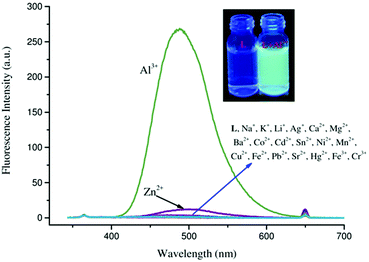 | ||
| Fig. 14 Fluorescence spectrum of sensor 15 in the presence of different metal ions. Inset: photographs of 15 (L) and 15 + Al3+ solution under UV lamp illumination. Reproduced with permission from ref. 84 Copyright 2021, Wiley-VCH GmbH. | ||
Chang et al. synthesized dansyl-based sensor 16 for fluorescence-based detection of Al3+ (Fig. 13 and Table 2).85 In methanol solution, sensor 16 exhibited weak emission at 550 nm (λex = 316 nm). Fluorescence titration with Al3+ revealed a prominent increase in emission intensity accompanied by a blue shift of the emission maxima from 550 nm to 448 nm (Δλshift = 102 nm). Job's plot revealed the 1![[thin space (1/6-em)]](https://www.rsc.org/images/entities/char_2009.gif) :
:![[thin space (1/6-em)]](https://www.rsc.org/images/entities/char_2009.gif) 1 (16
1 (16![[thin space (1/6-em)]](https://www.rsc.org/images/entities/char_2009.gif) :
:![[thin space (1/6-em)]](https://www.rsc.org/images/entities/char_2009.gif) Al3+) stoichiometry of the complex (Fig. 15A). The association constant was 9.40 × 10⁶ M−1 and the limit of detection was 14 nM for Al3+. In the 1H NMR titration experiment, the presence of a broad peak at 9.9 ppm and two singlets of the imine protons suggested Al3+ coordination at the imine site, thus inhibiting C
Al3+) stoichiometry of the complex (Fig. 15A). The association constant was 9.40 × 10⁶ M−1 and the limit of detection was 14 nM for Al3+. In the 1H NMR titration experiment, the presence of a broad peak at 9.9 ppm and two singlets of the imine protons suggested Al3+ coordination at the imine site, thus inhibiting C![[double bond, length as m-dash]](https://www.rsc.org/images/entities/char_e001.gif) N isomerization, causing the CHEF effect (Fig. 15B).
N isomerization, causing the CHEF effect (Fig. 15B).
 | ||
| Fig. 15 (A) Fluorescence titration of sensor 16 with the increasing concentration of Al3+ in CH3OH. (B) 1H NMR titration of sensor 16 with the increasing concentration of Al3+ in CD3OH. Reproduced with permission from ref. 85 Copyright 2015, Elsevier. | ||
Hossain et al. developed coumarin-based Schiff base chemosensor 17 for Al3+ detection (Fig. 13 and Table 2).86 Sensor 17 exhibited high selectivity for Al3+ among various other metal ions in DMF–H2O (v/v, 9![[thin space (1/6-em)]](https://www.rsc.org/images/entities/char_2009.gif) :
:![[thin space (1/6-em)]](https://www.rsc.org/images/entities/char_2009.gif) 1). Upon addition of Al3+, sensor 17 underwent a ∼34-fold increase in fluorescence intensity at 490 nm (λex = 390 nm). The stoichiometry of the complex was 1
1). Upon addition of Al3+, sensor 17 underwent a ∼34-fold increase in fluorescence intensity at 490 nm (λex = 390 nm). The stoichiometry of the complex was 1![[thin space (1/6-em)]](https://www.rsc.org/images/entities/char_2009.gif) :
:![[thin space (1/6-em)]](https://www.rsc.org/images/entities/char_2009.gif) 1 (17
1 (17![[thin space (1/6-em)]](https://www.rsc.org/images/entities/char_2009.gif) :
:![[thin space (1/6-em)]](https://www.rsc.org/images/entities/char_2009.gif) Al3+) and the detection limit was 6.7 μM for Al3+. The turn-on fluorescence response of sensor 17 with Al3+ was associated with the combined effect of ICT, CHEF, and C
Al3+) and the detection limit was 6.7 μM for Al3+. The turn-on fluorescence response of sensor 17 with Al3+ was associated with the combined effect of ICT, CHEF, and C![[double bond, length as m-dash]](https://www.rsc.org/images/entities/char_e001.gif) N isomerization.
N isomerization.
Li et al. designed and synthesized chromone-based sensor 18 as a turn-on sensor for Al3+ (Fig. 13 and Table 2).87 In ethanol solution, sensor 18 showed weak emission in the range of 440–690 nm. Among various metal ions, sensor 18 underwent 171-fold fluorescence enhancement with Al3+ at 502 nm (λex = 428 nm) and to a lesser extent with Mg2+ and Zn2+, whereas other metal ions had an insignificant effect on the fluorescence spectrum of sensor 18. The limit of detection was 38.7 nM for Al3+. The binding constant was 1.74 × 10⁷ M−1 and the stoichiometry of the complex was 1![[thin space (1/6-em)]](https://www.rsc.org/images/entities/char_2009.gif) :
:![[thin space (1/6-em)]](https://www.rsc.org/images/entities/char_2009.gif) 1 (18
1 (18![[thin space (1/6-em)]](https://www.rsc.org/images/entities/char_2009.gif) :
:![[thin space (1/6-em)]](https://www.rsc.org/images/entities/char_2009.gif) Al3+). The turn-on mechanism could be ascribed to the deactivation of the PET phenomenon upon chelation of Al3+ with sensor 18, forming a rigid system, and causing the CHEF effect.
Al3+). The turn-on mechanism could be ascribed to the deactivation of the PET phenomenon upon chelation of Al3+ with sensor 18, forming a rigid system, and causing the CHEF effect.
Li et al. prepared pyrazine-based sensor 19 for fluorescence-based detection of Al3+ (Fig. 13 and Table 2).88 Sensor 19 was weakly fluorescent with emission at 391 nm (λex = 350 nm) in ethanol solution. Upon addition of various metal ions, viz. Al3+, Ca2+, Ba2+, Mg2+, Fe3+, Cr3+, Co2+, Cu2+, Ni2+, Pb2+, Hg2+, Cd2+ and Zn2+, sensor 19 showed a drastic increase in fluorescence intensity at 488 nm with Al3+ and to a lesser extent with Fe3+ and Cr3+ ions, whereas other metal ions had an insignificant effect. The binding constant was 1.35 × 10⁴ M−1 as calculated using the Benesi–Hildebrand equation. The detection limit was 0.1 μM. Job's plot revealed the 1![[thin space (1/6-em)]](https://www.rsc.org/images/entities/char_2009.gif) :
:![[thin space (1/6-em)]](https://www.rsc.org/images/entities/char_2009.gif) 1 (19
1 (19![[thin space (1/6-em)]](https://www.rsc.org/images/entities/char_2009.gif) :
:![[thin space (1/6-em)]](https://www.rsc.org/images/entities/char_2009.gif) Al3+) stoichiometry of the complex. The complexation of Al3+ with sensor 19 caused the deactivation of the PET process and resulted in turn-on emission through the CHEF effect.
Al3+) stoichiometry of the complex. The complexation of Al3+ with sensor 19 caused the deactivation of the PET process and resulted in turn-on emission through the CHEF effect.
Liu et al. synthesized chromone-based Schiff base sensor 20 and evaluated it for Al3+ detection (Fig. 13 and Table 2).89 In ethanol solution, sensor 20 (λex = 410 nm) was non-fluorescent. On addition of various metal ions to the solution of sensor 20, only Al3+ caused significant (∼500-fold) fluorescence enhancement at 480 nm. The association constant of the complex was 1.21 × 10⁴ M−1 as calculated using the Benesi–Hildebrand equation. The detection limit was 31.9 nM for Al3+. Job's plot and ESI mass spectra revealed the 1![[thin space (1/6-em)]](https://www.rsc.org/images/entities/char_2009.gif) :
:![[thin space (1/6-em)]](https://www.rsc.org/images/entities/char_2009.gif) 1 (20
1 (20![[thin space (1/6-em)]](https://www.rsc.org/images/entities/char_2009.gif) :
:![[thin space (1/6-em)]](https://www.rsc.org/images/entities/char_2009.gif) Al3+) stoichiometry of the complex. The coordination of Al3+ caused inhibition of the PET phenomenon and resulted in turn-on fluorescence through the CHEF effect.
Al3+) stoichiometry of the complex. The coordination of Al3+ caused inhibition of the PET phenomenon and resulted in turn-on fluorescence through the CHEF effect.
Liu and Yang further synthesized chromone-based Schiff base sensor 21 for Al3+ detection (Fig. 13 and Table 2).90 Sensor 21 exhibited high selectivity and sensitivity for Al3+ detection among various other metal ions. In ethanol-H2O (v/v, 3![[thin space (1/6-em)]](https://www.rsc.org/images/entities/char_2009.gif) :
:![[thin space (1/6-em)]](https://www.rsc.org/images/entities/char_2009.gif) 1), upon addition of Al3+, sensor 21 underwent a drastic increase in fluorescence intensity at 475 nm and 508 nm (λex = 420 nm). The detection limit was 0.182 μM for Al3+. Job's plot revealed 2
1), upon addition of Al3+, sensor 21 underwent a drastic increase in fluorescence intensity at 475 nm and 508 nm (λex = 420 nm). The detection limit was 0.182 μM for Al3+. Job's plot revealed 2![[thin space (1/6-em)]](https://www.rsc.org/images/entities/char_2009.gif) :
:![[thin space (1/6-em)]](https://www.rsc.org/images/entities/char_2009.gif) 1 (21
1 (21![[thin space (1/6-em)]](https://www.rsc.org/images/entities/char_2009.gif) :
:![[thin space (1/6-em)]](https://www.rsc.org/images/entities/char_2009.gif) Al3+) stoichiometry and the association constant was 9.24 × 10³ M−1. Sensor 21 coordinates with Al3+ through two nitrogen atoms of azomethine groups forming a 2
Al3+) stoichiometry and the association constant was 9.24 × 10³ M−1. Sensor 21 coordinates with Al3+ through two nitrogen atoms of azomethine groups forming a 2![[thin space (1/6-em)]](https://www.rsc.org/images/entities/char_2009.gif) :
:![[thin space (1/6-em)]](https://www.rsc.org/images/entities/char_2009.gif) 1 (21:Al3+) complex, which inhibits the PET process and results in a turn-on fluorescence response. Sensor 21 also found potential application in the detection of Al3+ in solid-state.
1 (21:Al3+) complex, which inhibits the PET process and results in a turn-on fluorescence response. Sensor 21 also found potential application in the detection of Al3+ in solid-state.
Qin and Yang prepared bis-Schiff base sensor 22 for Al3+ detection (Fig. 13 and Table 2).91 In an aqueous solution, free sensor 22 was weakly fluorescent with emission maxima at 506 nm (λex = 389 nm). Among various metal ions, sensor 22 displayed strong fluorescence enhancement only with Al3+ and to a lesser extent with Zn2+. Fluorescence titration with Al3+ showed an increase in fluorescence intensity with a blue shift of the emission maxima from 506 nm to 460 nm (Δλshift = 40 nm). The detection limit was 0.69 μM for Al3+. Job's plot revealed 1![[thin space (1/6-em)]](https://www.rsc.org/images/entities/char_2009.gif) :
:![[thin space (1/6-em)]](https://www.rsc.org/images/entities/char_2009.gif) 1 (22
1 (22![[thin space (1/6-em)]](https://www.rsc.org/images/entities/char_2009.gif) :
:![[thin space (1/6-em)]](https://www.rsc.org/images/entities/char_2009.gif) Al3+) stoichiometry and the binding constant was 1.67 × 10⁴ M−1. The turn-on fluorescence response could be attributed to the inhibition of the ICT phenomenon due to the chelation of sensor 22 with Al3+ through imine nitrogen, the oxygen atom of the carboxylate group, and the oxygen atom of the phenolic hydroxyl group.
Al3+) stoichiometry and the binding constant was 1.67 × 10⁴ M−1. The turn-on fluorescence response could be attributed to the inhibition of the ICT phenomenon due to the chelation of sensor 22 with Al3+ through imine nitrogen, the oxygen atom of the carboxylate group, and the oxygen atom of the phenolic hydroxyl group.
Qin et al. designed Schiff base sensor 23 for fluorescence-based detection of Al3+ (Fig. 13 and Table 2).92 In ethanol solution, the fluorometric behavior of sensor 23 toward various metal ions revealed high selectivity only for Al3+. The detection limit was 0.2 μM. The complexation stoichiometry was 1![[thin space (1/6-em)]](https://www.rsc.org/images/entities/char_2009.gif) :
:![[thin space (1/6-em)]](https://www.rsc.org/images/entities/char_2009.gif) 1 (23
1 (23![[thin space (1/6-em)]](https://www.rsc.org/images/entities/char_2009.gif) :
:![[thin space (1/6-em)]](https://www.rsc.org/images/entities/char_2009.gif) Al3+) and the binding constant was 7.54 M−1. In the presence of Al3+, sensor 23 underwent a drastic increase in emission intensity at 420 nm (λex = 363 nm). The sensing mechanism could be attributed to the inhibition of the PET phenomenon due to the chelation of the –C
Al3+) and the binding constant was 7.54 M−1. In the presence of Al3+, sensor 23 underwent a drastic increase in emission intensity at 420 nm (λex = 363 nm). The sensing mechanism could be attributed to the inhibition of the PET phenomenon due to the chelation of the –C![[double bond, length as m-dash]](https://www.rsc.org/images/entities/char_e001.gif) N– group nitrogen atom with Al3+, causing the CHEF effect.
N– group nitrogen atom with Al3+, causing the CHEF effect.
Ruo et al. synthesized 5,5′-methylenebis(salicylaldehyde)-based Schiff base sensors 24 and 25 for Al3+ detection (Fig. 13 and Table 2).93 In DMSO-H2O solution, both sensors 24 and 25 are weakly fluorescent with emission at 491 nm and 473 nm, respectively. Among various metal ions, sensors 24 and 25 displayed a 70-fold and 40-fold increase in fluorescence intensity at 493 nm and 476 nm, respectively, only with Al3+. The binding constants of sensors 24 and 25 with Al3+ were 2.01 × 10⁴ M−1 and 5.46 × 10⁵ M−1, respectively, and the stoichiometry of the complex was 1![[thin space (1/6-em)]](https://www.rsc.org/images/entities/char_2009.gif) :
:![[thin space (1/6-em)]](https://www.rsc.org/images/entities/char_2009.gif) 1 (24/25
1 (24/25![[thin space (1/6-em)]](https://www.rsc.org/images/entities/char_2009.gif) :
:![[thin space (1/6-em)]](https://www.rsc.org/images/entities/char_2009.gif) Al3+). The detection limit of sensors 24 and 25 for Al3+ was 14.9 nM and 15.1 nM, respectively. The 1H NMR titration experiment revealed that sensors 24 and 25 chelated with Al3+ through the nitrogen atom of the imine moiety and the oxygen atom of the hydroxyl group, which resulted in deactivation of the PET process and fluorescence enhancement through the CHEF effect.
Al3+). The detection limit of sensors 24 and 25 for Al3+ was 14.9 nM and 15.1 nM, respectively. The 1H NMR titration experiment revealed that sensors 24 and 25 chelated with Al3+ through the nitrogen atom of the imine moiety and the oxygen atom of the hydroxyl group, which resulted in deactivation of the PET process and fluorescence enhancement through the CHEF effect.
Shoora et al. synthesized Schiff base sensors 26 and 27 for fluorescence-based detection of Al3+ (Fig. 13 and Table 2).94 Both sensors 26 and 27 are weakly fluorescent in methanol solution. Among various metal ions, both sensors 26 and 27 showed strong fluorescence enhancement with Al3+ and to a lesser extent with Zn2+ and Cr3+, whereas other metal ions had an insignificant effect. Fluorescence titration of sensors 26 and 27 with Al3+ revealed an increase in emission intensity at 506 nm (λex = 410 nm) and 489 nm (λex = 410 nm), respectively. The increase in fluorescence intensity was associated with a change in the color of the solution from colorless to blue, which can be detected by the naked eye under UV lamp illumination. The detection limit of sensors 26 and 27 for Al3+ was 47.9 nM and 82.8 nM, respectively. Job's plot indicated 1![[thin space (1/6-em)]](https://www.rsc.org/images/entities/char_2009.gif) :
:![[thin space (1/6-em)]](https://www.rsc.org/images/entities/char_2009.gif) 1 (26/27
1 (26/27![[thin space (1/6-em)]](https://www.rsc.org/images/entities/char_2009.gif) :
:![[thin space (1/6-em)]](https://www.rsc.org/images/entities/char_2009.gif) Al3+) complex stoichiometry and the stability constant was 1.41 × 10⁴ M−1 and 1.59 × 10⁴ M−1 for sensors 26 and 27, respectively. The mechanism of sensing could be ascribed to the CHEF process.
Al3+) complex stoichiometry and the stability constant was 1.41 × 10⁴ M−1 and 1.59 × 10⁴ M−1 for sensors 26 and 27, respectively. The mechanism of sensing could be ascribed to the CHEF process.
Zhang et al. synthesized Schiff base sensor 28 as a fluorescence turn-on sensor for Al3+ (Fig. 13 and Table 2).95 In ethanol solution, free sensor 28 was weakly fluorescent with emission at 478 nm (λex = 394 nm). Among various metal ions, sensor 28 showed 200-fold fluorescence enhancement at 478 nm only with Al3+, whereas other metal ions had an insignificant effect. The fluorescence change was associated with a change in the color of the solution from colorless to blue, which can be detected by the naked eye under UV lamp illumination. The limit of detection was 4.2 ppm for Al3+. The association constant was 1.4 × 10⁷ M−1 and the complex stoichiometry was 1![[thin space (1/6-em)]](https://www.rsc.org/images/entities/char_2009.gif) :
:![[thin space (1/6-em)]](https://www.rsc.org/images/entities/char_2009.gif) 1 (28
1 (28![[thin space (1/6-em)]](https://www.rsc.org/images/entities/char_2009.gif) :
:![[thin space (1/6-em)]](https://www.rsc.org/images/entities/char_2009.gif) Al3+). The coordination of Al3+ with sensor 28 caused the CHEF effect.
Al3+). The coordination of Al3+ with sensor 28 caused the CHEF effect.
Kumar et al. prepared 4-(N,N-diethylamino)salicylaldehyde-based Schiff base sensor 29 for Al3+ detection in DMF solution.96 Upon the addition of Al3+, sensor 29 displayed a turn-on fluorescence response (cyan color, λem = 481 nm) toward Al3+ over other tested metal ions. Sensor 29 binds with Al3+ in a 2![[thin space (1/6-em)]](https://www.rsc.org/images/entities/char_2009.gif) :
:![[thin space (1/6-em)]](https://www.rsc.org/images/entities/char_2009.gif) 1 manner, forming a six coordinated Al3+-complex, and resulting in inhibition of the ICT process and leading to turn-on emission through the CHEF effect (Fig. 16, 17 and Table 2).
1 manner, forming a six coordinated Al3+-complex, and resulting in inhibition of the ICT process and leading to turn-on emission through the CHEF effect (Fig. 16, 17 and Table 2).
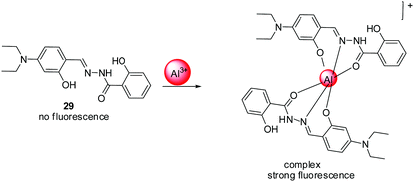 | ||
| Fig. 16 Sensing mechanism for Al3+ detection with sensor 29. Reproduced with permission from ref.96 Copyright 2022, Elsevier. | ||
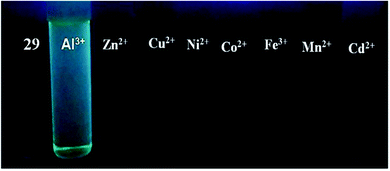 | ||
| Fig. 17 Photographs of sensor 29 solution in the presence of different metal ions under 364 nm UV light illumination. Reproduced with permission from ref. 96 Copyright 2022, Elsevier. | ||
Wang et al. synthesized tetrastyrene based sensor 30 (AIE-active) for fluorescence-based detection of Al3+ in methanol–H2O (9![[thin space (1/6-em)]](https://www.rsc.org/images/entities/char_2009.gif) :
:![[thin space (1/6-em)]](https://www.rsc.org/images/entities/char_2009.gif) 1, v/v) solution (Fig. 18, Table 2).97 The free sensor 30 was weakly fluorescent. With the addition of Al3+, the fluorescence spectrum of sensor 30 displayed an increase in emission intensity at 521 nm (λex = 334 nm) and a good linear relationship (0–1.8 × 10⁻⁵ M). The binding ratio and the binding constant were 1
1, v/v) solution (Fig. 18, Table 2).97 The free sensor 30 was weakly fluorescent. With the addition of Al3+, the fluorescence spectrum of sensor 30 displayed an increase in emission intensity at 521 nm (λex = 334 nm) and a good linear relationship (0–1.8 × 10⁻⁵ M). The binding ratio and the binding constant were 1![[thin space (1/6-em)]](https://www.rsc.org/images/entities/char_2009.gif) :
:![[thin space (1/6-em)]](https://www.rsc.org/images/entities/char_2009.gif) 1 (30
1 (30![[thin space (1/6-em)]](https://www.rsc.org/images/entities/char_2009.gif) :
:![[thin space (1/6-em)]](https://www.rsc.org/images/entities/char_2009.gif) Al3+) and 2.24 × 10⁴ M−1, respectively. The sensing mechanism was attributed to inhibition of the PET process and the CHEF effect. From the 1H NMR titration experiment, with the addition of Al3+, the disappearance of proton signals at 10.97 ppm (–OH), a slight shift of proton signals at 12.17 ppm (–CH
Al3+) and 2.24 × 10⁴ M−1, respectively. The sensing mechanism was attributed to inhibition of the PET process and the CHEF effect. From the 1H NMR titration experiment, with the addition of Al3+, the disappearance of proton signals at 10.97 ppm (–OH), a slight shift of proton signals at 12.17 ppm (–CH![[double bond, length as m-dash]](https://www.rsc.org/images/entities/char_e001.gif) N–), and splitting of proton signals at 9.10 ppm (–CH
N–), and splitting of proton signals at 9.10 ppm (–CH![[double bond, length as m-dash]](https://www.rsc.org/images/entities/char_e001.gif) N–) indicated chelation of Al3+ with the nitrogen atom of the imine group, the oxygen atom of the phenol hydroxyl group and the oxygen atom of aldehyde in sensor 30.
N–) indicated chelation of Al3+ with the nitrogen atom of the imine group, the oxygen atom of the phenol hydroxyl group and the oxygen atom of aldehyde in sensor 30.
 | ||
| Fig. 18 Sensing mechanism for Al3+ detection with sensor 30. Reproduced with permission from ref. 97 Copyright 2021, Elsevier. | ||
Kolcu et al. designed and synthesized sensor 31 as a turn-on sensor for Sn(II) (Fig. 19 and Table 2).98 In DMSO–H2O (1![[thin space (1/6-em)]](https://www.rsc.org/images/entities/char_2009.gif) :
:![[thin space (1/6-em)]](https://www.rsc.org/images/entities/char_2009.gif) 1, v/v) solution, sensor 31 was non-fluorescent due to C
1, v/v) solution, sensor 31 was non-fluorescent due to C![[double bond, length as m-dash]](https://www.rsc.org/images/entities/char_e001.gif) N isomerization and the PET process. However, in the presence of Sn2+, the fluorescence spectrum of sensor 31 displayed a strong emission band at 460 nm (λex = 320 nm) along with a color change of the solution from yellow to deep blue under a UV lamp. The chelation of Sn2+ with sensor 31 resulted in inhibition of the PET process and C
N isomerization and the PET process. However, in the presence of Sn2+, the fluorescence spectrum of sensor 31 displayed a strong emission band at 460 nm (λex = 320 nm) along with a color change of the solution from yellow to deep blue under a UV lamp. The chelation of Sn2+ with sensor 31 resulted in inhibition of the PET process and C![[double bond, length as m-dash]](https://www.rsc.org/images/entities/char_e001.gif) N isomerization, resulting in fluorescence enhancement through the CHEF effect. The complexation stoichiometry was 1
N isomerization, resulting in fluorescence enhancement through the CHEF effect. The complexation stoichiometry was 1![[thin space (1/6-em)]](https://www.rsc.org/images/entities/char_2009.gif) :
:![[thin space (1/6-em)]](https://www.rsc.org/images/entities/char_2009.gif) 2 (31/Sn2+) and the binding constant was 6.8 × 10⁹ M−2. The limit of detection was 0.314 μM for Sn2+.
2 (31/Sn2+) and the binding constant was 6.8 × 10⁹ M−2. The limit of detection was 0.314 μM for Sn2+.
Chalmardi et al. utilized Schiff base sensor 32 for Cr3+ detection (Fig. 19 and Table 2).99 In acetonitrile–water (95/5%), sensor 32 displayed high selectivity for Cr3+ over other metal ions. In the presence of Cr3+, sensor 32 underwent fluorescence enhancement at 537 nm (λex = 273 nm). The complex stoichiometry was 1![[thin space (1/6-em)]](https://www.rsc.org/images/entities/char_2009.gif) :
:![[thin space (1/6-em)]](https://www.rsc.org/images/entities/char_2009.gif) 1 (32
1 (32![[thin space (1/6-em)]](https://www.rsc.org/images/entities/char_2009.gif) :
:![[thin space (1/6-em)]](https://www.rsc.org/images/entities/char_2009.gif) Cr3+). The binding constant was 8.77 × 10⁴ M−1 as calculated using the Benesi–Hildebrand equation. The limit of detection was 0.22 μM for Cr3+. The sensing mechanism could be ascribed to the blockage of the PET process due to coordination of Cr3+ with the imine moiety and the phenolic hydroxyl group of sensor 32, causing fluorescence enhancement through the CHEF effect.
Cr3+). The binding constant was 8.77 × 10⁴ M−1 as calculated using the Benesi–Hildebrand equation. The limit of detection was 0.22 μM for Cr3+. The sensing mechanism could be ascribed to the blockage of the PET process due to coordination of Cr3+ with the imine moiety and the phenolic hydroxyl group of sensor 32, causing fluorescence enhancement through the CHEF effect.
The same group further reported another Schiff base sensor 33 for Cr3+ detection (Fig. 19 and Table 2).100 In acetonitrile–water (95/5%), free sensor 33 was weakly fluorescent. In the presence of Cr3+, sensor 33 showed a rapid turn-on fluorescence response at 663 nm (λex = 360 nm). The stoichiometry of the complex was 1![[thin space (1/6-em)]](https://www.rsc.org/images/entities/char_2009.gif) :
:![[thin space (1/6-em)]](https://www.rsc.org/images/entities/char_2009.gif) 1 (33
1 (33![[thin space (1/6-em)]](https://www.rsc.org/images/entities/char_2009.gif) :
:![[thin space (1/6-em)]](https://www.rsc.org/images/entities/char_2009.gif) Cr3+) and the association constant was 2.28 × 10⁵ M−1. The detection limit was 0.13 μM for Cr3+. The mechanism of detection was inhibition of the PET phenomenon because of Cr3+ coordination with sensor 33, causing turn-on fluorescence through the CHEF effect.
Cr3+) and the association constant was 2.28 × 10⁵ M−1. The detection limit was 0.13 μM for Cr3+. The mechanism of detection was inhibition of the PET phenomenon because of Cr3+ coordination with sensor 33, causing turn-on fluorescence through the CHEF effect.
He et al. designed carbazole-based Schiff base 34 as an on–off sensor for Fe3+ detection (Fig. 19 and Table 2).101 Upon excitation at 280 nm, the fluorescence spectrum of 34 displayed emission in the range of 330–520 nm in DMF solution. Sensor 34 exhibited high selectivity for Fe3+ among various other metal ions. 60% quenching in fluorescence intensity of sensor 34 was observed with 10 equivalents of Fe3+. Job's plot revealed 1![[thin space (1/6-em)]](https://www.rsc.org/images/entities/char_2009.gif) :
:![[thin space (1/6-em)]](https://www.rsc.org/images/entities/char_2009.gif) 1 (34/Fe3+) complex stoichiometry. The binding constant was 7.98 × 10⁻⁶ M−1 and the limit of detection was 37.5 nM. The mechanism of interaction could be attributed to the charge transfer process (LMCT) from sensor 34 to Fe3+.
1 (34/Fe3+) complex stoichiometry. The binding constant was 7.98 × 10⁻⁶ M−1 and the limit of detection was 37.5 nM. The mechanism of interaction could be attributed to the charge transfer process (LMCT) from sensor 34 to Fe3+.
Li et al. developed quinoline-based sensor 35 for fluorescence-based detection of Fe3+ (Fig. 19 and Table 2).102 In an aqueous solution, free sensor 35 was non-fluorescent. Upon addition of Fe3+, sensor 35 underwent a 44-fold increase in emission intensity at 505 nm (λex = 256 nm). Various other tested metal ions had insignificant effects on the fluorescence spectrum of sensor 35. Job's plot indicated 1![[thin space (1/6-em)]](https://www.rsc.org/images/entities/char_2009.gif) :
:![[thin space (1/6-em)]](https://www.rsc.org/images/entities/char_2009.gif) 1 (35/Fe3+) binding stoichiometry. The binding constant was 7.22 × 10⁴ M−1 and the detection limit was 4.8 × 10⁻⁸ M for Fe3+. The coordination of Fe3+ with sensor 35 resulted in blockage of the PET process and turn-on emission through the CHEF effect.
1 (35/Fe3+) binding stoichiometry. The binding constant was 7.22 × 10⁴ M−1 and the detection limit was 4.8 × 10⁻⁸ M for Fe3+. The coordination of Fe3+ with sensor 35 resulted in blockage of the PET process and turn-on emission through the CHEF effect.
Santhoshkumar et al. reported naphthalene pyridine-based Schiff base 36 as a fluorescent sensor for Fe2+ detection (Fig. 19 and Table 2).103 Sensor 36 was weakly fluorescent in acetonitrile–H2O (1![[thin space (1/6-em)]](https://www.rsc.org/images/entities/char_2009.gif) :
:![[thin space (1/6-em)]](https://www.rsc.org/images/entities/char_2009.gif) 1, v/v) solution. In the presence of Fe2+ (λex = 300 nm), sensor 36 underwent fluorescence enhancement along with red-shift in emission wavelength from 345 nm to 370 nm. In comparison with other metal ions, sensor 36 exhibited selective fluorescence response with Fe2+ only. Job's plot indicated 2
1, v/v) solution. In the presence of Fe2+ (λex = 300 nm), sensor 36 underwent fluorescence enhancement along with red-shift in emission wavelength from 345 nm to 370 nm. In comparison with other metal ions, sensor 36 exhibited selective fluorescence response with Fe2+ only. Job's plot indicated 2![[thin space (1/6-em)]](https://www.rsc.org/images/entities/char_2009.gif) :
:![[thin space (1/6-em)]](https://www.rsc.org/images/entities/char_2009.gif) 1 (36/Fe2+) binding stoichiometry and the binding constant was 5.02 × 10⁴ M−1. The limit of detection was 0.15 μM for Fe2+. The coordination of Fe2+ with sensor 36 through the imine moiety inhibited the ICT process present in free sensor 36 and caused fluorescence enhancement through the CHEF effect. Sensor 36 found potential application in Fe2+ detection in real samples.
1 (36/Fe2+) binding stoichiometry and the binding constant was 5.02 × 10⁴ M−1. The limit of detection was 0.15 μM for Fe2+. The coordination of Fe2+ with sensor 36 through the imine moiety inhibited the ICT process present in free sensor 36 and caused fluorescence enhancement through the CHEF effect. Sensor 36 found potential application in Fe2+ detection in real samples.
Zhao et al. designed phenanthro[9,10-d]imidazole-coumarin-based Schiff bases 37 and 38 as fluorescent sensors for Fe3+ detection (Fig. 19 and Table 2).104 In DMF/HEPES buffer (7![[thin space (1/6-em)]](https://www.rsc.org/images/entities/char_2009.gif) :
:![[thin space (1/6-em)]](https://www.rsc.org/images/entities/char_2009.gif) 3, v/v) solution, the fluorescence spectrum of free sensors 37 and 38 displayed emission maxima at 446 nm (λex = 318 nm) and 426 nm (λex = 304 nm), respectively. Among various metal ions, both sensors 37 and 38 underwent fluorescence quenching only with Fe3+. The detection limit of sensors 37 and 38 was 4.28 μM and 0.83 μM, respectively, for Fe3+. The binding constant of sensors 37 and 38 with Fe3+ was 1.52 × 10⁵ M−1 and 7.69 × 10⁴ M−1, respectively. The binding stoichiometry was 1
3, v/v) solution, the fluorescence spectrum of free sensors 37 and 38 displayed emission maxima at 446 nm (λex = 318 nm) and 426 nm (λex = 304 nm), respectively. Among various metal ions, both sensors 37 and 38 underwent fluorescence quenching only with Fe3+. The detection limit of sensors 37 and 38 was 4.28 μM and 0.83 μM, respectively, for Fe3+. The binding constant of sensors 37 and 38 with Fe3+ was 1.52 × 10⁵ M−1 and 7.69 × 10⁴ M−1, respectively. The binding stoichiometry was 1![[thin space (1/6-em)]](https://www.rsc.org/images/entities/char_2009.gif) :
:![[thin space (1/6-em)]](https://www.rsc.org/images/entities/char_2009.gif) 1 (37/38
1 (37/38![[thin space (1/6-em)]](https://www.rsc.org/images/entities/char_2009.gif) :
:![[thin space (1/6-em)]](https://www.rsc.org/images/entities/char_2009.gif) Fe3+). The observed fluorescence quenching could be attributed to electron/energy transfer from Fe3+ to sensors 37 and 38 because of the paramagnetic nature of Fe3+. Both sensors 37 and 38 found potential application in Fe3+ detection in real water samples.
Fe3+). The observed fluorescence quenching could be attributed to electron/energy transfer from Fe3+ to sensors 37 and 38 because of the paramagnetic nature of Fe3+. Both sensors 37 and 38 found potential application in Fe3+ detection in real water samples.
Zhang et al. synthesized salicylal derived Schiff base sensor 39 for fluorescence-based detection of Co2+ (Fig. 19 and Table 2).105 Among various metal ions, sensor 39 showed high selectivity only for Co2+ in ethanol solution (Fig. 20). Fluorescence titration of sensor 39 with Co2+ revealed an increase in emission intensity at 350 nm (λex = 298 nm). The plot of fluorescence intensity vs the concentration of Co2+ was linear in the range of 8.0 × 10⁻⁷ to 2.0 × 10⁻⁶ M. The limit of detection was 0.782 μM for Co2+. Job's plot revealed the 1![[thin space (1/6-em)]](https://www.rsc.org/images/entities/char_2009.gif) :
:![[thin space (1/6-em)]](https://www.rsc.org/images/entities/char_2009.gif) 4 (39
4 (39![[thin space (1/6-em)]](https://www.rsc.org/images/entities/char_2009.gif) :
:![[thin space (1/6-em)]](https://www.rsc.org/images/entities/char_2009.gif) Co2+) stoichiometry of the complex. 1H NMR studies in the absence and presence of Co2+ suggested the involvement of the nitrogen atom of the N
Co2+) stoichiometry of the complex. 1H NMR studies in the absence and presence of Co2+ suggested the involvement of the nitrogen atom of the N![[double bond, length as m-dash]](https://www.rsc.org/images/entities/char_e001.gif) C–H group and the phenolic O–H group in coordination with Co2+. Sensor 39 could be used for Co2+ monitoring in environmental systems.
C–H group and the phenolic O–H group in coordination with Co2+. Sensor 39 could be used for Co2+ monitoring in environmental systems.
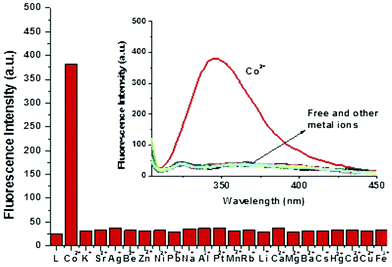 | ||
| Fig. 20 Fluorescence response of sensor 39 with different metal ions in ethanol solution. Reproduced with permission from ref. 105 Copyright 2017, Elsevier. | ||
Dalbera et al. developed pyrene-based Schiff base sensor 40 for Cu2+ detection (Fig. 19 and Table 2).106 In CH3CN–H2O (9/1, v/v), the fluorescence experiment revealed the high selectivity of sensor 40 towards Cu2+ over other metal ions, viz. K+, Na+, Ni2+, Pb2+, Hg2+, Zn2+, Al3+, Co2+, and Fe3+. Upon gradual addition of Cu2+, sensor 40 underwent a 93% decrease in emission intensity at 429 nm (λex = 384 nm). The fluorescence quenching could be ascribed to the reduction of π-conjugation in sensor 40 upon coordination with Cu2+, because of sensor 40 to metal charge transfer (LMCT). Job's plot indicated 2![[thin space (1/6-em)]](https://www.rsc.org/images/entities/char_2009.gif) :
:![[thin space (1/6-em)]](https://www.rsc.org/images/entities/char_2009.gif) 2 (40
2 (40![[thin space (1/6-em)]](https://www.rsc.org/images/entities/char_2009.gif) :
:![[thin space (1/6-em)]](https://www.rsc.org/images/entities/char_2009.gif) Cu2+) stoichiometry and the detection limit was 0.503 μM for Cu2+. The quenching constant as calculated using the Stern–Volmer equation was 1.38 × 10⁵ M−1. The binding constant as obtained using the Benesi–Hildebrand equation was 5.65 × 10⁵ M−1. Sensor 40 also found potential application in Cu2+ detection in real water samples such as tap water and drinking water.
Cu2+) stoichiometry and the detection limit was 0.503 μM for Cu2+. The quenching constant as calculated using the Stern–Volmer equation was 1.38 × 10⁵ M−1. The binding constant as obtained using the Benesi–Hildebrand equation was 5.65 × 10⁵ M−1. Sensor 40 also found potential application in Cu2+ detection in real water samples such as tap water and drinking water.
Carlos et al. prepared fluorene-based Schiff base sensor 41 and utilized it for metal ion detection in DMSO solutions (Fig. 19 and Table 2).107 Among various metal ions, sensor 41 exhibited significant fluorescence quenching at 307 nm (λex = 278 nm) with Cu2+. The stoichiometry of the complex was 2![[thin space (1/6-em)]](https://www.rsc.org/images/entities/char_2009.gif) :
:![[thin space (1/6-em)]](https://www.rsc.org/images/entities/char_2009.gif) 1 (Cu2+/41). The Stern–Volmer constant (Ksv) and the binding constant of sensor 41 with Cu2+ were 2.26 × 10¹² M−1 and 1.74 × 10¹² M−1, respectively. The detection limit was 0.037 μM for Cu2+. The coordination of one Cu2+ through the imine group as well as the nitrogen atom of the amide group and the second Cu2+ through the pyridine ring nitrogen atom as well as oxygen atoms from solvent molecules facilitated electron transfer from Cu2+ to sensor 41 and resulted in fluorescence quenching.
1 (Cu2+/41). The Stern–Volmer constant (Ksv) and the binding constant of sensor 41 with Cu2+ were 2.26 × 10¹² M−1 and 1.74 × 10¹² M−1, respectively. The detection limit was 0.037 μM for Cu2+. The coordination of one Cu2+ through the imine group as well as the nitrogen atom of the amide group and the second Cu2+ through the pyridine ring nitrogen atom as well as oxygen atoms from solvent molecules facilitated electron transfer from Cu2+ to sensor 41 and resulted in fluorescence quenching.
Fu et al. synthesized Schiff base sensor 42 using diarylethene and the 1,8-naphthalimide unit (Fig. 19 and Table 2).108 In acetonitrile solution, sensor 42 showed significant fluorescence and color change with Cu2+ in comparison with other metal ions. Sensor 42 underwent fluorescence quenching at 542 nm (λex = 296 nm) with Cu2+ and the color of the solution changed from bright green to dark. Job's plot and the mass spectrum revealed 1![[thin space (1/6-em)]](https://www.rsc.org/images/entities/char_2009.gif) :
:![[thin space (1/6-em)]](https://www.rsc.org/images/entities/char_2009.gif) 1 (42/Cu2+) stoichiometry. The binding constant was 3.13 × 10⁴ M−1 as calculated using the modified Benesi–Hildebrand equation. The limit of detection was 2.4 μM.
1 (42/Cu2+) stoichiometry. The binding constant was 3.13 × 10⁴ M−1 as calculated using the modified Benesi–Hildebrand equation. The limit of detection was 2.4 μM.
Kumar et al. reported naphthylamine and benzyl-derived sensor 43 for Cu2+ detection (Fig. 19 and Table 2).109 In CH3CN/H2O (1![[thin space (1/6-em)]](https://www.rsc.org/images/entities/char_2009.gif) :
:![[thin space (1/6-em)]](https://www.rsc.org/images/entities/char_2009.gif) 1, v/v) solution, the fluorescence spectrum of sensor 43 displayed emission at 435 nm (λex = 310 nm). Upon addition of Cu2+, sensor 43 underwent a decrease in fluorescence intensity associated with the blue shift of the emission maxima from 435 nm to 410 nm. The plot of fluorescence intensity ratio vs the concentration of Cu2+ was linear in the range of 5 × 10⁻⁵ to 3 × 10⁻⁴ M. The detection limit was 10−5 M. The Stern–Volmer constant (Ksv) was 1.1 × 10⁴ M−1. The binding constant was log
1, v/v) solution, the fluorescence spectrum of sensor 43 displayed emission at 435 nm (λex = 310 nm). Upon addition of Cu2+, sensor 43 underwent a decrease in fluorescence intensity associated with the blue shift of the emission maxima from 435 nm to 410 nm. The plot of fluorescence intensity ratio vs the concentration of Cu2+ was linear in the range of 5 × 10⁻⁵ to 3 × 10⁻⁴ M. The detection limit was 10−5 M. The Stern–Volmer constant (Ksv) was 1.1 × 10⁴ M−1. The binding constant was log![[thin space (1/6-em)]](https://www.rsc.org/images/entities/char_2009.gif) β = 6.4. The stoichiometry of the complex was 1
β = 6.4. The stoichiometry of the complex was 1![[thin space (1/6-em)]](https://www.rsc.org/images/entities/char_2009.gif) :
:![[thin space (1/6-em)]](https://www.rsc.org/images/entities/char_2009.gif) 2 (43/Cu2+). One Cu2+ coordinates with the nitrogen atom of the imine moiety and the second Cu2+ binds to benzyl rings through cation–π interaction.
2 (43/Cu2+). One Cu2+ coordinates with the nitrogen atom of the imine moiety and the second Cu2+ binds to benzyl rings through cation–π interaction.
Moghadam et al. designed fluorene-based Schiff base sensor 44 and utilized it for fluorescence-based detection of Cu2+ (Fig. 19 and Table 2).110 Sensor 44 was non-fluorescent in acetonitrile solution. In the presence of Cu2+, sensor 44 showed strong fluorescence enhancement at 369 nm (λex = 340 nm). The binding constant was 2.84 × 10⁵ M−1 as calculated using the Benesi–Hildebrand equation. The limit of detection was 1.54 nM for Cu2+. Job's plot revealed 1![[thin space (1/6-em)]](https://www.rsc.org/images/entities/char_2009.gif) :
:![[thin space (1/6-em)]](https://www.rsc.org/images/entities/char_2009.gif) 1 (44/Cu2+) stoichiometry. The chelation of sensor 44 with Cu2+ resulted in the formation of a more rigid system because of blocking of the ICT process and restriction in C
1 (44/Cu2+) stoichiometry. The chelation of sensor 44 with Cu2+ resulted in the formation of a more rigid system because of blocking of the ICT process and restriction in C![[double bond, length as m-dash]](https://www.rsc.org/images/entities/char_e001.gif) N isomerization, causing turn-on emission through the CHEF effect. Sensor 44 found practical application in the detection of copper in electroplating wastewater.
N isomerization, causing turn-on emission through the CHEF effect. Sensor 44 found practical application in the detection of copper in electroplating wastewater.
Torawane et al. prepared Schiff base sensor 45 as a turn-off sensor for Cu2+ detection (Fig. 19 and Table 2).111 Among various tested metal ions, sensor 45 underwent instant fluorescence quenching only with Cu2+ at emission wavelength 554 nm (λex = 386 nm) in an aqueous solution. The detection limit of sensor 45 was 0.35 μM for Cu2+. The association constant was 2.67 × 10⁵ M−1 as determined using the non-linear curve fitting method and the binding stoichiometry was 1![[thin space (1/6-em)]](https://www.rsc.org/images/entities/char_2009.gif) :
:![[thin space (1/6-em)]](https://www.rsc.org/images/entities/char_2009.gif) 1 (45/Cu2+). The mechanism of sensing could be ascribed to the excited state electron transfer from sensor 45 to Cu2+.
1 (45/Cu2+). The mechanism of sensing could be ascribed to the excited state electron transfer from sensor 45 to Cu2+.
Wang et al. synthesized imidazole- and benzimidazole-based Schiff base sensors 46 and 47, respectively, for Cu2+ detection (Fig. 22 and Table 2).112 In DMF solution, sensors 46 and 47 displayed emission at wavelength 411 nm and 416 nm, respectively. Both sensors 46 and 47 exhibited specificity for Cu2+ over other tested metal ions and underwent fluorescence enhancement with Cu2+. The detection limit of Sensor 47 was 1 nM for Cu2+. The coordination of Cu2+ with sensors 46 and 47 through the –C![[double bond, length as m-dash]](https://www.rsc.org/images/entities/char_e001.gif) N– group and the imidazole ring resulted in the formation of a rigid structure and caused fluorescence enhancement through the CHEF effect. On comparison, sensor 47 was found to be more selective than sensor 46 for Cu2+ because of its large conjugated rigid structure.
N– group and the imidazole ring resulted in the formation of a rigid structure and caused fluorescence enhancement through the CHEF effect. On comparison, sensor 47 was found to be more selective than sensor 46 for Cu2+ because of its large conjugated rigid structure.
Yin et al. designed carbazole-based Schiff base sensor 48 for fluorescence-based detection of Cu2+ in acetonitrile solution (Fig. 22 and Table 2).113 On excitation at 298 nm, sensor 48 displayed weak emission at wavelength 335 nm and 381 nm. Among various tested metal ions, sensor 48 showed strong fluorescence enhancement only with Cu2+. On gradual addition of an increasing concentration of Cu2+, sensor 48 displayed an increase in fluorescence intensity at 450 nm and reached a plateau after the addition of 6 equivalents of Cu2+. The binding constant (Ka) was 1.26 × 10⁻⁶ M−1 and the binding stoichiometry was 1![[thin space (1/6-em)]](https://www.rsc.org/images/entities/char_2009.gif) :
:![[thin space (1/6-em)]](https://www.rsc.org/images/entities/char_2009.gif) 1 (48/Cu2+). The detection limit was 27.4 nM for Cu2+. The sensing mechanism could be ascribed to the coordination of Cu2+ with sensor 48 through the diaminomalenonitrile unit, causing inhibition of the ICT process and C
1 (48/Cu2+). The detection limit was 27.4 nM for Cu2+. The sensing mechanism could be ascribed to the coordination of Cu2+ with sensor 48 through the diaminomalenonitrile unit, causing inhibition of the ICT process and C![[double bond, length as m-dash]](https://www.rsc.org/images/entities/char_e001.gif) N isomerization, resulting in fluorescence enhancement.
N isomerization, resulting in fluorescence enhancement.
Gao et al. incorporated Schiff base-based sensor 49 into the pore of periodic mesoporous organosilica (49-PMO) for fluorescence-based detection of Cu2+ (Fig. 21 and Table 2).114 Upon the addition of Cu2+, the fluorescence spectrum of 49-PMO revealed fluorescence quenching, and the detection limit was 0.67 μM for Cu2+. The sensing mechanism was attributed to ligand to metal charge transfer (LMCT).
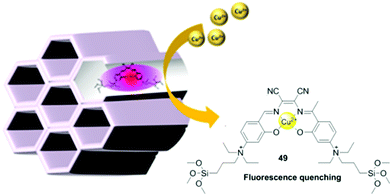 | ||
| Fig. 21 Chemical structure of Schiff base 49 and the sensing mechanism of Cu2+ with 49-PMO. Reproduced with permission from ref.114 Copyright 2021, Wiley. | ||
Zhu et al. developed 2-hydroxy-1-naphthaldehyde and 2-benzylthio-ethanamine based Schiff base sensor 50 for Zn2+ detection (Fig. 22 and Table 2).115 In ethanol/HEPES buffer (95/5, v/v) solution, sensor 50 hardly displayed detectable fluorescence (λem = 450 nm, λex = 242 nm). Among various tested metal ions, sensor 50 displayed superb fluorescence enhancement (19-fold) only with Zn2+. The binding stoichiometric ratio was 2![[thin space (1/6-em)]](https://www.rsc.org/images/entities/char_2009.gif) :
:![[thin space (1/6-em)]](https://www.rsc.org/images/entities/char_2009.gif) 1 (50
1 (50![[thin space (1/6-em)]](https://www.rsc.org/images/entities/char_2009.gif) :
:![[thin space (1/6-em)]](https://www.rsc.org/images/entities/char_2009.gif) Zn2+) and the binding constant was 85.7 M−2. The detection limit of sensor 50 was 0.5034 μM. The sensing mechanism could be attributed to (i) restriction in rotation of the C
Zn2+) and the binding constant was 85.7 M−2. The detection limit of sensor 50 was 0.5034 μM. The sensing mechanism could be attributed to (i) restriction in rotation of the C![[double bond, length as m-dash]](https://www.rsc.org/images/entities/char_e001.gif) N group, (ii) blockage of the PET process, and (iii) Zn2+ induced disaggregation of sensor 50.
N group, (ii) blockage of the PET process, and (iii) Zn2+ induced disaggregation of sensor 50.
Kumar et al. synthesized diaminobenzidine-based Schiff base sensor 51 for Zn2+ detection (Fig. 22 and Table 2).116 In DMF solution, sensor 51 displayed selective fluorescence enhancement only with Zn2+ over various other competing metal ions such as Cd2+, Ni2+, Co2+, Cu2+, Mn2+, Fe3+, and Al3+. Fluorescence titration of sensor 51 with Zn2+ showed a progressive increase in emission intensity at 509 nm (λex = 430 nm). The detection limit was 8.6 nM for Zn2+. Job's plot revealed 1![[thin space (1/6-em)]](https://www.rsc.org/images/entities/char_2009.gif) :
:![[thin space (1/6-em)]](https://www.rsc.org/images/entities/char_2009.gif) 1 (51/Zn2+) binding stoichiometry and the binding constant was 7.8 × 10⁴ M−1. The chelation of sensor 51 with Zn2+ and inhibition of –C
1 (51/Zn2+) binding stoichiometry and the binding constant was 7.8 × 10⁴ M−1. The chelation of sensor 51 with Zn2+ and inhibition of –C![[double bond, length as m-dash]](https://www.rsc.org/images/entities/char_e001.gif) N– isomerization upon coordination with Zn2+ resulted in a turn-on fluorescence response through the CHEF effect.
N– isomerization upon coordination with Zn2+ resulted in a turn-on fluorescence response through the CHEF effect.
Qin et al. synthesized coumarin-based Schiff base 52 as a two-photon fluorescent sensor for Zn2+ detection (Fig. 22 and Table 2).117 On excitation at 380 nm, sensor 52 displayed weak emission at 500 nm in DMF–H2O (9![[thin space (1/6-em)]](https://www.rsc.org/images/entities/char_2009.gif) :
:![[thin space (1/6-em)]](https://www.rsc.org/images/entities/char_2009.gif) 1, v/v) solution. Fluorescence titration of sensor 52 with Zn2+ showed a gradual increase in fluorescence intensity at 500 nm which reached a plateau after the addition of 0.5 equivalent of Zn2+. The binding stoichiometry was 2
1, v/v) solution. Fluorescence titration of sensor 52 with Zn2+ showed a gradual increase in fluorescence intensity at 500 nm which reached a plateau after the addition of 0.5 equivalent of Zn2+. The binding stoichiometry was 2![[thin space (1/6-em)]](https://www.rsc.org/images/entities/char_2009.gif) :
:![[thin space (1/6-em)]](https://www.rsc.org/images/entities/char_2009.gif) 1 (52/Zn2+) and the binding constant (log
1 (52/Zn2+) and the binding constant (log![[thin space (1/6-em)]](https://www.rsc.org/images/entities/char_2009.gif) K) was 6.04. The limit of detection was 2.59 μM for Zn2+. The sensing mechanism could be ascribed to the inhibition of the PET process and restriction in –C
K) was 6.04. The limit of detection was 2.59 μM for Zn2+. The sensing mechanism could be ascribed to the inhibition of the PET process and restriction in –C![[double bond, length as m-dash]](https://www.rsc.org/images/entities/char_e001.gif) N– isomerization upon coordination of Zn2+ with sensor 52.
N– isomerization upon coordination of Zn2+ with sensor 52.
Yan et al. developed Schiff base sensor 53 for Zn2+ detection in ethanol solution (Fig. 22 and Table 2).118 Among various metal ions under investigation, sensor 53 underwent strong fluorescence enhancement at 498 nm (λex = 430 nm) only with Zn2+. The stoichiometry of the complex was 1![[thin space (1/6-em)]](https://www.rsc.org/images/entities/char_2009.gif) :
:![[thin space (1/6-em)]](https://www.rsc.org/images/entities/char_2009.gif) 1 (53/Zn2+) and the detection limit was 0.173 μM for Zn2+. The association constant (Ka) was 2.0 × 10⁴ M−1 as calculated using the Benesi–Hildebrand equation. The complexation of Zn2+ with sensor 53 makes the system more rigid by inhibiting the PET process and C
1 (53/Zn2+) and the detection limit was 0.173 μM for Zn2+. The association constant (Ka) was 2.0 × 10⁴ M−1 as calculated using the Benesi–Hildebrand equation. The complexation of Zn2+ with sensor 53 makes the system more rigid by inhibiting the PET process and C![[double bond, length as m-dash]](https://www.rsc.org/images/entities/char_e001.gif) N isomerization, resulting in fluorescence enhancement through the CHEF effect.
N isomerization, resulting in fluorescence enhancement through the CHEF effect.
![[thin space (1/6-em)]](https://www.rsc.org/images/entities/char_2009.gif) :
:![[thin space (1/6-em)]](https://www.rsc.org/images/entities/char_2009.gif) 1 manner resulted in inhibition of the PET process and the CHEF effect. The LOD was 3.15 μM for Ag+. Interestingly, sensor 54 found practical application in the determination of Ag+ in real samples.
1 manner resulted in inhibition of the PET process and the CHEF effect. The LOD was 3.15 μM for Ag+. Interestingly, sensor 54 found practical application in the determination of Ag+ in real samples.
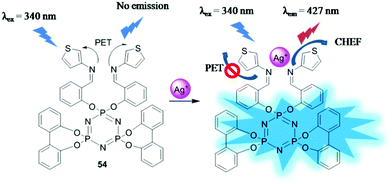 | ||
| Fig. 23 Sensing mechanism of Ag+ with sensor 54. Reproduced with permission from ref.119 Copyright 2021, Wiley-VCH GmbH, Weinheim. | ||
Lei et al. synthesized thiosemicarbazone-based Schiff base 55 as an on–off sensor for Hg2+ detection in DMSO-buffered water (9/1, v/v) (Fig. 22 and Table 2).120 Among various metal ions, the fluorescence spectrum of sensor 55 displayed dramatic fluorescence quenching only with Hg2+ and to a lesser extent with Cu2+, whereas other metal ions had an insignificant effect on the fluorescence spectrum of sensor 55. Upon addition of Hg2+, the color of the solution of sensor 55 changed from colorless to light yellow and from yellow-green to light red under natural light and UV lamp illumination, respectively. Fluorescence titration of sensor 55 with Hg2+ revealed a decrease in emission intensity at 500 nm (λex = 365 nm) along with a red-shift of the emission wavelength by 50 nm. The detection limit was 0.907 μM for Hg2+. Job's plot revealed 1![[thin space (1/6-em)]](https://www.rsc.org/images/entities/char_2009.gif) :
:![[thin space (1/6-em)]](https://www.rsc.org/images/entities/char_2009.gif) 2 (55/Hg2+) complex stoichiometry. The complexation constant was 2.51 × 10⁵ M−1 as calculated using the Benesi–Hildebrand equation. The downfield shift of protons of the thiosemicarbazone moiety and the low field shift of protons of the benzoquinoxaline moiety in the 1H NMR titration experiment suggested the involvement of the thiosemicarbazide group and the imine group in coordination with Hg2+.
2 (55/Hg2+) complex stoichiometry. The complexation constant was 2.51 × 10⁵ M−1 as calculated using the Benesi–Hildebrand equation. The downfield shift of protons of the thiosemicarbazone moiety and the low field shift of protons of the benzoquinoxaline moiety in the 1H NMR titration experiment suggested the involvement of the thiosemicarbazide group and the imine group in coordination with Hg2+.
Singhal et al. designed thiophene-based Schiff base 56 as a turn-on sensor for Hg2+ detection (Fig. 22 and Table 2).121 Sensor 56 was weakly fluorescent in methanol/H2O (8![[thin space (1/6-em)]](https://www.rsc.org/images/entities/char_2009.gif) :
:![[thin space (1/6-em)]](https://www.rsc.org/images/entities/char_2009.gif) 2, v/v) solution. On excitation at 365 nm, sensor 56 showed a turn-on fluorescence response at 503 nm with Hg2+, whereas other tested metal ions had an insignificant effect. The complexation of Hg2+ with sensor 56 caused fluorescence enhancement through the CHEF effect. The binding constant as calculated using Hill's method was log
2, v/v) solution. On excitation at 365 nm, sensor 56 showed a turn-on fluorescence response at 503 nm with Hg2+, whereas other tested metal ions had an insignificant effect. The complexation of Hg2+ with sensor 56 caused fluorescence enhancement through the CHEF effect. The binding constant as calculated using Hill's method was log![[thin space (1/6-em)]](https://www.rsc.org/images/entities/char_2009.gif) β = 13.36 and the limit of detection was 20 μM for Hg2+. The job's plot and 1H NMR titration experiment revealed 2
β = 13.36 and the limit of detection was 20 μM for Hg2+. The job's plot and 1H NMR titration experiment revealed 2![[thin space (1/6-em)]](https://www.rsc.org/images/entities/char_2009.gif) :
:![[thin space (1/6-em)]](https://www.rsc.org/images/entities/char_2009.gif) 1 (56/Hg2+) binding stoichiometry.
1 (56/Hg2+) binding stoichiometry.
Su et al. reported benzophenone and aminobenzenethiol based Schiff base sensor 57 for Hg2+ detection (Fig. 22 and Table 2).122 In the CH3CN-H2O (9/1, v/v) mixture, sensor 57 displayed weak fluorescence at 415 nm (λex = 349 nm). In the presence of Hg2+, sensor 57 showed an increase in fluorescence intensity at 415 nm along with the formation of a new emission band at 473 nm. The sensing mechanism could be attributed to the inhibition of the ESIPT process and C![[double bond, length as m-dash]](https://www.rsc.org/images/entities/char_e001.gif) N isomerization due to the coordination of Hg2+ with sensor 57 through the nitrogen atom and the sulfur atom of the imine group and the thiophenol moiety, respectively, forming a five-membered ring structure. The complex stoichiometry was 2
N isomerization due to the coordination of Hg2+ with sensor 57 through the nitrogen atom and the sulfur atom of the imine group and the thiophenol moiety, respectively, forming a five-membered ring structure. The complex stoichiometry was 2![[thin space (1/6-em)]](https://www.rsc.org/images/entities/char_2009.gif) :
:![[thin space (1/6-em)]](https://www.rsc.org/images/entities/char_2009.gif) 1 (57/Hg2+) and the association constant was 4.48 × 10⁵ M−1 as obtained from the Benesi–Hildebrand method. The limit of detection for Hg2+ was 22.68 nM.
1 (57/Hg2+) and the association constant was 4.48 × 10⁵ M−1 as obtained from the Benesi–Hildebrand method. The limit of detection for Hg2+ was 22.68 nM.
Tekuri et al. synthesized pyrene-based Schiff base chemodosimeters 58, 59, and 60 for Hg2+ detection in aqueous medium (Fig. 22 and Table 2).123 Among sensors 58, 59, and 60, only sensor 58 displayed high selectivity for Hg2+ over other tested metal ions. Fluorescence titration of sensor 58 with Hg2+ exhibited an increase in fluorescence intensity at 417 nm (λex = 355 nm). The binding constant was 5.8 × 10⁻² M−1 and the complex stoichiometry was 2![[thin space (1/6-em)]](https://www.rsc.org/images/entities/char_2009.gif) :
:![[thin space (1/6-em)]](https://www.rsc.org/images/entities/char_2009.gif) 1 (58/Hg2+). The limit of detection was 0.270 μM for Hg2+. The sensing mechanism could be ascribed to the Hg2+ induced hydrolysis of sensor 58 resulting in the formation of more fluorescent pyrene carboxyaldehyde molecules.
1 (58/Hg2+). The limit of detection was 0.270 μM for Hg2+. The sensing mechanism could be ascribed to the Hg2+ induced hydrolysis of sensor 58 resulting in the formation of more fluorescent pyrene carboxyaldehyde molecules.
Wan et al. utilized quinoline-based Schiff base sensor 61 for Cd2+ detection (Fig. 22 and Table 2).124 In 10% methanol solutions, sensor 61 displayed high selectivity only for Cd2+ among various other metal ions. In the presence of Cd2+, sensor 61 showed a 40 times increase in fluorescence intensity at 425 nm (λex = 246 nm). The limit of detection was 2.7 nM for Cd2+. Job's plot revealed 1![[thin space (1/6-em)]](https://www.rsc.org/images/entities/char_2009.gif) :
:![[thin space (1/6-em)]](https://www.rsc.org/images/entities/char_2009.gif) 1 (61
1 (61![[thin space (1/6-em)]](https://www.rsc.org/images/entities/char_2009.gif) :
:![[thin space (1/6-em)]](https://www.rsc.org/images/entities/char_2009.gif) Cd2+) stoichiometry. 1H NMR analysis of sensor 61 in the presence and absence of Cd2+ demonstrated the participation of –C
Cd2+) stoichiometry. 1H NMR analysis of sensor 61 in the presence and absence of Cd2+ demonstrated the participation of –C![[double bond, length as m-dash]](https://www.rsc.org/images/entities/char_e001.gif) N–, quinoline, the nitrogen atom of ethylenediamine, and the oxygen atom of ester in complexation with Cd2+.
N–, quinoline, the nitrogen atom of ethylenediamine, and the oxygen atom of ester in complexation with Cd2+.
Mohanasundaram et al. synthesized quinoline-based Schiff base sensor 62 for Cd2+ detection (Fig. 22 and Table 2).125 In CH3CN–H2O (8![[thin space (1/6-em)]](https://www.rsc.org/images/entities/char_2009.gif) :
:![[thin space (1/6-em)]](https://www.rsc.org/images/entities/char_2009.gif) 2, v/v) solution, free sensor 62 showed weak emission at 510 nm (λex = 380 nm). Among various tested metal ions, sensor 62 underwent fluorescence enhancement only with Cd2+ (37-fold) and Zn2+ (14-fold), whereas other metal ions had an insignificant effect. Sensor 62 also exhibited color change from colorless to yellow under UV light illumination. The binding stoichiometry was 2
2, v/v) solution, free sensor 62 showed weak emission at 510 nm (λex = 380 nm). Among various tested metal ions, sensor 62 underwent fluorescence enhancement only with Cd2+ (37-fold) and Zn2+ (14-fold), whereas other metal ions had an insignificant effect. Sensor 62 also exhibited color change from colorless to yellow under UV light illumination. The binding stoichiometry was 2![[thin space (1/6-em)]](https://www.rsc.org/images/entities/char_2009.gif) :
:![[thin space (1/6-em)]](https://www.rsc.org/images/entities/char_2009.gif) 1 (62/Cd2+) and the association constant was 1.77 × 10⁵ M−1. The limit of detection was 14.8 nM for Cd2+. The coordination mechanism of sensor 62 with Cd2+ could be the combined effect of restriction in C
1 (62/Cd2+) and the association constant was 1.77 × 10⁵ M−1. The limit of detection was 14.8 nM for Cd2+. The coordination mechanism of sensor 62 with Cd2+ could be the combined effect of restriction in C![[double bond, length as m-dash]](https://www.rsc.org/images/entities/char_e001.gif) N isomerization and the CHEF effect. Furthermore, sensor 62 demonstrated potential application in the quantification of Cd2+ in different water samples.
N isomerization and the CHEF effect. Furthermore, sensor 62 demonstrated potential application in the quantification of Cd2+ in different water samples.
3.2 Multi-metal ion sensors57,254–264
Nowadays, the development of sensors with multiple ion recognition sites is a challenging and emerging area of interest, because of the advantages of such systems such as cost reduction and faster analytical processing.Hammud et al. synthesized Schiff base sensor 63 for fluorescence-based detection of Ag+, Cu2+, and Fe3+ in ethanol solution (Fig. 24 and Table 2).126 On excitation at 341 nm, sensor 63 exhibited strong fluorescence at emission wavelength 385 nm. Fluorescence titration of sensor 63 with Ag+, Cu2+, and Fe3+ revealed a linear decrease in fluorescence intensity with the addition of an increasing concentration of these ions. The detection limit was 0.132 μM, 0.088 μM, and 0.037 μM, respectively, for Ag+, Cu2+, and Fe3+. The Stern–Volmer constant (Ksv) value was 9.575 × 10² M−1, 8.273 × 10² M−1 and 23.2 × 10² M−1 for Ag+, Cu2+, and Fe3+, respectively. The stoichiometry of the complex was 2![[thin space (1/6-em)]](https://www.rsc.org/images/entities/char_2009.gif) :
:![[thin space (1/6-em)]](https://www.rsc.org/images/entities/char_2009.gif) 1 (63/Ag+ or Cu2+) and 1
1 (63/Ag+ or Cu2+) and 1![[thin space (1/6-em)]](https://www.rsc.org/images/entities/char_2009.gif) :
:![[thin space (1/6-em)]](https://www.rsc.org/images/entities/char_2009.gif) 2 (63/Fe3+). The Benesi–Hildebrand plot revealed a binding constant value of 1.4062 × 10³ M−1, 1.111 × 10³ M−1 and 1.2909 × 10⁴ M−1 with Ag+, Cu2+, and Fe3+, respectively. The mechanism of fluorescence quenching could be attributed to the initiation of the PET process upon binding with metal ions. Sensor 63 found analytical application in the detection of Ag+, Cu2+, and Fe3+ in real water samples.
2 (63/Fe3+). The Benesi–Hildebrand plot revealed a binding constant value of 1.4062 × 10³ M−1, 1.111 × 10³ M−1 and 1.2909 × 10⁴ M−1 with Ag+, Cu2+, and Fe3+, respectively. The mechanism of fluorescence quenching could be attributed to the initiation of the PET process upon binding with metal ions. Sensor 63 found analytical application in the detection of Ag+, Cu2+, and Fe3+ in real water samples.
Saleem et al. developed triazole-based Schiff base sensor 64 for fluorescence-based detection of Co2+, Cu2+, and Hg2+ (Fig. 24 and Table 2).127 In THF/water (6![[thin space (1/6-em)]](https://www.rsc.org/images/entities/char_2009.gif) :
:![[thin space (1/6-em)]](https://www.rsc.org/images/entities/char_2009.gif) 4, v/v) solution, sensor 64 displayed emission at 622 nm (λex = 259 nm). Among various metal ions, sensor 64 exhibited strong fluorescence quenching only with Hg2+ and to a lesser extent with Co2+ and Cu2+, whereas other metal ions had an insignificant effect. The quenching constant (Ksv) value was 9.25 × 10⁷, 1.829 × 10⁷ and 1.14 × 10⁷ M−1 for Co2+, Cu2+, and Hg2+, respectively. The association constant value was 1.52 × 10⁸ M−1, 5.47 × 10¹¹ M−1, and 1.16 × 10⁸ M−1 for Co2+, Cu2+, and Hg2+, respectively. The limit of detection was 3.26 nM, 89.1 pM, and 0.387 nM for Co2+, Cu2+, and Hg2+, respectively. The stoichiometry of the complex was 1
4, v/v) solution, sensor 64 displayed emission at 622 nm (λex = 259 nm). Among various metal ions, sensor 64 exhibited strong fluorescence quenching only with Hg2+ and to a lesser extent with Co2+ and Cu2+, whereas other metal ions had an insignificant effect. The quenching constant (Ksv) value was 9.25 × 10⁷, 1.829 × 10⁷ and 1.14 × 10⁷ M−1 for Co2+, Cu2+, and Hg2+, respectively. The association constant value was 1.52 × 10⁸ M−1, 5.47 × 10¹¹ M−1, and 1.16 × 10⁸ M−1 for Co2+, Cu2+, and Hg2+, respectively. The limit of detection was 3.26 nM, 89.1 pM, and 0.387 nM for Co2+, Cu2+, and Hg2+, respectively. The stoichiometry of the complex was 1![[thin space (1/6-em)]](https://www.rsc.org/images/entities/char_2009.gif) :
:![[thin space (1/6-em)]](https://www.rsc.org/images/entities/char_2009.gif) 1 (64
1 (64![[thin space (1/6-em)]](https://www.rsc.org/images/entities/char_2009.gif) :
:![[thin space (1/6-em)]](https://www.rsc.org/images/entities/char_2009.gif) Co2+/Cu2+/Hg2+). The heavy metal ion effect and paramagnetic behavior triggered non-radiative decay could be responsible for the observed fluorescence quenching.
Co2+/Cu2+/Hg2+). The heavy metal ion effect and paramagnetic behavior triggered non-radiative decay could be responsible for the observed fluorescence quenching.
Sie et al. synthesized Schiff base sensor 65 for fluorometric and colorimetric detection of Co2+, Cu2+, and Hg2+ (Fig. 24, 25 and Table 2).128 In DMSO–H2O (9![[thin space (1/6-em)]](https://www.rsc.org/images/entities/char_2009.gif) :
:![[thin space (1/6-em)]](https://www.rsc.org/images/entities/char_2009.gif) 1, v/v) solution, sensor 65 exhibited emission at wavelength 540 nm (λex = 460 nm). The fluorescence titration of sensor 65 with Hg2+ showed first a decrease (4–12 μM), then an increase (16–40 μM), and again a gradual decrease (60–800 μM) in emission intensity with the addition of an increasing concentration of Hg2+. Coordination and desulfurization could be the possible mechanism of the observed fluorescence change of sensor 65 with Hg2+. Upon addition of an increasing concentration of Co2+ or Cu2+, sensor 65 showed a decrease in emission intensity at 540 nm. The disruption of the intramolecular H-bond in the presence of Co2+ or Cu2+ could be responsible for the observed fluorescence quenching. The association constant was 3.52 × 10⁶ M−1, 5.69 × 10⁵ M−1, and 1.85 × 10⁴ M−1, respectively, for Co2+, Cu2+, and Hg2+. The stoichiometry of the complex was 1
1, v/v) solution, sensor 65 exhibited emission at wavelength 540 nm (λex = 460 nm). The fluorescence titration of sensor 65 with Hg2+ showed first a decrease (4–12 μM), then an increase (16–40 μM), and again a gradual decrease (60–800 μM) in emission intensity with the addition of an increasing concentration of Hg2+. Coordination and desulfurization could be the possible mechanism of the observed fluorescence change of sensor 65 with Hg2+. Upon addition of an increasing concentration of Co2+ or Cu2+, sensor 65 showed a decrease in emission intensity at 540 nm. The disruption of the intramolecular H-bond in the presence of Co2+ or Cu2+ could be responsible for the observed fluorescence quenching. The association constant was 3.52 × 10⁶ M−1, 5.69 × 10⁵ M−1, and 1.85 × 10⁴ M−1, respectively, for Co2+, Cu2+, and Hg2+. The stoichiometry of the complex was 1![[thin space (1/6-em)]](https://www.rsc.org/images/entities/char_2009.gif) :
:![[thin space (1/6-em)]](https://www.rsc.org/images/entities/char_2009.gif) 1 (65
1 (65![[thin space (1/6-em)]](https://www.rsc.org/images/entities/char_2009.gif) :
:![[thin space (1/6-em)]](https://www.rsc.org/images/entities/char_2009.gif) Co2+/Cu2+/Hg2+). The limit of detection was 0.007 ppb, 0.29 ppb, and 0.20 ppb, respectively, for Co2+, Cu2+, and Hg2+. Sensor 65 showed potential for Co2+, Cu2+, and Hg2+ detection in real water samples.
Co2+/Cu2+/Hg2+). The limit of detection was 0.007 ppb, 0.29 ppb, and 0.20 ppb, respectively, for Co2+, Cu2+, and Hg2+. Sensor 65 showed potential for Co2+, Cu2+, and Hg2+ detection in real water samples.
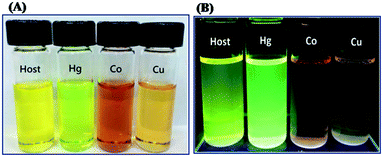 | ||
| Fig. 25 Color change of sensor 65 (host) upon addition of Hg2+, Co2+, and Cu2+ (5 equiv.): (A) naked eye detectable color change; (B) under UV light illumination. Reproduced with permission from ref. 128 Copyright 2017, Royal Society of Chemistry. | ||
Simon et al. developed pyrene-based Schiff base 66 as an off–on sensor for Al3+, Cr3+, and Fe3+ in acetonitrile solution (Fig. 24 and Table 2).129 Among various metal ions, sensor 66 showed turn-on fluorescence response only with trivalent metal ions such as Al3+, Cr3+, and Fe3+ along with red-shift of the emission maxima from 417 nm to 500 nm (λex = 355 nm). The complexation stoichiometry was 2![[thin space (1/6-em)]](https://www.rsc.org/images/entities/char_2009.gif) :
:![[thin space (1/6-em)]](https://www.rsc.org/images/entities/char_2009.gif) 1 (66
1 (66![[thin space (1/6-em)]](https://www.rsc.org/images/entities/char_2009.gif) :
:![[thin space (1/6-em)]](https://www.rsc.org/images/entities/char_2009.gif) Al3+/Cr3+/Fe3+). The association constant value was 2.26 × 10⁶ M−2, 2.24 × 10⁶ M−2 and 2.25 × 10⁶ M−2 for Al3+, Cr3+, and Fe3+ ions, respectively. The detection limits were 0.117 μM, 0.111 μM, and 0.106 μM for Al3+, Cr3+, and Fe3+, respectively. The turn-on sensing mechanism was explained by means of excimer formation and the PET process. Sensor 66 found application in Al3+, Cr3+, and Fe3+ detection in living cells.
Al3+/Cr3+/Fe3+). The association constant value was 2.26 × 10⁶ M−2, 2.24 × 10⁶ M−2 and 2.25 × 10⁶ M−2 for Al3+, Cr3+, and Fe3+ ions, respectively. The detection limits were 0.117 μM, 0.111 μM, and 0.106 μM for Al3+, Cr3+, and Fe3+, respectively. The turn-on sensing mechanism was explained by means of excimer formation and the PET process. Sensor 66 found application in Al3+, Cr3+, and Fe3+ detection in living cells.
Tang et al. synthesized rhodamine B derivative-based Schiff base sensor 67 for Zn2+, Fe3+, and Cu2+ (Fig. 24 and Table 2).130 In ethanol solution, sensor 67 displayed fluorescence enhancement (λex = 510 nm) at 572 nm (125-fold) and at 580 nm (150-fold) along with a change in the fluorescence color of the solution from colorless to orange with Zn2+ and from colorless to red with Fe3+, respectively, whereas other metal ions had an insignificant effect (Fig. 26A and B). In ethanol–H2O (1![[thin space (1/6-em)]](https://www.rsc.org/images/entities/char_2009.gif) :
:![[thin space (1/6-em)]](https://www.rsc.org/images/entities/char_2009.gif) 1, v/v) solution, sensor 67 behaved as a colorimetric sensor for Cu2+ with a naked-eye detectable color change of the solution from colorless to pink. Job's plot revealed a complexation ratio of 1
1, v/v) solution, sensor 67 behaved as a colorimetric sensor for Cu2+ with a naked-eye detectable color change of the solution from colorless to pink. Job's plot revealed a complexation ratio of 1![[thin space (1/6-em)]](https://www.rsc.org/images/entities/char_2009.gif) :
:![[thin space (1/6-em)]](https://www.rsc.org/images/entities/char_2009.gif) 1 (67/Zn2+), 2
1 (67/Zn2+), 2![[thin space (1/6-em)]](https://www.rsc.org/images/entities/char_2009.gif) :
:![[thin space (1/6-em)]](https://www.rsc.org/images/entities/char_2009.gif) 1 (67/Fe3+) and 1
1 (67/Fe3+) and 1![[thin space (1/6-em)]](https://www.rsc.org/images/entities/char_2009.gif) :
:![[thin space (1/6-em)]](https://www.rsc.org/images/entities/char_2009.gif) 1 (67/Cu2+). The binding constant was 1.53 × 10³ M−1, 4.57 × 10⁴ M−1 and 2.62 × 10³ M−1 for Zn2+, Fe3+, and Cu2+, respectively. The detection limit was 0.664 μM, 0.212 μM and 82.7 nM for Zn2+, Fe3+, and Cu2+, respectively. The turn-on response could be attributed to the opening of the lactam ring of sensor 67 upon binding with Zn2+ and Fe3+, leading to the formation of a more conjugated system. However, in the case of Cu2+, the naked-eye detectable color change could be due to electron transfer from Cu2+ to sensor 67. Sensor 67 found application in Zn2+, Fe3+, and Cu2+ detection in real water samples and in the fluorescence imaging of Fe3+ in biological cells.
1 (67/Cu2+). The binding constant was 1.53 × 10³ M−1, 4.57 × 10⁴ M−1 and 2.62 × 10³ M−1 for Zn2+, Fe3+, and Cu2+, respectively. The detection limit was 0.664 μM, 0.212 μM and 82.7 nM for Zn2+, Fe3+, and Cu2+, respectively. The turn-on response could be attributed to the opening of the lactam ring of sensor 67 upon binding with Zn2+ and Fe3+, leading to the formation of a more conjugated system. However, in the case of Cu2+, the naked-eye detectable color change could be due to electron transfer from Cu2+ to sensor 67. Sensor 67 found application in Zn2+, Fe3+, and Cu2+ detection in real water samples and in the fluorescence imaging of Fe3+ in biological cells.
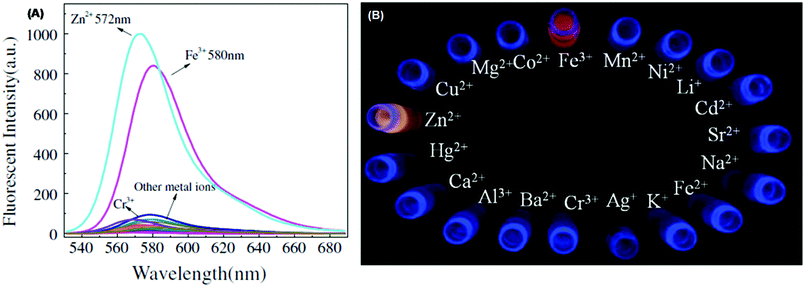 | ||
| Fig. 26 Fluorescence change of sensor 67 in the presence of various tested metal ions: (A) emission spectrum; (B) visible color change under 365 nm UV lamp irradiation. Reproduced with permission from ref. 130 Copyright 2017, Elsevier. | ||
Zhang et al. developed Schiff base sensor 68 for colorimetric and fluorometric detection of Cu2+, Hg2+, and Ag+ (Fig. 24 and Table 2).131 In DMSO–H2O (1![[thin space (1/6-em)]](https://www.rsc.org/images/entities/char_2009.gif) :
:![[thin space (1/6-em)]](https://www.rsc.org/images/entities/char_2009.gif) 1, v/v) solution, sensor 68 showed emission maxima at 527 nm (λex = 310 nm). In the presence of Cu2+, Hg2+, and Ag+, sensor 68 displayed fluorescence quenching along with a red-shift of the emission maxima from 527 to 550 nm. The binding ratio was 1
1, v/v) solution, sensor 68 showed emission maxima at 527 nm (λex = 310 nm). In the presence of Cu2+, Hg2+, and Ag+, sensor 68 displayed fluorescence quenching along with a red-shift of the emission maxima from 527 to 550 nm. The binding ratio was 1![[thin space (1/6-em)]](https://www.rsc.org/images/entities/char_2009.gif) :
:![[thin space (1/6-em)]](https://www.rsc.org/images/entities/char_2009.gif) 2 (68
2 (68![[thin space (1/6-em)]](https://www.rsc.org/images/entities/char_2009.gif) :
:![[thin space (1/6-em)]](https://www.rsc.org/images/entities/char_2009.gif) Cu2+/Hg2+/Ag+). The plot of fluorescence intensity ratio vs the concentration of Cu2+, Hg2+, and Ag+ revealed a good linear range between 0 and 20 μM. The detection limit was 64.8 μM, 52.7 μM, and 63.7 μM for Cu2+, Hg2+, and Ag+, respectively. The association constant value was 1.64 × 10⁵ M−1, 9.27 × 10⁴ M−1, and 1.37 × 10⁵ M−1 for Cu2+, Hg2+, and Ag+, respectively, as calculated using the Benesi–Hildebrand equation. From the FT-IR spectra of complexes [68–Cu2+], [68–Hg2+], and [68–Ag+], a new band at 3462, 3427, and 3437 cm−1, respectively, and the low-frequency shift of νC
Cu2+/Hg2+/Ag+). The plot of fluorescence intensity ratio vs the concentration of Cu2+, Hg2+, and Ag+ revealed a good linear range between 0 and 20 μM. The detection limit was 64.8 μM, 52.7 μM, and 63.7 μM for Cu2+, Hg2+, and Ag+, respectively. The association constant value was 1.64 × 10⁵ M−1, 9.27 × 10⁴ M−1, and 1.37 × 10⁵ M−1 for Cu2+, Hg2+, and Ag+, respectively, as calculated using the Benesi–Hildebrand equation. From the FT-IR spectra of complexes [68–Cu2+], [68–Hg2+], and [68–Ag+], a new band at 3462, 3427, and 3437 cm−1, respectively, and the low-frequency shift of νC![[double bond, length as m-dash]](https://www.rsc.org/images/entities/char_e001.gif) N and νC–S, the high-frequency shift of the νC–O stretching band, and disappearance of the δO–H band indicated coordination of Cu2+, Hg2+, and Ag+ with sensor 68 through the nitrogen atom of the imine group, the sulfur atom of thiol and the oxygen atom of the phenolic hydroxyl group.
N and νC–S, the high-frequency shift of the νC–O stretching band, and disappearance of the δO–H band indicated coordination of Cu2+, Hg2+, and Ag+ with sensor 68 through the nitrogen atom of the imine group, the sulfur atom of thiol and the oxygen atom of the phenolic hydroxyl group.
Zhu et al. developed Schiff base sensor 69 for Fe2+, Fe3+ and Cu2+ detection in DMF solution (Fig. 24 and Table 2).132 Among various metal ions, sensor 69 showed selectivity only for Fe2+, Fe3+, and Cu2+ and naked eye detectable color change from colorless to yellow with Cu2+ and colorless to light brown with Fe2+ and Fe3+, and fluorescence color change from purple to colorless with Fe2+, Fe3+, and Cu2+ under UV light. On excitation at 341 nm, sensor 69 displayed emission at wavelength 393 nm. In the presence of Fe2+, Fe3+, and Cu2+, sensor 69 underwent fluorescence quenching (∼98% with Fe2+ and Fe3+ and ∼92% with Cu2+). The fluorescence quenching mechanism could be attributed to the CHEQ effect of paramagnetic Fe2+, Fe3+, and Cu2+. The detection limit was 2.06 μM, 2.17 μM, and 2.48 μM for Fe2+, Fe3+, and Cu2+, respectively. Job's plot revealed 1![[thin space (1/6-em)]](https://www.rsc.org/images/entities/char_2009.gif) :
:![[thin space (1/6-em)]](https://www.rsc.org/images/entities/char_2009.gif) 1 (69
1 (69![[thin space (1/6-em)]](https://www.rsc.org/images/entities/char_2009.gif) :
:![[thin space (1/6-em)]](https://www.rsc.org/images/entities/char_2009.gif) Fe2+/Fe3+/Cu2+) stoichiometry. The association constant value was 3.61 × 10⁵ M−1, 3.82 × 10⁵ M−1, and 3.93 × 10⁵ M−1 for Fe2+, Fe3+, and Cu2+, respectively.
Fe2+/Fe3+/Cu2+) stoichiometry. The association constant value was 3.61 × 10⁵ M−1, 3.82 × 10⁵ M−1, and 3.93 × 10⁵ M−1 for Fe2+, Fe3+, and Cu2+, respectively.
Xue et al. developed rhodamine-chromone-based Schiff base sensor 70 for Zn2+ and Fe3+ detection (Fig. 24 and Table 2).133 In ethanol-HEPES buffer (9![[thin space (1/6-em)]](https://www.rsc.org/images/entities/char_2009.gif) :
:![[thin space (1/6-em)]](https://www.rsc.org/images/entities/char_2009.gif) 1, v/v) solution, sensor 70 showed 66-fold fluorescence enhancement at 490 nm (λex = 420 nm) with Zn2+ over other tested metal ions. In contrast, in DMSO–ethanol (2/3, v/v) solution, sensor 70 exhibited 51-fold fluorescence enhancement at 583 nm (λex = 520 nm) with Fe3+ over other metal ions. The fluorescence responses of sensor 70 with Zn2+ could be due to inhibition of the PET process and the CHEF effect. The fluorescence enhancement at 583 nm could be due to the opening of the spirolactam ring of rhodamine upon coordination with Fe3+. The complexation stoichiometry was 1
1, v/v) solution, sensor 70 showed 66-fold fluorescence enhancement at 490 nm (λex = 420 nm) with Zn2+ over other tested metal ions. In contrast, in DMSO–ethanol (2/3, v/v) solution, sensor 70 exhibited 51-fold fluorescence enhancement at 583 nm (λex = 520 nm) with Fe3+ over other metal ions. The fluorescence responses of sensor 70 with Zn2+ could be due to inhibition of the PET process and the CHEF effect. The fluorescence enhancement at 583 nm could be due to the opening of the spirolactam ring of rhodamine upon coordination with Fe3+. The complexation stoichiometry was 1![[thin space (1/6-em)]](https://www.rsc.org/images/entities/char_2009.gif) :
:![[thin space (1/6-em)]](https://www.rsc.org/images/entities/char_2009.gif) 1 (70
1 (70![[thin space (1/6-em)]](https://www.rsc.org/images/entities/char_2009.gif) :
:![[thin space (1/6-em)]](https://www.rsc.org/images/entities/char_2009.gif) Zn2+/Fe3+). The limit of detection was 0.134 μM and 0.139 μM for Zn2+ and Fe3+, respectively. The binding constant was 5.82 × 10⁴ M−1 and 5.85 × 10³ M−1 for Zn2+ and Fe3+, respectively. A test strip coated with sensor 70 displayed yellow-green color with Zn2+ and pink color with Al3+, demonstrating the application of sensor 70 as a solid-state sensor (Fig. 27).
Zn2+/Fe3+). The limit of detection was 0.134 μM and 0.139 μM for Zn2+ and Fe3+, respectively. The binding constant was 5.82 × 10⁴ M−1 and 5.85 × 10³ M−1 for Zn2+ and Fe3+, respectively. A test strip coated with sensor 70 displayed yellow-green color with Zn2+ and pink color with Al3+, demonstrating the application of sensor 70 as a solid-state sensor (Fig. 27).
 | ||
| Fig. 27 Photographs of test strips coated with sensor 70 and after addition of different metal ions under 365 nm UV lamp irradiation. Reproduced with permission from ref. 133 Copyright 2019, Elsevier. | ||
Lee et al. developed salicylaldehyde- and fluorene-based Schiff base sensor 71 for fluorescence-based detection of Zn2+ and Ga3+ (Fig. 24 and Table 2).134 In acetonitrile solution, free sensor 71 was weakly fluorescent. Compared with other tested metal ions, sensor 71 (λex = 300 nm) exhibited fluorescence enhancement with Zn2+ and Ga3+ at 460 nm and 434 nm, respectively. The binding ratio was 1![[thin space (1/6-em)]](https://www.rsc.org/images/entities/char_2009.gif) :
:![[thin space (1/6-em)]](https://www.rsc.org/images/entities/char_2009.gif) 1 (71
1 (71![[thin space (1/6-em)]](https://www.rsc.org/images/entities/char_2009.gif) :
:![[thin space (1/6-em)]](https://www.rsc.org/images/entities/char_2009.gif) Zn2+/Ga3+). The binding constant was 7.0 × 10⁴ M−1 and 1.0 × 10⁴ M−1 for Zn2+ and Ga3+ ions, respectively. The limit of detection was 0.32 μM and 0.01 μM for Zn2+ and Ga3+, respectively. The turn-on fluorescence response of sensor 71 with Zn2+ and Ga3+ could be due to the suppression of the PET process.
Zn2+/Ga3+). The binding constant was 7.0 × 10⁴ M−1 and 1.0 × 10⁴ M−1 for Zn2+ and Ga3+ ions, respectively. The limit of detection was 0.32 μM and 0.01 μM for Zn2+ and Ga3+, respectively. The turn-on fluorescence response of sensor 71 with Zn2+ and Ga3+ could be due to the suppression of the PET process.
Dong et al. developed quinoline-based Schiff base 72 as a turn-on sensor for Zn2+ and Hg2+ (Fig. 24 and Table 2).135 In the DMSO–H2O (1![[thin space (1/6-em)]](https://www.rsc.org/images/entities/char_2009.gif) :
:![[thin space (1/6-em)]](https://www.rsc.org/images/entities/char_2009.gif) 99, v/v) mixture, sensor 72 showed weak emission at 473 nm (λex = 350 nm). Among various metal ions, sensor 72 exhibited turn-on response with red-shift of the emission maxima from 473 to 539 (Δλshift = 57 nm) with Hg2+, and from 473 to 565 nm (Δλshift = 92 nm) with Zn2+, whereas other metal ions had an insignificant effect. Under UV light, sensor 72 displayed color change from colorless to yellowish-green with Hg2+, and from colorless to intense yellow with Zn2+ (Fig. 28A and B). Job's plot indicated 1
99, v/v) mixture, sensor 72 showed weak emission at 473 nm (λex = 350 nm). Among various metal ions, sensor 72 exhibited turn-on response with red-shift of the emission maxima from 473 to 539 (Δλshift = 57 nm) with Hg2+, and from 473 to 565 nm (Δλshift = 92 nm) with Zn2+, whereas other metal ions had an insignificant effect. Under UV light, sensor 72 displayed color change from colorless to yellowish-green with Hg2+, and from colorless to intense yellow with Zn2+ (Fig. 28A and B). Job's plot indicated 1![[thin space (1/6-em)]](https://www.rsc.org/images/entities/char_2009.gif) :
:![[thin space (1/6-em)]](https://www.rsc.org/images/entities/char_2009.gif) 1 (72
1 (72![[thin space (1/6-em)]](https://www.rsc.org/images/entities/char_2009.gif) :
:![[thin space (1/6-em)]](https://www.rsc.org/images/entities/char_2009.gif) Hg2+/Zn2+) stoichiometry. The limit of detection was 0.040 μM and 0.011 μM for Hg2+ and Zn2+, respectively. The association constant was 1.41 × 10⁵ M−1 and 1.52 × 10⁵ M−1 for Hg2+ and Zn2+, respectively. The sensing mechanism could be attributed to the lowering of the energy gap between HOMO and LUMO of sensor 72 as well as increased structural rigidity upon complexation with Hg2+ and Zn2+.
Hg2+/Zn2+) stoichiometry. The limit of detection was 0.040 μM and 0.011 μM for Hg2+ and Zn2+, respectively. The association constant was 1.41 × 10⁵ M−1 and 1.52 × 10⁵ M−1 for Hg2+ and Zn2+, respectively. The sensing mechanism could be attributed to the lowering of the energy gap between HOMO and LUMO of sensor 72 as well as increased structural rigidity upon complexation with Hg2+ and Zn2+.
 | ||
| Fig. 28 Fluorescence change of sensor 72 in the absence and presence of different metal ions: (A) emission spectrum; (B) plot of fluorescence intensity change. Inset: Photographs of sensor 72, 72 + Zn2+ and 72 + Hg2+ under 365 nm UV lamp irradiation. Reproduced with permission from ref. 135 Copyright 2017, Royal Society of Chemistry. | ||
Tajbakhsh et al. developed fluorene-based Schiff base 73 as a turn-on sensor for Al3+ and Cr3+ (Fig. 24 and Table 2).136 In acetonitrile solution, sensor 73 exhibited emission at 536 nm (λex = 333 nm). In the presence of Al3+ or Cr3+, sensor 73 displayed fluorescence enhancement at 536 nm. The binding ratio was 2![[thin space (1/6-em)]](https://www.rsc.org/images/entities/char_2009.gif) :
:![[thin space (1/6-em)]](https://www.rsc.org/images/entities/char_2009.gif) 1 (73
1 (73![[thin space (1/6-em)]](https://www.rsc.org/images/entities/char_2009.gif) :
:![[thin space (1/6-em)]](https://www.rsc.org/images/entities/char_2009.gif) Al3+/Cr3+) and the binding constant was 5.44 × 10⁴ M−1 and 8.33 × 10⁴ M−1 for Al3+ and Cr3+ ions, respectively. The detection limit was 0.31 μM and 0.25 μM for Al3+ and Cr3+, respectively. The chelation of sensor 73 with Al3+ and Cr3+ resulted in inhibition of C
Al3+/Cr3+) and the binding constant was 5.44 × 10⁴ M−1 and 8.33 × 10⁴ M−1 for Al3+ and Cr3+ ions, respectively. The detection limit was 0.31 μM and 0.25 μM for Al3+ and Cr3+, respectively. The chelation of sensor 73 with Al3+ and Cr3+ resulted in inhibition of C![[double bond, length as m-dash]](https://www.rsc.org/images/entities/char_e001.gif) N isomerization and the ESIPT process, causing fluorescence enhancement (Fig. 29).
N isomerization and the ESIPT process, causing fluorescence enhancement (Fig. 29).
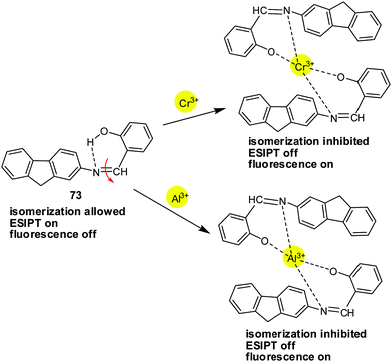 | ||
| Fig. 29 Sensing mechanism of sensor 73 with Al3+. Reproduced with permission from ref. 136 Copyright 2018, Elsevier. | ||
Zhang et al. developed phenylamine-oligothiophene-based Schiff base sensor 74 for fluorescence-based detection of Cu2+ and Zn2+ (Fig. 24 and Table 2).137 In THF–H2O (7![[thin space (1/6-em)]](https://www.rsc.org/images/entities/char_2009.gif) :
:![[thin space (1/6-em)]](https://www.rsc.org/images/entities/char_2009.gif) 3, v/v) solution, sensor 74 displayed emission at 537 nm (λex = 385 nm). Compared with other metal ions, sensor 74 exhibited a turn-off response with Cu2+ and a turn-on response with Hg2+. Under 365 nm UV light, the fluorescence color of sensor 74 changed from light green to dark green (with Cu2+), and to bright yellow-green (with Hg2+). The binding stoichiometry was 1
3, v/v) solution, sensor 74 displayed emission at 537 nm (λex = 385 nm). Compared with other metal ions, sensor 74 exhibited a turn-off response with Cu2+ and a turn-on response with Hg2+. Under 365 nm UV light, the fluorescence color of sensor 74 changed from light green to dark green (with Cu2+), and to bright yellow-green (with Hg2+). The binding stoichiometry was 1![[thin space (1/6-em)]](https://www.rsc.org/images/entities/char_2009.gif) :
:![[thin space (1/6-em)]](https://www.rsc.org/images/entities/char_2009.gif) 1 (74
1 (74![[thin space (1/6-em)]](https://www.rsc.org/images/entities/char_2009.gif) :
:![[thin space (1/6-em)]](https://www.rsc.org/images/entities/char_2009.gif) Cu2+/Hg2+). The association constant was 9.40 × 10⁴ M−1 and 8.69 × 10⁴ M−1 for Cu2+ and Zn2+, respectively. The detection limit was 70.6 nM and 0.116 μM for Cu2+ and Zn2+, respectively. The turn-on fluorescence response of sensor 74 with Hg2+ could be due to inhibition of the PET process upon coordination and the CHEF effect. The turn-off fluorescence response of sensor 74 with Cu2+ could be ascribed to paramagnetic characteristics of Cu2+ and the ICT process, resulting in the CHEQ effect (Fig. 30).
Cu2+/Hg2+). The association constant was 9.40 × 10⁴ M−1 and 8.69 × 10⁴ M−1 for Cu2+ and Zn2+, respectively. The detection limit was 70.6 nM and 0.116 μM for Cu2+ and Zn2+, respectively. The turn-on fluorescence response of sensor 74 with Hg2+ could be due to inhibition of the PET process upon coordination and the CHEF effect. The turn-off fluorescence response of sensor 74 with Cu2+ could be ascribed to paramagnetic characteristics of Cu2+ and the ICT process, resulting in the CHEQ effect (Fig. 30).
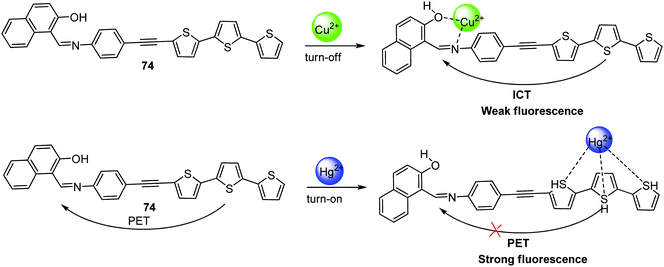 | ||
| Fig. 30 Sensing mechanism of sensor 74 for Cu2+ and Hg2+. Reproduced with permission from ref. 137 Copyright 2017, Elsevier. | ||
Zhu et al. synthesized carbazole-based Schiff base sensors 75 and 76 for Fe3+ and Cr3+ detection in acetonitrile solution (Fig. 24 and Table 2).138 Among various metal ions, sensor 75 displayed significant fluorescence enhancement selectively with Fe3+ and Cr3+, credited to inhibition of the ESIPT process and C![[double bond, length as m-dash]](https://www.rsc.org/images/entities/char_e001.gif) N isomerization. Sensor 75, without the o-OH group, lacks selectivity towards tested metal ions. Fluorescence titration of sensor 75 with Fe3+ and Cr3+ showed a gradual increase in fluorescence intensity with the increasing concentration of Fe3+/Cr3+ at 495 nm (λex = 380 nm) along with red-shift from 495 nm to 502 nm. The detection limit was 4.57 μM and 2.75 μM for Fe3+ and Cr3+, respectively. The binding stoichiometry was 2
N isomerization. Sensor 75, without the o-OH group, lacks selectivity towards tested metal ions. Fluorescence titration of sensor 75 with Fe3+ and Cr3+ showed a gradual increase in fluorescence intensity with the increasing concentration of Fe3+/Cr3+ at 495 nm (λex = 380 nm) along with red-shift from 495 nm to 502 nm. The detection limit was 4.57 μM and 2.75 μM for Fe3+ and Cr3+, respectively. The binding stoichiometry was 2![[thin space (1/6-em)]](https://www.rsc.org/images/entities/char_2009.gif) :
:![[thin space (1/6-em)]](https://www.rsc.org/images/entities/char_2009.gif) 1 (75
1 (75![[thin space (1/6-em)]](https://www.rsc.org/images/entities/char_2009.gif) :
:![[thin space (1/6-em)]](https://www.rsc.org/images/entities/char_2009.gif) Fe3+/Cr3+) and the association constant was 4.67 × 10⁴ M−1 and 5.97 × 10⁴ M−1 for Fe3+ and Cr3+, respectively.
Fe3+/Cr3+) and the association constant was 4.67 × 10⁴ M−1 and 5.97 × 10⁴ M−1 for Fe3+ and Cr3+, respectively.
3.3 Schiff-base–metal ion ensembles as a sequential sensor for ions265,266
Nowadays, researchers are working on the design and synthesis of Schiff-base–metal ion ensembles as a sequential sensor for the detection of various analytes, viz. anions, cations, and metal ions. Generally, the interaction of the ensemble with metal ions results in recovery of the original fluorescence of the Schiff base, illustrating the reusability of the Schiff base sensor.Fu et al. developed 8-hydroxyquinoline based Schiff base sensors 77 and 78 for Al3+ detection (Fig. 31 and Table 2).139 In DMSO-H2O (1![[thin space (1/6-em)]](https://www.rsc.org/images/entities/char_2009.gif) :
:![[thin space (1/6-em)]](https://www.rsc.org/images/entities/char_2009.gif) 2, v/v) solution, both sensors 77 (λex = 405 nm) and 78 (λex = 455 nm) are non-fluorescent. In the presence of Al3+, sensors 77 and 78 exhibited a 270-fold and 460-fold increase in emission intensity at 505 nm and 509 nm, respectively. The complexation of sensor 77 or 78 with Al3+ inhibited the ESIPT process and C
2, v/v) solution, both sensors 77 (λex = 405 nm) and 78 (λex = 455 nm) are non-fluorescent. In the presence of Al3+, sensors 77 and 78 exhibited a 270-fold and 460-fold increase in emission intensity at 505 nm and 509 nm, respectively. The complexation of sensor 77 or 78 with Al3+ inhibited the ESIPT process and C![[double bond, length as m-dash]](https://www.rsc.org/images/entities/char_e001.gif) N isomerization and resulted in fluorescence enhancement through the CHEF effect. The binding constant of sensors 77 and 78 with Al3+ was 9.40 × 10⁴ M−1 and the limit of detection was 14.8 nM and 42.3 nM, respectively. The complexation stoichiometry was 1
N isomerization and resulted in fluorescence enhancement through the CHEF effect. The binding constant of sensors 77 and 78 with Al3+ was 9.40 × 10⁴ M−1 and the limit of detection was 14.8 nM and 42.3 nM, respectively. The complexation stoichiometry was 1![[thin space (1/6-em)]](https://www.rsc.org/images/entities/char_2009.gif) :
:![[thin space (1/6-em)]](https://www.rsc.org/images/entities/char_2009.gif) 1 (77/78
1 (77/78![[thin space (1/6-em)]](https://www.rsc.org/images/entities/char_2009.gif) :
:![[thin space (1/6-em)]](https://www.rsc.org/images/entities/char_2009.gif) Al3+). Further, the 77–Al3+ and 78–Al3+ complexes displayed fluorescence quenching selectively with F−. The limit of detection of the 77–Al3+ and 78–Al3+ complexes was 0.164 μM and 35.8 nM for F−, respectively. Both sensors 77 and 78 found practical application in Al3+ and F− detection using filter paper and in the bioimaging of Al3+ and F− in living cells.
Al3+). Further, the 77–Al3+ and 78–Al3+ complexes displayed fluorescence quenching selectively with F−. The limit of detection of the 77–Al3+ and 78–Al3+ complexes was 0.164 μM and 35.8 nM for F−, respectively. Both sensors 77 and 78 found practical application in Al3+ and F− detection using filter paper and in the bioimaging of Al3+ and F− in living cells.
Gomathi et al. synthesized benzoxazole appended Schiff base 79 for fluorescence-based detection of Zn2+ and PPi (Fig. 31 and Table 2).140 In the DMSO–H2O (1![[thin space (1/6-em)]](https://www.rsc.org/images/entities/char_2009.gif) :
:![[thin space (1/6-em)]](https://www.rsc.org/images/entities/char_2009.gif) 9, v/v, HEPES buffered) solvent system, sensor 79 showed weak emission maxima at 525 nm (λex = 450 nm). On addition of different metal ions to the solution of sensor 79, no significant change in the fluorescence spectrum was observed, except for Zn2+. Fluorescence titration of sensor 79 with Zn2+ displayed a gradual increase in fluorescence intensity with the addition of an increasing concentration of Zn2+ and saturation was reached after the addition of 50 μM Zn2+. The binding stoichiometry was 1
9, v/v, HEPES buffered) solvent system, sensor 79 showed weak emission maxima at 525 nm (λex = 450 nm). On addition of different metal ions to the solution of sensor 79, no significant change in the fluorescence spectrum was observed, except for Zn2+. Fluorescence titration of sensor 79 with Zn2+ displayed a gradual increase in fluorescence intensity with the addition of an increasing concentration of Zn2+ and saturation was reached after the addition of 50 μM Zn2+. The binding stoichiometry was 1![[thin space (1/6-em)]](https://www.rsc.org/images/entities/char_2009.gif) :
:![[thin space (1/6-em)]](https://www.rsc.org/images/entities/char_2009.gif) 1 (79/Zn2+) and the binding constant was 4.53 × 10⁴ M−1. The detection limit was 0.52 μM for Zn2+. Further the sensor 79–Zn2+ ensemble showed significant fluorescence quenching selectively with PPi over other ions. The detection limit of the sensor 79-Zn2+ ensemble was 0.58 μM for PPi and the binding ratio was 1
1 (79/Zn2+) and the binding constant was 4.53 × 10⁴ M−1. The detection limit was 0.52 μM for Zn2+. Further the sensor 79–Zn2+ ensemble showed significant fluorescence quenching selectively with PPi over other ions. The detection limit of the sensor 79-Zn2+ ensemble was 0.58 μM for PPi and the binding ratio was 1![[thin space (1/6-em)]](https://www.rsc.org/images/entities/char_2009.gif) :
:![[thin space (1/6-em)]](https://www.rsc.org/images/entities/char_2009.gif) 1. Test strips coated with sensor 79 exhibited a greenish-yellow color with Zn2+ under UV lamp illumination. Sensor 79 was also applied for monitoring intracellular Zn2+ in HeLa cells.
1. Test strips coated with sensor 79 exhibited a greenish-yellow color with Zn2+ under UV lamp illumination. Sensor 79 was also applied for monitoring intracellular Zn2+ in HeLa cells.
Qiu et al. synthesized diphenylacrylonitrile- and pyridine-based Schiff base 80 for fluorescence-based detection of Co2+–Hg2+–Cu2+ sequentially (Fig. 31, 32 and Table 2).141 In the THF–H2O (1![[thin space (1/6-em)]](https://www.rsc.org/images/entities/char_2009.gif) :
:![[thin space (1/6-em)]](https://www.rsc.org/images/entities/char_2009.gif) 99) mixture, sensor 80 displayed AIE property and red fluorescence at emission wavelength 620 nm (λex = 360 nm). Compared with various other tested metal ions, sensor 80 exhibited fluorescence quenching with Co2+ and Cu2+, and a slight blue-shift with Ag+ and Hg2+, whereas other metal ions had an insignificant effect. From the interference experiment, the quenched fluorescence of sensor 80 + Co2+ could be recovered with Hg2+ addition and quenched again by the addition of Cu2+. The limit of detection was 0.0937 μM, 0.0221 μM, and 0.0988 μM for Co2+, Hg2+ and Cu2+, respectively. The binding stoichiometry ratio was 2
99) mixture, sensor 80 displayed AIE property and red fluorescence at emission wavelength 620 nm (λex = 360 nm). Compared with various other tested metal ions, sensor 80 exhibited fluorescence quenching with Co2+ and Cu2+, and a slight blue-shift with Ag+ and Hg2+, whereas other metal ions had an insignificant effect. From the interference experiment, the quenched fluorescence of sensor 80 + Co2+ could be recovered with Hg2+ addition and quenched again by the addition of Cu2+. The limit of detection was 0.0937 μM, 0.0221 μM, and 0.0988 μM for Co2+, Hg2+ and Cu2+, respectively. The binding stoichiometry ratio was 2![[thin space (1/6-em)]](https://www.rsc.org/images/entities/char_2009.gif) :
:![[thin space (1/6-em)]](https://www.rsc.org/images/entities/char_2009.gif) 1 (80
1 (80![[thin space (1/6-em)]](https://www.rsc.org/images/entities/char_2009.gif) :
:![[thin space (1/6-em)]](https://www.rsc.org/images/entities/char_2009.gif) Co2+/Hg2+/Cu2+). The binding constant value was 4.06 × 10¹¹ M−1, 2.23 × 10¹³ M−1, and 2.87 × 10¹³ M−1 for Co2+, Hg2+ and Cu2+, respectively. In the 1H NMR spectra of sensor 80 + Cu2+, the low field shift of CH
Co2+/Hg2+/Cu2+). The binding constant value was 4.06 × 10¹¹ M−1, 2.23 × 10¹³ M−1, and 2.87 × 10¹³ M−1 for Co2+, Hg2+ and Cu2+, respectively. In the 1H NMR spectra of sensor 80 + Cu2+, the low field shift of CH![[double bond, length as m-dash]](https://www.rsc.org/images/entities/char_e001.gif) N protons and the disappearance of OH group protons suggested the complexation of Cu2+ with sensor 80 through nitrogen and oxygen atoms. Sensor 80 found application in test paper detection and bio-imaging of living cells.
N protons and the disappearance of OH group protons suggested the complexation of Cu2+ with sensor 80 through nitrogen and oxygen atoms. Sensor 80 found application in test paper detection and bio-imaging of living cells.
 | ||
| Fig. 32 Photographs of sensor 80 solutions showing sequential detection of Co2+–Hg2+–Cu2+ under 365 nm UV light irradiation. Reproduced with permission from ref. 141 Copyright 2019, Elsevier. | ||
Xu et al. developed imidazo[2,1-b]thiazole-based Schiff base sensor 81 for Zn2+ and PPi detection (Fig. 31 and Table 2).142 In ethanol–H2O buffered (9![[thin space (1/6-em)]](https://www.rsc.org/images/entities/char_2009.gif) :
:![[thin space (1/6-em)]](https://www.rsc.org/images/entities/char_2009.gif) 1, v/v) solution, sensor 81 showed turn-on fluorescence only with Zn2+ as well as a color change of the solution from colorless to yellow-green under a UV lamp, whereas other metal ions displayed insignificant change. Upon gradual addition of an increasing concentration of Zn2+ to the solution of sensor 81, the fluorescence intensity increased gradually with emission maxima at 511 nm (λex = 330 nm) and reached a plateau after the addition of 6 × 10⁻⁵ M concentration of Zn2+. The binding ratio was 1
1, v/v) solution, sensor 81 showed turn-on fluorescence only with Zn2+ as well as a color change of the solution from colorless to yellow-green under a UV lamp, whereas other metal ions displayed insignificant change. Upon gradual addition of an increasing concentration of Zn2+ to the solution of sensor 81, the fluorescence intensity increased gradually with emission maxima at 511 nm (λex = 330 nm) and reached a plateau after the addition of 6 × 10⁻⁵ M concentration of Zn2+. The binding ratio was 1![[thin space (1/6-em)]](https://www.rsc.org/images/entities/char_2009.gif) :
:![[thin space (1/6-em)]](https://www.rsc.org/images/entities/char_2009.gif) 1 (81
1 (81![[thin space (1/6-em)]](https://www.rsc.org/images/entities/char_2009.gif) :
:![[thin space (1/6-em)]](https://www.rsc.org/images/entities/char_2009.gif) Zn2+) and the association constant value was 2.2 × 10⁵ M−1. The lowest detection limit was 1.2 nM for Zn2+. The sensing mechanism could be credited to snapping of the PET process and C
Zn2+) and the association constant value was 2.2 × 10⁵ M−1. The lowest detection limit was 1.2 nM for Zn2+. The sensing mechanism could be credited to snapping of the PET process and C![[double bond, length as m-dash]](https://www.rsc.org/images/entities/char_e001.gif) N isomerization upon coordination of sensor 81 with Zn2+, leading to turn-on fluorescence through the CHEF process. The sensor 81–Zn2+ ensemble exhibited fluorescence quenching selectively with PPi over other tested ions. The detection limit of the ensemble was 1.9 nM for PPi. Additionally, INHIBIT type logic gates were constructed using the fluorescence signal of sensor 81 at the molecular level.
N isomerization upon coordination of sensor 81 with Zn2+, leading to turn-on fluorescence through the CHEF process. The sensor 81–Zn2+ ensemble exhibited fluorescence quenching selectively with PPi over other tested ions. The detection limit of the ensemble was 1.9 nM for PPi. Additionally, INHIBIT type logic gates were constructed using the fluorescence signal of sensor 81 at the molecular level.
Wang et al. synthesized coumarin-based Schiff base 82 and utilized it as a fluorometric/colorimetric sensor for Cu2+ and glutathione detection (Fig. 31 and Table 2).143 In H2O–CH3CN (1![[thin space (1/6-em)]](https://www.rsc.org/images/entities/char_2009.gif) :
:![[thin space (1/6-em)]](https://www.rsc.org/images/entities/char_2009.gif) 1, v/v) PBS buffered solution, sensor 82 exhibited emission maxima at 521 nm (λex = 450 nm). Compared with different metal ions, sensor 82 underwent selective fluorescence quenching (89.8% quenching) with Cu2+, credited to the paramagnetic nature of Cu2+ (Fig. 33A). Further, the 82–Cu2+ ensemble showed 9.2-fold fluorescence enhancement with glutathione through the Cu2+ displacement approach (Fig. 33B). The lowest detection limit of sensor 82 for Cu2+ and the 82–Cu2+ ensemble for glutathione was 24.0 nM and 0.129 μM, respectively. The binding constant was 2.63 × 10⁵ M−1 for the 2
1, v/v) PBS buffered solution, sensor 82 exhibited emission maxima at 521 nm (λex = 450 nm). Compared with different metal ions, sensor 82 underwent selective fluorescence quenching (89.8% quenching) with Cu2+, credited to the paramagnetic nature of Cu2+ (Fig. 33A). Further, the 82–Cu2+ ensemble showed 9.2-fold fluorescence enhancement with glutathione through the Cu2+ displacement approach (Fig. 33B). The lowest detection limit of sensor 82 for Cu2+ and the 82–Cu2+ ensemble for glutathione was 24.0 nM and 0.129 μM, respectively. The binding constant was 2.63 × 10⁵ M−1 for the 2![[thin space (1/6-em)]](https://www.rsc.org/images/entities/char_2009.gif) :
:![[thin space (1/6-em)]](https://www.rsc.org/images/entities/char_2009.gif) 1 (82/Cu2+) complex. Sensor 82 and the 82–Cu2+ ensemble found application in the bio-imaging of Cu2+ and glutathione, respectively, in living cells and zebrafish.
1 (82/Cu2+) complex. Sensor 82 and the 82–Cu2+ ensemble found application in the bio-imaging of Cu2+ and glutathione, respectively, in living cells and zebrafish.
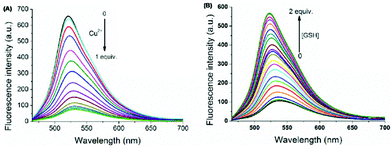 | ||
| Fig. 33 Fluorescence titration spectrum of (A) sensor 82 with Cu2+; (B) 82 + Cu2+ system with GSH. Reproduced with permission from ref. 143 Copyright 2020, Elsevier. | ||
Patra et al. synthesized hydroxycoumarin-pyridylthioether-based Schiff base 83 for fluorescence-based detection of Zn2+ and ATP (Fig. 31 and Table 2).144 In methanol–water (3![[thin space (1/6-em)]](https://www.rsc.org/images/entities/char_2009.gif) :
:![[thin space (1/6-em)]](https://www.rsc.org/images/entities/char_2009.gif) 1, v/v) solution, sensor 83 exhibited poor yellow emission at 555 nm (λex = 315 nm), assigned to activation of the ESIPT and PET processes. In the presence of Zn2+, sensor 83 displayed ∼240 times enhancement in fluorescence along with the blue shift of the emission maxima from 555 nm to 512 nm, credited to inhibition of the ESIPT and PET processes and the CHEF effect. The binding constant was 6.49 × 10⁴ M−1 for 1
1, v/v) solution, sensor 83 exhibited poor yellow emission at 555 nm (λex = 315 nm), assigned to activation of the ESIPT and PET processes. In the presence of Zn2+, sensor 83 displayed ∼240 times enhancement in fluorescence along with the blue shift of the emission maxima from 555 nm to 512 nm, credited to inhibition of the ESIPT and PET processes and the CHEF effect. The binding constant was 6.49 × 10⁴ M−1 for 1![[thin space (1/6-em)]](https://www.rsc.org/images/entities/char_2009.gif) :
:![[thin space (1/6-em)]](https://www.rsc.org/images/entities/char_2009.gif) 1 (83/Zn2+) stoichiometry. Additionally, the 83–Zn2+ ensemble displayed fluorescence quenching selectively with ATP, compared with other anions. The detection limit of sensor 83 and the 83–Zn2+ ensemble for Zn2+ and ATP was 0.078 μM and 6.6 μM, respectively. Sensor 83 demonstrated application in bio-imaging and intracellular Zn2+ detection in RAW 264.7 cells.
1 (83/Zn2+) stoichiometry. Additionally, the 83–Zn2+ ensemble displayed fluorescence quenching selectively with ATP, compared with other anions. The detection limit of sensor 83 and the 83–Zn2+ ensemble for Zn2+ and ATP was 0.078 μM and 6.6 μM, respectively. Sensor 83 demonstrated application in bio-imaging and intracellular Zn2+ detection in RAW 264.7 cells.
Mehta et al. synthesized rhodamine-based Schiff base 84 as a fluorometric sensor for Al3+ detection in an aqueous medium (Fig. 34 and Table 2).145 Upon addition of various metal ions to the solution of sensor 84, turn-on emission with emission maxima at 588 nm (λex = 350 nm) was observed only with Al3+ along with the color change of the solution from colorless to bright pink under UV light. Further, the addition of cyanide ions into the solution of the 84–Al3+ ensemble resulted in fluorescence quenching at 588 nm. The limit of detection of sensor 84 and the 84–Al3+ ensemble for Al3+ and CN− was 1.68 μM and 0.815 μM, respectively. The binding constant was 3.98 mM−1 for a 1![[thin space (1/6-em)]](https://www.rsc.org/images/entities/char_2009.gif) :
:![[thin space (1/6-em)]](https://www.rsc.org/images/entities/char_2009.gif) 1 (84/Al3+) binding ratio. The sensing mechanism could be attributed to Al3+ induced hydrolysis of sensor 84, forming the free –CHO group, and the further nucleophilic attack of CN− on the free –CHO group of the ensemble resulting in the removal of Al3+ and closing of the spirolactam ring by the charge transfer process. Sensor 84 found application in Al3+ detection in A549 cells.
1 (84/Al3+) binding ratio. The sensing mechanism could be attributed to Al3+ induced hydrolysis of sensor 84, forming the free –CHO group, and the further nucleophilic attack of CN− on the free –CHO group of the ensemble resulting in the removal of Al3+ and closing of the spirolactam ring by the charge transfer process. Sensor 84 found application in Al3+ detection in A549 cells.
 | ||
| Fig. 34 The binding mechanism of Al3+ and CN− to sensor 84 and the 84–Al3+ complex, respectively. Reproduced with permission from ref. 145 Copyright 2019, Elsevier. | ||
Kaur et al. synthesized Schiff base sensor 85 for fluorescence-based detection of Cu2+ and PO43−via the complexation/decomplexation approach (Fig. 35 and Table 2).146 In DMSO–HEPES buffer (4![[thin space (1/6-em)]](https://www.rsc.org/images/entities/char_2009.gif) :
:![[thin space (1/6-em)]](https://www.rsc.org/images/entities/char_2009.gif) 6, v/v) solution, sensor 85 showed fluorescence quenching only with Cu2+ over other tested metal ions. Fluorescence titration of sensor 85 with Cu2+ (λex = 338 nm) revealed a continuous decrease in fluorescence intensity with the addition of an increasing concentration of Cu2+, which reached stabilization after the addition of 73.0 μM Cu2+. The sensing mechanism could be attributed to Cu2+ ion-induced hydrolysis of the imine functionality, forming the sensor 85–Cu2+ complex. Furthermore, the addition of PO43− to the 85–Cu2+ ensemble solution resulted in turn-on emission at 422 nm via the decomplexation process. The detection limit of sensor 85 and the 85–Cu2+ ensemble for Cu2+ and PO43− was 2.11 ppb and 31.6 ppb, respectively. Sensor 85 demonstrated practical application in Cu2+ detection and subsequently PO43− detection using paper strips (Fig. 36).
6, v/v) solution, sensor 85 showed fluorescence quenching only with Cu2+ over other tested metal ions. Fluorescence titration of sensor 85 with Cu2+ (λex = 338 nm) revealed a continuous decrease in fluorescence intensity with the addition of an increasing concentration of Cu2+, which reached stabilization after the addition of 73.0 μM Cu2+. The sensing mechanism could be attributed to Cu2+ ion-induced hydrolysis of the imine functionality, forming the sensor 85–Cu2+ complex. Furthermore, the addition of PO43− to the 85–Cu2+ ensemble solution resulted in turn-on emission at 422 nm via the decomplexation process. The detection limit of sensor 85 and the 85–Cu2+ ensemble for Cu2+ and PO43− was 2.11 ppb and 31.6 ppb, respectively. Sensor 85 demonstrated practical application in Cu2+ detection and subsequently PO43− detection using paper strips (Fig. 36).
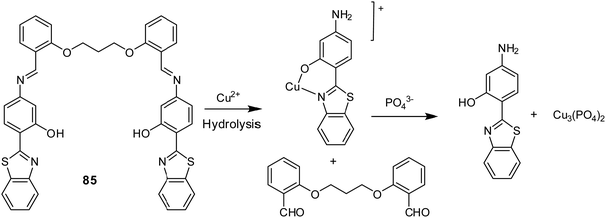 | ||
| Fig. 35 The sensing mechanism of sensor 85 for the sequential detection of Cu2+ and PO43−. Reproduced with permission from ref. 146 Copyright 2018, Elsevier. | ||
 | ||
| Fig. 36 Photographs of paper strips showing fluorescence change of sensor 85 for the sequential detection of Cu2+ and PO43− under 365 nm UV light illumination. Reproduced with permission from ref. 146 Copyright 2018, Elsevier. | ||
Sheet et al. synthesized coumarin-based Schiff base 86 as a light-up probe for Al3+ detection (Fig. 37 and Table 2).147 In 90% aqueous methanol solution, sensor 86 exhibited weak emission at 520 nm (λex = 410 nm). Among various metal ions, sensor 86 showed ∼7-fold fluorescence enhancement only with Al3+ along with the color change from colorless to bright green under a UV lamp. Fluorescence titration of sensor 86 with Al3+ revealed a gradual increase in fluorescence intensity along with the blue shift of the emission maxima from 520 nm to 510 nm (Fig. 38). The binding constant was (9.9 ± 0.04) × 103 M−1 for the 1![[thin space (1/6-em)]](https://www.rsc.org/images/entities/char_2009.gif) :
:![[thin space (1/6-em)]](https://www.rsc.org/images/entities/char_2009.gif) 1 (86/Al3+) complex. The lowest detection limit was 1.62 μM for Al3+. The complexation of Al3+ with sensor 86 makes the system more rigid by inhibiting C
1 (86/Al3+) complex. The lowest detection limit was 1.62 μM for Al3+. The complexation of Al3+ with sensor 86 makes the system more rigid by inhibiting C![[double bond, length as m-dash]](https://www.rsc.org/images/entities/char_e001.gif) N isomerization, leading to fluorescence enhancement through the CHEF effect. Additionally, the 86–Al3+ ensemble acted like an on–off type fluorescent sensor for biologically important nucleotides and phosphate ions. Sensor 86 also found application in exogenous Al3+ detection in living cells.
N isomerization, leading to fluorescence enhancement through the CHEF effect. Additionally, the 86–Al3+ ensemble acted like an on–off type fluorescent sensor for biologically important nucleotides and phosphate ions. Sensor 86 also found application in exogenous Al3+ detection in living cells.
 | ||
| Fig. 37 The binding mechanism of Al3+ and H2PO4−/PPi to sensor 86 and 86–Al3+, respectively. Reproduced with permission from ref. 147 Copyright 2017, Elsevier. | ||
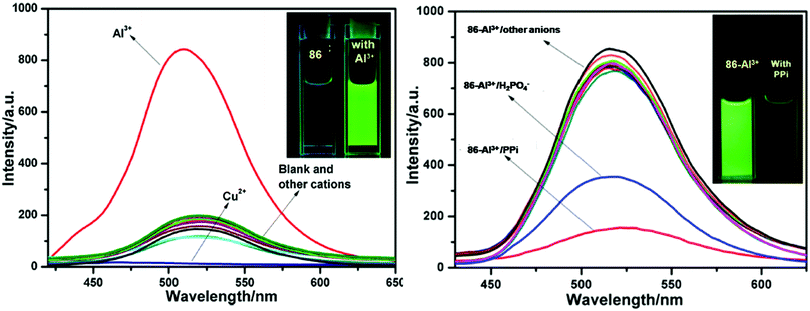 | ||
| Fig. 38 (A) Fluorescence spectrum of sensor 86 in the absence and presence of different metal ions. Inset: Visible color change of sensor 86 in the absence and presence of Al3+. (B) Fluorescence spectrum of the sensor 86–Al3+ ensemble in the absence (left) and presence (right) of different anions. Inset: visible color change of the sensor 86–Al3+ ensemble in the absence (left) and presence of PPi ions (right). Reproduced with permission from ref. 147 Copyright 2017, Elsevier. | ||
3.4 Biomedical applications
Mu et al. developed Schiff base sensor 87 based on carbazole and the triphenylamine unit for Al3+ detection (Fig. 39 and Table 2).148 In ethanol solution, sensor 87 displayed weak fluorescence at 455 nm (λex = 400 nm). Upon gradual addition of an increasing concentration of Al3+, sensor 87 underwent an increase in fluorescence intensity along with a red-shift of the emission maxima from 455 nm to 500 nm. The limit of detection was 63.0 nM for Al3+. The stoichiometry of the complex was 2![[thin space (1/6-em)]](https://www.rsc.org/images/entities/char_2009.gif) :
:![[thin space (1/6-em)]](https://www.rsc.org/images/entities/char_2009.gif) 1 (87/Al3+). In 1H NMR titration, the appearance of a new peak at 9.83 ppm upon addition of Al3+ to the solution of sensor 87 suggested Schiff base hydrolysis and fluorescence enhancement through the CHEF effect. Sensor 87 found potential application in live-cell imaging in living HeLa cells.
1 (87/Al3+). In 1H NMR titration, the appearance of a new peak at 9.83 ppm upon addition of Al3+ to the solution of sensor 87 suggested Schiff base hydrolysis and fluorescence enhancement through the CHEF effect. Sensor 87 found potential application in live-cell imaging in living HeLa cells.
Salarvand et al. designed and synthesized Schiff base sensor 88 based on 2-hydroxynaphthalene as an off–on sensor for Al3+ detection (Fig. 39 and Table 2).149 In methanol/water (9![[thin space (1/6-em)]](https://www.rsc.org/images/entities/char_2009.gif) :
:![[thin space (1/6-em)]](https://www.rsc.org/images/entities/char_2009.gif) 1, v/v) solution, sensor 88 displayed weak emission at 343 nm (λex = 310 nm). Fluorescence titration of sensor 88 with Al3+ showed a gradual increase in fluorescence intensity which reached a plateau after the addition of one equivalent of Al3+. The binding stoichiometry was 1
1, v/v) solution, sensor 88 displayed weak emission at 343 nm (λex = 310 nm). Fluorescence titration of sensor 88 with Al3+ showed a gradual increase in fluorescence intensity which reached a plateau after the addition of one equivalent of Al3+. The binding stoichiometry was 1![[thin space (1/6-em)]](https://www.rsc.org/images/entities/char_2009.gif) :
:![[thin space (1/6-em)]](https://www.rsc.org/images/entities/char_2009.gif) 1 (88/Al3+) and the binding constant was 1.546 × 10⁵ M−1 as calculated using the Benesi–Hildebrand equation. The detection limit was 0.64 μM for Al3+. The chelation of sensor 88 with Al3+ inhibited the ICT process and C
1 (88/Al3+) and the binding constant was 1.546 × 10⁵ M−1 as calculated using the Benesi–Hildebrand equation. The detection limit was 0.64 μM for Al3+. The chelation of sensor 88 with Al3+ inhibited the ICT process and C![[double bond, length as m-dash]](https://www.rsc.org/images/entities/char_e001.gif) N isomerization, resulting in fluorescence enhancement through the CHEF effect. Sensor 88 showed no cytotoxicity to living cells as evaluated using MTT assay on MCF-7 cell lines and found potential application in imaging and tracing Al3+ in living cells.
N isomerization, resulting in fluorescence enhancement through the CHEF effect. Sensor 88 showed no cytotoxicity to living cells as evaluated using MTT assay on MCF-7 cell lines and found potential application in imaging and tracing Al3+ in living cells.
Saravanan et al. synthesized pyrene-based sensor 89 and utilized it for fluorescence-based detection of Cu2+ inside living cells (Fig. 39 and Table 2).150 In DMSO–water (1![[thin space (1/6-em)]](https://www.rsc.org/images/entities/char_2009.gif) :
:![[thin space (1/6-em)]](https://www.rsc.org/images/entities/char_2009.gif) 1, v/v) solution, sensor 89 displayed weak emission at 463 nm (λex = 393 nm). Upon addition of an increasing concentration of Cu2+, sensor 89 underwent fluorescence enhancement along with red-shift of the emission maxima from 463 nm to 467 nm. Job's plot revealed 1
1, v/v) solution, sensor 89 displayed weak emission at 463 nm (λex = 393 nm). Upon addition of an increasing concentration of Cu2+, sensor 89 underwent fluorescence enhancement along with red-shift of the emission maxima from 463 nm to 467 nm. Job's plot revealed 1![[thin space (1/6-em)]](https://www.rsc.org/images/entities/char_2009.gif) :
:![[thin space (1/6-em)]](https://www.rsc.org/images/entities/char_2009.gif) 1 (89/Cu2+) stoichiometry and the association constant was 1.16 × 10⁴ M−1. The detection limit was 0.26 μM for Cu2+. From the DFT calculation, the huge energy difference (−44637.828 eV) between sensor 89 and the sensor 89–Cu2+ (1
1 (89/Cu2+) stoichiometry and the association constant was 1.16 × 10⁴ M−1. The detection limit was 0.26 μM for Cu2+. From the DFT calculation, the huge energy difference (−44637.828 eV) between sensor 89 and the sensor 89–Cu2+ (1![[thin space (1/6-em)]](https://www.rsc.org/images/entities/char_2009.gif) :
:![[thin space (1/6-em)]](https://www.rsc.org/images/entities/char_2009.gif) 1) complex suggested strong coordination of sensor 89 with Cu2+. The bioimaging study of sensor 89 in living RAW 264.7 cells showed the good biocompatibility and cell permeability of sensor 89 and proved it to be an excellent biosensor for Cu2+ detection inside living RAW 264.7 cells.
1) complex suggested strong coordination of sensor 89 with Cu2+. The bioimaging study of sensor 89 in living RAW 264.7 cells showed the good biocompatibility and cell permeability of sensor 89 and proved it to be an excellent biosensor for Cu2+ detection inside living RAW 264.7 cells.
Bhanja et al. developed vanillinyl-based Schiff base 90 and utilized it for fluorescence-based detection of Zn2+ (Fig. 39 and Table 2).151 In DMSO–water (3/7, v/v) solution, sensor 90 exhibited turn-on fluorescence response only with Zn2+ among various other metal ions studied. The fluorescence titration of sensor 90 with Zn2+ displayed a significant increase in fluorescence intensity at 472 nm (λex = 346 nm), which became saturated after the addition of ∼1.1 equivalent of Zn2+. The binding stoichiometry was 1![[thin space (1/6-em)]](https://www.rsc.org/images/entities/char_2009.gif) :
:![[thin space (1/6-em)]](https://www.rsc.org/images/entities/char_2009.gif) 1 (90/Zn2+) and the binding constant was 13.22 × 10⁴ M−1. The detection limit was 0.018 μM for Zn2+. The sensing mechanism could be attributed to Zn2+ induced deprotonation and the CHEF effect. Sensor 90 found potential application in the examination of Zn2+ in living cells (African Monkey Vero cells) by a fluorescence-based cell imaging procedure.
1 (90/Zn2+) and the binding constant was 13.22 × 10⁴ M−1. The detection limit was 0.018 μM for Zn2+. The sensing mechanism could be attributed to Zn2+ induced deprotonation and the CHEF effect. Sensor 90 found potential application in the examination of Zn2+ in living cells (African Monkey Vero cells) by a fluorescence-based cell imaging procedure.
Chen et al. synthesized rhodamine-based Schiff base sensors 91, 92, and 93 for fluorescence-based detection of Fe3+ (Fig. 39 and Table 2).152 In ethanol–water (1/1, v/v) solution, all the three sensors 91, 92, and 93 underwent fluorescence enhancement selectively with Fe3+ over various tested metal ions. Among sensors 91, 92, and 93, sensor 91 displayed 1.5-fold higher fluorescence enhancement with Fe3+ in comparison with sensors 92 and 93. The fluorescence titration of sensor 91 with Fe3+ displayed a gradual increase in fluorescence intensity at 584 nm (λex = 545 nm). The complexation stoichiometry was 1![[thin space (1/6-em)]](https://www.rsc.org/images/entities/char_2009.gif) :
:![[thin space (1/6-em)]](https://www.rsc.org/images/entities/char_2009.gif) 1 (91/Fe3+) and the binding constant was 7.66 × 10⁴ M−1. The limit of detection was 28.1 nM for Fe3+. The sensing mechanism could be attributed to the opening of the spirolactam ring upon coordination of sensor 91 with Fe3+ through the oxygen and nitrogen atom of benzoylhydrazine and the oxygen atom of the oxole unit. Sensor 91 found potential application in Fe3+ detection in living cells. SMMC-7721 cells incubated with sensor 91 displayed bright red fluorescence (λex = 545 nm) upon the addition of Fe3+ (Fig. 40a and b).
1 (91/Fe3+) and the binding constant was 7.66 × 10⁴ M−1. The limit of detection was 28.1 nM for Fe3+. The sensing mechanism could be attributed to the opening of the spirolactam ring upon coordination of sensor 91 with Fe3+ through the oxygen and nitrogen atom of benzoylhydrazine and the oxygen atom of the oxole unit. Sensor 91 found potential application in Fe3+ detection in living cells. SMMC-7721 cells incubated with sensor 91 displayed bright red fluorescence (λex = 545 nm) upon the addition of Fe3+ (Fig. 40a and b).
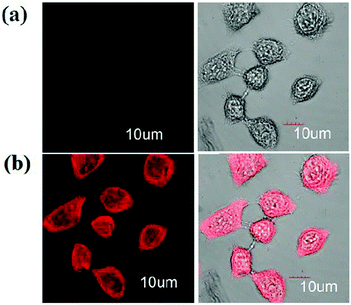 | ||
| Fig. 40 Confocal fluorescence images of SMMC-7721 cells incubated with sensor 91 in the (a) absence and (b) presence of Fe3+. Reproduced with permission from ref. 152 Copyright 2018, Elsevier. | ||
Feng et al. synthesized coumarin based sensor 94 for Cu2+ detection in CH3CN/PBS (1![[thin space (1/6-em)]](https://www.rsc.org/images/entities/char_2009.gif) :
:![[thin space (1/6-em)]](https://www.rsc.org/images/entities/char_2009.gif) 1, v/v) medium (Fig. 39 and Table 2).153 On excitation at 450 nm, sensor 94 displayed strong emission at wavelength 540 nm. On gradual addition of an increasing concentration of Cu2+, sensor 94 underwent fluorescence quenching and reached a plateau after the addition of 5 equivalents of Cu2+. In the mass spectrum, the intense peak at m/z = 454.05 due to [94 + Cu2+–H]+ suggested 1
1, v/v) medium (Fig. 39 and Table 2).153 On excitation at 450 nm, sensor 94 displayed strong emission at wavelength 540 nm. On gradual addition of an increasing concentration of Cu2+, sensor 94 underwent fluorescence quenching and reached a plateau after the addition of 5 equivalents of Cu2+. In the mass spectrum, the intense peak at m/z = 454.05 due to [94 + Cu2+–H]+ suggested 1![[thin space (1/6-em)]](https://www.rsc.org/images/entities/char_2009.gif) :
:![[thin space (1/6-em)]](https://www.rsc.org/images/entities/char_2009.gif) 1 binding stoichiometry. Sensor 94 showed good biocompatibility and low cytotoxicity to MCF cells and A549 cells as determined by the CCK8 assay. Sensor 94 found potential application in Cu2+ detection in real water samples, and in living cells through confocal microscopy. The A549 cells and MCF-7 cells incubated with sensor 94 displayed strong fluorescence, and when treated with Cu2+ showed diminished fluorescence (Fig. 41).
1 binding stoichiometry. Sensor 94 showed good biocompatibility and low cytotoxicity to MCF cells and A549 cells as determined by the CCK8 assay. Sensor 94 found potential application in Cu2+ detection in real water samples, and in living cells through confocal microscopy. The A549 cells and MCF-7 cells incubated with sensor 94 displayed strong fluorescence, and when treated with Cu2+ showed diminished fluorescence (Fig. 41).
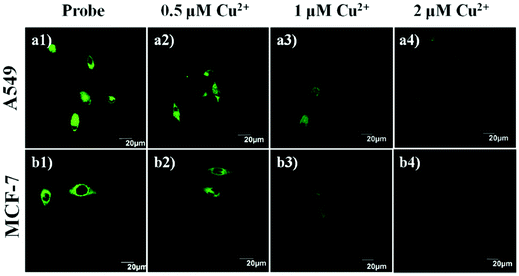 | ||
| Fig. 41 Confocal fluorescence images of A549 cells incubated with sensor 94 (probe) in the (a1) absence and (a2–a4) presence of Cu2+. Confocal fluorescence images of MCF-7 cells incubated with sensor 94 in the (b1) absence and (b2–b4) presence of Cu2+. Reproduced with permission from ref. 153 Copyright 2019, Elsevier. | ||
Hu et al. reported Schiff base 95 as a two-photon fluorescent sensor for Cu2+ detection (Fig. 39 and Table 2).154 In HEPES buffer solution, the one-photon fluorescence spectrum of sensor 95 displayed emission at wavelength 516 nm (λex = 418 nm). Fluorescence titration of sensor 95 with Cu2+ revealed a decrease in emission intensity upon the addition of an increasing concentration of Cu2+. The detection limit was 0.16 μM for Cu2+. The binding stoichiometry was 2![[thin space (1/6-em)]](https://www.rsc.org/images/entities/char_2009.gif) :
:![[thin space (1/6-em)]](https://www.rsc.org/images/entities/char_2009.gif) 1 (95/Cu2+) and the binding constant was 1.02 × 10⁻⁵ M−1. The coordination of sensor 95 with Cu2+ through the nitrogen atom of the imine group and the oxygen atom of the phenolic hydroxyl moiety in a 2
1 (95/Cu2+) and the binding constant was 1.02 × 10⁻⁵ M−1. The coordination of sensor 95 with Cu2+ through the nitrogen atom of the imine group and the oxygen atom of the phenolic hydroxyl moiety in a 2![[thin space (1/6-em)]](https://www.rsc.org/images/entities/char_2009.gif) :
:![[thin space (1/6-em)]](https://www.rsc.org/images/entities/char_2009.gif) 1 (95
1 (95![[thin space (1/6-em)]](https://www.rsc.org/images/entities/char_2009.gif) :
:![[thin space (1/6-em)]](https://www.rsc.org/images/entities/char_2009.gif) Cu2+) manner resulted in fluorescence quenching as confirmed from 1H NMR titration, mass spectra, and DFT calculations. Sensor 95 found practical application in the two-photon fluorescence imaging of Cu2+ in cellular mitochondria and in the liver and intestine of larval zebrafish (Fig. 42).
Cu2+) manner resulted in fluorescence quenching as confirmed from 1H NMR titration, mass spectra, and DFT calculations. Sensor 95 found practical application in the two-photon fluorescence imaging of Cu2+ in cellular mitochondria and in the liver and intestine of larval zebrafish (Fig. 42).
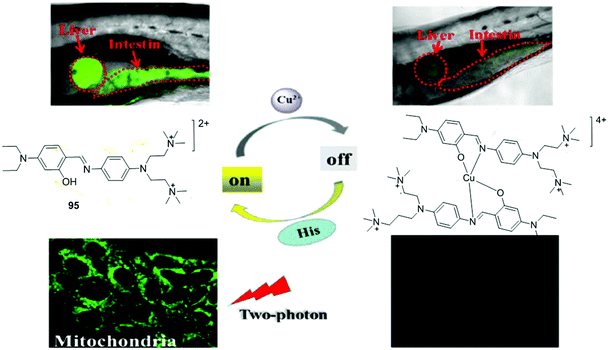 | ||
| Fig. 42 Practical application of sensor 95 in two-photon fluorescence imaging of Cu2+ in cellular mitochondria and in the liver and intestine of larval zebrafish. Reproduced with permission from ref. 154 Copyright 2017, Elsevier. | ||
Huang et al. developed isoquinoline-based Schiff base 96 as a turn-on sensor for Al3+ detection (Fig. 39 and Table 2).155 In ethanol solution, sensor 96 displayed a gradual increase in fluorescence intensity at 458 nm (λex = 400 nm) with the addition of an increasing concentration of Al3+. The limit of detection was 1.11 nM for Al3+. The binding constant was 2.78 × 10⁶ M−1 and the binding stoichiometry was 2![[thin space (1/6-em)]](https://www.rsc.org/images/entities/char_2009.gif) :
:![[thin space (1/6-em)]](https://www.rsc.org/images/entities/char_2009.gif) 1 (96/Al3+). The sensing mechanism could be attributed to inhibition of the ESIPT process upon coordination of Al3+ with sensor 96. Sensor 96 found potential application in the examination of intracellular Al3+ concentration in cells.
1 (96/Al3+). The sensing mechanism could be attributed to inhibition of the ESIPT process upon coordination of Al3+ with sensor 96. Sensor 96 found potential application in the examination of intracellular Al3+ concentration in cells.
Jiao et al. synthesized Schiff base sensor 97 and utilized it as a dual emissive ratiometric fluorescent sensor for Hg2+ detection (Fig. 39 and Table 2).156 In the acetonitrile–water (8![[thin space (1/6-em)]](https://www.rsc.org/images/entities/char_2009.gif) :
:![[thin space (1/6-em)]](https://www.rsc.org/images/entities/char_2009.gif) 2) mixture, sensor 97 was weakly emissive with emission at 530 nm (λex = 440 nm) because of the PET process. The fluorescence titration of sensor 97 with Hg2+ showed a 20-fold increase in fluorescence intensity (530 nm to 490 nm) upon excitation at 440 nm, and 60-fold fluorescence enhancement (530 nm to 415 nm) upon excitation at 315 nm. The emission maxima at 490 nm and 415 nm could be attributed to inhibition of the PET process and hydrolysis of the C
2) mixture, sensor 97 was weakly emissive with emission at 530 nm (λex = 440 nm) because of the PET process. The fluorescence titration of sensor 97 with Hg2+ showed a 20-fold increase in fluorescence intensity (530 nm to 490 nm) upon excitation at 440 nm, and 60-fold fluorescence enhancement (530 nm to 415 nm) upon excitation at 315 nm. The emission maxima at 490 nm and 415 nm could be attributed to inhibition of the PET process and hydrolysis of the C![[double bond, length as m-dash]](https://www.rsc.org/images/entities/char_e001.gif) N group following the addition of Hg2+. The detection limit was 1 nM for Hg2+. Sensor 97 displayed potential for Hg2+ determination in living cells at nano-molar concentration through confocal microscopy. As shown in Fig. 43, MCF-cells stained with sensor 97 when exposed to Hg2+ demonstrated green fluorescence (410–470 nm) and red fluorescence (490–590 nm).
N group following the addition of Hg2+. The detection limit was 1 nM for Hg2+. Sensor 97 displayed potential for Hg2+ determination in living cells at nano-molar concentration through confocal microscopy. As shown in Fig. 43, MCF-cells stained with sensor 97 when exposed to Hg2+ demonstrated green fluorescence (410–470 nm) and red fluorescence (490–590 nm).
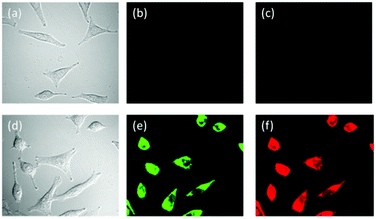 | ||
| Fig. 43 Confocal microscope images of MCF-cells incubated with sensor 97 (a) under bright field; (b) green channel; (c) red channel; and further incubated with Hg2+ (d) under bright field; (e) green channel; (f) red channel. Reproduced with permission from ref. 156 Copyright 2017, Elsevier. | ||
Li et al. reported Schiff base 98 as a turn-on sensor for Zn2+ (Fig. 39 and Table 2).157 In buffer solution (ethanol/Tris–HCl, v/v, 4/1), sensor 98 underwent fluorescence enhancement at 458 nm (λex = 380 nm) with the addition of an increasing concentration of Zn2+ and reached a plateau after the addition of 4 equivalents of Zn2+. The complex stoichiometry was 1![[thin space (1/6-em)]](https://www.rsc.org/images/entities/char_2009.gif) :
:![[thin space (1/6-em)]](https://www.rsc.org/images/entities/char_2009.gif) 1 (98/Zn2+) and the binding constant was 4.457 × 10⁵ M−1 as calculated using the Benesi–Hildebrand equation. The limit of detection was 1.37 μM for Zn2+. The coordination of Zn2+ with sensor 98 through imine nitrogen and the oxygen atom of the phenolic group makes the system more rigid by inhibiting C
1 (98/Zn2+) and the binding constant was 4.457 × 10⁵ M−1 as calculated using the Benesi–Hildebrand equation. The limit of detection was 1.37 μM for Zn2+. The coordination of Zn2+ with sensor 98 through imine nitrogen and the oxygen atom of the phenolic group makes the system more rigid by inhibiting C![[double bond, length as m-dash]](https://www.rsc.org/images/entities/char_e001.gif) N isomerization and the PET process, causing turn-on fluorescence through the CHEF effect. Sensor 98 found potential application in Zn2+ detection in living cells. The lung cancer A549 cells treated with sensor 98 exhibited a significant fluorescence response to Zn2+.
N isomerization and the PET process, causing turn-on fluorescence through the CHEF effect. Sensor 98 found potential application in Zn2+ detection in living cells. The lung cancer A549 cells treated with sensor 98 exhibited a significant fluorescence response to Zn2+.
Liu et al. synthesized naphthol-based sensors 99, 100, and 101 for Al3+ detection (Fig. 39 and Table 2).158 Among sensors 99, 100, and 101, sensor 101 proved to be the best for Al3+ detection over other tested metal ions in CH3OH/HEPES buffer (3/7, v/v). Fluorescence titration of sensor 101 with Al3+ revealed 140-fold fluorescence enhancement at emission wavelength 435 nm (λex = 350 nm) upon addition of 1.0 equivalent of Al3+. The stoichiometry of the complex was 1![[thin space (1/6-em)]](https://www.rsc.org/images/entities/char_2009.gif) :
:![[thin space (1/6-em)]](https://www.rsc.org/images/entities/char_2009.gif) 1 (101/Al3+) and the binding constant was 1.01 × 106.5 M−1. The detection limit was 0.05 μM for Al3+. The sensing mechanism could be attributed to inhibition of C
1 (101/Al3+) and the binding constant was 1.01 × 106.5 M−1. The detection limit was 0.05 μM for Al3+. The sensing mechanism could be attributed to inhibition of C![[double bond, length as m-dash]](https://www.rsc.org/images/entities/char_e001.gif) N isomerization upon coordination of Al3+ with sensor 101 through the nitrogen atom of the imine group and the oxygen atom of the –OH group, forming two saturated 5-membered rings and two unsaturated 6-membered rings, resulting in fluorescence enhancement through the CHEF effect. Sensor 101 showed potential for imaging intracellular Al3+ in living cells. The colon cancer SW480 cells stained with sensor 101 exhibited bright blue fluorescence with intracellular Al3+.
N isomerization upon coordination of Al3+ with sensor 101 through the nitrogen atom of the imine group and the oxygen atom of the –OH group, forming two saturated 5-membered rings and two unsaturated 6-membered rings, resulting in fluorescence enhancement through the CHEF effect. Sensor 101 showed potential for imaging intracellular Al3+ in living cells. The colon cancer SW480 cells stained with sensor 101 exhibited bright blue fluorescence with intracellular Al3+.
Naskar et al. developed benzophenone-derived Schiff base sensor 102 for Al3+ detection by a fluorometric method (Fig. 39 and Table 2).159 In ethanol (0.01%)–HEPES buffer (50 mM) solution, sensor 102 (ΦF = 0.067) exhibited weak fluorescence at 450 nm (λex = 321 nm). In the presence of Al3+, sensor 102 underwent fluorescence enhancement (ΦF = 0.237) at 450 nm. Job's plot showed 1![[thin space (1/6-em)]](https://www.rsc.org/images/entities/char_2009.gif) :
:![[thin space (1/6-em)]](https://www.rsc.org/images/entities/char_2009.gif) 2 (Al3+/102) stoichiometry and the binding constant was 10.188 × 10³ M−1. The limit of detection was 10−7 M for Al3+. The complexation of sensor 102 with Al3+ resulted in the formation of sensor 102–Al3+ aggregates, which in turn caused inhibition of C
2 (Al3+/102) stoichiometry and the binding constant was 10.188 × 10³ M−1. The limit of detection was 10−7 M for Al3+. The complexation of sensor 102 with Al3+ resulted in the formation of sensor 102–Al3+ aggregates, which in turn caused inhibition of C![[double bond, length as m-dash]](https://www.rsc.org/images/entities/char_e001.gif) N isomerization and the ESIPT process, leading to the CHEF effect. Sensor 102 displayed no cytotoxicity up to 40 μM as analyzed by MTT assay. The non-fluorescent HepG2 cells stained with sensor 102 exhibited bright blue fluorescence upon binding with intracellular Al3+.
N isomerization and the ESIPT process, leading to the CHEF effect. Sensor 102 displayed no cytotoxicity up to 40 μM as analyzed by MTT assay. The non-fluorescent HepG2 cells stained with sensor 102 exhibited bright blue fluorescence upon binding with intracellular Al3+.
Patra et al. reported vanillinyl thioether-based Schiff base 103 as a turn-on sensor for Zn2+ detection (Fig. 39 and Table 2).160 On excitation at 346 nm, sensor 103 (ΦF = 0.0051) displayed weak emission at 411 nm in DMSO/H2O (HEPES buffer, v/v = 3/7) solution. In the presence of Zn2+, sensor 103 exhibited new emission at 555 nm and its intensity gradually increased with the increasing concentration of Zn2+ from 0 to ∼1 mol equiv. (ΦF = 0.0399). The complexation of sensor 103 with Zn2+ caused blockage of the PET process, inhibition of the ESIPT process through deprotonation of the phenolic hydroxyl group and turn-on emission through the CHEF effect. The complexation stoichiometry was 1![[thin space (1/6-em)]](https://www.rsc.org/images/entities/char_2009.gif) :
:![[thin space (1/6-em)]](https://www.rsc.org/images/entities/char_2009.gif) 1 (103/Zn2+) and the binding constant was 3.9 × 10⁴ M−1. The detection limit was 60 nM for Zn2+. Vero cells treated with sensor 103 exhibited strong fluorescence when exposed to Zn2+, demonstrating the potential of sensor 103 for imaging intracellular Zn2+ in living cells (Fig. 44).
1 (103/Zn2+) and the binding constant was 3.9 × 10⁴ M−1. The detection limit was 60 nM for Zn2+. Vero cells treated with sensor 103 exhibited strong fluorescence when exposed to Zn2+, demonstrating the potential of sensor 103 for imaging intracellular Zn2+ in living cells (Fig. 44).
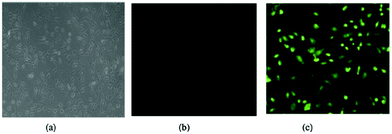 | ||
| Fig. 44 Confocal microscope images of (a) Vero cells; (b) cells stained with sensor 103; (c) cells stained with Zn2+ and then exposed to sensor 103 for 10 minutes. Reproduced with permission from ref. 160 Copyright 2016, Elsevier. | ||
Shellaiah et al. synthesized pyrene-based Schiff base 104 and utilized it as a turn-on sensor for Hg2+ detection by a fluorometric method (Fig. 39 and Table 2).161 In DMSO–H2O (7![[thin space (1/6-em)]](https://www.rsc.org/images/entities/char_2009.gif) :
:![[thin space (1/6-em)]](https://www.rsc.org/images/entities/char_2009.gif) 3, v/v) solution, sensor 104 showed selective turn-on fluorescence response with Hg2+ over other metal ions. Fluorescence titration of sensor 104 with Hg2+ displayed a 31-fold increase in fluorescence intensity along with a red-shift of the emission maxima from 427 nm to 445 nm (λex = 347 nm). The stoichiometry of the complex was 2
3, v/v) solution, sensor 104 showed selective turn-on fluorescence response with Hg2+ over other metal ions. Fluorescence titration of sensor 104 with Hg2+ displayed a 31-fold increase in fluorescence intensity along with a red-shift of the emission maxima from 427 nm to 445 nm (λex = 347 nm). The stoichiometry of the complex was 2![[thin space (1/6-em)]](https://www.rsc.org/images/entities/char_2009.gif) :
:![[thin space (1/6-em)]](https://www.rsc.org/images/entities/char_2009.gif) 1 (104/Hg2+) and the association constant was 7.36 × 10⁴ M−1. The limit of detection was 2.82 μM for Hg2+. The turn-on sensing mechanism could be attributed to excimer formation (104–104*) and the CHEF effect (Fig. 45A). Sensor 104 displayed potential for imaging Hg2+ in living cells using a confocal microscope. The non-fluorescent HeLa cells incubated with sensor 104 exhibited bright blue fluorescence upon treatment with Hg2+ (Fig. 45B).
1 (104/Hg2+) and the association constant was 7.36 × 10⁴ M−1. The limit of detection was 2.82 μM for Hg2+. The turn-on sensing mechanism could be attributed to excimer formation (104–104*) and the CHEF effect (Fig. 45A). Sensor 104 displayed potential for imaging Hg2+ in living cells using a confocal microscope. The non-fluorescent HeLa cells incubated with sensor 104 exhibited bright blue fluorescence upon treatment with Hg2+ (Fig. 45B).
Simon et al. developed anthracene- and pyridine-derived Schiff base 105 as an off–on sensor for Cu2+ detection (Fig. 39 and Table 2).162 On excitation at 350 nm, sensor 105 displayed 23-fold fluorescence enhancement at 430 nm selectively with Cu2+ over other tested metal ions in acetonitrile solution. The stoichiometry of the complex was 1![[thin space (1/6-em)]](https://www.rsc.org/images/entities/char_2009.gif) :
:![[thin space (1/6-em)]](https://www.rsc.org/images/entities/char_2009.gif) 1 (105/Cu2+) and the association constant was 2.12 × 10⁶ M−2. The detection limit was 86.3 nM for Cu2+. The sensing mechanism could be ascribed to suppression of the PET process upon Cu2+ coordination with sensor 105, leading to the formation of the 5-membered stable chelate ring and turn-on emission through the CHEF effect. Sensor 105 showed excellent cell permeability, no cytotoxicity up to 40 μM concentration, and potential for fluorescence imaging of sub-cellular Cu2+. The non-fluorescent Raw264.7 cells incubated with sensor 105 exhibited bright blue fluorescence upon treatment with Cu2+ under a confocal microscope.
1 (105/Cu2+) and the association constant was 2.12 × 10⁶ M−2. The detection limit was 86.3 nM for Cu2+. The sensing mechanism could be ascribed to suppression of the PET process upon Cu2+ coordination with sensor 105, leading to the formation of the 5-membered stable chelate ring and turn-on emission through the CHEF effect. Sensor 105 showed excellent cell permeability, no cytotoxicity up to 40 μM concentration, and potential for fluorescence imaging of sub-cellular Cu2+. The non-fluorescent Raw264.7 cells incubated with sensor 105 exhibited bright blue fluorescence upon treatment with Cu2+ under a confocal microscope.
Tian et al. synthesized quinoline-based Schiff base sensor 106 and utilized it as a turn-on sensor for Al3+ detection (Fig. 39 and Table 2).163 In methanol solution, the complexation behavior of sensor 106 towards various metal ions revealed selective 38-fold fluorescence enhancement at 517 nm (λex = 373 nm) only with Al3+. Job's plot revealed a 1![[thin space (1/6-em)]](https://www.rsc.org/images/entities/char_2009.gif) :
:![[thin space (1/6-em)]](https://www.rsc.org/images/entities/char_2009.gif) 1 (106/Al3+) complexation and the association constant as determined using the Benesi–Hildebrand equation was 2.4 × 10⁴ M−1. The detection limit was 0.12 μM for Al3+. The turn-on sensing mechanism could be credited to suppression of the PET process upon Al3+ coordination with sensor 106. HeLa cells incubated with different concentrations of Al3+ displayed fluorescence emission when exposed to sensor 106, demonstrating the potential of sensor 106 for imaging Al3+ in living cells.
1 (106/Al3+) complexation and the association constant as determined using the Benesi–Hildebrand equation was 2.4 × 10⁴ M−1. The detection limit was 0.12 μM for Al3+. The turn-on sensing mechanism could be credited to suppression of the PET process upon Al3+ coordination with sensor 106. HeLa cells incubated with different concentrations of Al3+ displayed fluorescence emission when exposed to sensor 106, demonstrating the potential of sensor 106 for imaging Al3+ in living cells.
Tian et al. developed 2-hydroxynaphthalene-based Schiff base sensor 107 for Al3+ detection (Fig. 39 and Table 2).164 In methanol medium, free sensor 107 was non-fluorescent. Upon addition of Al3+, sensor 107 underwent a significant increase in fluorescence intensity (150-fold) at 430 nm (λex = 307 nm). The binding constant was 3.01 × 10⁴ M−1 and the limit of detection was 0.137 μM for Al3+. 1H NMR and Job's plot analysis indicated inhibition of the ESIPT process upon coordination of Al3+ with sensor 107 through the nitrogen atom of imine, secondary amine, and the naphthol hydroxyl group in 1![[thin space (1/6-em)]](https://www.rsc.org/images/entities/char_2009.gif) :
:![[thin space (1/6-em)]](https://www.rsc.org/images/entities/char_2009.gif) 1 stoichiometry. HeLa cells incubated with Al3+ showed blue fluorescence when exposed to sensor 107 under a confocal microscope, demonstrating the potential of sensor 107 for fluorescence imaging of Al3+ in living cells. Sensor 107 also found application in the in vivo bioimaging of Al3+ in zebrafish larvae (Fig. 46A and B).
1 stoichiometry. HeLa cells incubated with Al3+ showed blue fluorescence when exposed to sensor 107 under a confocal microscope, demonstrating the potential of sensor 107 for fluorescence imaging of Al3+ in living cells. Sensor 107 also found application in the in vivo bioimaging of Al3+ in zebrafish larvae (Fig. 46A and B).
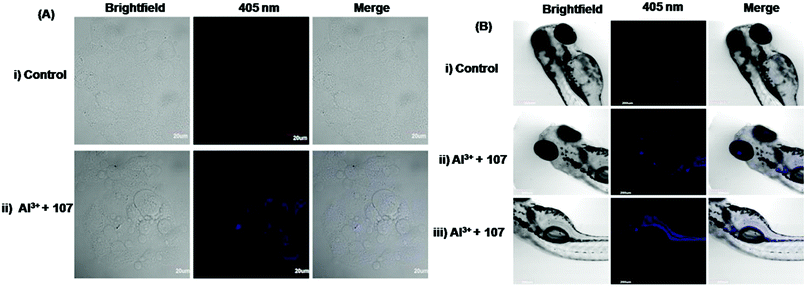 | ||
| Fig. 46 Confocal microscopic images of HeLa cells incubated with (i) sensor 107 and (ii) sensor 107 and further with Al3+. (b) Confocal microscopic images of zebrafish larvae treated with (i) sensor 107 and (ii, iii) sensor 107 and further with Al3+. Reproduced with permission from ref. 164 Copyright 2019, Elsevier. | ||
Wang et al. developed boron-dipyrromethene-based Schiff base 108 for fluorescence-based detection of Au3+ (Fig. 39 and Table 2).165 In phosphate buffer–ethanol (7![[thin space (1/6-em)]](https://www.rsc.org/images/entities/char_2009.gif) :
:![[thin space (1/6-em)]](https://www.rsc.org/images/entities/char_2009.gif) 3, v/v) solution, sensor 108 was weakly fluorescent. Among various metal ions, significant enhancement in fluorescence intensity was observed only with Au3+ (Fig. 47A). Upon gradual addition of Au3+ to the solution of sensor 108, the fluorescence intensity increased linearly with concentration from 0 to 50 μM at 516 nm (λex = 480 nm) and reached a plateau after the addition of 6 equvi. of Au3+. The limit of detection was 60 nM for Au3+. The sensing mechanism was a reaction-based process, wherein the reaction of sensor 108 with Au3+ resulted in the conversion of the C
3, v/v) solution, sensor 108 was weakly fluorescent. Among various metal ions, significant enhancement in fluorescence intensity was observed only with Au3+ (Fig. 47A). Upon gradual addition of Au3+ to the solution of sensor 108, the fluorescence intensity increased linearly with concentration from 0 to 50 μM at 516 nm (λex = 480 nm) and reached a plateau after the addition of 6 equvi. of Au3+. The limit of detection was 60 nM for Au3+. The sensing mechanism was a reaction-based process, wherein the reaction of sensor 108 with Au3+ resulted in the conversion of the C![[double bond, length as m-dash]](https://www.rsc.org/images/entities/char_e001.gif) N bond into aldehyde and formation of a new boron-dipyrromethene derivative (bright green fluorescent). Sensor 108 found potential application in monitoring Au3+ in living cells and in zebrafish. As shown in Fig. 47C, PC12 cells incubated with sensor 108 displayed bright fluorescence when exposed to Au3+. Fig. 47B shows an increase in fluorescence intensity with the increasing concentration of Au3+ ions in zebrafish.
N bond into aldehyde and formation of a new boron-dipyrromethene derivative (bright green fluorescent). Sensor 108 found potential application in monitoring Au3+ in living cells and in zebrafish. As shown in Fig. 47C, PC12 cells incubated with sensor 108 displayed bright fluorescence when exposed to Au3+. Fig. 47B shows an increase in fluorescence intensity with the increasing concentration of Au3+ ions in zebrafish.
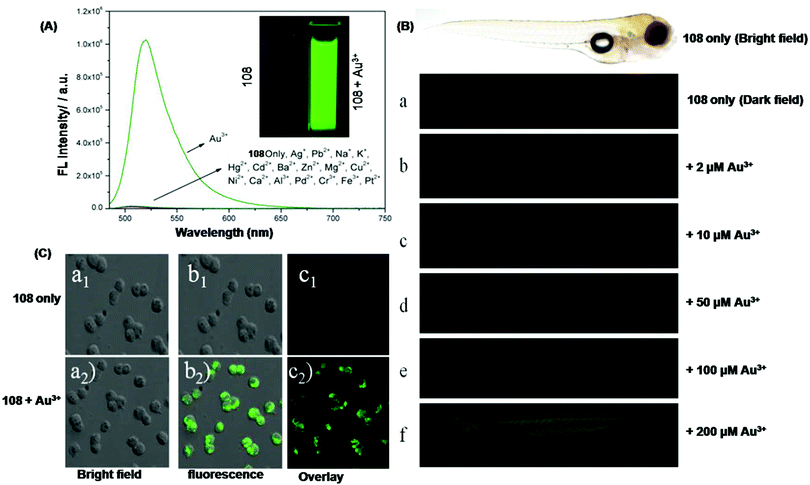 | ||
| Fig. 47 (A) Fluorescence spectrum of sensor 108 in the presence of different metal ions. (Inset:) Visible color change of sensor 108 in the presence of Au3+. (B) Confocal microscopic images of (a) zebrafish incubated with sensor 108; (b–f) zebrafish incubated with different concentrations of Au3+ followed by the addition of sensor 108. (C) Confocal microscopic images of PC12 cells (a1, b1, c1) incubated with sensor 108; (a2, b2, c2) incubated with sensor 108 and further incubated with Au3+. Reproduced with permission from ref. 165 Copyright 2016, Elsevier. | ||
Rahman et al. developed methionine-based Schiff base 109 as a turn-on sensor for Zn2+ detection (Fig. 39 and Table 2).166 In buffered acetonitrile–water (1![[thin space (1/6-em)]](https://www.rsc.org/images/entities/char_2009.gif) :
:![[thin space (1/6-em)]](https://www.rsc.org/images/entities/char_2009.gif) 1) solution, sensor 109 displayed significant fluorescence enhancement at 450 nm (λex = 370 nm) only with Zn2+ over other metal ions. The binding constant was 5.3 × 10⁶ M−1 and the detection limit was 0.5 μM for Zn2+. The sensing mechanism could be attributed to the complexation of Zn2+ with the oxygen, nitrogen, and sulfur atom of sensor 109 in a 1
1) solution, sensor 109 displayed significant fluorescence enhancement at 450 nm (λex = 370 nm) only with Zn2+ over other metal ions. The binding constant was 5.3 × 10⁶ M−1 and the detection limit was 0.5 μM for Zn2+. The sensing mechanism could be attributed to the complexation of Zn2+ with the oxygen, nitrogen, and sulfur atom of sensor 109 in a 1![[thin space (1/6-em)]](https://www.rsc.org/images/entities/char_2009.gif) :
:![[thin space (1/6-em)]](https://www.rsc.org/images/entities/char_2009.gif) 1 ratio as confirmed from 1H NMR titration. Breast cancer cells incubated with sensor 109 and then with Zn2+ displayed strong fluorescence under a confocal microscope, demonstrating the potential of sensor 109 for monitoring intracellular Zn2+.
1 ratio as confirmed from 1H NMR titration. Breast cancer cells incubated with sensor 109 and then with Zn2+ displayed strong fluorescence under a confocal microscope, demonstrating the potential of sensor 109 for monitoring intracellular Zn2+.
Yang et al. developed biphenyl- and benzohydrazide-based Schiff base 110 for Cu2+ detection (Fig. 48 and Table 2).167 In buffered ethanol–water (1![[thin space (1/6-em)]](https://www.rsc.org/images/entities/char_2009.gif) :
:![[thin space (1/6-em)]](https://www.rsc.org/images/entities/char_2009.gif) 1, v/v) solution, sensor 110 exhibited fluorescence at 566 nm (λex = 400 nm). Fluorescence titration of sensor 110 with Cu2+ revealed a gradual decrease in fluorescence intensity, which reached saturation after the addition of 4.0 equivalents of Cu2+. The association constant was 13.87 × 10⁴ M−1 and the binding stoichiometry was 1
1, v/v) solution, sensor 110 exhibited fluorescence at 566 nm (λex = 400 nm). Fluorescence titration of sensor 110 with Cu2+ revealed a gradual decrease in fluorescence intensity, which reached saturation after the addition of 4.0 equivalents of Cu2+. The association constant was 13.87 × 10⁴ M−1 and the binding stoichiometry was 1![[thin space (1/6-em)]](https://www.rsc.org/images/entities/char_2009.gif) :
:![[thin space (1/6-em)]](https://www.rsc.org/images/entities/char_2009.gif) 1 (110/Cu2+). The limit of detection was 15.4 nM for Cu2+. The coordination of Cu2+ with sensor 110 through two oxygen atoms of the hydroxyl group and two nitrogen atoms of the imine group resulted in excited state energy/electron transfer from sensor 110 to Cu2+, causing fluorescence quenching. The bright fluorescence of HeLa cells incubated with sensor 110 diminished after treatment with Cu2+, demonstrating the potential application of sensor 110 in biological systems.
1 (110/Cu2+). The limit of detection was 15.4 nM for Cu2+. The coordination of Cu2+ with sensor 110 through two oxygen atoms of the hydroxyl group and two nitrogen atoms of the imine group resulted in excited state energy/electron transfer from sensor 110 to Cu2+, causing fluorescence quenching. The bright fluorescence of HeLa cells incubated with sensor 110 diminished after treatment with Cu2+, demonstrating the potential application of sensor 110 in biological systems.
Zhu et al. developed Schiff base 111 as an on–off sensor for Al3+ detection in DMSO–H2O (9![[thin space (1/6-em)]](https://www.rsc.org/images/entities/char_2009.gif) :
:![[thin space (1/6-em)]](https://www.rsc.org/images/entities/char_2009.gif) 1, v/v) solution (Fig. 48 and Table 2).168 On excitation at 377 nm, sensor 111 exhibited a weak emission band at 479 nm. In the presence of Al3+, sensor 111 displayed a more than 700-fold increase in fluorescence intensity at 479 nm. The detection limit was 9.79 nM for Al3+. The complexation stoichiometry was 2
1, v/v) solution (Fig. 48 and Table 2).168 On excitation at 377 nm, sensor 111 exhibited a weak emission band at 479 nm. In the presence of Al3+, sensor 111 displayed a more than 700-fold increase in fluorescence intensity at 479 nm. The detection limit was 9.79 nM for Al3+. The complexation stoichiometry was 2![[thin space (1/6-em)]](https://www.rsc.org/images/entities/char_2009.gif) :
:![[thin space (1/6-em)]](https://www.rsc.org/images/entities/char_2009.gif) 1 (111/Al3+). The chelation of sensor 111 with Al3+ inhibited the PET process and resulted in fluorescence enhancement through the CHEF effect. The Benesi–Hildebrand equation revealed an association constant value of 7.106 × 10¹⁰ M−2. HeLa cells incubated with sensor 111 displayed insignificant fluorescence. Upon further incubation with Al3+, remarkable bright blue fluorescence was observed under a confocal microscope, demonstrating the application potential of sensor 111 in biological systems.
1 (111/Al3+). The chelation of sensor 111 with Al3+ inhibited the PET process and resulted in fluorescence enhancement through the CHEF effect. The Benesi–Hildebrand equation revealed an association constant value of 7.106 × 10¹⁰ M−2. HeLa cells incubated with sensor 111 displayed insignificant fluorescence. Upon further incubation with Al3+, remarkable bright blue fluorescence was observed under a confocal microscope, demonstrating the application potential of sensor 111 in biological systems.
Subha et al. developed Schiff base 112 as a turn-on sensor for Zn2+ (Fig. 48 and Table 2).169 In an aqueous medium, sensor 112 exhibited weak emission at 458 nm (λex = 350 nm). Sensor 112 showed selective fluorescence enhancement only with Zn2+ over other metal ions. Fluorescence titration of sensor 112 with Zn2+ revealed ∼40-fold fluorescence enhancement at 460 nm along with a slight red-shift, attributed to inhibition of C![[double bond, length as m-dash]](https://www.rsc.org/images/entities/char_e001.gif) N isomerization. The stoichiometry of the complex was 1
N isomerization. The stoichiometry of the complex was 1![[thin space (1/6-em)]](https://www.rsc.org/images/entities/char_2009.gif) :
:![[thin space (1/6-em)]](https://www.rsc.org/images/entities/char_2009.gif) 1 (112/Zn2+) and the binding constant was 1.57 × 10⁵ M−1. The limit of detection was 10.4 nM for Zn2+. Sensor 112 exhibited potential application in sensing bacterial cells, viz. Staphylococcus aureus and E. coli. The turn-on fluorescence enhancement with bacterial cells could be credited to the formation of an amide or ester bond with the cell wall of bacteria (Fig. 49).
1 (112/Zn2+) and the binding constant was 1.57 × 10⁵ M−1. The limit of detection was 10.4 nM for Zn2+. Sensor 112 exhibited potential application in sensing bacterial cells, viz. Staphylococcus aureus and E. coli. The turn-on fluorescence enhancement with bacterial cells could be credited to the formation of an amide or ester bond with the cell wall of bacteria (Fig. 49).
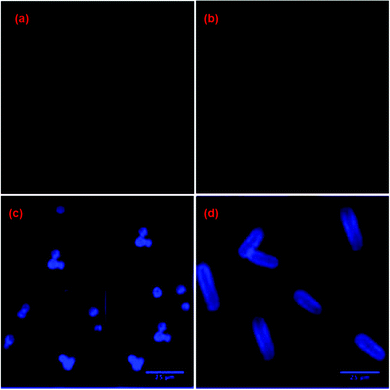 | ||
| Fig. 49 Fluorescence photographs of (a) Streptococcus cells; (b) E. coli cells; (c) Streptococcus cells incubated with sensor 112; (d) E. coli cells incubated with sensor 112. Reproduced with permission from ref. 169 Copyright 2016, Elsevier. | ||
Kundu et al. reported Schiff base sensor 113 for Al3+ and Zn2+ detection in methanol–H2O (1/9, v/v) solution (Fig. 48 and Table 2).170 On excitation at 254 nm, sensor 113 exhibited weak emission with maxima at 355 nm. In the presence of Al3+ or Zn2+, sensor 113 underwent fluorescence enhancement with emission maxima centred at 495 nm (λex = 392 nm) for Al3+ and with emission maxima at 448 nm (λex = 384 nm) for Zn2+ (Fig. 50a and b). Job's plot proved a 1![[thin space (1/6-em)]](https://www.rsc.org/images/entities/char_2009.gif) :
:![[thin space (1/6-em)]](https://www.rsc.org/images/entities/char_2009.gif) 1 (113
1 (113![[thin space (1/6-em)]](https://www.rsc.org/images/entities/char_2009.gif) :
:![[thin space (1/6-em)]](https://www.rsc.org/images/entities/char_2009.gif) Al3+/Zn2+) complexation. The binding constant value was 1.66 × 10⁴ M−1 and 0.6 × 10⁴ M−1 for Al3+ and Zn2+, respectively. The detection limit was 0.804 μM and 0.795 μM for Al3+ and Zn2+, respectively. The complexation of sensor 113 with Al3+/Zn2+ provides rigidity to the system by inhibiting the ESIPT process, the PET process, and C
Al3+/Zn2+) complexation. The binding constant value was 1.66 × 10⁴ M−1 and 0.6 × 10⁴ M−1 for Al3+ and Zn2+, respectively. The detection limit was 0.804 μM and 0.795 μM for Al3+ and Zn2+, respectively. The complexation of sensor 113 with Al3+/Zn2+ provides rigidity to the system by inhibiting the ESIPT process, the PET process, and C![[double bond, length as m-dash]](https://www.rsc.org/images/entities/char_e001.gif) N isomerization, causing fluorescence enhancement through the CHEF effect. Sensor 113 found application in Al3+ and Zn2+ analysis in drug samples such as Gelucil and Zincovit, as well as in bioimaging of Al3+ and Zn2+ in HeLa cells.
N isomerization, causing fluorescence enhancement through the CHEF effect. Sensor 113 found application in Al3+ and Zn2+ analysis in drug samples such as Gelucil and Zincovit, as well as in bioimaging of Al3+ and Zn2+ in HeLa cells.
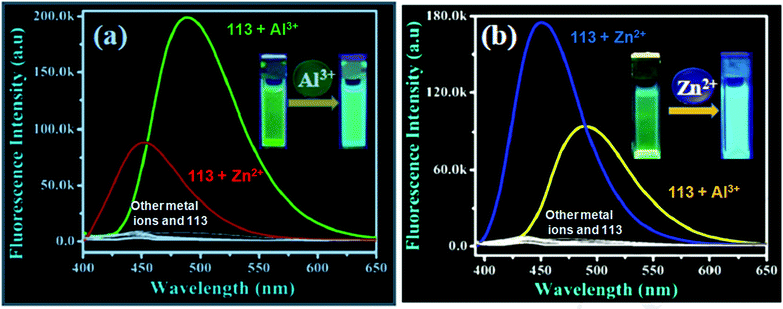 | ||
| Fig. 50 The emission spectrum of sensor 113 in the absence and presence of different metal ions: (a) fluorescence response on excitation at 392 nm; (b) fluorescence response on excitation at 384 nm. Reproduced with permission from ref. 170 Copyright 2019, Elsevier. | ||
Ghorai et al. developed sensor 114 based on azino bis-Schiff base for fluorescence-based detection of Pb2+ (Fig. 48 and Table 2).171 In methanol–water (2![[thin space (1/6-em)]](https://www.rsc.org/images/entities/char_2009.gif) :
:![[thin space (1/6-em)]](https://www.rsc.org/images/entities/char_2009.gif) 1, v/v) solution, sensor 114 exhibited weak emission at 429 nm (λex = 340 nm). Among various metal ions, sensor 114 displayed 34-fold fluorescence enhancement at 442 nm (λex = 340 nm) only with Pb2+. The limit of detection was 8 nM for Pb2+. The binding stoichiometry was 2
1, v/v) solution, sensor 114 exhibited weak emission at 429 nm (λex = 340 nm). Among various metal ions, sensor 114 displayed 34-fold fluorescence enhancement at 442 nm (λex = 340 nm) only with Pb2+. The limit of detection was 8 nM for Pb2+. The binding stoichiometry was 2![[thin space (1/6-em)]](https://www.rsc.org/images/entities/char_2009.gif) :
:![[thin space (1/6-em)]](https://www.rsc.org/images/entities/char_2009.gif) 1 (114
1 (114![[thin space (1/6-em)]](https://www.rsc.org/images/entities/char_2009.gif) :
:![[thin space (1/6-em)]](https://www.rsc.org/images/entities/char_2009.gif) Pb2+). The coordination of Pb2+ with sensor 114 resulted in blockage of the PET process along with the formation of a rigid system, causing fluorescence enhancement through the CHEF effect. Fluorescence titration of sensor 114 with Pb2+ in BSA medium displayed a ∼32-fold increase in emission intensity, illustrating the potential application of sensor 114 in biological samples. In addition, sensor 114 found application in Pb2+ determination in environmental samples such as tap water, river water, and urine samples.
Pb2+). The coordination of Pb2+ with sensor 114 resulted in blockage of the PET process along with the formation of a rigid system, causing fluorescence enhancement through the CHEF effect. Fluorescence titration of sensor 114 with Pb2+ in BSA medium displayed a ∼32-fold increase in emission intensity, illustrating the potential application of sensor 114 in biological samples. In addition, sensor 114 found application in Pb2+ determination in environmental samples such as tap water, river water, and urine samples.
Kumar et al. developed Schiff base sensor 115 for fluorescence-based detection of Al3+ by turn-on mode (Fig. 48 and Table 2).172 In CH3CN–H2O (1![[thin space (1/6-em)]](https://www.rsc.org/images/entities/char_2009.gif) :
:![[thin space (1/6-em)]](https://www.rsc.org/images/entities/char_2009.gif) 1, v/v) solution, sensor 115 exhibited emission maxima at 430 nm (λex = 360 nm). Fluorescence titration of sensor 115 with Al3+ revealed a 42-fold increase in fluorescence intensity. The binding constant was 0.4 × 10⁶ M−1 and the binding stoichiometry ratio was 3
1, v/v) solution, sensor 115 exhibited emission maxima at 430 nm (λex = 360 nm). Fluorescence titration of sensor 115 with Al3+ revealed a 42-fold increase in fluorescence intensity. The binding constant was 0.4 × 10⁶ M−1 and the binding stoichiometry ratio was 3![[thin space (1/6-em)]](https://www.rsc.org/images/entities/char_2009.gif) :
:![[thin space (1/6-em)]](https://www.rsc.org/images/entities/char_2009.gif) 1 (115
1 (115![[thin space (1/6-em)]](https://www.rsc.org/images/entities/char_2009.gif) :
:![[thin space (1/6-em)]](https://www.rsc.org/images/entities/char_2009.gif) Al3+). The limit of detection was 50 μM for Al3+. The off–on fluorescence behavior could be attributed to inhibition of the PET process and enhanced electron delocalization upon coordination of Al3+ with sensor 115. The fluorescence titration of sensor 115 with Al3+ in BSA aqueous medium showed 30 times fluorescence enhancement in comparison to that of the initial one, demonstrating the application of sensor 115 in biological samples. In addition, sensor 115 found application in Al3+ detection in living cells (human embryonic kidney (HEK)).
Al3+). The limit of detection was 50 μM for Al3+. The off–on fluorescence behavior could be attributed to inhibition of the PET process and enhanced electron delocalization upon coordination of Al3+ with sensor 115. The fluorescence titration of sensor 115 with Al3+ in BSA aqueous medium showed 30 times fluorescence enhancement in comparison to that of the initial one, demonstrating the application of sensor 115 in biological samples. In addition, sensor 115 found application in Al3+ detection in living cells (human embryonic kidney (HEK)).
Ghorai et al. developed Schiff base sensor 116 for fluorescence-based detection of Al3+ and HSO3− in methanol–water (2![[thin space (1/6-em)]](https://www.rsc.org/images/entities/char_2009.gif) :
:![[thin space (1/6-em)]](https://www.rsc.org/images/entities/char_2009.gif) 1, v/v) solution (Fig. 48 and Table 2).173 Fluorescence titration of sensor 116 with Al3+ showed a gradual increase in fluorescence intensity at 373 nm (λex = 310 nm) upon addition of an increasing concentration of Al3+ along with the blue-shift of the emission maxima by 28 nm (Fig. 51A). The interaction of Al3+ with sensor 116 resulted in inhibition of the PET process and C
1, v/v) solution (Fig. 48 and Table 2).173 Fluorescence titration of sensor 116 with Al3+ showed a gradual increase in fluorescence intensity at 373 nm (λex = 310 nm) upon addition of an increasing concentration of Al3+ along with the blue-shift of the emission maxima by 28 nm (Fig. 51A). The interaction of Al3+ with sensor 116 resulted in inhibition of the PET process and C![[double bond, length as m-dash]](https://www.rsc.org/images/entities/char_e001.gif) N isomerization, causing fluorescence enhancement through the CHEF effect. The stoichiometry of the complex was 1
N isomerization, causing fluorescence enhancement through the CHEF effect. The stoichiometry of the complex was 1![[thin space (1/6-em)]](https://www.rsc.org/images/entities/char_2009.gif) :
:![[thin space (1/6-em)]](https://www.rsc.org/images/entities/char_2009.gif) 2 (116/Al3+) and the association constant was 1.26 × 10⁵ M−1. The limit of detection was 0.903 μM for Al3+. Sensor 116 showed remarkable detection over a wide pH range of 4–11 and found application in Al3+ detection in the aqueous solution of bovine serum albumin protein (Fig. 51B).
2 (116/Al3+) and the association constant was 1.26 × 10⁵ M−1. The limit of detection was 0.903 μM for Al3+. Sensor 116 showed remarkable detection over a wide pH range of 4–11 and found application in Al3+ detection in the aqueous solution of bovine serum albumin protein (Fig. 51B).
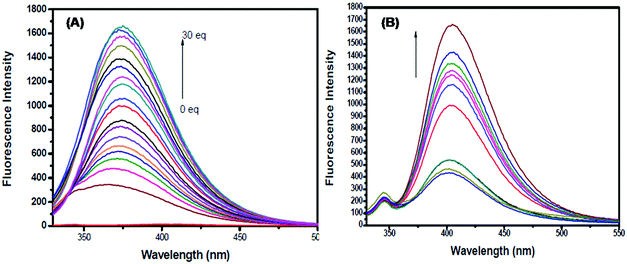 | ||
Fig. 51 Fluorescence titration of (A) sensor 116 with Al3+ in methanol–water (2![[thin space (1/6-em)]](https://www.rsc.org/images/entities/char_2009.gif) : :![[thin space (1/6-em)]](https://www.rsc.org/images/entities/char_2009.gif) 1, v/v) solution; (B) sensor 116 with Al3+ in bovine serum albumin medium. Reproduced with permission from ref. 173 Copyright 2015, Royal Society of Chemistry. 1, v/v) solution; (B) sensor 116 with Al3+ in bovine serum albumin medium. Reproduced with permission from ref. 173 Copyright 2015, Royal Society of Chemistry. | ||
Liu et al. synthesized Schiff base complexes 117 and 118 for fluorescence-based detection of Cu2+ and Fe3+ in an aqueous medium (Fig. 52 and Table 2).174 Among various metal ions, sensor 117 underwent fluorescence quenching selectively with Cu2+ and Fe3+ only. The sensing mechanism could be attributed to host–guest interaction, metal-ion exchange, or competition between the metal ions and complexes for absorption and excitation energy. Furthermore, complex 118 demonstrated excellent anticancer activity against four human tumor cell lines, namely, MDA-MB-231 (human breast cancer), HT29 (human colon cancer), HeLa (human cervical cancer), and PC-3 (human prostate cancer).
Considering the important applications of coumarin derivatives such as antifungal, anticoagulant, and anticancer, Liu et al. synthesized Schiff base-Ir(III) complexes (119–124) as an antitumor agent (Fig. 53 and Table 2).175 All the six complexes exhibited excellent biological stability, and their anticancer activity can be tuned by slight adjustment in the number of phenyl groups and electron donor ability of the Schiff base. In DMSO–H2O (2![[thin space (1/6-em)]](https://www.rsc.org/images/entities/char_2009.gif) :
:![[thin space (1/6-em)]](https://www.rsc.org/images/entities/char_2009.gif) 8, v/v), the fluorescence spectrum of complexes 119–121 showed maxima at 422 nm and this was red-shifted to 474 nm in complexes 122–124. Further, these complexes successfully targeted lysosomes and mitochondria, could induce apoptosis, and displayed potential application as antitumor agents.
8, v/v), the fluorescence spectrum of complexes 119–121 showed maxima at 422 nm and this was red-shifted to 474 nm in complexes 122–124. Further, these complexes successfully targeted lysosomes and mitochondria, could induce apoptosis, and displayed potential application as antitumor agents.
Kim et al. provided a naphthalene-based donor–acceptor type platform for fluorescence-based detection of Fe3+ (Fig. 54 and Table 2).176 The fluorescence spectrum of sensor 125 showed enhancement in emission intensity at 550 nm upon the addition of Fe3+, credited to inhibition of the ESIPT based quenching effect. Further, the sensor displayed application in the fluorescence imaging of Fe3+ in HeLa cells and cancer cell lines. The yellow emission of HeLa cells following incubation with exogenous Fe3+ was more intense than that of the control group incubated with sensor 125.
3.5 Environmental monitoring
Salih et al. prepared fluorescent Schiff base ligand 126 using 2-(1-piperazinyl)ethylamine and 2-hydroxy-5-nitrobenzaldehyde, and the corresponding Cu(II)-complexes (Fig. 55 and Table 2).177 In DMSO solution, the emission spectrum of the Schiff base ligand 126 revealed turn-off response upon complexation with Cu(II) (λex = 360 nm, λem = 475 nm), could be attributed to the PET process and the CHEF effect or to structural change in the ligand upon complexation. Further under mild catalytic conditions for oxidation and in the presence of H2O2 (green oxidant), the Schiff base–Cu(II) complex successfully catalyzed the benzyl alcohol to benzaldehyde oxidation reaction.
Xue et al. developed sulfonylhydrazone type Schiff base sensor 127 (AIE-active) for fluorescence-based detection of Hg(II) (Fig. 56 and Table 2).178 The emission spectrum of sensor 127 showed turn-off response (λex = 414 nm, λem = 549 nm) with the addition of an increasing concentration of Hg2+, and a good linear range between 0.1 and 0.6 μM concentration of Hg2+. The limit of detection was 0.284 nM, and the response time was 15 seconds for Hg2+. Interestingly, polyacrylamide (PAM) doped Schiff base 127 (127–PAM polymer) demonstrated high efficiency of Hg2+ adsorption, with a 99.9% removal rate. Additionally, sensor 127 displayed potential for Hg2+ detection in real water samples and for logic gate construction.
Peng et al. synthesized pyridine-based Schiff base sensors 128 and 129 for Al3+ detection (Fig. 48 and Table 2).179 In DMF–H2O (v![[thin space (1/6-em)]](https://www.rsc.org/images/entities/char_2009.gif) :
:![[thin space (1/6-em)]](https://www.rsc.org/images/entities/char_2009.gif) v = 1
v = 1![[thin space (1/6-em)]](https://www.rsc.org/images/entities/char_2009.gif) :
:![[thin space (1/6-em)]](https://www.rsc.org/images/entities/char_2009.gif) 9) solution, both sensors 128 and 129 exhibited weak emission centered at 483 nm (λex = 360 nm) and 467 nm (λex = 300 nm), respectively. However, upon the addition of Al3+, sensors 128 and 129 displayed an increase in fluorescence intensity at 483 nm and 467 nm, respectively. The turn-on fluorescence was associated with colorless to aquamarine color change of the solution. The limit of detection for Al3+ was 3.2 nM and 0.29 nM with sensors 128 and 129, respectively. Job's plot and HRMS revealed 1
9) solution, both sensors 128 and 129 exhibited weak emission centered at 483 nm (λex = 360 nm) and 467 nm (λex = 300 nm), respectively. However, upon the addition of Al3+, sensors 128 and 129 displayed an increase in fluorescence intensity at 483 nm and 467 nm, respectively. The turn-on fluorescence was associated with colorless to aquamarine color change of the solution. The limit of detection for Al3+ was 3.2 nM and 0.29 nM with sensors 128 and 129, respectively. Job's plot and HRMS revealed 1![[thin space (1/6-em)]](https://www.rsc.org/images/entities/char_2009.gif) :
:![[thin space (1/6-em)]](https://www.rsc.org/images/entities/char_2009.gif) 1 (128/129
1 (128/129![[thin space (1/6-em)]](https://www.rsc.org/images/entities/char_2009.gif) :
:![[thin space (1/6-em)]](https://www.rsc.org/images/entities/char_2009.gif) Al3+) stoichiometry of the complex. The mechanism of interaction could be ascribed to the blockage of the PET and ESIPT processes upon addition of Al3+ as confirmed from the 1H NMR titration experiment. Sensors 128 and 129 found potential application in the detection of Al3+ in lake water and tap water.
Al3+) stoichiometry of the complex. The mechanism of interaction could be ascribed to the blockage of the PET and ESIPT processes upon addition of Al3+ as confirmed from the 1H NMR titration experiment. Sensors 128 and 129 found potential application in the detection of Al3+ in lake water and tap water.
Guo et al. synthesized oligothiophene-based Schiff base 130 as a fluorometric probe for Cu2+ detection (Fig. 48 and Table 2).180 In DMF/H2O (2/3, v/v) solution, free sensor 130 exhibited strong fluorescence with emission maxima at 580 nm (λex = 450 nm). In the presence of Cu2+, sensor 130 underwent fluorescence quenching along with the hypsochromic shift of the emission maxima from 580 nm to 560 nm. The binding constant was 2.52 × 10⁴ M−1 for the 1![[thin space (1/6-em)]](https://www.rsc.org/images/entities/char_2009.gif) :
:![[thin space (1/6-em)]](https://www.rsc.org/images/entities/char_2009.gif) 1 (130/Cu2+) complex. The limit of detection was 28.1 nM for Cu2+. The decrease in the fluorescence intensity of sensor 130 upon complexation with Cu2+ could be ascribed to the paramagnetic nature of Cu2+ and the CHEQ mechanism. Furthermore, sensor 130 found application in Cu2+ detection in real samples such as water and food with excellent accuracy and precision.
1 (130/Cu2+) complex. The limit of detection was 28.1 nM for Cu2+. The decrease in the fluorescence intensity of sensor 130 upon complexation with Cu2+ could be ascribed to the paramagnetic nature of Cu2+ and the CHEQ mechanism. Furthermore, sensor 130 found application in Cu2+ detection in real samples such as water and food with excellent accuracy and precision.
Kang et al. synthesized naphthalimide functionalized Schiff base 131 as a fluorescent turn-on sensor for Al3+ detection (Fig. 48 and Table 2).181 In methanol solution, sensor 131 exhibited weak emission maxima at 524 nm (λex = 401 nm). Among various tested metal ions, sensor 131 showed significant fluorescence enhancement with Al3+ (39-fold), and fluorescence quenching to some extent with Ni2+, Fe2+, Co2+, and Cu2+, whereas other metal ions had an insignificant effect. Fluorescence titration of sensor 131 with Al3+ revealed linear enhancement in emission intensity along with the blue shift of the emission maxima from 524 nm to 508 nm, attributed to the combined effect of inhibition of the ICT process and the CHEF effect (Fig. 57A and B). The detection limit was 7.4 nM for Al3+. The association constant was 1.62 × 10⁴ M−1 for the 1![[thin space (1/6-em)]](https://www.rsc.org/images/entities/char_2009.gif) :
:![[thin space (1/6-em)]](https://www.rsc.org/images/entities/char_2009.gif) 1 (131/Al3+) complex. In addition, the sensor displayed potential application in measuring Al3+ concentration in real water samples.
1 (131/Al3+) complex. In addition, the sensor displayed potential application in measuring Al3+ concentration in real water samples.
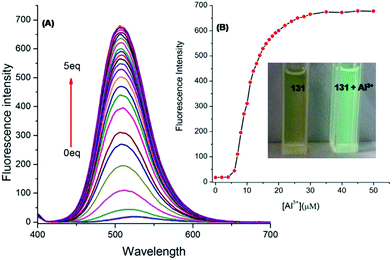 | ||
| Fig. 57 (A) Fluorescence titration of sensor 131 with Al3+. (B) Plot of fluorescence intensity vs. Al3+ concentration. Inset: naked eye detectable color change of sensor 131 in the absence (left) and presence of Al3+ (right) under 365 nm UV light illumination. Reproduced with permission from ref. 181 Copyright 2017, Elsevier. | ||
Kao et al. synthesized quinoline-derived Schiff base 132 as a fluorescence turn-on sensor for Mg2+ detection (Fig. 48 and Table 2).182 On excitation at 353 nm, free sensor 132 displayed no significant emission in acetonitrile solution. However, in the presence of Mg2+, sensor 132 underwent a significant increase in emission intensity at 487 nm and 532 nm. The association constant was 1.91 × 10⁷ M−1 for the 1![[thin space (1/6-em)]](https://www.rsc.org/images/entities/char_2009.gif) :
:![[thin space (1/6-em)]](https://www.rsc.org/images/entities/char_2009.gif) 1 (132/Mg2+) complex. The detection limit was 19.1 ppb for Mg2+. The coordination of sensor 132 with Mg2+ resulted in the formation of a rigid system by inhibiting C
1 (132/Mg2+) complex. The detection limit was 19.1 ppb for Mg2+. The coordination of sensor 132 with Mg2+ resulted in the formation of a rigid system by inhibiting C![[double bond, length as m-dash]](https://www.rsc.org/images/entities/char_e001.gif) N isomerization, leading to fluorescence enhancement through the CHEF effect. In addition, sensor 132 found practical application in the determination of Mg2+ in real water samples such as tap, ground, and lake water (Fig. 58).
N isomerization, leading to fluorescence enhancement through the CHEF effect. In addition, sensor 132 found practical application in the determination of Mg2+ in real water samples such as tap, ground, and lake water (Fig. 58).
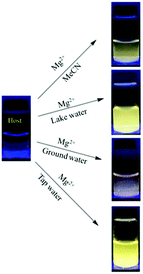 | ||
| Fig. 58 Photographs of Mg2+-induced light-up emission of sensor 132 in different media such as CH3CN, lake water, groundwater, and tap water. Reproduced with permission from ref. 182 Copyright 2016, Elsevier. | ||
Zhang et al. developed Schiff base 133 with AIEE (Aggregation induced emission enhancement) characteristics as a turn-off fluorescent sensor for Cu2+ (Fig. 48 and Table 2).183 In THF-H2O (4/1, v/v) solution, sensor 133 exhibited emission maxima at 565 nm (λex = 428 nm). Both UV-Vis and fluorescence spectra of sensor 133 displayed good selectivity only for Cu2+ over other tested metal ions. Fluorescence titration of sensor 133 with Cu2+ showed a gradual decrease in fluorescence intensity at 565 nm with the addition of an increasing concentration of Cu2+. The limit of detection was 16.4 nM for Cu2+. The binding stoichiometry was 1![[thin space (1/6-em)]](https://www.rsc.org/images/entities/char_2009.gif) :
:![[thin space (1/6-em)]](https://www.rsc.org/images/entities/char_2009.gif) 2 (133/Cu2+) and the binding constant was 1.22 × 10³ M−1. The transfer of lone pairs of electrons from the nitrogen and oxygen atoms to the empty orbitals of Cu2+ blocked the initial ESIPT process and resulted in fluorescence quenching (Fig. 59). Furthermore, sensor 133 found application in monitoring Cu2+ concentration in environmental water samples. The percentage recovery of sensor 133 was 98.49–102.37% in tap water and 99.10–102.90% in lake water.
2 (133/Cu2+) and the binding constant was 1.22 × 10³ M−1. The transfer of lone pairs of electrons from the nitrogen and oxygen atoms to the empty orbitals of Cu2+ blocked the initial ESIPT process and resulted in fluorescence quenching (Fig. 59). Furthermore, sensor 133 found application in monitoring Cu2+ concentration in environmental water samples. The percentage recovery of sensor 133 was 98.49–102.37% in tap water and 99.10–102.90% in lake water.
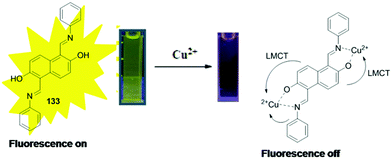 | ||
| Fig. 59 Sensing mechanism of sensor 133 for Cu2+ detection. Reproduced with permission from ref.183 Copyright 2021, MDPI, Basel, Switzerland. | ||
Peng et al. developed naphthalimide-based Schiff base 134 as a fluorescent turn-on probe for Al3+ (Fig. 48 and Table 2).184 In DMF-HEPES (1![[thin space (1/6-em)]](https://www.rsc.org/images/entities/char_2009.gif) :
:![[thin space (1/6-em)]](https://www.rsc.org/images/entities/char_2009.gif) 1, v/v) solution, free sensor 134 was weakly fluorescent with emission maxima at 531 nm (λex = 350 nm). Upon addition of Al3+ into the solution of sensor 134, a significant increase in fluorescence intensity was observed at 524 nm, attributed to inhibition of the PET process and the CHEF effect. The binding constant value was 4.95 × 10⁴ M−1 for the 1
1, v/v) solution, free sensor 134 was weakly fluorescent with emission maxima at 531 nm (λex = 350 nm). Upon addition of Al3+ into the solution of sensor 134, a significant increase in fluorescence intensity was observed at 524 nm, attributed to inhibition of the PET process and the CHEF effect. The binding constant value was 4.95 × 10⁴ M−1 for the 1![[thin space (1/6-em)]](https://www.rsc.org/images/entities/char_2009.gif) :
:![[thin space (1/6-em)]](https://www.rsc.org/images/entities/char_2009.gif) 1 (134/Al3+) complex. The lowest limit of detection was 86.5 nM for Al3+. Furthermore, sensor 134 was found to be useful for Al3+ determination in real water samples such as yellow river and tap water.
1 (134/Al3+) complex. The lowest limit of detection was 86.5 nM for Al3+. Furthermore, sensor 134 was found to be useful for Al3+ determination in real water samples such as yellow river and tap water.
Further, the same group reported another naphthalimide-based Schiff base 135 for fluorescence-based detection of Al3+ (Fig. 48 and Table 2).185 In Tris–HCl buffer (1![[thin space (1/6-em)]](https://www.rsc.org/images/entities/char_2009.gif) :
:![[thin space (1/6-em)]](https://www.rsc.org/images/entities/char_2009.gif) 1, v/v) solution, free sensor 135 exhibited weak emission at 526 nm (λex = 350 nm). Upon addition of various metal ions to the solution of sensor 135, no significant change in emission intensity was observed except with Al3+. In the presence of Al3+, sensor 135 showed fluorescence enhancement with emission maxima at 526 nm, attributed to strong coordination between sensor 135 and Al3+ resulting in inhibition of the PET process and the CHEF effect. The limit of detection was 0.34 μM for Al3+. The binding constant was 2.6 × 10⁴ M−1 for the 1
1, v/v) solution, free sensor 135 exhibited weak emission at 526 nm (λex = 350 nm). Upon addition of various metal ions to the solution of sensor 135, no significant change in emission intensity was observed except with Al3+. In the presence of Al3+, sensor 135 showed fluorescence enhancement with emission maxima at 526 nm, attributed to strong coordination between sensor 135 and Al3+ resulting in inhibition of the PET process and the CHEF effect. The limit of detection was 0.34 μM for Al3+. The binding constant was 2.6 × 10⁴ M−1 for the 1![[thin space (1/6-em)]](https://www.rsc.org/images/entities/char_2009.gif) :
:![[thin space (1/6-em)]](https://www.rsc.org/images/entities/char_2009.gif) 1 (135/Al3+) complex. Moreover, sensor 135 demonstrated potential application in monitoring Al3+ concentration in real water samples such as yellow river and tap water.
1 (135/Al3+) complex. Moreover, sensor 135 demonstrated potential application in monitoring Al3+ concentration in real water samples such as yellow river and tap water.
Zhu et al. developed Schiff base 136 as a turn-on fluorescent sensor for Al3+ detection (Fig. 48 and Table 2).186 In ethanol-HEPES buffer (95![[thin space (1/6-em)]](https://www.rsc.org/images/entities/char_2009.gif) :
:![[thin space (1/6-em)]](https://www.rsc.org/images/entities/char_2009.gif) 5, v/v) solution, sensor 136 showed high selectivity for Al3+ over other tested metal ions. On excitation at 273 nm, sensor 136 displayed weak emission at 473 nm and 499 nm. However, upon the addition of Al3+, a significant enhancement in emission intensity (63-fold) was observed at 473 nm and 499 nm along with the color change of the solution from green to bright blue under 273 nm UV light illumination. The complexation stoichiometry was 1
5, v/v) solution, sensor 136 showed high selectivity for Al3+ over other tested metal ions. On excitation at 273 nm, sensor 136 displayed weak emission at 473 nm and 499 nm. However, upon the addition of Al3+, a significant enhancement in emission intensity (63-fold) was observed at 473 nm and 499 nm along with the color change of the solution from green to bright blue under 273 nm UV light illumination. The complexation stoichiometry was 1![[thin space (1/6-em)]](https://www.rsc.org/images/entities/char_2009.gif) :
:![[thin space (1/6-em)]](https://www.rsc.org/images/entities/char_2009.gif) 1 (136/Al3+). The binding constant of the complex was 6.53 × 10³ M−1 and the detection limit was 0.108 μM for Al3+. The sensing mechanism could be attributed to blockage of the PET process upon complexation of sensor 136 with Al3+. Furthermore, sensor 136 displayed potential application in detecting Al3+ in living cells and environmental samples.
1 (136/Al3+). The binding constant of the complex was 6.53 × 10³ M−1 and the detection limit was 0.108 μM for Al3+. The sensing mechanism could be attributed to blockage of the PET process upon complexation of sensor 136 with Al3+. Furthermore, sensor 136 displayed potential application in detecting Al3+ in living cells and environmental samples.
Sun et al. designed tetraphenylethene-based Schiff base 137 as a colorimetric/fluorescent sensor for Zn2+ and for inkless rewritable paper (Fig. 60 and Table 2).187 In the THF–H2O (1![[thin space (1/6-em)]](https://www.rsc.org/images/entities/char_2009.gif) :
:![[thin space (1/6-em)]](https://www.rsc.org/images/entities/char_2009.gif) 1, v/v) mixture, sensor 137 showed weak emission maxima at 600 nm, which upon addition of Zn2+ resulted in significant fluorescence enhancement along with the blue shift of the emission maxima from 600 nm to 550 nm. Moreover, the emission color of the solution changed from weak red to strong yellow (Fig. 61A). The limit of detection was 38.9 nM for Zn2+. The sensing mechanism could be attributed to the CHEF effect which inhibits the ESIPT, PET, and non-radiative processes, thus resulting in fluorescence enhancement. Further, an inkless rewritable, self-erasing paper was fabricated by utilizing sensor 137 as the imaging layer and H2O as ink, which showed potential application in data storage, information security, and anti-counterfeiting (Fig. 61B and C). Additionally, sensor 137 found application in monitoring Zn2+ in SiHa cells.
1, v/v) mixture, sensor 137 showed weak emission maxima at 600 nm, which upon addition of Zn2+ resulted in significant fluorescence enhancement along with the blue shift of the emission maxima from 600 nm to 550 nm. Moreover, the emission color of the solution changed from weak red to strong yellow (Fig. 61A). The limit of detection was 38.9 nM for Zn2+. The sensing mechanism could be attributed to the CHEF effect which inhibits the ESIPT, PET, and non-radiative processes, thus resulting in fluorescence enhancement. Further, an inkless rewritable, self-erasing paper was fabricated by utilizing sensor 137 as the imaging layer and H2O as ink, which showed potential application in data storage, information security, and anti-counterfeiting (Fig. 61B and C). Additionally, sensor 137 found application in monitoring Zn2+ in SiHa cells.
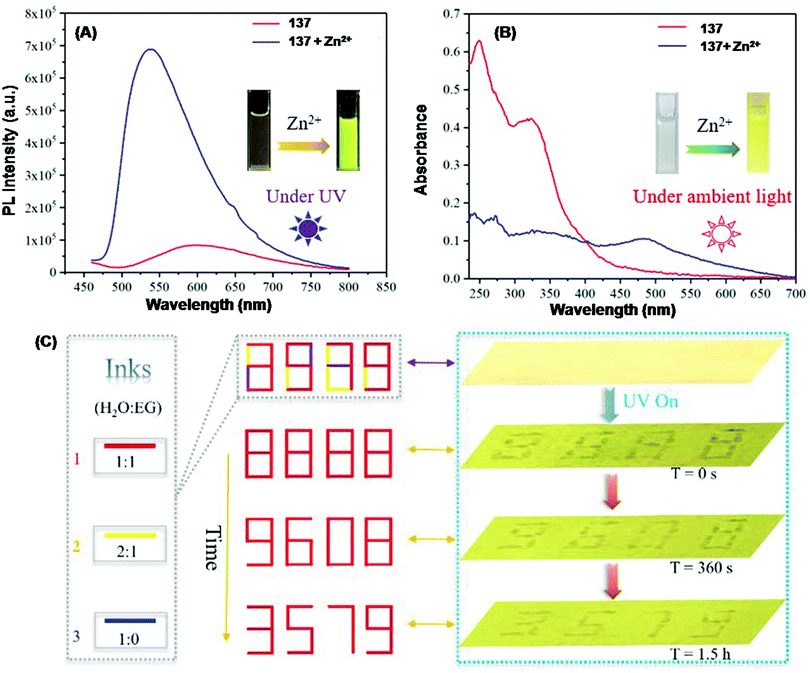 | ||
| Fig. 61 (A) Fluorescence spectrum; (B) absorbance spectrum of sensor 137 in the absence and presence of Zn2+. Inset: Naked eye detectable color change of sensor 137 solution in the absence and presence of Zn2+ under (A) 365 nm UV light and (B) ambient light. (C) Sensor 137 application as inkless rewritable paper in information safety. Reproduced with permission from ref. 187 Copyright 2021, Royal Society of Chemistry. | ||
Sun et al. designed tetraphenylethene-based Schiff base sensor 138 with photochromic properties and employed it as rewritable paper and a UV sensor (Fig. 60 and Table 2).188 Sensor 138 exhibited weak fluorescence in solid-state, which after grinding with a pestle resulted in the appearance of a strong emission band between 550 nm and 700 nm, longer response time and reduced photochromic efficiency. The photochromic mechanism of sensor 138 resulted from enol to keto form photoisomerization. Further sensor 138 found application as rewritable paper. With violet light at 410 nm, sensor 138 served as a pen, while with white light and 420 nm–590 nm visible light, sensor 138 was used as an eraser. Moreover, sensor 138 also served as a UV sensor for the detection of UV radiation pollution by the naked eye (Fig. 62A–D).
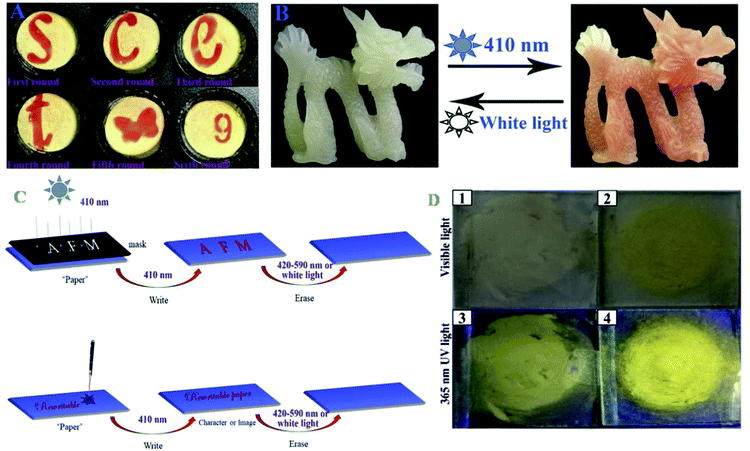 | ||
| Fig. 62 Application of sensor 138 as rewritable paper: (A) different letter, pattern, and number on rewritable paper; (B) proposed system-based reversible photochromic dragon. (C) Writing and erasing process on rewritable paper. (D) Photographs of sensor 138 under 365 nm UV light and visible light: (1 and 3) pristine sample; (2 and 4) ground sample. Reproduced with permission from ref. 188 Copyright 2019, Elsevier. | ||
3.6 Optoelectronic applications
Yang et al. synthesized Schiff base derivatives 139, 140, and 141 for fluorescence-based detection of Cu2+ (Fig. 60 and Table 2).189 All the three sensors (139, 140, and 141) displayed AIE characteristics in the CH3CN–H2O mixture with different water fractions. From the fluorescence experiment, sensor 141 was found to be a specific sensor for Cu2+, whereas sensors 139 and 140 lacked selectivity and displayed fluorescence enhancement with various metal ions (Fig. 63A and C). The fluorescence titration of sensor 141 with Cu2+ in CH3CN–H2O (4![[thin space (1/6-em)]](https://www.rsc.org/images/entities/char_2009.gif) :
:![[thin space (1/6-em)]](https://www.rsc.org/images/entities/char_2009.gif) 1, v/v) solution revealed a linear increase in fluorescence intensity at 463 nm (λex = 350 nm) with the addition of an increasing concentration of Cu2+ (0–20 μM). The limit of detection was 2.3 × 10⁻⁷ M for Cu2+ and the stoichiometry of the complex was 2
1, v/v) solution revealed a linear increase in fluorescence intensity at 463 nm (λex = 350 nm) with the addition of an increasing concentration of Cu2+ (0–20 μM). The limit of detection was 2.3 × 10⁻⁷ M for Cu2+ and the stoichiometry of the complex was 2![[thin space (1/6-em)]](https://www.rsc.org/images/entities/char_2009.gif) :
:![[thin space (1/6-em)]](https://www.rsc.org/images/entities/char_2009.gif) 1 (141
1 (141![[thin space (1/6-em)]](https://www.rsc.org/images/entities/char_2009.gif) :
:![[thin space (1/6-em)]](https://www.rsc.org/images/entities/char_2009.gif) Cu2+). The turn-on fluorescence response of sensor 141 with Cu2+ could be attributed to the CHEF effect. Sensor 141 showed reversible mechanochromic fluorescence behavior with the mechanical stress-induced shift of fluorescence spectra by 21 nm, attributed to transformation between crystalline and amorphous states (Fig. 63B and D).
Cu2+). The turn-on fluorescence response of sensor 141 with Cu2+ could be attributed to the CHEF effect. Sensor 141 showed reversible mechanochromic fluorescence behavior with the mechanical stress-induced shift of fluorescence spectra by 21 nm, attributed to transformation between crystalline and amorphous states (Fig. 63B and D).
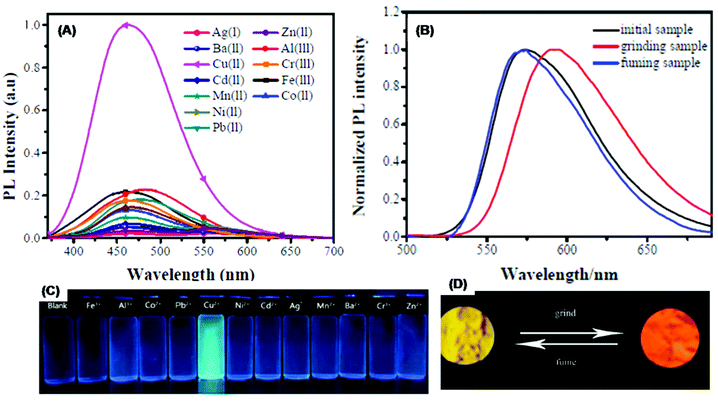 | ||
| Fig. 63 (A) Fluorescence response of sensor 141 in the presence of different metal ions. (B) Normalized fluorescence spectrum of sensor 141 in different solid-states, viz. initial sample, ground sample, and fumed sample. (C) Photographs of sensor 141 solutions in the presence of different metal ions under 365 nm UV light. (D) Color change of sensor 141 after grinding and fuming under 365 nm UV light illumination. Reproduced with permission from ref. 189 Copyright 2017, Royal Society of Chemistry. | ||
Yang et al. developed anthryl-based Schiff bases 142, 143, and 144 for Cu2+ and Zn2+ detection (Fig. 60 and Table 2).190 Among various tested metal ions, only sensor 143 (λex = 432 nm) showed on–off type fluorescence response (λem = 508 nm) with Cu2+ in HEPES buffered methanol-H2O (4/1, v/v) solution, and off–on type fluorescence response (λem = 510 nm) with Zn2+ in pure methanol solution. The binding stoichiometry was 2![[thin space (1/6-em)]](https://www.rsc.org/images/entities/char_2009.gif) :
:![[thin space (1/6-em)]](https://www.rsc.org/images/entities/char_2009.gif) 1 (143
1 (143![[thin space (1/6-em)]](https://www.rsc.org/images/entities/char_2009.gif) :
:![[thin space (1/6-em)]](https://www.rsc.org/images/entities/char_2009.gif) Cu2+/Zn2+), and the binding constant was 1.28 × 10⁸ M−1 and 1.05 × 10⁶ M−1 for Cu2+ and Zn2+, respectively. The limit of detection was 0.212 μM and 71.9 nM for Cu2+ and Zn2+, respectively. The different fluorescence responses of sensor 143 with Cu2+ and Zn2+ could be due to the different electronic configurations of metal ions. For Cu2+, the PET process could be responsible for fluorescence quenching. And for Zn2+, the filled d-orbital and no possibility of d-d transition could be responsible for fluorescence enhancement.
Cu2+/Zn2+), and the binding constant was 1.28 × 10⁸ M−1 and 1.05 × 10⁶ M−1 for Cu2+ and Zn2+, respectively. The limit of detection was 0.212 μM and 71.9 nM for Cu2+ and Zn2+, respectively. The different fluorescence responses of sensor 143 with Cu2+ and Zn2+ could be due to the different electronic configurations of metal ions. For Cu2+, the PET process could be responsible for fluorescence quenching. And for Zn2+, the filled d-orbital and no possibility of d-d transition could be responsible for fluorescence enhancement.
Muthamma et al. used fluorene-based Schiff base 145 (AIE-active) for developing environmentally friendly flexographic ink for printed electronics and for security printing applications (Fig. 60 and Table 2).191 The Schiff base 145 writing and fingerprints on UV dull security paper using flexo ink were invisible under daylight but showed bluish green fluorescence under UV light. Further, the emission of Schiff base 145 writing and fingerprints was sensitive to pH, demonstrating the potential application of the Schiff base in anti-counterfeiting. Further, the mechanical and electrical measurements of flexo-ink printing on UV dull security paper substrates exhibited p-type semiconductivity, thus signifying the potential for application of Schiff base 145 in organic printed transistor devices.
Gondia and Sharma et al. studied comparative optical properties of sensor 146–Zn2+ and sensor 147–Zn2+ complexes (Fig. 60 and Table 2).192 Both sensors 146 and 147 are similar in structure except for the presence of additional phenyl groups in sensor 147. The fluorescence spectrum of sensor 146–Zn2+ and sensor 147–Zn2+ complexes revealed significant emission intensity peaks at 504 nm and 444 nm (λex = 372 nm), respectively. Further, the sensor 146–Zn2+ complex showed nearly two times increased fluorescence as well as blue shift as compared to the emission spectrum of the sensor 147–Zn2+ complex, attributed to the presence of an additional phenyl group. The change in emission of sensors 146 and 147 upon complexation with Zn2+ through N-azomethine and the oxygen atom of the –OH group could be due to the highest to lowest energy state intraligand transition. The CIE (Commission Internationale de L’Eclairage) chromaticity diagram for 146–Zn2+ and 147–Zn2+ complexes revealed a bluish-green region for the 146–Zn2+ complex and a blue region for the 147–Zn2+ complex, suggesting potential application of these complexes in electroluminescent devices (Fig. 64 and Table 3).
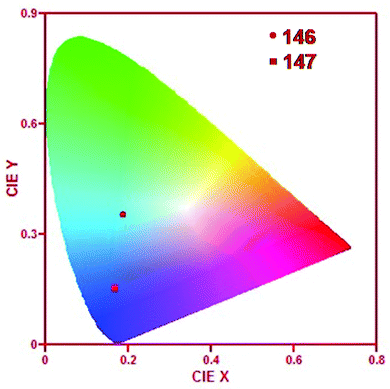 | ||
| Fig. 64 CIE diagram of 146–Zn2+ and 147–Zn2+ complexes. Reproduced with permission from ref. 192 Copyright 2019, Elsevier. | ||
| Compound | Slope | Quantum yield | Color coordinates | |
|---|---|---|---|---|
| x | y | |||
| 146 | 6.37 | 0.46 | 0.187 | 0.355 |
| 147 | 16.59 | 1.21 | 0.168 | 0.152 |
| Standard | 777.95 | 0.54 | — | — |
Nishal et al. presented a series of zinc-Schiff base complexes 148–152 for organic light-emitting device (OLED) application (Fig. 60 and Table 2).193 On excitation at 365 nm, Schiff base complexes 148, 149, 150, 151, and 152 emitted blue with the emission maxima centered at 447, 440, 436, 433, and 430 nm, respectively. The blue luminescence of the Schiff-base complexes was assigned to relaxation from higher to lower energy levels because of intra-ligand transition. Notably, as the number of alkyl groups in bridging diamines increased, the emission maxima were more shifted toward the blue region. The CIE chromaticity diagram and color coordinate calculation showed the potential application of Schiff base-zinc complexes in organic light-emitting devices (OLEDs).
Gusev et al. presented an ethylenediamine Schiff base-Zn2+ complex (153) as a promising emissive material for blue fluorescent OLED applications (Fig. 60 and Table 2).194 The complex 153 emitted strongly both in solution and solid state with maximum emission in the blue region (430–460 nm), assigned to combination of monomer (419 nm)–excimer (433 and 468 nm). Interestingly, complex 153 was fabricated into an organic-light emitting device and demonstrated promising blue fluorescent OLED applications (maximum external quantum efficiency, EQEmax = 5%, and maximum brightness 17![[thin space (1/6-em)]](https://www.rsc.org/images/entities/char_2009.gif) 000 cd m−2).
000 cd m−2).
Das et al. prepared fluorescein-based Schiff base 154 as a fluorometric turn-on sensor for Zn2+ (Fig. 60 and Table 2).195 In HEPES buffered ethanol–H2O (9![[thin space (1/6-em)]](https://www.rsc.org/images/entities/char_2009.gif) :
:![[thin space (1/6-em)]](https://www.rsc.org/images/entities/char_2009.gif) 1, v/v) solution, sensor 154 displayed fluorescence enhancement only with Zn2+ over other metal ions. Fluorescence titration of sensor 154 with Zn2+ revealed an increase in emission intensity at 520 nm (λex = 375 nm) along with color change of the solution from colorless to greenish-yellow under UV light. The complexation of sensor 154 with Zn2+ through the imine group and –OH groups inhibits the PET process and C
1, v/v) solution, sensor 154 displayed fluorescence enhancement only with Zn2+ over other metal ions. Fluorescence titration of sensor 154 with Zn2+ revealed an increase in emission intensity at 520 nm (λex = 375 nm) along with color change of the solution from colorless to greenish-yellow under UV light. The complexation of sensor 154 with Zn2+ through the imine group and –OH groups inhibits the PET process and C![[double bond, length as m-dash]](https://www.rsc.org/images/entities/char_e001.gif) N isomerization, leading to fluorescence enhancement by the CHEF effect. The binding constant was 2.86 × 10⁴ M−1 for the 1
N isomerization, leading to fluorescence enhancement by the CHEF effect. The binding constant was 2.86 × 10⁴ M−1 for the 1![[thin space (1/6-em)]](https://www.rsc.org/images/entities/char_2009.gif) :
:![[thin space (1/6-em)]](https://www.rsc.org/images/entities/char_2009.gif) 1 (154/Zn2+) complex. The limit of detection was 1.59 μM for Zn2+. Additionally, an INHIBIT type logic gate was designed using Zn2+ and EDTA as inputs and emission intensity at 520 nm as output at the molecular level (Fig. 65). Sensor 154 also found application in Zn2+ detection using TLC supported paper strips and in the bioimaging of intracellular Zn2+ ions in Vero cells (African green monkey kidney cells).
1 (154/Zn2+) complex. The limit of detection was 1.59 μM for Zn2+. Additionally, an INHIBIT type logic gate was designed using Zn2+ and EDTA as inputs and emission intensity at 520 nm as output at the molecular level (Fig. 65). Sensor 154 also found application in Zn2+ detection using TLC supported paper strips and in the bioimaging of intracellular Zn2+ ions in Vero cells (African green monkey kidney cells).
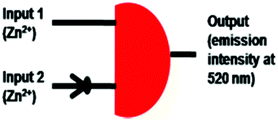 | ||
| Fig. 65 Truth table and INHIBIT type logic gate representation with Zn2+ and EDTA as input and the emission intensity of sensor 154 at 520 nm as output at the molecular level. Reproduced with permission from ref. 195 Copyright 2019, Elsevier. | ||
Das et al. constructed Schiff base sensor 155 using ethylenediamine and 2-hydroxyacetophenone and utilized it for Al3+ detection by fluorescence off–on mode (Fig. 60 and Table 2).196 In methanol–water (1![[thin space (1/6-em)]](https://www.rsc.org/images/entities/char_2009.gif) :
:![[thin space (1/6-em)]](https://www.rsc.org/images/entities/char_2009.gif) 1, v/v) solution, sensor 155 exhibited weak emission in the 380 nm to 700 nm range (λex = 370 nm). Upon the addition of Al3+, sensor 155 underwent an increase in emission intensity along with red-shift. The binding constant was log β = 5.14 for 1
1, v/v) solution, sensor 155 exhibited weak emission in the 380 nm to 700 nm range (λex = 370 nm). Upon the addition of Al3+, sensor 155 underwent an increase in emission intensity along with red-shift. The binding constant was log β = 5.14 for 1![[thin space (1/6-em)]](https://www.rsc.org/images/entities/char_2009.gif) :
:![[thin space (1/6-em)]](https://www.rsc.org/images/entities/char_2009.gif) 1 (155
1 (155![[thin space (1/6-em)]](https://www.rsc.org/images/entities/char_2009.gif) :
:![[thin space (1/6-em)]](https://www.rsc.org/images/entities/char_2009.gif) Al3+) stoichiometry. The limit of detection was 10 μM for Al3+. The off–on fluorescence response could be attributed to inhibition of the PET process upon complexation of Al3+ with sensor 155, resulting in fluorescence enhancement. The 155–Al3+ complex further acted as an on–off type fluorescent sensor for PO43−. An INHIBIT type logic gate was constructed utilizing Al3+ and PO43− as two inputs. Sensor 155 found application in Al3+ determination in BSA and in rat L6 myoblast cells.
Al3+) stoichiometry. The limit of detection was 10 μM for Al3+. The off–on fluorescence response could be attributed to inhibition of the PET process upon complexation of Al3+ with sensor 155, resulting in fluorescence enhancement. The 155–Al3+ complex further acted as an on–off type fluorescent sensor for PO43−. An INHIBIT type logic gate was constructed utilizing Al3+ and PO43− as two inputs. Sensor 155 found application in Al3+ determination in BSA and in rat L6 myoblast cells.
Gupta et al. synthesized sensors 156 and 157 for fluorescence-based detection of Al3+ (Fig. 60 and Table 2).197 The fluorescence spectrum of sensors 156 and 157 (λex = 375 nm) in methanol solution displayed fluorescence enhancement selectively with Al3+ over other tested metal ions and the emission maxima were centered at 465 nm and 464 nm for sensors 156 and 157, respectively. The detection limit of sensors 156 and 157 was 0.525 μM and 2.38 μM, respectively for Al3+ ions. The binding constant was 6.64 × 10³ M−1 and 7.29 × 10³ M−1 for 156![[thin space (1/6-em)]](https://www.rsc.org/images/entities/char_2009.gif) :
:![[thin space (1/6-em)]](https://www.rsc.org/images/entities/char_2009.gif) Al3+ (1
Al3+ (1![[thin space (1/6-em)]](https://www.rsc.org/images/entities/char_2009.gif) :
:![[thin space (1/6-em)]](https://www.rsc.org/images/entities/char_2009.gif) 1) and 157
1) and 157![[thin space (1/6-em)]](https://www.rsc.org/images/entities/char_2009.gif) :
:![[thin space (1/6-em)]](https://www.rsc.org/images/entities/char_2009.gif) Al3+ (1
Al3+ (1![[thin space (1/6-em)]](https://www.rsc.org/images/entities/char_2009.gif) :
:![[thin space (1/6-em)]](https://www.rsc.org/images/entities/char_2009.gif) 1) complexes, respectively. The sensing mechanism could be attributed to the CHEF effect. A combination of AND and NOT gates was developed using Al3+ and EDTA as two inputs and emission intensity as output (Fig. 66).
1) complexes, respectively. The sensing mechanism could be attributed to the CHEF effect. A combination of AND and NOT gates was developed using Al3+ and EDTA as two inputs and emission intensity as output (Fig. 66).
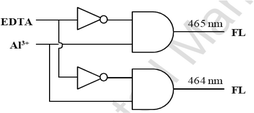 | ||
| Fig. 66 Truth table and AND and NOT gate representation with Al3+ and EDTA as two inputs and emission intensity as output. Reproduced with permission from ref. 197 Copyright 2015, Elsevier. | ||
Naskar et al. synthesized Schiff base sensor 158 using 2-amino-1-ethanol and salicyladehyde for Zn2+ detection in an aqueous medium (Fig. 60 and Table 2).198 On excitation at 359 nm, sensor 158 exhibited emission maxima at 454 nm. In the presence of various metal ions, sensor 158 displayed strong fluorescence enhancement with Zn2+ and moderate response with Al3+, whereas other metal ions had an insignificant effect. The limit of detection of sensor 158 for Zn2+ was 0.477 μM. The binding constant was 24.75 × 10⁴ M−1 for 2![[thin space (1/6-em)]](https://www.rsc.org/images/entities/char_2009.gif) :
:![[thin space (1/6-em)]](https://www.rsc.org/images/entities/char_2009.gif) 1 (158/Zn2+) stoichiometry. The coordination of sensor 158 with Zn2+ caused inhibition of the ESIPT process and C
1 (158/Zn2+) stoichiometry. The coordination of sensor 158 with Zn2+ caused inhibition of the ESIPT process and C![[double bond, length as m-dash]](https://www.rsc.org/images/entities/char_e001.gif) N isomerization, leading to fluorescence enhancement through the CHEF effect. An ‘OR’ logic gate and a ‘Keypad lock’ logic network were fabricated using Zn2+ and Al3+ as input with absorbance at 359 nm and emission at 454 nm as output (Fig. 67A and B). Additionally, sensor 158 found potential application in the fluorescence imaging of Zn2+ in rice seedlings.
N isomerization, leading to fluorescence enhancement through the CHEF effect. An ‘OR’ logic gate and a ‘Keypad lock’ logic network were fabricated using Zn2+ and Al3+ as input with absorbance at 359 nm and emission at 454 nm as output (Fig. 67A and B). Additionally, sensor 158 found potential application in the fluorescence imaging of Zn2+ in rice seedlings.
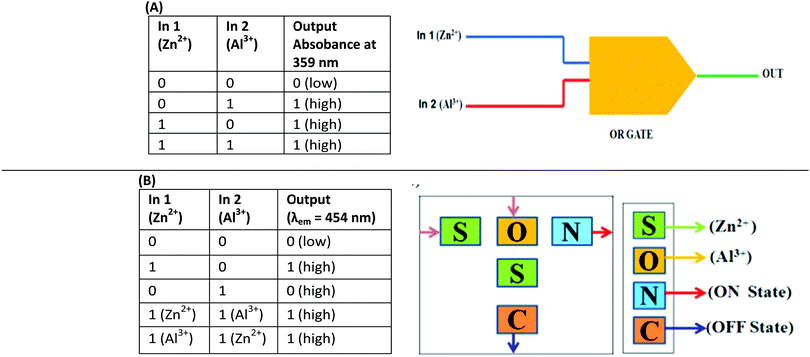 | ||
| Fig. 67 (A) Truth table and OR gate representation with Zn2+ and Al3+ as inputs and absorbance at 359 nm as output. (B) Truth table for fluorescent keypad logic operation. Reproduced with permission from ref. 198 Copyright 2016, Elsevier. | ||
Purkait et al. synthesized Schiff base sensor 159 for fluorescence-based detection of Zn2+, Cd2+, and I− (Fig. 60 and Table 2).199 In DMSO–water (9![[thin space (1/6-em)]](https://www.rsc.org/images/entities/char_2009.gif) :
:![[thin space (1/6-em)]](https://www.rsc.org/images/entities/char_2009.gif) 1 v/v) solution, sensor 159 was non-fluorescent (λex = 482 nm). Among various tested metal ions, sensor 159 displayed fluorescence enhancement only with Zn2+ (λem = 545 nm) and Cd2+ (λem = 560 nm) along with naked eye detectable color change from colorless to bright yellow (for Zn2+) and from colorless to orange color (for Cd2+) under UV light illumination. The interaction of Zn2+/Cd2+ with sensor 159 resulted in fluorescence enhancement due to the CHEF effect. The limit of detection was 2.7 nM (for Zn2+) and 6.6 nM (for Cd2+). The binding constant was 2.7 × 10⁴ M−1 (for the 159–Zn2+ (1
1 v/v) solution, sensor 159 was non-fluorescent (λex = 482 nm). Among various tested metal ions, sensor 159 displayed fluorescence enhancement only with Zn2+ (λem = 545 nm) and Cd2+ (λem = 560 nm) along with naked eye detectable color change from colorless to bright yellow (for Zn2+) and from colorless to orange color (for Cd2+) under UV light illumination. The interaction of Zn2+/Cd2+ with sensor 159 resulted in fluorescence enhancement due to the CHEF effect. The limit of detection was 2.7 nM (for Zn2+) and 6.6 nM (for Cd2+). The binding constant was 2.7 × 10⁴ M−1 (for the 159–Zn2+ (1![[thin space (1/6-em)]](https://www.rsc.org/images/entities/char_2009.gif) :
:![[thin space (1/6-em)]](https://www.rsc.org/images/entities/char_2009.gif) 1) complex) and 0.96 × 10⁴ M−1 (for the 159–Cd2+ (1
1) complex) and 0.96 × 10⁴ M−1 (for the 159–Cd2+ (1![[thin space (1/6-em)]](https://www.rsc.org/images/entities/char_2009.gif) :
:![[thin space (1/6-em)]](https://www.rsc.org/images/entities/char_2009.gif) 1) complex). Upon addition of Na2EDTA to the solution of the sensor 159–Zn2+/Cd2+ complex, on–off type fluorescence response was observed, signifying reversibility and reusability of sensor 159. An INHIBIT type logic gate was generated using Zn2+/Cd2+ and EDTA as input and emission intensity as output (Fig. 68). Sensor 159 also displayed practical application in sensing Zn2+ and Cd2+ in TLC plates and in drinking water.
1) complex). Upon addition of Na2EDTA to the solution of the sensor 159–Zn2+/Cd2+ complex, on–off type fluorescence response was observed, signifying reversibility and reusability of sensor 159. An INHIBIT type logic gate was generated using Zn2+/Cd2+ and EDTA as input and emission intensity as output (Fig. 68). Sensor 159 also displayed practical application in sensing Zn2+ and Cd2+ in TLC plates and in drinking water.
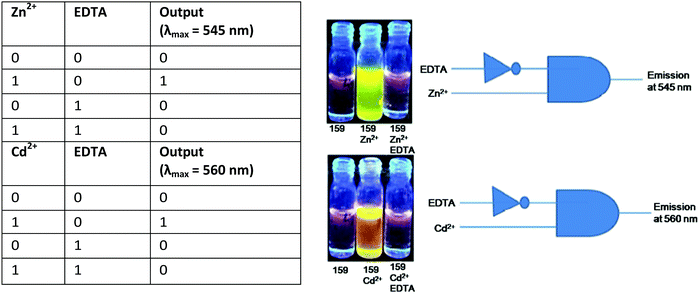 | ||
| Fig. 68 Truth table and INHIBIT logic gate representation with the Zn2+ and Cd2+ complex of sensor 159 and EDTA as inputs. Reproduced with permission from ref. 199 Copyright 2018, Royal Society of Chemistry. | ||
Vinoth Kumar et al. synthesized Schiff base 160 as a turn-on sensor for Ni2+ (Fig. 60 and Table 2).200 In acetonitrile solution, sensor 160 showed an off–on type fluorescence response with Ni2+, whereas other metal ions had an insignificant effect. Fluorescence titration of sensor 160 with Ni2+ revealed a continuous increase in fluorescence intensity at 542 nm (λex = 400 nm) upon addition of an increasing concentration of Ni2+ (0–60 μM), attributed to the CHEF effect. The detection limit was 8.67 nM for Ni2+ and the association constant was 4.18 × 10⁵ M−1 for the 160–Ni2+ (1![[thin space (1/6-em)]](https://www.rsc.org/images/entities/char_2009.gif) :
:![[thin space (1/6-em)]](https://www.rsc.org/images/entities/char_2009.gif) 1) complex. Upon addition of Na2EDTA to the solution of the sensor 160–Ni2+ complex, fluorescence quenching was observed, suggesting reversibility and reusability of sensor 160. Additionally, the molecular logic gate of AND, OR, NOT, and NOR type and truth table were created based on Ni2+ and EDTA as input and absorbance and emission intensity at 428 nm and 542 nm as output. Sensor 160 found application in the fluorescence imaging of intracellular Ni2+ in HeLa cells.
1) complex. Upon addition of Na2EDTA to the solution of the sensor 160–Ni2+ complex, fluorescence quenching was observed, suggesting reversibility and reusability of sensor 160. Additionally, the molecular logic gate of AND, OR, NOT, and NOR type and truth table were created based on Ni2+ and EDTA as input and absorbance and emission intensity at 428 nm and 542 nm as output. Sensor 160 found application in the fluorescence imaging of intracellular Ni2+ in HeLa cells.
Jothi et al. synthesized naphthalimide-based Schiff base 161 for detection of Fe3+ based on a fluorometric method (Fig. 60 and Table 2).201 In the acetonitrile–water (7![[thin space (1/6-em)]](https://www.rsc.org/images/entities/char_2009.gif) :
:![[thin space (1/6-em)]](https://www.rsc.org/images/entities/char_2009.gif) 3) mixture, sensor 161 showed strong emission at 531 nm (λex = 344 nm). The fluorescence titration of sensor 161 with Fe3+ revealed a gradual decrease in fluorescence intensity with the addition of an increasing concentration of Fe3+. The limit of detection was 0.81 μM for Fe3+. The stoichiometry of the complex was 1
3) mixture, sensor 161 showed strong emission at 531 nm (λex = 344 nm). The fluorescence titration of sensor 161 with Fe3+ revealed a gradual decrease in fluorescence intensity with the addition of an increasing concentration of Fe3+. The limit of detection was 0.81 μM for Fe3+. The stoichiometry of the complex was 1![[thin space (1/6-em)]](https://www.rsc.org/images/entities/char_2009.gif) :
:![[thin space (1/6-em)]](https://www.rsc.org/images/entities/char_2009.gif) 1 (161/Fe3+) and the binding constant was 2.49 × 10⁴ M−1. The sensing mechanism could be attributed to blockage of ICT and C
1 (161/Fe3+) and the binding constant was 2.49 × 10⁴ M−1. The sensing mechanism could be attributed to blockage of ICT and C![[double bond, length as m-dash]](https://www.rsc.org/images/entities/char_e001.gif) N isomerization upon complexation of sensor 161 with Fe3+. Furthermore, NOT gate, OR gate logic circuit, and truth table were constructed using Fe3+ and EDTA as input and emission intensity at 531 nm as output (Fig. 69). Additionally, sensor 161 demonstrated potential application in detecting Fe3+ in test paper and water samples, and in fluorescent bioimaging.
N isomerization upon complexation of sensor 161 with Fe3+. Furthermore, NOT gate, OR gate logic circuit, and truth table were constructed using Fe3+ and EDTA as input and emission intensity at 531 nm as output (Fig. 69). Additionally, sensor 161 demonstrated potential application in detecting Fe3+ in test paper and water samples, and in fluorescent bioimaging.
 | ||
| Fig. 69 Truth table and logic gate representation with Fe3+and EDTA as inputs. Reproduced with permission from ref. 201 Copyright 2021, Royal Society of Chemistry. | ||
4. Conclusion and future opportunities
Metal ions are ubiquitous in nature, and up to certain concentrations as fixed by WHO and EPA they are non-toxic. In fact, some metal ions are essential for the normal functioning of living organisms. Nowadays, researchers are using Schiff base metal ion complexes for productive purposes owing to their outstanding applications in optoelectronic systems. However, with the increase in their concentration due to industrialization and urbanization, metal ions have shown toxic effects on human health and the environment. Therefore, their detection is crucial, which is challenging. This review summarized the recent advances in fluorescent Schiff base sensors for metal ion detection in the past six years.The commonly used mechanisms for metal ion detection include self-assembly/disassembly, aggregation/disaggregation, photo-induced electron transfer (PET), intra/intermolecular charge transfer (ICT), metal to ligand charge transfer (MLCT), ligand to metal charge transfer (LMCT), Förster resonance energy transfer (FRET), excited state intramolecular proton transfer (ESIPT), inner filter effect (IFE), metal-induced chemical change and C![[double bond, length as m-dash]](https://www.rsc.org/images/entities/char_e001.gif) N isomerization. Metal ions upon coordination with Schiff base sensors generally show fluorescence enhancement or quenching leading to the CHEF or CHEQ effect, respectively. However, for a few systems, ratiometric fluorescence change was also observed. Usually, paramagnetic metal ions such as Cu2+ and Fe3+ act as a fluorescence quencher and show CHEQ effects when bound with chemosensors. However, there are several reports wherein fluorescence enhancement was also observed with these metal ions. Additionally, the ESIPT process was associated with the sensors containing the salicylimine group. Because of the free rotation around the C
N isomerization. Metal ions upon coordination with Schiff base sensors generally show fluorescence enhancement or quenching leading to the CHEF or CHEQ effect, respectively. However, for a few systems, ratiometric fluorescence change was also observed. Usually, paramagnetic metal ions such as Cu2+ and Fe3+ act as a fluorescence quencher and show CHEQ effects when bound with chemosensors. However, there are several reports wherein fluorescence enhancement was also observed with these metal ions. Additionally, the ESIPT process was associated with the sensors containing the salicylimine group. Because of the free rotation around the C![[double bond, length as m-dash]](https://www.rsc.org/images/entities/char_e001.gif) N bond, Schiff base-based sensors may show the AIE phenomenon. Schiff bases commonly include hydrazone, acyl hydrazone, salicylimine, azine, and other groups, and provide nitrogen and oxygen atoms for coordination with metal ions.
N bond, Schiff base-based sensors may show the AIE phenomenon. Schiff bases commonly include hydrazone, acyl hydrazone, salicylimine, azine, and other groups, and provide nitrogen and oxygen atoms for coordination with metal ions.
Due to the global existence of metal ions, environmental monitoring and biomedical application are the most common practical application of Schiff base sensors. Other applications of fluorescent Schiff base sensors include multi-metal ion sensors, a sequential sensor for other ions, and optoelectronic systems. The molecular switching properties of Schiff base sensors have been applied in the construction of molecular keypads and logic gates.
The development of fluorescent Schiff base sensors and their commercial applications will always be of immense interest to researchers. Although existing results are plentiful, future efforts need to be undertaken in the following aspects. First, the main drawbacks of as-developed fluorescent Schiff base sensors are instability and poor water solubility in an aqueous medium. Except for sensors 2, 8, 11, 22, 35, 45, 58, 84, 112, 117, 118, and 158, the optical properties of Schiff base sensors were studied in either H2O-DMF/DMSO/THF/CH3CN/ethanol/methanol buffered binary mixtures or in CH3CN, ethanol, methanol solutions (Table 2), thus limiting their application in biological and environmental systems. Second, from Table 2 we can conclude that most of the work has been done on the detection of Al3+, Cu2+, and Zn2+, and insufficient literature is available for other important and toxic metal ions. Third, Schiff base sensors can be applied for fluorescence-based speciation of metal ions such as Fe2+/Fe3+, As3+/As5+, Cr3+/Cr4+, etc. Fourth, the selectivity and sensitivity of the Schiff base sensor need to be improved. Fifth, although there are several practical applications of Schiff base sensors, so far there have been no available well known commercial applications because of the poor stability (as Schiff bases are prone to hydrolysis, the carbonyl and amine groups might be regenerated on hydrolysis), pH sensitivity, and decrease in fluorescence of Schiff base sensors with time. Therefore, the prototype should be made for the commercialization of these techniques. This will be useful for diagnostic purposes and pollutant detection on-site. Sixth, the majority of the developed sensors are based on one-photon excitation and few reports are available for two-photon fluorescent sensors. In comparison, two-photon fluorescent probes offer several advantages over conventional one-photon fluorescent probes such as decreased photo-damage to biological samples, deeper penetration into cells, tissues, and organelles, and minimization of background interference. Therefore, future efforts should be on the development of two-photon fluorescent sensors.
Although fluorescent-based Schiff base sensors encounter many challenges in terms of both exploratory and practical application, by taking into consideration the above-mentioned aspects in the sensor design and application-oriented research work, we believe that fluorescent Schiff base sensors can be utilized as important materials in the upcoming days and their commercial availability will be expected in the future.
Conflicts of interest
There are no conflicts to declare.References
- K. S. Egorova and V. P. Ananikov, Organometallics, 2017, 36, 4071–4090 CrossRef CAS.
- J. K. Fawell, E. Ohanian, M. Giddings, P. Toft, Y. Magara and P. Jackson, Inorganic Tin in Drinking-water WHO, Guidelines for Drinking-water Quality, 2004 Search PubMed.
- F. S. Al-fartusie and S. N. Mohssan, Indian J. Adv. Chem. Sci., 2017, 5, 127–136 CAS.
- A. L. Berhanu, Gaurav, I. Mohiuddin, A. K. Malik, J. S. Aulakh, V. Kumar and K.-H. Kim, Trends Anal. Chem., 2019, 116, 74–91 CrossRef CAS.
- M. Kumar and A. Puri, Indian J. Occup. Environ. Med., 2012, 16, 40–44 CrossRef PubMed.
- T. Gong, J. Liu, X. Liu, J. Liu, J. Xiang and Y. Wu, Food Chem., 2016, 213, 306–312 CrossRef CAS PubMed.
- J. Dalmieda and P. Kruse, Sensors, 2019, 19, 5134 CrossRef CAS PubMed.
- Y. Lu, X. Liang, C. Niyungeko, J. Zhou, J. Xu and G. Tian, Talanta, 2018, 178, 324–338 CrossRef CAS PubMed.
- L. Cui, J. Wu and H. Ju, Biosens. Bioelectron., 2015, 63, 276–286 CrossRef CAS PubMed.
- S. Sikdar and M. Kundu, ChemBioEng Rev., 2018, 5, 18–29 CrossRef CAS.
- M. H. Chua, H. Zhou, Q. Zhu, B. Z. Tang and J. W. Xu, Mater. Chem. Front, 2021, 5, 659–708 RSC.
- J. Zhang, L. Xu and W. Wong, Coord. Chem. Rev., 2018, 355, 180–198 CrossRef CAS.
- S. Sandhu, R. Kumar, N. Tripathi, H. Singh, P. Singh and S. Kumar, Sens. Actuators, B, 2017, 241, 8–18 CrossRef CAS.
- N. Tripathi, P. Singh and S. Kumar, New J. Chem., 2017, 41, 8739–8747 RSC.
- N. Tripathi and M. K. Goshisht, Aggregation of Luminophores in Supramolecular Systems: From Mechanisms to Applications, CRC Press, Taylor Fr., 2020, pp. 1–220 Search PubMed.
- N. Tripathi, R. Kumar, P. Singh and S. Kumar, Sens. Actuators, B, 2017, 246, 1001–1010 CrossRef CAS.
- M. K. Goshisht and N. Tripathi, J. Mater. Chem. C, 2021, 9, 9820–9850 RSC.
- N. Tripathi, P. Singh, V. Luxami, D. Mahajan and S. Kumar, Sens. Actuators, B, 2018, 270, 552–561 CrossRef CAS.
- N. Tripathi, S. Sandhu, P. Singh, A. Mahajan, M. Kaur and S. Kumar, Sens. Actuators, B, 2016, 231, 79–87 CrossRef CAS.
- P. Sabari and M. Ravikanth, J. Chem. Sci., 2021, 133, 59–67 CrossRef CAS.
- M. Sahu, A. K. Manna and G. K. Patra, Inorg. Chim. Acta, 2021, 517, 120199 CrossRef CAS.
- X. Liu, X. Peng, F. Xu, L. Wang and M. Liu, Russ. J. Gen. Chem., 2021, 91, 1093–1098 CrossRef CAS.
- S. D. Pradeep, D. Sebastian, A. K. Gopalakrishnan, D. K. Manoharan, D. T. Madhusudhanan and P. V. Mohanan, J. Fluoresc., 2021, 31, 1113–1123 CrossRef CAS PubMed.
- Y. Xing, Z. Liu, B. Li, L. Li, X. Yang and G. Zhang, Sens. Actuators, B, 2021, 347, 130497 CrossRef CAS.
- M. Liu, H. Yang, D. Li, Q. Yao, H. Wang, Z. Zhang and J. Dou, Inorg. Chim. Acta, 2021, 522, 120384 CrossRef CAS.
- C. Pan, K. Wang, S. Ji, H. Wang, Z. Li, H. He, Y. Huo and Y. Huo, RSC Adv., 2017, 7, 36007–36014 RSC.
- J. Harathi and K. Thenmozhi, Mater. Chem. Front, 2020, 4, 1471–1482 RSC.
- C. Chen, P. Hung, C. Wan and A. Wu, Inorg. Chem. Commun., 2013, 38, 74–77 CrossRef CAS.
- X. Feng, Y. Li, X. He, H. Liu, Z. Zhao, R. T. K. Kwok, M. R. J. Elsegood, J. W. Y. Lam and B. Z. Tang, Adv. Funct. Mater., 2018, 28, 1802833 CrossRef.
- A. Mukherjee and M. Chakravarty, New J. Chem., 2020, 44, 6173–6181 RSC.
- V. Kachwal, P. Alam, H. R. Yadav, S. S. Pasha, A. R. Choudhury and I. R. Laskar, New J. Chem., 2018, 42, 1133–1140 RSC.
- N. Chakraborty, A. Chakraborty and S. Das, J. Lumin., 2018, 199, 302–309 CrossRef CAS.
- J. Xiong, Z. Li, J. Tan, S. Ji, J. Sun, X. Li and Y. Huo, Analyst, 2018, 143, 4870–4886 RSC.
- M. Shyamal, S. Maity, A. Maity, R. Maity, S. Roy and A. Misra, Sens. Actuators, B, 2018, 263, 347–359 CrossRef CAS.
- W. Chen, H. Xu, L. Ju and H. Lu, Tetrahedron, 2021, 88, 132123 CrossRef CAS.
- J. Qin, T. Li, B. Wang, Z. Yang and L. Fan, Synth. Met., 2014, 195, 141–146 CrossRef CAS.
- R. Azadbakht and S. Rashidi, Spectrochim. Acta, Part A, 2014, 127, 329–334 CrossRef CAS PubMed.
- R. Bhaskar and S. Sarveswari, ChemistrySelect, 2020, 5, 4050–4057 CrossRef CAS.
- A. Kumar, S. Mondal, K. S. Kayshap, S. K. Hira, P. P. Manna, W. Dehaend and S. Dey, New J. Chem., 2018, 42, 10983–10988 RSC.
- Y. Wang, X. Hao, L. Liang, L. Gao, X. Ren, Y. Wu and H. Zhao, RSC Adv., 2020, 10, 6109–6113 RSC.
- Y. Wang, H. Wu, W. Wu, S. Li, Z. Xu, Z. Xu, Y. Fan, X. Zhao and B. Liu, Sens. Actuators, B, 2018, 260, 106–115 CrossRef CAS.
- D. Aydin, S. Dinckan, S. Nihan, K. Elmas, T. Savran, F. N. Arslan and I. Yilmaz, Food Chem., 2021, 337, 127659 CrossRef CAS PubMed.
- O. Alici and D. Aydin, J. Photochem. Photobiol., A, 2021, 404, 112876 CrossRef CAS.
- H. Yu, J. Zhi, Z. Chang, T. Shen, W. Ding, X. Zhang and J. Wang, Mater. Chem. Front., 2019, 3, 151–160 RSC.
- Y. Yang, C. Gao, N. Zhang and D. Dong, Sens. Actuators, B, 2016, 222, 741–746 CrossRef CAS.
- H. Fang, G. Cai, Y. Hu and J. Zhang, Chem. Commun., 2018, 54, 3045–3048 RSC.
- H. Yao, J. Wang, Q. Zhou, X.-W. Guan, Y.-Q. Fan, Y.-M. Zhang, T.-B. Wei and Q. Lin, Soft Matter, 2018, 14, 8390–8394 RSC.
- A. C. Sedgwick, L. Wu, H. H. Han, S. D. Bull, X. P. He, T. D. James, J. L. Sessler, B. Z. Tang, H. Tian and J. Yoon, Chem. Soc. Rev., 2018, 47, 8842–8880 RSC.
- J. Zhao, S. Ji, Y. Chen, H. Guo and P. Yang, Phys. Chem. Chem. Phys., 2012, 14, 8803–8817 RSC.
- S. Gupta and M. D. Milton, New J. Chem., 2018, 42, 2838–2849 RSC.
- V. Kachwal, I. S. V. Krishna, L. Fageria, J. Chaudhary, R. K. Roy, R. Chowdhury and I. R. Laskar, Analyst, 2018, 143, 3741–3748 RSC.
- Q. Yu, X. Zhang, S.-T. Wu, H. Chen, Q.-L. Zhang, H. Xu, Y.-L. Huang, B.-X. Zhu and X.-L. Ni, Chem. Commun., 2020, 56, 2304–2307 RSC.
- S. Sharma, S. Virk, P. Pradeep and A. Dhir, Eur. J. Inorg. Chem., 2017, 2457–2463 CrossRef CAS.
- A. Sen Gupta, K. Paul and V. Luxami, Sens. Actuators, B, 2017, 246, 653–661 CrossRef CAS.
- Y. Jia and J. Li, Chem. Rev., 2015, 115, 1597–1621 CrossRef CAS PubMed.
- F. Faridbod, M. R. Ganjali, R. Dinarvand, P. Norouzi and S. Riahi, Sensors, 2008, 8, 1645–1703 CrossRef CAS PubMed.
- A. Q. Alorabi, M. Abdelbaset and S. A. Zabin, Chemosensors, 2020, 8, 1 CrossRef CAS.
- M. J. Reimann, D. R. Salmon, J. T. Horton, E. C. Gier and L. R. Jefferies, ACS Omega, 2019, 4, 2874–2882 CrossRef CAS PubMed.
- A. Singh and P. Barman, Top. Curr. Chem., 2021, 379, 29 CrossRef CAS PubMed.
- W. Liping, J. Shibo, Z. Weifeng, L. I. U. Yunqi and Y. Gui, Chinese Sci. Bull., 2013, 58, 2733–2740 CrossRef.
- İ. Sıdır, Y. G. Sıdır, H. Berber and F. Demiray, J. Mol. Struct., 2019, 1176, 31–46 CrossRef.
- P. H. A. Nayak, H. S. B. Naik, H. B. Teja, B. R. Kirthan, R. Viswanath, P. H. A. Nayak, H. S. B. Naik, H. B. Teja, B. R. Kirthan and R. Viswanath, Mol. Cryst. Liq. Cryst., 2021, 1–7 Search PubMed.
- A. Sakthivel, K. Jeyasubramanian, B. Thangagiri and J. D. Raja, J. Mol. Struct., 2020, 1222, 128885 CrossRef CAS.
- S. K. Patil and D. Das, ChemistrySelect, 2017, 2, 6178–6186 CrossRef CAS.
- M. T. Kaczmarek, M. Zabiszak, M. Nowak and R. Jastrzab, Coord. Chem. Rev., 2018, 370, 42–54 CrossRef CAS.
- D. Udhayakumari and V. Inbaraj, J. Fluoresc., 2020, 30, 1203–1223 CrossRef CAS PubMed.
- S. Shekhar, A. M. Khan, S. Sharma, B. Sharma and A. Sarkar, Emergent Mater., 2021 DOI:10.1007/s42247-021-00234-1.
- M. Kaur, S. Kumar, M Yusuf, J. Lee, R. J. C. Brown, K.-H. Kim and A. K. Malika, Coord. Chem. Rev., 2021, 449, 214214 CrossRef CAS.
- H. Wan, Q. Xu, P. Gu, H. Li, D. Chen, N. Li, J. He and J. Lu, J. Hazard. Mater., 2021, 403, 123656 CrossRef CAS PubMed.
- C. C. Vidyasagar, B. M. Muñoz Flores, V. M. Jiménez-Pérez and P. M. Gurubasavaraj, Mater. Today Chem., 2019, 11, 133–155 CrossRef CAS.
- C. Immanuel David, G. Prabakaran and R. Nandhakumar, Microchem. J., 2021, 169, 106590 CrossRef CAS.
- W.-N. Wu, P.-D. Mao, Y. Wang, X.-J. Mao, Z.-Q. Xu, Z.-H. Xu, X.-L. Zhao, Y.-C. Fan and X.-F. Hou, Sens. Actuators, B, 2018, 258, 393–401 CrossRef CAS.
- P. Singh, H. Singh, V. Vanita and R. Sharma, ChemistrySelect, 2016, 1, 6880–6887 CrossRef CAS.
- W. Dong, S. F. Akogun, Y. Zhang, Y. Sun and X. Dong, Sens. Actuators, B, 2017, 238, 723–734 CrossRef CAS.
- K. Rout, A. K. Manna, M. Sahu, J. Mondal, S. K. Singh and G. K. Patra, RSC Adv., 2019, 9, 25919–25931 RSC.
- M. Pannipara, A. G. Al-Sehemi, A. Kalam, A. M Asiri and M. N. Arshad, Spectrochim. Acta, Part A, 2017, 183, 84–89 CrossRef CAS PubMed.
- S. Bhardwaj, N. Maurya and A. K. Singh, Sens. Actuators, B, 2018, 260, 753–762 CrossRef CAS.
- J. Yang, J. Chai, B. Yang and B. Liu, Spectrochim. Acta, Part A, 2019, 211, 272–279 CrossRef CAS PubMed.
- P. Puri, G. Kumar, K. Paul and V. Luxami, New J. Chem., 2018, 42, 18550–18558 RSC.
- A. Abbasi and M. Shakir, New J. Chem., 2018, 42, 293–300 RSC.
- T. Hu, L. Wang, J. Li, Y. Zhao, J. Cheng, W. Li, Z. Chang and C. Sun, Inorg. Chim. Acta, 2021, 524, 120421 CrossRef CAS.
- G. Wang, J. Qin, L. Fan, C. Li and Z. Yang, J. Photochem. Photobiol., A, 2016, 314, 29–34 CrossRef CAS.
- S. M. Saleh and R. F. M. Elshaarawy, RSC Adv., 2016, 6, 68709–68718 RSC.
- H. Wang, X. Xu, J. Yin, Z. Zhang and L. Xue, ChemistrySelect, 2021, 6, 1–7 CrossRef.
- Y.-J. Chang, S.-S. Wu, C.-H. Hu, C. Cho, M. X. Kao and A.-T. Wu, Inorg. Chim. Acta, 2015, 432, 25–31 CrossRef CAS.
- S. M. Hossain, K. Singh, A. Lakma, R. N. Pradhan and A. K. Singh, Sens. Actuators, B, 2017, 239, 1109–1117 CrossRef CAS.
- C. Li, J. Qin, B. Wang, L. Fan, J. Yan and Z. Yang, J. Fluoresc., 2016, 26, 345–353 CrossRef CAS PubMed.
- C. Li, J. Qin, G. Wang, B. Wang, A. Fu and Z. Yang, Inorg. Chim. Acta, 2015, 430, 91–95 CrossRef CAS.
- C. Liu, Z. Yang, L. Fan, X. Jin, J. An, X. Cheng and B. Wang, J. Lumin., 2013, 158, 172–175 CrossRef.
- L. Liu and Z. Yang, Inorg. Chim. Acta, 2018, 469, 588–592 CrossRef CAS.
- J. Qin and Z. Yang, J. Photochem. Photobiol., A, 2015, 303–304, 99–104 CrossRef CAS.
- J.-C. Qin, X. Cheng, K. Yu, R. Fang, M. Wang and Z. Yang, Anal. Methods, 2015, 7, 6799–6803 RSC.
- W. Ruo, J. Guang-qi and L. Xiao-hong, Inorg. Chim. Acta, 2017, 455, 247–253 CrossRef.
- S. K. Shoora, A. K. Jain and V. K. Gupta, Sens. Actuators, B, 2015, 216, 86–104 CrossRef.
- S. J. Zhang, H. Li, C. L. Gong, Z. J. Wang, Z. Y. Wu and F. Wang, Synth. Met., 2016, 217, 37–42 CrossRef CAS.
- M. Kumar, A. Kumar, S. Kishor, S. Kumar, N. Manav, A. K. Bhagi, S. Kumar and R. P. John, J. Mol. Struct., 2022, 1247, 131257 CrossRef CAS.
- M. Wang, L. Lu, W. Song, X. Wang, T. Sun, J. Zhu and J. Wang, J. Lumin., 2021, 233, 117911 CrossRef CAS.
- F. Kolcu, D. Erdener and İ. Kaya, Synth. Met., 2021, 272, 116668 CrossRef CAS.
- G. B. Chalmardi, M. Tajbakhsh, A. Bekhradnia and R. Hosseinzadeh, Inorg. Chim. Acta, 2017, 462, 241–248 CrossRef CAS.
- G. Babaei, M. Tajbakhsh, N. Hasani and A. Bekhradnia, Tetrahedron, 2018, 74, 2251–2260 CrossRef.
- Y. He, J. Yin and G. Wang, Chem. Heterocycl. Compd., 2018, 54, 146–152 CrossRef CAS.
- B. Li, D. Zhang and F. Tian, Luminescence, 2017, 32, 1567–1573 CrossRef CAS PubMed.
- S. Santhoshkumar, K. Velmurugan, J. Prabhu, G. Radhakrishnan and R. Nandhakumar, Inorg. Chim. Acta, 2016, 439, 1–7 CrossRef CAS.
- B. Zhao, T. Liu, Y. Fang, L. Wang, B. Song and Q. Deng, Tetrahedron Lett., 2016, 57, 4417–4423 CrossRef CAS.
- J. Zhang, Y. Liu, Q. Fei, H. Shan, F. Chen, Q. Liu, G. Chai, G. Feng and Y. Huan, Sens. Actuators, B, 2017, 239, 203–210 CrossRef CAS.
- S. Dalbera, S. Kulovi and S. Dalai, ChemistrySelect, 2018, 3, 6561–6569 CrossRef CAS.
- S. Carlos, M. C. Nunes, L. De Boni, G. S. Machado and F. S. Nunes, J. Photochem. Photobiol., A, 2017, 348, 41–46 CrossRef.
- Y. Fu, C. Fan, G. Liu and S. Pu, Sens. Actuators, B, 2017, 239, 295–303 CrossRef CAS.
- J. Kumar, P. K. Bhattacharyya and D. Kumar, Spectrochim. Acta, Part A, 2015, 138, 99–104 CrossRef CAS PubMed.
- F. N. Moghadam, M. Amirnasr, S. Meghdadi, K. Eskandari, A. Buchholz and W. Plass, Spectrochim. Acta, Part A, 2019, 207, 6–15 CrossRef PubMed.
- P. Torawane, S. K. Sahoo, A. Borse and A. Kuwar, Luminescence, 2017, 32, 1426–1430 CrossRef CAS PubMed.
- X. Wang, T. Xu and H. Duan, Sens. Actuators, B, 2015, 214, 138–143 CrossRef CAS.
- J. Yin, Q. Bing, L. Wang and G. Wang, Spectrochim. Acta, Part A, 2018, 189, 495–501 CrossRef CAS PubMed.
- M. Gao, C. Xing, X. Jiang, L. Xu, P. Li and C. Der Hsiao, Luminescence, 2021, 36, 951–957 CrossRef CAS PubMed.
- J. Zhu, Y. Zhang, Y. Chen, T. Sun, Y. Tang, Y. Huang, Q. Yang, D. Ma, Y. Wang and M. Wang, Tetrahedron Lett., 2017, 58, 365–370 CrossRef CAS.
- M. Kumar, A. Kumar, M. K. Singh, S. K. Sahu and R. P. John, Sens. Actuators, B, 2017, 241, 1218–1223 CrossRef CAS.
- C. Liu, Q. Zhou, Y. Li, L. V. Garner, S. P. Watkins, L. J. Carter, J. Smoot, A. C. Gregg, A. D. Daniels, S. Jervey and D. Albaiu, ACS Cent. Sci., 2020, 6, 315–331 CrossRef CAS PubMed.
- J. Yan, L. Fan, J. Qin, C. Li and Z. Yang, Tetrahedron Lett., 2016, 57, 2910–2914 CrossRef CAS.
- S. O. Tümay, ChemistrySelect, 2021, 6, 10561–10572 CrossRef.
- F. Lei, W. Shi, J. Ma, Y. Chen, F. Kui, Y. Hui and Z. Xie, Sens. Actuators, B, 2016, 237, 563–569 CrossRef.
- D. Singhal, N. Gupta and A. K. Singh, RSC Adv., 2015, 5, 65731–65738 RSC.
- Q. Su, Q. Niu, T. Sun and T. Li, Tetrahedron Lett., 2016, 57, 4297–4301 CrossRef CAS.
- V. Tekuri, S. K. Sahoo and D. R. Trivedi, Spectrochim. Acta, Part A, 2019, 218, 19–26 CrossRef CAS PubMed.
- X. Wan, H. Ke, J. Tang and G. Yang, Talanta, 2019, 199, 8–13 CrossRef CAS PubMed.
- D. Mohanasundaram, R. Bhaskar, G. Gangatharan, V. Kumar, J. Rajesh and G. Rajagopal, Microchem. J., 2021, 164, 106030 CrossRef CAS.
- H. H. Hammud, S. El, G. Sonji, N. Sonji and K. H. Bouhadir, Spectrochim. Acta, Part A, 2015, 150, 94–103 CrossRef CAS PubMed.
- M. Saleem, C. H. Khang and K. H. Lee, J. Fluoresc., 2016, 26, 11–22 CrossRef CAS PubMed.
- Y. Sie, C. Wan and A. Wu, RSC Adv., 2017, 7, 2460–2465 RSC.
- T. Simon, M. Shellaiah, V. Srinivasadesikan, C.-C. Lin, F.-H. Ko, K. W. Sun and M.-C. Lin, Sens. Actuators, B, 2016, 231, 18–29 CrossRef CAS.
- X. Tang, J. Han, Y. Wang, L. Ni, X. Bao, L. Wang and W. Zhang, Spectrochim. Acta, Part A, 2017, 173, 721–726 CrossRef CAS PubMed.
- S. Zhang, X. Wu, Q. Niu, Z. Guo and T. Li, J. Fluoresc., 2017, 27, 729–737 CrossRef CAS PubMed.
- X. Zhu, Y. Duan, P. Li, H. Fan, T. Han and X. Huang, Anal. Methods, 2019, 11, 642–647 RSC.
- J. Xue, L. Tian and Z. Yang, J. Photochem. Photobiol., A, 2019, 369, 77–84 CrossRef CAS.
- S. Y. Lee, K. H. Bok, T. G. Jo, S. Y. Kim and C. Kim, Inorg. Chim. Acta, 2017, 461, 127–135 CrossRef CAS.
- Y. Dong, R. Fan, W. Chen, P. Wang and Y. Yang, Dalton Trans., 2017, 46, 6769–6775 RSC.
- M. Tajbakhsh, G. B. Chalmardi, A. Bekhradnia, R. Hosseinzadeh, N. Hasani and M. A. Amiri, Spectrochim. Acta, Part A, 2018, 189, 22–31 CrossRef CAS PubMed.
- S. Zhang, Q. Niu, L. Lan and T. Li, Sens. Actuators, B, 2017, 240, 793–800 CrossRef CAS.
- W. Zhu, L. Yang, M. Fang, Z. Wu, Q. Zhang and F. Yin, J. Lumin., 2015, 158, 38–43 CrossRef CAS.
- J. Fu, B. Li, H. Mei, Y. Chang and K. Xu, Spectrochim. Acta, Part A, 2020, 227, 117678 CrossRef CAS PubMed.
- A. Gomathi, P. Viswanathamurthi and K. Natarajan, J. Photochem. Photobiol., A, 2019, 370, 75–83 CrossRef.
- J. Qiu, S. Jiang, B. Lin, H. Guo and F. Yang, Dyes Pigm., 2019, 170, 107590 CrossRef CAS.
- Y. Xu, H. Wang, J. Zhao, X. Yang, M. Pei, G. Zhang, Y. Zhang and L. Lin, J. Photochem. Photobiol., A, 2019, 383, 112026 CrossRef CAS.
- Z.-G. Wang, X.-J. Ding, Y.-Y. Huang, X.-J. Yan, B. Ding, Q.-Z. Li, C.-Z. Xie and J.-Y. Xu, Dyes Pigm., 2020, 175, 108156 CrossRef CAS.
- C. Patra, C. Sen, A. Das Mahapatra, D. Chattopadhyay, A. Mahapatra and C. Sinha, J. Photochem. Photobiol., A, 2017, 341, 97–107 CrossRef CAS.
- R. Mehta, P. Kaur, D. Choudhury, K. Paul and V. Luxami, J. Photochem. Photobiol., A, 2019, 380, 111851 CrossRef CAS.
- I. Kaur, P. Kaur and K. Singh, Sens. Actuators, B, 2018, 257, 1083–1092 CrossRef CAS.
- S. K. Sheet, B. Sen, R. Thounaojam, K. Aguan and S. Khatua, J. Photochem. Photobiol., A, 2017, 332, 101–111 CrossRef CAS.
- Y. Mu, C. Zhang, Z. Gao, X. Zhang, Q. Lu, J. Yao and S. Xing, Synth. Met., 2020, 262, 116334 CrossRef CAS.
- Z. Salarvand, M. Amirnasr and S. Meghdadi, J. Lumin., 2019, 207, 78–84 CrossRef CAS.
- A. Saravanan, G. Subashini, S. Shyamsivappan, T. Suresh, K. Kadirvelu, N. Bhuvanesh, R. Nandhakumar and P. S. Mohan, J. Photochem. Photobiol., A, 2018, 364, 424–432 CrossRef.
- A. K. Bhanja, C. Patra, S. Mondal, D. Ojha, D. Chattopadhyay and C. Sinha, RSC Adv., 2015, 5, 48997–49005 RSC.
- X. Chen, W. Sun, Y. Bai, F. Zhang, J. Zhao and X. Ding, Spectrochim. Acta, Part A, 2018, 191, 566–572 CrossRef CAS PubMed.
- S. Feng, Q. Gao, X. Gao, J. Yin and Y. Jiao, Inorg. Chem. Commun., 2019, 102, 51–56 CrossRef CAS.
- L. Hu, H. Wang, B. Fang, Z. Hu, Q. Zhang, X. Tian, H. Zhou, J. Wu and Y. Tian, Sens. Actuators, B, 2017, 251, 993–1000 CrossRef CAS.
- Y. Huang, F. Wang, S. Mu, X. Sun, Q. Li, C. Xie and H. Liu, Spectrochim. Acta, Part A, 2020, 243, 118754 CrossRef CAS PubMed.
- Y. Jiao, X. Liu, L. Zhou, H. He, P. Zhou and C. Duan, Sens. Actuators, B, 2017, 247, 950–956 CrossRef CAS.
- Z. Li, H. Su, K. Zhou, B. Yang, T. Xiao, X. Sun, J. Jiang and L. Wang, Dyes Pigm., 2018, 149, 921–926 CrossRef CAS.
- B. Liu, P. Wang, J. Chai, X. Hu, T. Gao, J. Chao, T. Chen and B. Yang, Spectrochim. Acta, Part A, 2016, 168, 98–103 CrossRef CAS PubMed.
- B. Naskar, R. Modak, Y. Sikdar, D. K. Maiti, A. Bauzá, A. Frontera, A. Katarkar, K. Chaudhuri and S. Goswami, Sens. Actuators, B, 2017, 239, 1194–1204 CrossRef CAS.
- C. Patra, A. K. Bhanja, C. Sen, D. Ojha, D. Chattopadhyay, A. Mahapatra and C. Sinha, Sens. Actuators, B, 2016, 228, 287–294 CrossRef CAS.
- M. Shellaiah, Y. C. Rajan, P. Balu and A. Murugan, New J. Chem., 2015, 39, 2523–2531 RSC.
- T. Simon, M. Shellaiah, V. Srinivasadesikan, C.-C. Lin, F.-H. Ko, K. W. Sun and M.-C. Lin, New J. Chem., 2016, 40, 6101–6108 RSC.
- J. Tian, X. Yan, H. Yang and F. Tian, RSC Adv., 2015, 5, 107012–107019 RSC.
- H. Tian, X. Qiao, Z. Zhang, C. Xie, Q. Li and J. Xu, Spectrochim. Acta, Part A, 2019, 207, 31–38 CrossRef CAS PubMed.
- E. Wang, L. Pang, Y. Zhou, J. Zhang, F. Yu, H. Qiao and X. Pang, Biosens. Bioelectron., 2016, 77, 812–817 CrossRef CAS PubMed.
- F.-Ur-Rahman, A. Ali, R. Guo, J. Tian, H. Wang, Z.-T. Li and D.-W. Zhang, Sens. Actuators, B, 2015, 211, 544–550 CrossRef.
- Y. Yang, S. Ma, Y. Zhang, J. Ru, X. Liu and H. Guo, Spectrochim. Acta, Part A, 2018, 199, 202–208 CrossRef CAS PubMed.
- J. Zhu, L. Lu, M. Wang, T. Sun, Y. Huang, C. Wang, W. Bao, M. Wang, F. Zou and Y. Tang, Tetrahedron Lett., 2020, 61, 151893 CrossRef CAS.
- L. Subha, C. Balakrishnan, S. Natarajan, M. Theetharappan, B. Subramanian and M. A. Neelakantan, Spectrochim. Acta, Part A, 2016, 153, 249–256 CrossRef CAS PubMed.
- B. K. Kundu, P. Mandal, B. G. Mukhopadhyay, R. Tiwari, D. Nayak, R. Ganguly and S. Mukhopadhyay, Sens. Actuators, B, 2019, 282, 347–358 CrossRef CAS.
- A. Ghorai, J. Mondal, R. Saha, S. Bhattacharya and G. K. Patra, Anal. Methods, 2016, 8, 2032–2040 RSC.
- J. Kumar, M. J. Sarma, P. Phukan and D. K. Das, Dalton Trans., 2015, 44, 4576–4581 RSC.
- A. Ghorai, J. Mondal, R. Chandra and G. K. Patra, Dalton Trans., 2015, 44, 13261–13271 RSC.
- M. Liu, H. Yang, D. Li, Q. Yao, H. Wang, Z. Zhang and J. Dou, Inorg. Chim. Acta, 2021, 522, 120384 CrossRef CAS.
- C. Liu, X. Liu, X. Ge, Q. Wang, L. Zhang, W. Shang, Y. Zhang, X. A. Yuan, L. Tian, Z. Liu and J. You, Dalton Trans., 2020, 49, 5988–5998 RSC.
- N. H. Kim, J. Lee, S. Park, J. Jung and D. Kim, Sensors, 2019, 19, 2500 CrossRef CAS PubMed.
- K. S. M. Salih, A. M. Shraim, S. R. Al-Mhini, R. E. Al-Soufi and I. Warad, Emergent Mater., 2021, 4, 423–434 CrossRef CAS.
- S. Xue, Z. Xie, Y. Wen, J. He, Y. Liu and W. Shi, ChemistrySelect, 2021, 6, 7123–7129 CrossRef CAS.
- H. Peng, Y. Han, N. Lin and H. Liu, Opt. Mater., 2019, 95, 109210 CrossRef CAS.
- Z. Guo, Q. Niu, T. Li, T. Sun and H. Chi, Spectrochim. Acta, Part A, 2019, 213, 97–103 CrossRef CAS PubMed.
- L. Kang, Y.-T. Liu, N.-N. Li, Q.-X. Dang, Z.-Y. Xing, J.-L. Li and Y. Zhang, J. Lumin., 2017, 186, 48–52 CrossRef CAS.
- M. Kao, T. Chen, Y. Cai, C. Hu, Y. Liu, Y. Jhong and A. Wu, J. Lumin., 2016, 169, 156–160 CrossRef CAS.
- X. Zhang, L. Shen, Q. Zhang, X. Yang, Y. Huang, C. Redshaw and H. Xu, Molecules, 2021, 26, 1233 CrossRef CAS PubMed.
- H. Peng, K. Shen, S. Mao, X. Shi, Y. Xu, S. O. Aderinto and H. Wu, J. Fluoresc., 2017, 27, 1191–1200 CrossRef CAS PubMed.
- K. Shen, S. Mao, X. Shi, F. Wang, Y. Xu, S. O. Aderinto and H. Wu, Luminescence, 2018, 33, 54–63 CrossRef CAS PubMed.
- J. Zhu, Y. Zhang, L. Wang, T. Sun, M. Wang, Y. Wang, D. Ma, Q. Yang and Y. Tang, Tetrahedron Lett., 2016, 57, 3535–3539 CrossRef CAS.
- H. Sun, Y. Jiang, J. Nie, J. Wei, B. Miao, Y. Zhao, L. Zhang and Z. Ni, Mater. Chem. Front., 2021, 5, 347–354 RSC.
- H. Sun, J. Li, F. Han, R. Zhang, Y. Zhao, B. Miao and Z. Ni, Dyes Pigm., 2019, 167, 143–150 CrossRef CAS.
- X. Yang, W. Zhang, Z. Yi, H. Xu, J. Wei and L. Hao, New J. Chem., 2017, 41, 11079–11088 RSC.
- M. Yang, Y. Zhang, W. Zhu, H. Wang, J. Huang, L. Cheng, H. Zhou, J. Wu and Y. Tia, J. Mater. Chem. C, 2015, 3, 1994–2002 RSC.
- K. Muthamma, D. Sunil, P. Shetty, S. D. Kulkarni, P. J. Anand and D. Kekuda, Prog. Org. Coat., 2021, 161, 106463 CrossRef CAS.
- N. K. Gondia and S. K. Sharma, Mater. Chem. Phys., 2019, 224, 314–319 CrossRef CAS.
- V. Nishal, D. Singh, R. K. Saini, V. Tanwar, S. Kadyan, R. Srivastava and P. S. Kadyan, Cogent Chem., 2015, 1, 1079291 CrossRef.
- A. N. Gusev, M. A. Kiskin, E. V. Braga, M. Chapran, G. Wiosna-Salyga, G. V. Baryshnikov, V. A. Minaeva, B. F. Minaev, K. Ivaniuk, P. Stakhira, H. Ågren and W. Linert, J. Phys. Chem. C, 2019, 123, 11850–11859 CrossRef CAS.
- B. Das, A. Jana, A. Das, D. Chattopadhyay, A. Dhara, S. Mabhai and S. Dey, Spectrochim. Acta, Part A, 2019, 212, 222–231 CrossRef CAS PubMed.
- D. K. Das, J. Kumar, A. Bhowmick, P. K. Bhattacharyya and S. Banu, Inorg. Chim. Acta, 2017, 462, 167–173 CrossRef CAS.
- V. K. Gupta, A. K. Jain and S. K. Shoora, Sens. Actuators, B, 2015, 219, 218–231 CrossRef CAS.
- B. Naskar, R. Modak, Y. Sikdar, D. K. Maiti, A. Banik, T. K. Dangar, S. Mukhopadhyay, D. Mandal and S. Goswami, J. Photochem. Photobiol., A, 2016, 321, 99–109 CrossRef CAS.
- R. Purkait, S. Dey and C. Sinhaa, New J. Chem., 2018, 42, 16653–16665 RSC.
- G. G. V. Kumar, M. P. Kesavan, M. Sankarganesh, K. Sakthipandi, J. Rajesh and G. Sivaraman, New J. Chem., 2018, 42, 2865–2873 RSC.
- D. Jothi, S. K. Munusamy, S. Sawminathana and S. K. Iyer, RSC Adv., 2021, 11, 11338–11346 RSC.
- Q. Lin, X. Jiang, X. Ma, J. Liu, H. Yao, Y. Zhang and T. Wei, Sens. Actuators, B, 2018, 272, 139–145 CrossRef CAS.
- X. Ma, Z. Zhang, H. Xie, Y. Ma, C. Liu, S. Liu and M. Liu, Chem. Commun., 2018, 54, 13674–13677 RSC.
- S. K. Panigrahi and A. K. Mishra, J. Photochem. Photobiol., A, 2019, 41, 100318 CrossRef.
- H. Rubin, Arch. Biochem. Biophys., 2007, 458, 16–23 CrossRef CAS PubMed.
- R. Y. Walder, B. Yang, J. B. Stokes, P. A. Kirby, X. Cao, P. Shi, C. C. Searby, R. F. Husted and V. C. Sheffield, Hum. Mol. Genet., 2009, 18, 4367–4375 CrossRef CAS PubMed.
- M. Piskacek, L. Zotova, G. Zsurka and R. J. Schweyen, J. Cell. Mol. Med., 2009, 13, 693–700 CrossRef PubMed.
- J. Tfelt-Hansen and E. M. Brown, Crit. Rev. Clin. Lab. Sci., 2005, 42, 35–70 CrossRef CAS PubMed.
- S. Minisola, J. Pepe, S. Piemonte and C. Cipriani, BMJ, 2015, 350, 2723 CrossRef PubMed.
- J. Fong and A. Khan, Can. Fam. Phys., 2012, 58, 158–62 Search PubMed.
- Y. Wang, Z. Y. Ma, D. L. Zhang, J. L. Deng, X. Chen, C. Z. Xie, X. Qiao, Q. Z. Li and J. Y. Xu, Spectrochim. Acta, Part A, 2018, 195, 157–164 CrossRef CAS PubMed.
- H. Wang, X. Xu, J. Yin, Z. Zhang and L. Xue, ChemistrySelect, 2021, 6, 6454–6459 CrossRef CAS.
- L. Fan, J. C. Qin, C. R. Li and Z. Y. Yang, Spectrochim. Acta, Part A, 2019, 218, 342–347 CrossRef CAS PubMed.
- L. Bai, F. Tao, L. Li, A. Deng, C. Yan, G. Li and L. Wang, Spectrochim. Acta, Part A, 2019, 214, 436–444 CrossRef CAS PubMed.
- W. Anbu Durai, A. Ramu and A. Dhakshinamoorthy, Inorg. Chem. Commun., 2020, 121, 108191 CrossRef CAS.
- L. Bai, G. Li, L. Li, M. Gao, H. Li, F. Tao, A. Deng, S. Wang and L. Wang, React. Funct. Polym., 2019, 139, 1–8 CrossRef CAS.
- L. Tomljenovic, J. Alzheimer's Dis., 2011, 23, 567–598 CAS.
- A. Schiff-base, A. Iii, L. Fan, J. Qin, T. Li, Z. Yang, L. Fan, J. Qin, T. Li, B. Wang and Z. Yang, J. Lumin., 2014, 155, 84–88 CrossRef.
- K. S. Patil, P. G. Mahajan and S. R. Patil, Spectrochim. Acta, Part A, 2017, 170, 131–137 CrossRef CAS PubMed.
- C. R. Silva, M. B. N. Oliveira, S. F. Melo, F. J. S. Dantas, J. C. P. De Mattos, R. J. A. C. Bezerra, A. Caldeira-De-Araujo, A. Duatti and M. Bernardo-Filho, Brain Res. Bull., 2002, 59, 213–216 CrossRef CAS PubMed.
- R. Mcrae, P. Bagchi, S. Sumalekshmy and C. J. Fahrni, Chem. Rev., 2009, 109, 4780–4827 CrossRef CAS PubMed.
- Y. S. Yang, C. Liang, C. Yang, Y. P. Zhang, B. X. Wang and J. Liu, Spectrochim. Acta, Part A, 2020, 237, 118391 CrossRef CAS PubMed.
- G. Singh, J. Sindhu, Manisha, V. Kumar, V. Sharma, S. K. Sharma, S. K. Mehta, M. H. Mahnashi, A. Umar and R. Kataria, J. Mol. Liq., 2019, 296, 111814 CrossRef CAS.
- R. Kouser, S. Zehra, R. A. Khan, A. Alsalme, F. Arjmand and S. Tabassum, Spectrochim. Acta, Part A, 2021, 247, 119156 CrossRef CAS PubMed.
- L. Dong, X. Zeng, L. Mu, S. Xue, Z. Tao and J. Zhang, Sens. Actuators, B, 2010, 145, 433–437 CrossRef CAS.
- H. Chen, F. Yuan, J. Xu, Y. Zhang, Y. Wu and L. Wang, Spectrochim. Acta, Part A, 2013, 107, 151–155 CrossRef CAS PubMed.
- L. Wang, L. Yang and D. Cao, J. Fluoresc., 2014, 24, 1347–1355 CrossRef CAS PubMed.
- W. Bian, J. Ma, Q. Liu, Y. Wei, Y. Li, C. Dong and S. Shuang, Luminescence, 2014, 29, 151–157 CrossRef CAS PubMed.
- S. Ramezani, M. Pordel and A. Davoodnia, Inorg. Chim. Acta, 2019, 484, 450–456 CrossRef CAS.
- P. Aussawaponpaisan, P. Nusuwan, P. Tongraung, P. Jittangprasert, K. Pumsa-Ard and M. Kuno, Mater. Today Proc., 2017, 4, 6022–6030 CrossRef.
- D. Vashisht, S. Sharma, R. Kumar, V. Saini, V. Saini, A. Ibhadon, S. C. Sahoo, S. Sharma, S. K. Mehta and R. Kataria, Microchem. J., 2020, 155, 104705 CrossRef CAS.
- X. Zhang, S. T. Wu, X. J. Yang, L. Y. Shen, Y. L. Huang, H. Xu, Q. L. Zhang, T. Sun, C. Redshaw and X. Feng, Inorg. Chem., 2021, 60, 8581–8591 CrossRef CAS PubMed.
- F. Yan, X. Sun, Y. Zhang, Y. Jiang, L. Chen, T. Ma and L. Chen, J. Photochem. Photobiol., A, 2021, 407, 113065 CrossRef CAS.
- S. Wang, K. Cai, Y. Song and Y. Zhu, ChemistrySelect, 2021, 6, 3788–3794 CrossRef CAS.
- W. Pan, X. Yang, Y. Wang, L. Wu, N. Liang and L. Zhao, J. Photochem. Photobiol., A, 2021, 420, 113506 CrossRef CAS.
- A. Goel, N. Tomer, V. D. Ghule and R. Malhotra, Spectrochim. Acta, Part A, 2021, 249, 119221 CrossRef CAS PubMed.
- H. Li, H. Li, Y. Zhu, B. Shi, W. Qu, Y. Zhang, Q. Lin, H. Yao and T. Wei, Supramol. Chem., 2014, 27, 471–477 CrossRef.
- M. Liu, T. Wei, Q. Lin and Y. Zhang, Spectrochim. Acta, Part A, 2011, 79, 1837–1842 CrossRef CAS PubMed.
- L. M. Gaetke, H. S. Chow and C. K. Chow, Arch. Toxicol., 2014, 88, 1929–1938 CrossRef CAS PubMed.
- X. Wang, D. Shi, Y. Xu, S. Yu, F. Zhao, Y. Wang, L. Hu, J. Tian, X. Yu and L. Pu, Tetrahedron Lett., 2018, 59, 2332–2334 CrossRef CAS.
- S. Ullmann, R. Schnorr, M. Handke, C. Laube, B. Abel, J. Matysik, M. Findeisen, R. Rüger, T. Heine and B. Kersting, Chem. – Eur. J., 2017, 23, 3824–3827 CrossRef CAS PubMed.
- S. J. Malthus, S. A. Cameron and S. Brooker, Inorg. Chem., 2018, 57, 2480–2488 CrossRef CAS PubMed.
- K. Rout, A. K. Manna, M. Sahu and G. K. Patra, Inorg. Chim. Acta, 2019, 486, 733–741 CrossRef CAS.
- X. Mu, L. Shi, L. Yan and N. Tang, J. Fluoresc., 2021, 31, 971–979 CrossRef CAS PubMed.
- C. T. Chasapis, A. C. Loutsidou, C. A. Spiliopoulou and M. E. Stefanidou, Arch. Toxicol., 2012, 86, 521–534 CrossRef CAS PubMed.
- C. F. Walker and R. E. Black, Annu. Rev. Nutr., 2004, 24, 255–275 CrossRef CAS PubMed.
- Z. Yang, C. Yan, Y. Chen, C. Zhu, C. Zhang, X. Dong, W. Yang, Z. Guo, Y. Lub and W. He, Dalton Trans., 2011, 40, 2173–2176 RSC.
- M. Hosseini, A. Ghafarlo, M. R. Ganjali, F. Faridbod, P. Norouzi and M. S. Niasari, Sens. Actuators, B, 2014, 198, 411–415 CrossRef CAS.
- J. Afshani, A. Badiei, M. Karimi, N. Lashgari and G. Mohammadi Ziarani, Appl. Organomet. Chem, 2017, 31, 1–12 CrossRef.
- W. Fang, G. Zhang, J. Chen, L. Kong, L. Yang, H. Bi and J. Yang, Sens. Actuators, B, 2016, 229, 338–346 CrossRef CAS.
- G. N. George, R. C. Prince, G. A. Buttigieg, M. B. Denton, H. H. Harris and I. J. Pickering, Chem. Res. Toxicol., 2004, 17, 999–1006 Search PubMed.
- J. Yan, L. Fan, J. C. Qin, C. R. Li and Z. Y. Yang, J. Fluoresc., 2016, 26, 1059–1065 CrossRef CAS PubMed.
- D. Mohanasundaram, R. Bhaskar, G. Gangatharan Vinoth Kumar, J. Rajesh and G. Rajagopal, Microchem. J., 2021, 164, 106030 CrossRef CAS.
- B. X. Shen and Y. Qian, ChemistrySelect, 2017, 2, 2406–2413 CrossRef CAS.
- H. Tokunaga, K. Kazama, M. Tsuboi and M. Miyasaka, Luminescence, 2021, 36, 1561–1568 CrossRef CAS PubMed.
- B. Li, Z. Liu, L. Li, Y. Xing, Y. Liu, X. Yang, M. Pei and G. Zhang, New J. Chem., 2021, 45, 6753–6759 RSC.
- P. S. Hariharan and S. P. Anthony, Spectrochim. Acta, Part A, 2015, 136, 1658–1665 CrossRef CAS PubMed.
- Ö. Şahin, Ü. Ö. Özdemir, N. Seferoğlu, Z. K. Genc, K. Kaya, B. Aydıner, S. Tekin and Z. Seferoğlu, J. Photochem. Photobiol., B, 2018, 178, 428–439 CrossRef PubMed.
- B. Kaur and N. Kaur, J. Coord. Chem., 2019, 72, 2189–2199 CrossRef CAS.
- N. Kaur and B. Kaur, Inorg. Chem. Commun., 2020, 121, 108239 CrossRef CAS.
- C. Li, L. Xiao, Q. Zhang and X. Cheng, Spectrochim. Acta, Part A, 2020, 243, 118763 CrossRef CAS PubMed.
- E. K. İnal, J. Fluoresc., 2020, 30, 891–900 CrossRef PubMed.
- S. Dey, R. Purkait, D. Mallick and C. Sinha, ChemistrySelect, 2020, 5, 8274–8283 CrossRef CAS.
- P. Vijayakumar, E. Dhineshkumar, M. Arockia Doss, S. Nargis Negar and R. Renganathan, Mater. Today Proc., 2020, 42, 1050–1064 CrossRef.
- S. Li, D. Cao, X. Meng, Z. Hu, Z. Li, C. Yuan, T. Zhou, X. Han and W. Ma, J. Photochem. Photobiol., A, 2020, 392, 112427 CrossRef CAS.
- B. Li, X. Gu, M. Wang, X. Liu and K. Xu, Dyes Pigm., 2021, 194, 109637 CrossRef CAS.
- S. A. Khan, Q. Ullah, A. S. A. Almalki, S. Kumar, R. J. Obaid, M. A. Alsharif, S. Y. Alfaifi and A. A. Hashmi, J. Mol. Liq., 2021, 328, 115407 CrossRef CAS.
- H. He, Z. Cheng and L. Zheng, J. Mol. Struct., 2021, 1227, 129522 CrossRef CAS.
- O. A. Urucu and A. Aydin, Anal. Lett., 2015, 48, 1767–1776 CrossRef.
- E. S. Almeida, E. M. Richter and R. A. A. Munoz, Anal. Chim. Acta, 2014, 837, 38–43 CrossRef CAS PubMed.
- M. K. Goshisht, L. Moudgil, M. Rani, P. Khullar, G. Singh, H. Kumar, N. Singh, G. Kaur and M. S. Bakshi, J. Phys. Chem. C, 2014, 118, 28207–28219 CrossRef CAS.
- A. Mahal, M. K. Goshisht, P. Khullar, H. Kumar, N. Singh, G. Kaur and M. S. Bakshi, Phys. Chem. Chem. Phys., 2014, 16, 14257–14270 RSC.
- M. K. Goshisht, Adv. Mater. Proc, 2017, 2, 535–546 Search PubMed.
- P. Khullar, M. K. Goshisht, L. Moudgil, G. Singh, D. Mandial, H. Kumar, G. K. Ahluwalia and M. S. Bakshi, ACS Sustainable Chem. Eng., 2017, 5, 1082–1093 CrossRef CAS.
- M. K. Goshisht, L. Moudgil, P. Khullar, G. Singh, A. Kaura, H. Kumar, G. Kaur and M. S. Bakshi, ACS Sustainable Chem. Eng., 2015, 3, 3175–3187 CrossRef CAS.
- H. Dezhampanah, R. Firouzi, Z. Moradi Shoeili and R. Binazir, J. Mol. Struct., 2020, 1205, 127557 CrossRef CAS.
- M. Cui, Y. Xin, R. Song, Q. Sun, X. Wang and D. Lu, Cellulose, 2020, 27, 1621–1633 CrossRef CAS.
- X. Zeng, X. Zhang, B. Zhu, H. Jia and J. Xue, Analyst, 2011, 136, 4008–4012 RSC.
- Y. Sun, Y. Lu, M. Bian, Z. Yang, X. Ma and W. Liu, Eur. J. Med. Chem., 2021, 211, 113098 CrossRef CAS PubMed.
- S. Hazra, B. G. M. Rocha, A. K. M. Fátima, C. Guedes da Silva and A. J. L. Pombeiro, Inorganics, 2019, 7, 17 CrossRef CAS.
- A. Soroceanu, M. Cazacu, S. Shova, C. Turta, J. Kožíšek, M. Gall, M. Breza, P. Rapta, T. C. O. Mac Leod, J. T. Armando, J. L. Pombeiro, A. A. Dobrov and V. B. Arion, Eur. J. Inorg. Chem., 2013, 1458–1474 CrossRef CAS.
- Y. Wang, Q. Guo, X. Wu, H. Gao, R. Lu and W. Zhou, Spectrochim. Acta, Part A, 2022, 265, 120358 CrossRef CAS PubMed.
- J. J. Celestina, P. Tharmaraj, C. D. Sheela and J. Shakina, J. Lumin., 2021, 239, 118359 CrossRef CAS.
- S. O. Tümay and S. Yeşilot, J. Photochem. Photobiol., A, 2021, 407, 113093 CrossRef.
- D. Aydin, S. Dinckan, S. N. Karuk Elmas, T. Savran, F. N. Arslan and I. Yilmaz, Food Chem., 2021, 337, 127659 CrossRef CAS PubMed.
- Z. Li, X. Zhang, S. Wang, Y. Yang, B. Qin, K. Wang, T. Xie, Y. Wei and Y. Ji, Chem. Sci., 2016, 7, 4741–4747 RSC.
- D. Genovese, A. Aliprandi, E. A. Prasetyanto, M. Mauro, M. Hirtz, H. Fuchs, Y. Fujita, H. Uji-i, S. M. K. Lebedkin and L. De Cola, Adv. Funct. Mater., 2016, 26, 5271–5278 CrossRef CAS.
- C. Ma, B. Xu, G. Xie, J. He, X. Zhou, B. Peng, L. Jiang, B. Xu, W. Tian, Z. Chi, S. Liu, Y. Zhang and J. Xu, Chem. Commun., 2014, 50, 7374–7377 RSC.
- B. Yoon, J. Lee, I. S. Park, S. Jeon, J. Lee and J.-M. Kim, J. Mater. Chem. C, 2013, 1, 2388–2403 RSC.
- L. Peng, Y. Zheng, X. Wang, A. Tong and Y. Xiang, Chem. – Eur. J., 2015, 21, 4326–4332 CrossRef CAS PubMed.
- K. Li, Y. Xiang, X. Wang, J. Li, R. Hu, A. Tong and B. Z. Tang, J. Am. Chem. Soc., 2014, 136, 1643–1649 CrossRef CAS PubMed.
- Y. Jhong, W. H. Hsieh, J. Chir and A. Wu, J. Fluoresc., 2014, 24, 1723–1726 CrossRef CAS PubMed.
- Z. Y. Yin, J. H. Hu, K. Gui, Q. Q. Fu, Y. Yao, F. L. Zhou, L. L. Ma and Z. P. Zhang, J. Photochem. Photobiol., A, 2020, 396, 112542 CrossRef CAS.
| This journal is © The Royal Society of Chemistry 2022 |


