 Open Access Article
Crystal lattice engineering in a screw-dislocated ZnO nanocone photocatalyst by carbon doping†
Jesna
Louis
ab,
Nisha T.
Padmanabhan
ac,
Madambi K.
Jayaraj
d and
Honey
John
 *abe
*abe
aDepartment of Polymer Science and Rubber Technology, Cochin University of Science and Technology, Kerala 682022, India. E-mail: honey@cusat.ac.in
bInter University Centre for nanomaterials and Devices (IUCND), Cochin University of Science and Technology, Kerala 682022, India
cDepartment of Chemistry and Centre for Research, St. Teresa's College, Ernakulam, Kerala 682011, India
dUniversity of Calicut, Malappuram, Kerala 673635, India
eCentre of Excellence in Advanced Materilas (CAM), Cochin University of Science and Technology, Kerala 682022, India
First published on 6th April 2022
Abstract
Screw-dislocated ZnO nanocones exposing a greater percentage of polar {0001} facets are developed by a tailor-made CTAB-assisted hydrothermal process. A possible formation mechanism of ZnO nanocones with step edges exposing high-energy {0001} facets is explained by screw dislocated crystal growth theory. Further, ZnO nanostructures are defect-engineered by the introduction of carbon atoms into their crystal lattice. A facile synthesis route for carbon-doped zinc oxide (C:ZnO) nanostructures is proposed, in which ZnO nanostructures synthesized by a hydrothermal method are subjected to an electrospinning process, followed by calcination, to incorporate carbon as the dopant. Polyvinyl alcohol (PVA) acts as both the dopant-precursor and the spinning agent for the construction of C:ZnO nanostructures. XPS analysis confirms the incorporation of carbon atoms into the oxygen vacancies of the ZnO lattice in C:ZnO nanostructures. The increase in the lattice parameters of ZnO resulting from carbon doping is evidenced by XRD analysis. UV-visible diffuse reflectance spectroscopy (DRS) results revealed improved photogenerated charge separation in C:ZnO by the reduction of bandgap energy as a result of valence band extension to a higher energy region upon carbon-doping. C:ZnO nanostructures showed a markedly higher photocatalytic activity (97%, kinetic rate constant k = 39.57 × 10⁻³ min−1) compared to undoped ZnO nanostructures (51%, k = 13.64 × 10⁻³ min−1) within 90 min visible-light irradiation of methylene blue dye solution. The mechanism of photogenerated charge carrier separation and visible-light photocatalytic pathways in C:ZnO nanostructures was further elucidated. Altogether, this new-fangled simple synthesis approach for crystal lattice engineering in ZnO for enhancing its visible-light photoactivity brings both the material and the methodology well-nigh suitable for various environmental applications.
Introduction
Architecting nanomaterials between different morphologies or dimensions and imparting crystal defects has been a major pursuit in nanoscience and nanotechnology to achieve specific applications using their optoelectronic properties.1–3 Such methodologies hold promise in tackling various environmental issues and energy challenges. Rational synthesis methods have to be developed to achieve the desired morphology/dimension with specific defects for the nanomaterials and to exploit their efficacies. On this account, the dislocation-driven growth mechanism forms a versatile tool to elucidate nanocrystals of varied structures, which itself is a defect to the crystal growth providing self-perpetuating steps and thereby creating crystal anisotropy.4–6 Zinc oxide (ZnO) is notable among semiconductors due to its unparalleled flexibility in designing novel and complex hierarchical structures due to its characteristic Zn- and O-terminated polar surfaces along with 6, 2-fold symmetries and their sub-symmetries.7,8 Generally, ZnO favours a wurtzite crystal lattice with a c-axis directed dipole moment by zinc terminated (0001) and oxygen terminated (000![[1 with combining macron]](https://www.rsc.org/images/entities/char_0031_0304.gif) ) surfaces, resulting in spontaneous polarisation and bifurcation of surface energy.9 Typically, the common crystal facets that determine the growth orientation and therefore the morphology of ZnO are {10
) surfaces, resulting in spontaneous polarisation and bifurcation of surface energy.9 Typically, the common crystal facets that determine the growth orientation and therefore the morphology of ZnO are {10![[1 with combining macron]](https://www.rsc.org/images/entities/char_0031_0304.gif) 0}, {0001} and {11
0}, {0001} and {11![[2 with combining macron]](https://www.rsc.org/images/entities/char_0032_0304.gif) 0} with {10
0} with {10![[1 with combining macron]](https://www.rsc.org/images/entities/char_0031_0304.gif) 0} being the most stable surface and {0001} being the high energy surface of low index planes. Based on crystal growth habits, the growth rate of planes is in the order: (0001) > (10
0} being the most stable surface and {0001} being the high energy surface of low index planes. Based on crystal growth habits, the growth rate of planes is in the order: (0001) > (10![[1 with combining macron]](https://www.rsc.org/images/entities/char_0031_0304.gif) 1) > (10
1) > (10![[1 with combining macron]](https://www.rsc.org/images/entities/char_0031_0304.gif) 0), frequently expressing ZnO nanorod structures with a high area of the non-polar {10
0), frequently expressing ZnO nanorod structures with a high area of the non-polar {10![[1 with combining macron]](https://www.rsc.org/images/entities/char_0031_0304.gif) 0} and a low exposed area of the polar {0001} surface. Because of the high energy of the {0001} surface, 〈0001〉 direction growth is too fast to be observed in the final structure; instead, low energy planes growing with a slow growth velocity will be exposed in the final morphology.
0} and a low exposed area of the polar {0001} surface. Because of the high energy of the {0001} surface, 〈0001〉 direction growth is too fast to be observed in the final structure; instead, low energy planes growing with a slow growth velocity will be exposed in the final morphology.
ZnO is potentially applied to solve various environmental issues by photocatalysis due to its wide direct bandgap, good photosensitivity, and intrinsic electronic characteristics.10–12 Nonetheless, the wide bandgap in semiconductors limits the utilization of bountiful solar energy and confines their application in real-world water purification processes. Another major limitation of ZnO photocatalysis is its high rate of electron–hole pair recombination which also hampers their commercial application. Recently, modifications like coupling with other semiconductor materials have been reported to enhance the photocatalytic degradation of organic compounds.13–16 The heterojunctions so-created allow the energy bands to align suitably which facilitates the separation of photogenerated charges to a greater extent and reduces the recombination rate. The exposed crystal planes and their polarity have a significant effect on the photocatalytic activity. Since the reaction occurs at the interface between the reactant and catalyst, the surface morphology of ZnO influences greatly the photocatalytic efficiency. The order of degradation efficiencies of different surfaces towards methylene blue dye is {0001} > {10![[1 with combining macron]](https://www.rsc.org/images/entities/char_0031_0304.gif) 1} > {10
1} > {10![[1 with combining macron]](https://www.rsc.org/images/entities/char_0031_0304.gif) 0}, and the morphology with a high degree of exposure of the {0001} facet is preferred for photocatalysis.17 Greer et al. developed (0001) plane exposed microspheres of ZnO from the aggregation of nanocones via a solvothermal route using two different H2O–ethylene glycol solvent mixtures. The high Zn/O lattice atomic ratio obtained from XPS confirms the zinc enrichment and (0001) plane termination.18 Pyramid-shaped particles with the (0001) basal plane and (10
0}, and the morphology with a high degree of exposure of the {0001} facet is preferred for photocatalysis.17 Greer et al. developed (0001) plane exposed microspheres of ZnO from the aggregation of nanocones via a solvothermal route using two different H2O–ethylene glycol solvent mixtures. The high Zn/O lattice atomic ratio obtained from XPS confirms the zinc enrichment and (0001) plane termination.18 Pyramid-shaped particles with the (0001) basal plane and (10![[1 with combining macron]](https://www.rsc.org/images/entities/char_0031_0304.gif)
![[1 with combining macron]](https://www.rsc.org/images/entities/char_0031_0304.gif) ) exposed side planes were synthesised by a solvothermal technique using hexamethylenetetramine as the capping agent and ethylene glycol–water mixture as the solvent, which exhibits good sensing behaviour towards ethanol.19 Another interesting approach to reduce the recombination rate as well as to enhance the physicochemical properties is by doping the semiconductors with transition metals. The dopant acts as an electron scavenger during photoexcitation of the semiconductor and thus the photogenerated holes are readily accessible for the formation of hydroxyl radicals. While developing composites of semiconductors with noble metals like Au, Ag, Pt, etc., they serve as a sink for photogenerated electrons and thereby suppress the fast recombination of excitons.20–22 Ag–ZnO heterojunctions with improved photocatalytic efficiency towards methylene blue degradation were prepared by Zhu et al. They found that Ag–ZnO heterojunctions generate more O2− radicals and Ag loading suppresses the electron–hole pair recombination which enhances the photocatalytic performance.23 Putri et al. evaluated the effect of the morphology of bimetallic AuAg nanoparticles (AuAg nanoflowers and AuAg mesopopcorn) on the photocatalytic efficiency of a nanocomposite with ZnO nanorods.24 A graphene oxide/ZnO nanocomposite embedded with Ag nanoparticles shows complete degradation after 45 min towards methylene blue degradation.25 Recently it has been reported by various groups that non-metal (C, B, I, F, and P) doping shifts the bandgap of semiconductors to the visible region by introducing crystal defects and a greater number of oxygen vacancies.26–28 Among various non-metals, carbon has gained more attention due to its effective reduction of the bandgap by creating intermediate energy levels which result in increased visible light absorption. Ansari et al. synthesised C-doped ZnO nanostructures by a decomposition method using melamine as the carbon source. The narrow band gap and good electron–hole pair separation efficiency gained upon carbon doping enhance the photocatalytic efficiency of ZnO towards rhodamine B degradation.29 Pyrolysis of zinc based metal organic frameworks is another strategy to obtain carbon doped ZnO. The even distribution of carbon in the ZnO lattice along with a porous structure from the MOF leads to band gap narrowing and enhanced adsorption of dye molecules on the active surface.30
) exposed side planes were synthesised by a solvothermal technique using hexamethylenetetramine as the capping agent and ethylene glycol–water mixture as the solvent, which exhibits good sensing behaviour towards ethanol.19 Another interesting approach to reduce the recombination rate as well as to enhance the physicochemical properties is by doping the semiconductors with transition metals. The dopant acts as an electron scavenger during photoexcitation of the semiconductor and thus the photogenerated holes are readily accessible for the formation of hydroxyl radicals. While developing composites of semiconductors with noble metals like Au, Ag, Pt, etc., they serve as a sink for photogenerated electrons and thereby suppress the fast recombination of excitons.20–22 Ag–ZnO heterojunctions with improved photocatalytic efficiency towards methylene blue degradation were prepared by Zhu et al. They found that Ag–ZnO heterojunctions generate more O2− radicals and Ag loading suppresses the electron–hole pair recombination which enhances the photocatalytic performance.23 Putri et al. evaluated the effect of the morphology of bimetallic AuAg nanoparticles (AuAg nanoflowers and AuAg mesopopcorn) on the photocatalytic efficiency of a nanocomposite with ZnO nanorods.24 A graphene oxide/ZnO nanocomposite embedded with Ag nanoparticles shows complete degradation after 45 min towards methylene blue degradation.25 Recently it has been reported by various groups that non-metal (C, B, I, F, and P) doping shifts the bandgap of semiconductors to the visible region by introducing crystal defects and a greater number of oxygen vacancies.26–28 Among various non-metals, carbon has gained more attention due to its effective reduction of the bandgap by creating intermediate energy levels which result in increased visible light absorption. Ansari et al. synthesised C-doped ZnO nanostructures by a decomposition method using melamine as the carbon source. The narrow band gap and good electron–hole pair separation efficiency gained upon carbon doping enhance the photocatalytic efficiency of ZnO towards rhodamine B degradation.29 Pyrolysis of zinc based metal organic frameworks is another strategy to obtain carbon doped ZnO. The even distribution of carbon in the ZnO lattice along with a porous structure from the MOF leads to band gap narrowing and enhanced adsorption of dye molecules on the active surface.30
In this work, we developed screw-dislocated ZnO nanocones with step side edges exposing high-energy {0001} facets by a hydrothermal process. The study offers a good chance to understand the formation mechanism and to know the importance of step-edge preferential growth of nanocones. We also proposed a facile method for the synthesis of carbon-doped ZnO nanostructures that involves electrospinning of hydrothermally synthesized ZnO nanostructures in the presence of polyvinyl alcohol solution. To the best of our knowledge, carbon-doped ZnO nanostructures synthesized by a hydrothermal method, followed by calcination of the electrospun ZnO–PVA complex, have not been reported. Therefore, it is imperative to study the development of ZnO step-edge nanocones exposed with well-defined crystal facets and carbon-doped ZnO nanostructures with new facile synthesis to enhance the photocatalytic activity.
Experimental
Chemicals
Zinc acetate (Zn(Ac)2·2H2O, 99.0%), sodium hydroxide (NaOH), methylene blue (MB), glacial acetic acid, isopropyl alcohol (IPA), benzoquinone (BQ), disodium salt of EDTA (Na2EDTA) and silver nitrate (AgNO3) were purchased from Merck, India. Cetyltrimethylammonium bromide (CTAB) was purchased from Spectrochem, India. Polyvinyl alcohol (PVA, degree of polymerisation – 15![[thin space (1/6-em)]](https://www.rsc.org/images/entities/char_2009.gif) 000, Mn – 6.6 × 10⁵) was purchased from Rolex Chemical Industries, Mumbai. All these chemicals were used as received without further purification.
000, Mn – 6.6 × 10⁵) was purchased from Rolex Chemical Industries, Mumbai. All these chemicals were used as received without further purification.
Synthesis of ZnO nanostructures
ZnO nanocones were synthesized by a hydrothermal method based on our previous work.31 In brief, 0.06% of CTAB and 1 mM Zn(Ac)2·2H2O were suspended in 1% 100 mL glacial acetic acid solution. The obtained solution was stirred for 24 h at room temperature. The pH of the solution after stirring was increased from 3.5 to 11 with the addition of 1 M NaOH solution. Thereafter the solution was transferred into a Teflon-lined stainless-steel autoclave for a hydrothermal treatment at 100 °C for 7 h. Finally, the ZnO nanostructures were collected by centrifugation, washed several times with DI water, and dried at 60 °C overnight.Synthesis of carbon-doped ZnO nanostructures (C:ZnO)
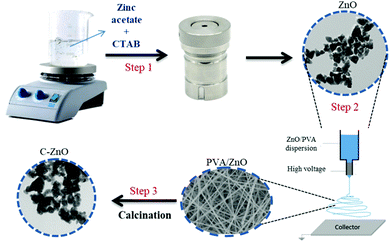
The schematic diagram of the fabrication of carbon-doped ZnO nanostructures is shown in Scheme 1. The synthesis procedure involved an electrospinning process, followed by high-temperature calcination. Initially, ZnO nanostructures (1 wt%) were added to PVA solution (7 wt%) and sonicated for 2 h to get a uniform dispersion. The solution was then loaded into a syringe of needle size 0.06 mm × 25 mm without any air bubble and further used for the electrospinning process. The voltage applied was 20 kV between the grounded collector drum and the needle tip with a flow rate of 1 mL h−1 at a distance of 12 cm. The electrospun fiber net was then annealed in air at 600 °C for 2 h at a controlled heating rate of 2 °C per minute using a muffle furnace. High-temperature annealing degrades PVA within the sample. The obtained C:ZnO nanostructure is named Z1P7. The ratio of PVA in the solution for electrospinning was varied for 10 wt% and 12 wt% to obtain samples Z1P10 and Z1P12, respectively.Characterization
The crystallographic structure and size of the samples were analyzed by XRD patterns using a PANalytical X’Pert Pro (λ = 1.5418 Å). The surface morphology of the samples was investigated using a Carl Zeiss UltraPlus field emission scanning electron microscope (FESEM). The X-ray photoelectron spectroscopy of the prepared samples was recorded on a PHI 5000 VersaProbe II, ULVAC-PHI Inc., USA, equipped with a micro-focused (200 μm, 15 KV) monochromatic Al-Kα X-ray source. Transmission electron microscopy (TEM; JEOL JEM-2100 microscope) images were recorded to investigate the crystallographic structure and size of the samples. The optical properties of the samples were analyzed using a PerkinElmer UV/Vis Lambda 365 spectrometer. The photoluminescence behavior of the samples was analyzed using a Jobin Yvon Horiba Model Fluorolog at an excitation wavelength of 320 nm. Time-correlated single-photon counting (TCSPC) data were collected using a Horiba PTI spectrophotometer. The specific surface area and pore size measurement were performed on a BELCAT-M (BEL Japan, Inc.; samples were degassed at 100 °C for 2 h before analysis).Photocatalytic MB degradation
The photocatalytic activity of the samples was analyzed from the degradation of methylene blue as a model organic pollutant under visible-light excitation. 10 mg of the photocatalyst was mixed with 40 mL of 10 ppm MB dye solution. The photocatalyst–dye solution was stirred in dark conditions for 30 minutes to reach the absorption–desorption equilibrium. Thereafter the solution was irradiated with simulated solar light for 90 minutes. 5 mL aliquots were taken from the solution at each 30 minute time interval and the absorbance at λmax = 663 nm was monitored by UV-Vis spectroscopy. The absorbance of the initial concentration of MB solution before light irradiation was also measured. The photocatalytic efficiency was calculated using the following formula:where C0 is the initial concentration of MB solution and Ct is the concentration of MB at a particular time t.
Further, to find out the reactive species in the synthesized C:ZnO, MB photodegradation was monitored after the addition of 1 ml of 2 mM solutions of IPA, BQ, Na2EDTA, and AgNO3 as the scavengers for hydroxyl (˙OH) radicals, superoxide (˙O2−) radicals, holes (h+) and electrons (e−), respectively.
Results and discussion
ZnO nanocones were primarily synthesized by a hydrothermal method using CTAB as the capping agent. Fig. 1a shows the typical XRD pattern obtained for the as-prepared ZnO nanostructures matching well with the JCPDS card no: 36-1451, and corresponding to its wurtzite phase with high crystalline purity. As evident from the SEM and TEM images (Fig. 1b and c), the nanostructures have a cone-like morphology with the basal sides of the nanocones showing regular corners of a hexagon with an angle of 120°. The SAED pattern shown in the inset of Fig. 1d taken for the whole nanocone morphology can be assigned to wurtzite ZnO with zone axis [0001]. The diffraction spots are clear and concentric without any additional points, affirming that the whole nanocone is a single crystal without any stacking faults. Instead, the crystal has grown with screw-dislocations in the [0001] zone axis and ended with the polar facet of {0001}.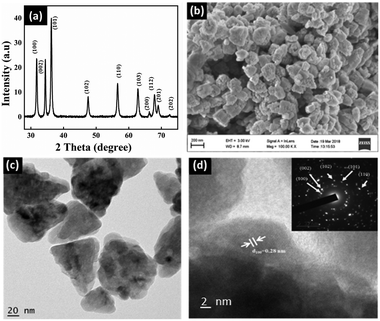 | ||
| Fig. 1 (a) XRD, (b) SEM, (c) TEM and (d) HRTEM of the as-synthesized ZnO nanocones. Inset of (d) shows the corresponding SAED pattern. | ||
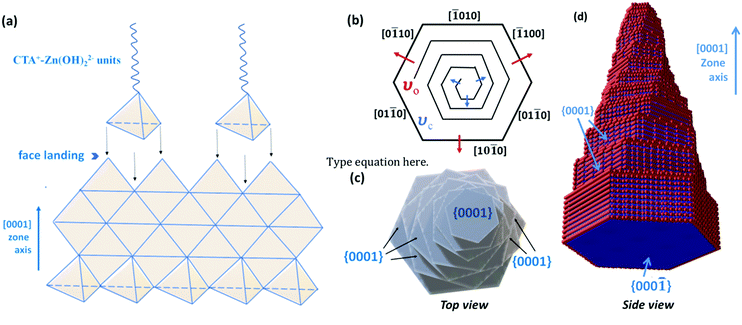
Further examining the crystal growth, the cationic surfactant CTAB completely dissociates in water into CTA+ and Br− ions, which will have a direct influence on the polar facets of ZnO during its crystal growth by electrostatic attraction.32 Meanwhile, CTAB also forms micelles with a specific size and shape and will assist in crystallization of ZnO simultaneously determining the final morphology of ZnO nanocrystals in lower supersaturation. Colloidal Zn(OH)22− tetrahedral units, formed from the precursor Zn(Ac)2·2H2O with 1% acetic acid solution, are the growth units of ZnO. These units being negatively charged get electrostatically attracted to the hydrophobic end of CTA+ which is as well a positive tetrahedron. Hydrothermal treatment laterally dehydrates Zn(OH)22− to ZnO, and ZnO seeds are formed. CTA+ continues to act as ionic carrier forming layers of Zn(OH)22− over the formed ZnO seeds. CTA+–Zn(OH)22− units tend to face-land onto the growing interface of ZnO nanoseeds, with simultaneous dehydration. The landing process of CTA+–Zn(OH)22− units onto ZnO nanoseeds which is growing with a [0001] crystal direction is diagrammatically shown in Fig. 2a.
This process of face-landing and dehydration continues until the ZnO crystal experiences some high-energy barriers (caused by slower mass transport kinetics or by more adsorbed surfactant molecules) in nucleating new layers of atoms along [0001] crystal growth. At this instance of overcoming the energy-barrier, the addition of more CTA+–Zn(OH)22− units creates a screw-dislocation with a step edge to the crystal. These axial screw dislocations with self-perpetuating steps lead to the breakage of crystal symmetry and the crystal growth proceeds with high anisotropy leading to the formation of nanocone morphology.4 A screw-dislocation can itself be considered as a defect to the crystal growth of ZnO. To explain the formation of such a morphology with step edges, crystal growth velocities νo and νc can be considered (Fig. 2b), where νo is the velocity of the steps at the core and νc is the velocity at the outer edges at hillocks of the dislocation.5 In other words, νo promotes the crystal growth equally along [01![[1 with combining macron]](https://www.rsc.org/images/entities/char_0031_0304.gif) 0], [10
0], [10![[1 with combining macron]](https://www.rsc.org/images/entities/char_0031_0304.gif) 0], and [1
0], and [1![[1 with combining macron]](https://www.rsc.org/images/entities/char_0031_0304.gif) 00], with their corresponding reverse axes, while νc promotes crystal growth along the [0001] zone axis. At the initial stages of crystal growth, ZnO crystallizes out more like a 2D hexagonal platelet when νo and νc are crystallographically equivalent, without the creation of any step pile up. The formation of such hexagonal basal planes at the bottom of nanocones is clear from the SEM image discussed above. When νo < νc, newly generated steps are perpetuated under low supersaturation in the presence of CTAB as surfactants. Preferential adsorption of CTAB molecules onto high-energy {0001} facets stabilizes them along the c-axis in between the steps (Fig. 2c and d). It is also noted that the so-formed nanocones have extremely high slopes with smaller width-to-height ratios. Such defective crystal growth in wurtzite ZnO, henceforth, exposes a greater percentage of high-energy {0001} facets due to step-edges, which is expected to show great potential towards photocatalytic performances.33 The SEM image of ZnO synthesised without CTAB shows agglomerated nanoparticle morphology confirming the importance of CTAB for the step edge growth of ZnO nanocones (Fig. S1 of the ESI†).
00], with their corresponding reverse axes, while νc promotes crystal growth along the [0001] zone axis. At the initial stages of crystal growth, ZnO crystallizes out more like a 2D hexagonal platelet when νo and νc are crystallographically equivalent, without the creation of any step pile up. The formation of such hexagonal basal planes at the bottom of nanocones is clear from the SEM image discussed above. When νo < νc, newly generated steps are perpetuated under low supersaturation in the presence of CTAB as surfactants. Preferential adsorption of CTAB molecules onto high-energy {0001} facets stabilizes them along the c-axis in between the steps (Fig. 2c and d). It is also noted that the so-formed nanocones have extremely high slopes with smaller width-to-height ratios. Such defective crystal growth in wurtzite ZnO, henceforth, exposes a greater percentage of high-energy {0001} facets due to step-edges, which is expected to show great potential towards photocatalytic performances.33 The SEM image of ZnO synthesised without CTAB shows agglomerated nanoparticle morphology confirming the importance of CTAB for the step edge growth of ZnO nanocones (Fig. S1 of the ESI†).
We further introduced more defect sites into the screw-dislocated ZnO nanocones by C-doping. For attaining such defect states, the as-synthesized ZnO nanocones were dispersed in a definite concentration of PVA solution by ultrasonication to obtain the precursor solution for the electrospinning process. The as-fabricated electrospun PVA/ZnO fibers were then annealed such that the polymeric chains of PVA get degraded and carbon-doped ZnO nanostructures are yielded (Scheme 1). Fig. 3 presents the TEM image of C:ZnO nanostructures. After carbonization, Z1P7 retains its nanocone morphology similar to pure ZnO with a slightly higher size, while Z1P10 also somewhat retains the nanocone morphology. Also, the nanocone step edges are gradually transformed to a smooth surface by the removal of CTAB during annealing. The corresponding HR-TEM images of all samples are shown in Fig. 3(d)–(f). A lattice distance of 0.26 nm is observed for all samples with sharp lattice fringes, corresponding to the interplanar distance between the crystallographic (100) planes of the ZnO wurtzite crystal lattice. The SAED pattern also shows the good crystalline nature of the samples. The SEM images and elemental mapping of Z1P10 are depicted in Fig. S2 of the ESI.† The FESEM image of the electrospun ZnO/PVA (10 wt% PVA) shows well-defined smooth and beadless nanofibers with an average diameter of 150 nm (Fig. S2a, ESI†) and it is also clear from the SEM image that ZnO nanoparticles are uniformly distributed inside nanofibers. During the annealing process, the PVA nanofibers are degraded providing carbon as the dopant and this method enables effective carbon doping as ZnO exhibits a good interaction with PVA nanofibers. After annealing the sample Z1P10 shows smooth nanoparticle morphology. The presence of carbon in ZnO nanostructures was further examined by SEM-EDS. As shown in Fig. S2(c)–(f) (ESI†), the samples consist of only Zn, O, and C atoms with uniform distribution, confirming the formation of C:ZnO.
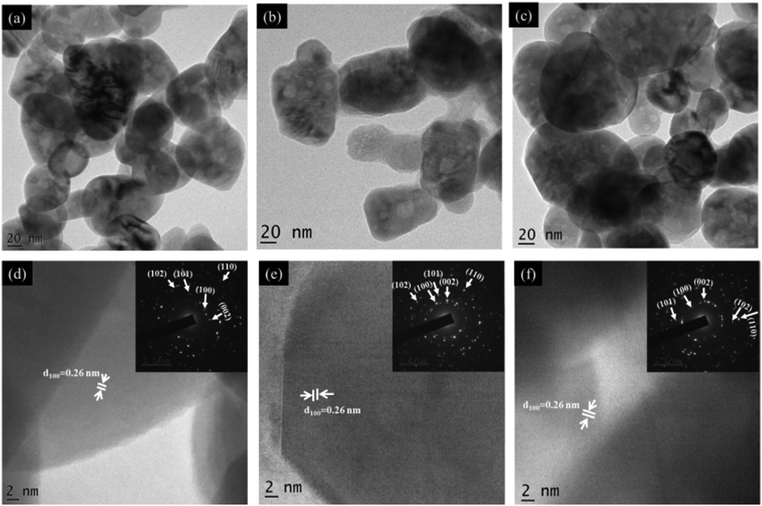 | ||
| Fig. 3 (a–c) TEM and (d–f) HRTEM images of Z1P7, Z1P10, and Z1P12, respectively. The insets of (d–f) show the corresponding SAED patterns. | ||
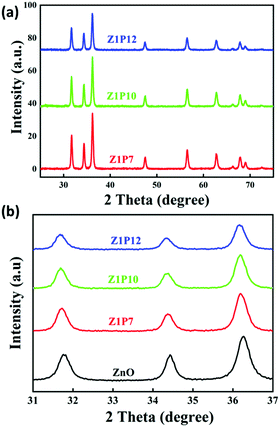
The XRD spectra of the as-prepared samples are shown in Fig. 4. All samples show characteristic peaks of hexagonal wurtzite ZnO with good crystalline nature, which is well correlated with the literature.34 This indicates that the incorporation of carbon does not alter the crystalline phase of ZnO. There is a slight shift in the diffraction peaks of C:ZnO towards a lower angle compared to pure ZnO, indicating the expansion of the ZnO lattice by the introduction of carbon atoms into the ZnO lattice. The peak values of all samples can be assigned to the corresponding crystal planes of the hexagonal wurtzite ZnO structure (JCPDS card no: JCPDS 36-1451). The absence of any other peak in the XRD pattern indicates high crystallinity and phase purity. The average crystallite size of the samples is calculated using the Scherrer equation (eqn 1) and presented in Table 1.
 | (1) |
 | (2) |
| Sample name | Crystallite size (nm) | Lattice parameters (Å) | Zn–O bond length (Å) | |
|---|---|---|---|---|
| a | c | |||
| ZnO | 42 | 3.2580 | 5.2062 | 1.82 |
| Z1P7 | 46 | 3.2612 | 5.2285 | 1.95 |
| Z1P10 | 50 | 3.2686 | 5.2480 | 1.95 |
| Z1P12 | 50 | 3.2516 | 5.2492 | 1.95 |
The lattice parameters a and c of pure ZnO are calculated as 3.0058 and 5.2062 Å, respectively, increasing to 3.2 and 5.6 Å for C:ZnO samples. In addition, the lattice parameters increase linearly for C:ZnO nanostructures upon carbon doping. This can be explained by the substitution of smaller O2− ions by larger C4− ions. The ionic radius of C4− is 0.260 nm which is higher than that of O2− (0.140 nm) in the tetrahedral environment.36,37 So the incorporation of C4− into the lattice of ZnO increases the crystal volume and thereby the lattice parameters. Additionally, carbon doping into ZnO nanostructures requires an external input energy of ∼12 eV, which can also be ascribed to the change in structural parameters compared to pure ZnO.38 Similarly, the Zn–O bond length, L, is obtained from eqn (3):
 | (3) |
 . From the calculation, the Zn–O bond length for pure ZnO is recorded as 1.82 Å, and for all C:ZnO samples the values are found to be 1.95 Å. This increase in Zn–O bond length is associated with the rise in lattice parameters a and c.39,40 Thermogravimetric analysis (TGA) was carried out from ambient temperature to 750 °C for investigating the thermal stability of the prepared samples and to understand the components of C:ZnO structures. A negligible weight loss in the Z1P10 sample compared to pure ZnO observed in the thermogram shown in Fig. S3 (ESI†) confirms the removal of organic compounds used for carbonization during the electrospinning process.41,42
Aiming at various photocatalytic applications, one of the important properties of photocatalysts is their optical absorption which can be monitored by employing UV-visible spectroscopy. C:ZnO nanostructures show a noticeable increase in visible-light absorption (Fig. 5a) compared to pure ZnO. A gradual red shift in the absorption edge for C:ZnO samples is observed, which increases with the increase in the weight percentage of PVA. The Kubelka–Munk transformed UV-Vis reflectance spectra (Fig. 5b) are used to calculate the bandgap energy for all samples, i.e., by plotting (F(R∞)hν)2versus photon energy (eV). The calculated bandgaps for ZnO, Z1P7, Z1P10, and Z1P12 are 3.23 eV, 3.15 eV, 3.19 eV, and 3.15 eV, respectively. The reduction in the bandgap energy of C:ZnO can be attributed to the extension of the valence band maximum (VBM) to a high energy level due to the creation of vacant energy states above the valence band on account of carbon substitution. In pure ZnO, the valence band (VB) consists of O 2p and Zn 3d states with a slight contribution from Zn 3p, while the conduction band (CB) is constituted by Zn 3p and Zn 4s states purely from Zn atoms.29,36,43 The Fermi level of ZnO is mostly contributed by O 2p states. The C 2p states of the carbon dopant lie closer to the Fermi level of doped ZnO due to its similarity in electronegativity and atomic size to oxygen. The deficiency of electrons and slightly low electronegativity of carbon compared to oxygen lead to the formation of vacant sites above the Fermi level extending the valence band to a higher energy.38 These vacant sites construct an efficient route for electrons to jump from the Fermi level to a higher energy level and to the conduction band. This directly enhances the visible-light harvesting ability of C:ZnO samples, thereby boosting the photocatalytic degradation of organic pollutants.
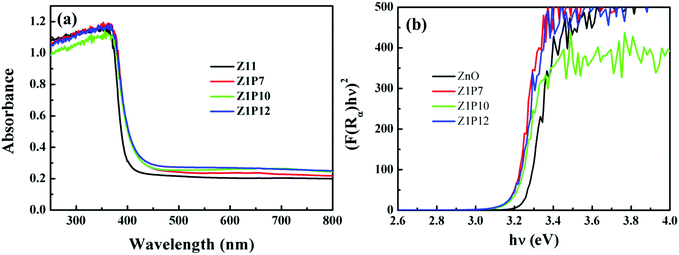 | ||
| Fig. 5 UV-visible diffuse reflectance spectra of pure ZnO and C:ZnO nanostructures and (b) bandgap energy calculations using the Kubelka–Munk function. | ||
A detailed XPS analysis was performed for the C:ZnO nanostructures to gain a better understanding of their electronic structure and surface chemical compositions.
The XPS survey spectrum shown in Fig. 6a indicates that all samples consisted of Zn, O, and C, without any other detectable impurities. The presence of carbon in the pure ZnO sample can be attributed to contamination by adventitious carbon from the XPS instrument. High resolution XPS scans are used to calculate the carbon percentages in the samples. We estimated the percentages of carbon to be 1.95, 2.0 and 1.03% for Z1P7, Z1P10 and Z1P12 samples, respectively, assuming that undoped ZnO has only adventitious carbon. As shown in Fig. 6b, the Zn 2p spectrum of pure ZnO contains two peaks which can be assigned to the tetrahedral arrangement of Zn2+ ions surrounded by O2− ions in the hexagonal wurtzite structure of ZnO. The peak at 1021.26 eV represents Zn 2p3/2 and that at 1044.46 eV represents Zn 2p1/2. The distance between the binding energies of these two peaks is 23.2 eV, which comes under the standard reference value of ZnO, further confirming the presence of Zn2+ ions in the sample.44 For the C-doped Z1P7 sample, the intensities of the above-mentioned two peaks are reduced due to the carbon incorporation into the ZnO lattice. The Zn 2p3/2 peak is shifted to a higher binding energy which can be interpreted as the presence of different chemical environments of the Z1P7 sample compared to bare ZnO. A new peak at 1020.13 eV in Z1P7 is ascribed to the Zn–O–C bond formed by the incorporation of carbon.44,45 The O 1s spectra of bare ZnO can be deconvoluted to two components at 530.06 eV and 531.46 eV, which can be assigned to O2− ions bound to Zn2+ ions in the hexagonal wurtzite structure of ZnO (lattice oxygen –OL) and loosely bound surface adsorbed oxygen species (hydroxyl group-OH) or carbonates (C–O, C![[double bond, length as m-dash]](https://www.rsc.org/images/entities/char_e001.gif) O), respectively (Fig. 6c).29 The hydroxyl group present on the surface of the catalyst promotes the adsorption of oxygen molecules and helps to get rid of the carbonate species present on the surface, which could block the active sites of the catalyst.46 Hence, the presence of a hydroxyl group on the surface has a positive effect on the enhancement of photocatalysis efficiency. The ratios of OH/OL for pure ZnO, Z1P7, Z1P10, and Z1P12 are found to be 0.62, 0.89, 0.94, and 0.46, respectively. The more the hydroxyl groups present on the surface of the Z1P10 sample, the better its photocatalytic efficiency.
O), respectively (Fig. 6c).29 The hydroxyl group present on the surface of the catalyst promotes the adsorption of oxygen molecules and helps to get rid of the carbonate species present on the surface, which could block the active sites of the catalyst.46 Hence, the presence of a hydroxyl group on the surface has a positive effect on the enhancement of photocatalysis efficiency. The ratios of OH/OL for pure ZnO, Z1P7, Z1P10, and Z1P12 are found to be 0.62, 0.89, 0.94, and 0.46, respectively. The more the hydroxyl groups present on the surface of the Z1P10 sample, the better its photocatalytic efficiency.
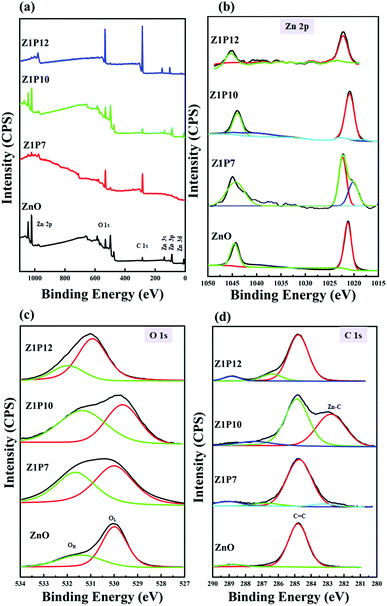 | ||
| Fig. 6 (a) XPS survey scan spectra of ZnO and C:ZnO nanostructures along with their corresponding high resolution (b) Zn 2p, (c) O 1s, and (d) C 1s spectra. | ||
The C 1s high-resolution spectrum of ZnO can be fitted to two components at 284.76 eV and 288.76 eV as shown in Fig. 6d. The peak located at 284.76 eV arises due to the presence of the C–C bond of sp2 hybridized graphitic carbon or residual carbon, while the peak at 288.76 eV can be assigned to the C![[double bond, length as m-dash]](https://www.rsc.org/images/entities/char_e001.gif) O of carbonate species and the adsorbed CO2 molecule.44 The peak located around 286.7 eV for all C:ZnO indicates the formation of a Zn–O–C bond.47 The Z1P7 sample exhibits an additional peak at 283.48 eV, indicating the presence of carbon in the carbide form and can be deemed as primarily associated with Zn–C bond formation.29 The intensity of this carbide peak is increased for Z1P10 which reflects the increase in the carbon concentration of the Z1P10 sample. In addition, a lower energy peak shift is observed for Z1P10 compared to Z1P7, which can be associated with the higher electronic density around the Zn–C bond for the lower carbon-containing Z1P7 sample. The Zn–C species present alter the energy level and thereby influence the bandgap energy. This leads to superior photocatalytic activity due to reduced electron–hole recombination. The component that corresponds to the Zn–C bond is absent in the Z1P12 sample, indicating the inappropriate incorporation of carbon atoms into the ZnO lattice. These observations suggest that the Z1P10 sample is expected to show better photocatalytic activity with successful incorporation of carbon into the ZnO crystal lattice.
O of carbonate species and the adsorbed CO2 molecule.44 The peak located around 286.7 eV for all C:ZnO indicates the formation of a Zn–O–C bond.47 The Z1P7 sample exhibits an additional peak at 283.48 eV, indicating the presence of carbon in the carbide form and can be deemed as primarily associated with Zn–C bond formation.29 The intensity of this carbide peak is increased for Z1P10 which reflects the increase in the carbon concentration of the Z1P10 sample. In addition, a lower energy peak shift is observed for Z1P10 compared to Z1P7, which can be associated with the higher electronic density around the Zn–C bond for the lower carbon-containing Z1P7 sample. The Zn–C species present alter the energy level and thereby influence the bandgap energy. This leads to superior photocatalytic activity due to reduced electron–hole recombination. The component that corresponds to the Zn–C bond is absent in the Z1P12 sample, indicating the inappropriate incorporation of carbon atoms into the ZnO lattice. These observations suggest that the Z1P10 sample is expected to show better photocatalytic activity with successful incorporation of carbon into the ZnO crystal lattice.
The specific surface area and pore size of the samples are studied using N2 adsorption–desorption isotherms (Fig. 7). Both samples display classical type IV isotherms with H3 hysteresis loops. The area of the hysteresis loop is lower for pure ZnO compared to Z1P10, indicating the high BET specific surface area of Z1P10 (18.09 m2 g−1) which can be attributed to the increase in the pore volume of Z1P10 compared to ZnO (8.97 m2 g−1). The pore size distribution curve derived from the adsorption branches of isotherms using the BJH model shown in the inset of the figure shows that the peak intensified in both mesoporous and macroporous regions. Aside from the intensity of peaks, a shift from the small mesoporous regions to the large mesoporous and even to the macroporous regions is also observed. The total pore volume of ZnO is 0.057 cm3 g−1 which then increased to 0.144 cm3 g−1 for Z1P10, implying that the number of pores is larger for Z1P10 than for ZnO. Overall, Z1P10 possesses a high surface area, pore size and pore volume. Since photocatalysis is a surface phenomenon, more surface adsorption results in enhanced photocatalytic activity.
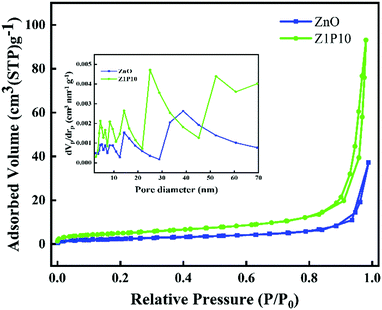 | ||
| Fig. 7 N2 adsorption–desorption isotherms of ZnO and Z1P10. The inset shows the pore size distribution (STP, standard temperature and pressure). | ||
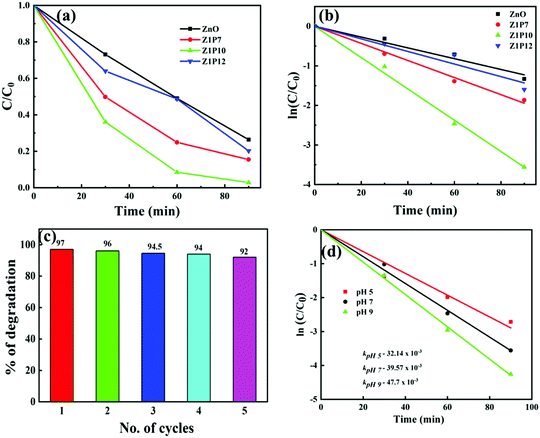
The photocatalytic activities of all samples are analyzed from the photodegradation of methylene blue (MB) dye as a model organic pollutant. Fig. 8a shows the degradation plots for pure ZnO and C:ZnO under visible-light irradiation which indicates that Z1P10 exhibited superior photocatalytic performance. To gain a better insight into their reaction kinetics, the degradation plots are fitted to pseudo-first-order and the rate constant (k) is calculated from the slope of the logarithmic plot of ln![[thin space (1/6-em)]](https://www.rsc.org/images/entities/char_2009.gif) C/C0vs. time (Fig. 8b).
C/C0vs. time (Fig. 8b).
The pure ZnO nanostructures show a photocatalytic efficiency of 74% toward MB degradation upon 90 min of visible-light illumination with k = 13.64 × 10⁻³ min−1, while Z1P10 exhibited the highest visible-light photocatalytic efficiency of 97% toward MB degradation under the same conditions with k being 39.57 × 10⁻³ min−1, which is almost three times higher than that of pure ZnO. The photocatalytic efficiencies of Z1P7 and Z1P12 are 85% and 80% with rate constants of 21.61 × 10⁻³ min−1 and 15.91 × 10⁻³ min−1, respectively. The highest photocatalytic efficiency of the Z1P10 sample is affirmed by the XPS analysis discussed previously, showing that the Z1P10 sample exhibits appropriate incorporation of C into the ZnO lattice with a larger OH/OL ratio and a higher intensity for Zn–C bond binding energy. The doping also discourages the electron–hole pair recombination to a greater extent. To evaluate the photostability of C-doped ZnO, five successive recycling tests for degradation of MB under solar light irradiation were performed for the Z1P10 sample, as displayed in Fig. 8c. The sample exhibits better photostability with only a slight decrease in degradation efficiency even after 5 cycles.
Normally, the pH and surface charge of a photocatalyst are two important factors that affect the photocatalytic degradation efficiency since the pH of waste water varies. The effect of pH on the degradation efficiency was studied using C–ZnO as the photocatalyst. The required acidic and basic pH of the dye solution were established by using 0.1 M HCl and NaOH, respectively. Accordingly, the kinetics of photocatalytic degradation by using solutions with different pH values of 5, 7 and 9 with 10 mg of the C–ZnO catalyst and 10 ppm of MB in 40 mL under solar light irradiation is shown in Fig. 8d. As the pH increases the rate constant of about 32.14 × 10⁻³ at pH 5 is increased to 47.7 × 10⁻³ at pH 9 showing a significant increase in efficiency. The dye adsorption rate on the surface of the catalyst greatly depends on the surface charge and charge characteristics of the dye which can be altered by the pH of the solution. The surface of ZnO possesses positive and negative charges at lower and higher pH values, respectively, due to shifts in the redox potentials of the valence and conduction bands in accordance with the point of zero charge of ZnO. A high pH favours the adsorption of cationic MB dye on the surface of the ZnO photocatalyst which results in enhanced degradation efficiency under basic conditions. It is expected to show almost negligible degradation under very high acidic and basic conditions due to the possibility of dissolution of ZnO. Moreover, a higher pH provides a higher concentration of hydroxyl ions that can react with holes to produce hydroxyl radicals which consequently enhances the degradation efficiency.
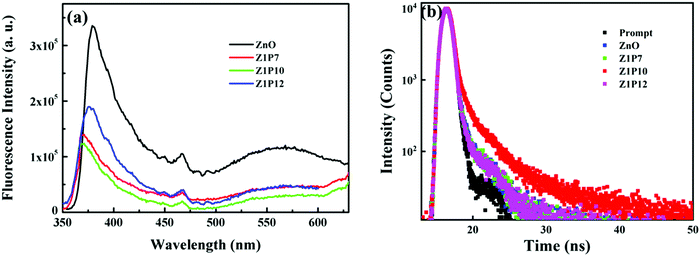
Further, to understand the effect of the C dopant on the separation efficiency of electron–hole pairs during the photoreactions, the photoluminescence (PL) spectra of all samples were also recorded (Fig. 9a). The obtained spectra reflect the recombination rate of charge carriers. The higher the PL intensity, the higher the recombination rate. The order of the PL intensity of the samples is Z1P10 < Z1P7 < Z1P12 < ZnO, which agrees well with their order of photocatalytic degradation efficiency. Moreover, the carrier lifetimes of excited electrons and holes were explored using the time resolved photoluminescence (TRPL) curves obtained using the TSCPC technique. The samples were excited using a 340 nm laser pulse and the emission was monitored at 379 nm. We calculated the average lifetimes of the samples ZnO, Z1P7, Z1P10 and Z1P12 to be 1.27, 3.12, 3.51 and 2.99 ns, respectively, by fitting the decay curves (Fig. 9b) tri-exponentially (see the details in the ESI† and Table S1). The Z1P10 lifetime is found to be longer than that of pure ZnO, reflecting the reduced recombination rate of electron–hole pairs in the carbon doped Z1P10 sample compared to pure ZnO. Therefore, the C doping reduces the recombination rate and thereby enhances the performance of the C:ZnO samples towards visible-light-induced photocatalytic degradation of organic pollutants.
To understand the photocatalytic mechanism of C:ZnO nanostructures in detail, trapping experiments of the reactive species were conducted during the photodegradation of MB using the Z1P10 photocatalyst. The radical scavengers are essential for identifying the critical reactive species in the photocatalytic mechanism. IPA, BQ, Na2EDTA and AgNO3 were used as the scavengers for hydroxyl (˙OH) radicals, superoxide (˙O2−) radicals, holes (h+) and electrons (e−), respectively. Trapping experiments were conducted under optimum conditions and the corresponding results are presented in Fig. 10a. As shown, the photodegradation rate of Z1P10 is reduced from 97% (k = 39.57 × 10⁻³ min−1) in the absence of any scavenger, to 28%, 77%, 65%, and 75%, respectively, in the presence of 2 mM scavenging solutions. The kinetic rate constant for MB photodegradation is very much reduced when IPA (k = 3.64 × 10⁻³ min−1) is used as the scavenger. This indicates that hydroxyl radicals are the critical species in the photodegradation process. After IPA, the highest quenching is observed for Na2EDTA (k = 11.06 × 10⁻³ min−1), confirming as well the vital role of holes in the degradation mechanisms. The least hampering effect is observed for the scavenging reactions with BQ and AgNO3, indicating the less active behaviour of superoxides and electrons. The large amount of hydroxyl groups present on the surface of Z1P10 (high OH/OL ratio obtained from the O 1s XPS spectra of Z1P10) react with holes to produce highly reactive hydroxyl radicals for the degradation of organic pollutants. Hence, the quenching of hydroxyl radicals and holes will have more effect on the degradation efficiency.48 Thus, the reactivity of different photogenerated species on photoexcitation of Z1P10 is in the order of ˙OH > h+ > e− > ˙O2−.
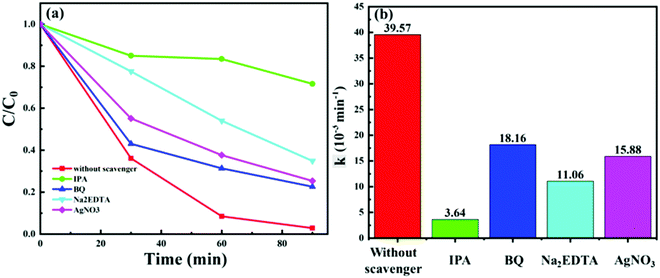 | ||
| Fig. 10 (a) MB photodegradation with the Z1P10 photocatalyst in the presence of IPA, BQ, Na2EDTA and AgNO3 as scavengers and (b) their corresponding reaction rate constants. | ||
Finally, a plausible mechanism for the degradation of organic pollutants by the as-synthesized carbon-doped ZnO nanostructures is exemplified based on the aforesaid results, as presented in Fig. 11. With the addition of carbon as the dopant, vacant sites are induced near the valence band which decreases the bandgap energy of C:ZnO nanocones. This facilitates the absorption of light energy in the visible region for the doped ZnO nanostructures. Moreover, the holes in the impurity level are readily available for the photocatalytic mechanisms, which undergo an oxidative half-cycle to convert water molecules to hydroxyl radicals. This may be the reason for the significant reduction of MB photodegradation when IPA was used as the scavenger. The photogenerated electrons in the conduction band undergo a reductive half-cycle converting the adsorbed oxygen molecules to superoxide radicals. Both hydroxyl and superoxide radicals so formed can cleave the C–S+![[double bond, length as m-dash]](https://www.rsc.org/images/entities/char_e001.gif) C functional group of MB dye and through a series of degradation steps, complete mineralization to CO2 and H2O takes place. Thus, improved visible light absorptivity and efficient charge separation induced by carbon doping resulted in superior photocatalytic activity for C:ZnO nanocones.
C functional group of MB dye and through a series of degradation steps, complete mineralization to CO2 and H2O takes place. Thus, improved visible light absorptivity and efficient charge separation induced by carbon doping resulted in superior photocatalytic activity for C:ZnO nanocones.
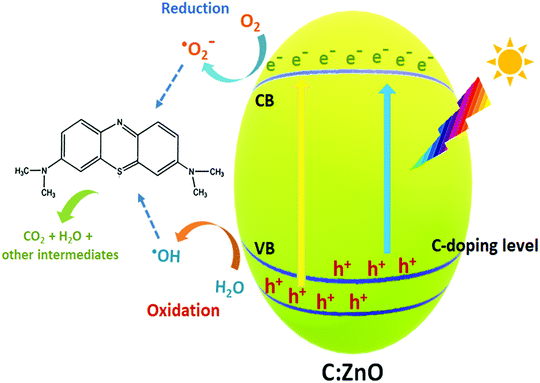 | ||
| Fig. 11 Mechanism of the photocatalytic degradation of MB dye under visible light irradiation of C:ZnO nanostructures. | ||
Conclusions
Screw-dislocated ZnO nanocones with step side edges exposing high-energy {0001} facets were successfully synthesised by a CTAB assisted hydrothermal process. The screw dislocated crystal growth mechanism for the formation of ZnO is explained in detail and the study offers a good chance to understand the formation mechanism and to know the importance of step-edge preferential growth of nanocones. Further, a facile method is adopted for the synthesis of carbon-doped ZnO nanostructures that involves electrospinning of hydrothermally synthesized ZnO nanostructures in the presence of polyvinyl alcohol solution. The carbon doping into the ZnO crystal lattice was confirmed by XRD and XPS spectroscopy. The increase in lattice parameters reflected the expansion in the ZnO lattice by C doping. The presence of the Zn–C binding energy in the C 1s spectra of C:ZnO samples further proved the carbon incorporation. The so-obtained C:ZnO nanostructures displayed superior visible-light photocatalytic degradation towards MB dye with a kinetic rate constant k of 39.57 × 10⁻³ min−1 which is almost three times higher than that of pure ZnO (13.64 × 10⁻³ min−1). As evident from PL analysis, the photocatalytic activity was enhanced by the increase in the separation efficiency of photogenerated charge carriers in the presence of the dopant. The superior activity of the synthesized C:ZnO nanostructures towards organic pollutant degradation opens up the possibility of their use in various photocatalytic environmental applications.Author contributions
Honey John: conceptualization, methodology, supervision, resources, funding acquisition, draft review and editing. Jesna Louis: investigation, formal analysis, experimental work, results and discussion, validation, writing – original draft. Nisha T. Padmanabhan: data analysis, writing – review and editing, visualization. Madambi K. Jayaraj: supervision, review and editing.Conflicts of interest
There are no conflicts to declare.Acknowledgements
The authors greatly acknowledge the Fund for Improvement of S&T Infrastructure in Universities and Higher Educational Institutions (FIST) Program under the Department of Science and Technology (DST), Science and Engineering Research Board (SERB – EMR/2016/002120) and Ministry of New and Renewable Energy (MNRE), India for providing necessary funds and fellowships.References
- Y. Zhu, L. Peng, Z. Fang, C. Yan, X. Zhang and G. Yu, Adv. Mater., 2018, 30, 1706347 CrossRef PubMed.
- J. Xiong, J. Di, J. Xia, W. Zhu and H. Li, Adv. Funct. Mater., 2018, 28, 1801983 CrossRef.
- A. Kumar, P. Raizada, A. A. P. Khan, V. H. Nguyen, Q. Van Le, A. Singh, V. Saini, R. Selvasembian, T. T. Huynh and P. Singh, Sci. Total Environ., 2021, 800, 149410 CrossRef CAS PubMed.
- F. Meng, S. A. Morin, A. Forticaux and S. Jin, Acc. Chem. Res., 2013, 46, 1616–1626 CrossRef CAS PubMed.
- S. A. Morin, A. Forticaux, M. J. Bierman and S. Jin, Nano Lett., 2011, 11, 4449–4455 CrossRef CAS PubMed.
- S. Jin, M. J. Bierman and S. A. Morin, J. Phys. Chem. Lett., 2010, 1, 1472–1480 CrossRef CAS.
- C. Tang, M. Spencer and A. Barnard, Phys. Chem. Chem. Phys., 2014, 16, 22139–22144 RSC.
- D. Mora-Fonz, T. Lazauskas, M. R. Farrow, C. R. A. Catlow, S. M. Woodley and A. A. Sokol, Chem. Mater., 2017, 29, 5306–5320 CrossRef CAS.
- T. Ghoshal, S. Kar, J. Ghatak and S. Chaudhuri, Mater. Res. Bull., 2008, 43, 2228–2238 CrossRef CAS.
- K. Qi, X. Xing, A. Zada, M. Li, Q. Wang, S.-Y. Liu, H. Lin and G. Wang, Ceram. Int., 2020, 46, 1494–1502 CrossRef CAS.
- P. Kumar, A. Kumar, M. A. Rizvi, S. K. Moosvi, V. Krishnan, M. M. Duvenhage, W. D. Roos and H. C. Swart, Appl. Surf. Sci., 2020, 514, 145930 CrossRef CAS.
- A. M. Saad, M. R. Abukhadra, S. Abdel-Kader Ahmed, A. M. Elzanaty, A. H. Mady, M. A. Betiha, J.-J. Shim and A. M. Rabie, J. Environ. Manage., 2020, 258, 110043 CrossRef CAS PubMed.
- A. Norouzi, A. Nezamzadeh-Ejhieh and R. Fazaeli, Mater. Sci. Semicond. Process., 2021, 122, 105495 CrossRef CAS.
- A. Raja, P. Rajasekaran, K. Selvakumar, M. Arunpandian, K. Kaviyarasu, S. Asath Bahadur and M. Swaminathan, Sep. Purif. Technol., 2020, 233, 115996 CrossRef CAS.
- V. Kumari, S. Yadav, J. Jindal, S. Sharma, K. Kumari and N. Kumar, Adv. Powder Technol., 2020, 31, 2658–2668 CrossRef CAS.
- D. Gupta, R. Chauhan, N. Kumar, V. Singh, V. C. Srivastava, P. Mohanty and T. K. Mandal, J. Environ. Manage., 2020, 258, 110032 CrossRef CAS PubMed.
- Y. Liu, H. Liu, Q. Zhang and T. Li, RSC Adv., 2017, 7, 3515–3520 RSC.
- H. F. Greer, W. Zhou, G. Zhang and H. Ménard, Adv. Mater. Interfaces, 2017, 4, 1601238 CrossRef.
- N. Saito, K. Watanabe, H. Haneda, I. Sakaguchi and K. Shimanoe, J. Phys. Chem. C, 2018, 122, 7353–7360 CrossRef CAS.
- X. Gao, X. Liu, Z. Zhu, Y. Gao, Q. Wang, F. Zhu and Z. Xie, Sci. Rep., 2017, 7, 973 CrossRef PubMed.
- C. Ren, B. Yang, M. Wu, J. Xu, Z. Fu, Y. lv, T. Guo, Y. Zhao and C. Zhu, J. Hazard. Mater., 2010, 182, 123–129 CrossRef CAS PubMed.
- C. Yu, K. Yang, Y. Xie, Q. Fan, J. C. Yu, Q. Shu and C. Wang, Nanoscale, 2013, 5, 2142–2151 RSC.
- X. Zhu, J. Wang, D. Yang, J. Liu, L. He, M. Tang, W. Feng and X. Wu, RSC Adv., 2021, 11, 27257–27266 RSC.
- A. Eka Putri, L. Roza, S. Budi, A. Ali Umar and V. Fauzia, Appl. Surf. Sci., 2021, 536, 147847 CrossRef CAS.
- N. A. F. Al-Rawashdeh, O. Allabadi and M. T. Aljarrah, ACS Omega, 2020, 5, 28046–28055 CrossRef CAS PubMed.
- Y.-P. Zhu, M. Li, Y.-L. Liu, T.-Z. Ren and Z.-Y. Yuan, J. Phys. Chem. C, 2014, 118, 10963–10971 CrossRef CAS.
- Y. Fu, C. Chang, P. Chen, X. Chu and L. Zhu, J. Hazard. Mater., 2013, 254-255, 185–192 CrossRef CAS PubMed.
- Y. Wu, C. Cao, C. Qiao, Y. Wu, L. Yang and W. Younas, J. Mater. Chem. C, 2019, 7, 10613–10622 RSC.
- S. A. Ansari, S. G. Ansari, H. Foaud and M. H. Cho, New J. Chem., 2017, 41, 9314–9320 RSC.
- Y. Zhang, J. Zhou, X. Chen, Q. Feng and W. Cai, J. Alloys Compd., 2019, 777, 109–118 CrossRef CAS.
- J. Louis, M. K. Kavitha, V. Anjana, M. K. Jayaraj and H. John, Mater. Res. Express, 2020, 6, 1250i1254 Search PubMed.
- Y.-X. Wang, J. Sun, X. Fan and X. Yu, Ceram. Int., 2011, 37, 3431–3436 CrossRef CAS.
- S. Li, X. Zhang and L. Zhang, J. Phys. Chem. C, 2010, 114, 10379–10385 CrossRef CAS.
- C. Qian, J. Yin, J. Zhao, X. Li, S. Wang, Z. Bai and T. Jiao, Colloids Surf., A, 2021, 610, 125752 CrossRef CAS.
- F. K. Konan, J. S. N'Cho, H. J. T. Nkuissi, B. Hartiti and A. Boko, Mater. Chem. Phys., 2019, 229, 330–333 CrossRef CAS.
- X. Zhang, J. Qin, R. Hao, L. Wang, X. Shen, R. Yu, S. Limpanart, M. Ma and R. Liu, J. Phys. Chem. C, 2015, 119, 20544–20554 CrossRef CAS.
- H. Pan, J. B. Yi, L. Shen, R. Q. Wu, J. H. Yang, J. Y. Lin, Y. P. Feng, J. Ding, L. H. Van and J. H. Yin, Phys. Rev. Lett., 2007, 99, 127201 CrossRef CAS PubMed.
- W. Yu, J. Zhang and T. Peng, Appl. Catal., B, 2016, 181, 220–227 CrossRef CAS.
- E. Gunasekaran, M. Ezhilan, G. K. Mani, P. Shankar, A. J. Kulandaisamy, J. B. B. Rayappan and K. J. Babu, Semicond. Sci. Technol., 2018, 33, 095005 CrossRef.
- T. Hurma and M. Caglar, Mater. Sci. Semicond. Process., 2020, 110, 104949 CrossRef CAS.
- A. M. Abdullah, N. J. Al-Thani, K. Tawbi and H. Al-Kandari, Arabian J. Chem., 2016, 9, 229–237 CrossRef CAS.
- B. T. Gadisa, S. K. Kassahun, R. Appiah-Ntiamoah and H. Kim, J. Colloid Interface Sci., 2020, 570, 251–263 CrossRef CAS PubMed.
- S. Liu, C. Li, J. Yu and Q. Xiang, CrystEngComm, 2011, 13, 2533–2541 RSC.
- M. Z. Hussain, A. Schneemann, R. A. Fischer, Y. Zhu and Y. Xia, ACS Appl. Energy Mater., 2018, 1, 4695–4707 CrossRef CAS.
- D. K. Mishra, J. Mohapatra, M. K. Sharma, R. Chattarjee, S. K. Singh, S. Varma, S. N. Behera, S. K. Nayak and P. Entel, J. Magn. Magn. Mater., 2013, 329, 146–152 CrossRef CAS.
- L. Zeng, W. Song, M. Li, D. Zeng and C. Xie, Appl. Catal., B, 2014, 147, 490–498 CrossRef CAS.
- J. Beltrán, C. Barrero and A. Punnoose, Phys. Chem. Chem. Phys., 2019, 21 Search PubMed.
- J. Wang, X. Liu, R. Li, P. Qiao, L. Xiao and J. Fan, Catal. Commun., 2012, 19, 96–99 CrossRef CAS.
Footnote |
| † Electronic supplementary information (ESI) available. See DOI: https://doi.org/10.1039/d2ma00098a |
| This journal is © The Royal Society of Chemistry 2022 |

