 Open Access Article
Diverse catalytic behavior of a dye-based polymer metal-free catalyst for hydrogen peroxide photoproduction†
Qiang
Hong‡
a,
Qingyao
Wu‡
b,
Zhenyu
Wu
a,
Yan
Liu
a,
Yi
Li
a,
Hui
Huang
 *a,
Yang
Liu
*a and
Zhenhui
Kang
 *ac
*ac
aInstitute of Functional Nano & Soft Materials (FUNSOM), Jiangsu Key Laboratory for Carbon-Based Functional Materials & Devices, Soochow University, 199 Ren’ai Road, Suzhou, 215123, China. E-mail: hhuang0618@suda.edu.cn; yangl@suda.edu.cn
bKey Laboratory of Chemical Biology of Hebei Province, College of Chemistry and Environmental Science, Hebei University, Baoding 071002, China
cMacao Institute of Materials Science and Engineering (MIMSE), MUST-SUDA Joint Research Center for Advanced Functional Materials, Macau University of Science and Technology, Taipa 999078, Macao, China. E-mail: zhkang@suda.edu.cn
First published on 5th April 2022
Abstract
Metal-free polymer-based catalysts have shown promising photocatalytic performance for efficient hydrogen peroxide (H2O2) photoproduction under visible light. However, the structure of the active site and the interface charge transfer of these catalysts have not been revealed clearly. Here, we report the fabrication of four narrow bandgap single-dye-based polymer metal-free catalysts (PPC-X, X = 75, 100, 125, 175). The catalyst PPC-X was synthesized by a hydrothermal method using proanthocyanidin (OPC) as the raw material. The reaction temperature was set at 75 °C, 100 °C, 125 °C, and 175 °C, and finally, the single-dye polymer catalyst was obtained, which was marked as PPC-X, with X representing the polymerization temperature. The PPC-X as catalysts show diverse catalytic behavior for H2O2 photoproduction. Under visible light excitation, the PPC-X catalysts (X = 100, 125, 175) reduced O2 to produce H2O2via the two-electron transfer pathway and oxidized water to release O2 by the four-electron transfer pathway. For the PPC-75 catalyst, O2 was reduced by photo-generated electrons on the catalyst surface via the two-electron transfer pathway, while the PPC-75 catalyst itself also serves as a sacrificial agent to consume the photo-generated holes, leading to a high H2O2 production. The H2O2 yield of PPC-75 is 1152 μmol g−1 h−1, and that of PPC-100 is up to 1214 μmol g−1 h−1 at a light intensity of 32.6 mW cm−2. This work provides a practical research example and idea for the in-depth understanding and design of efficient polymer-based photocatalysts.
1. Introduction
Hydrogen peroxide (H2O2), as a clean high-energy oxidant, has been widely used in medicine, chemistry, and environmental management.1–5 Moreover, it has attracted more and more attention in the past decade because of its potential to replace fossil fuels.6–10 The synthesis of H2O2 through photocatalysis and direct conversion of solar energy into chemical energy is a cost-effective, safe and green production route.11–14 Previous studies have shown that metal–semiconductor catalysts have achieved remarkable progress in the photosynthesis of H2O2.15–19 Typically, the catalysts for the photoproduction of H2O2 can be divided into metal catalysts and metal-free catalysts. Metal-free catalysts are regarded as promising catalysts due to their low cost, environmental friendliness, and sustainability.20–25 Metal-free catalysts are mainly carbon-based materials such as g-C3N4, GO, CDs, COFs, and metal-free polymer catalysts.26–31 At present, the generation of H2O2 with metal-free photocatalysts represented by modified g-C3N4 is much higher among all kinds of semiconductor materials; for example, the H2O2 production rate of the catalyst obtained through the hybridization of g-C3N4 with CNTs is 32.6 μmol h−1.31–34 In addition to g-C3N4, there are several kinds of metal-free polymer catalysts with excellent photocatalytic performance.35,36 Shiraishi et al. reported a metal-free catalyst, resorcinol formaldehyde resins, for efficient H2O2 photoproduction, which has a strong absorption at 700 nm with a solar to chemical energy conversion rate (SCC) up to 0.5%.37 Liang et al. introduced acetylene or diacetylene moieties into covalent triazine frameworks, which promoted the charge separation in the conjugated structures, subsequently improving the catalytic efficiency.38 Moreover, in the polymer-based metal-free catalyst system, numerous issues, such as the active site structure, reaction mechanism, and catalyst interface charge transfer, have not been revealed clearly.In this study, we selected the organic dye molecule (proanthocyanidin, OPC) as the raw material and fabricated the narrow bandgap single-dye-based polymer metal-free catalysts (PPC-X; X denotes the reaction temperature) by a hydrothermal self-polymerization method. In the present system, the H2O2 yield of PPC-75 is 1152 μmol g−1 h−1, and that of the best sample PPC-100 is 1214 μmol g−1 h−1 at a light intensity of 32.6 mW cm−2. We used cyclic voltammetry (CV) and transient photovoltage (TPV) tests to reveal the diverse catalytic behavior of dye-based polymer metal-free catalysts for H2O2 photoproduction. Under visible light excitation, the catalyst PPC-X (X = 100, 125, 175) reduced O2 to produce H2O2via the two-electron transfer pathway and oxidized water to release O2 by the four-electron transfer pathway. For the PPC-75 catalyst, the O2 was reduced by photo-generated electrons on the catalyst surface via the two-electron transfer pathway, while, the PPC-75 catalyst itself also serves as a sacrificial agent for consuming the photo-generated holes, leading to a high H2O2 production.
2. Experimental section
2.1 Materials
Proanthocyanidin (AR, 98%) was purchased from Shanghai Yuanye Biotechnology Co, Ltd. Ethanol (AR, 98%) and sulfuric acid (AR, 98%) were purchased from Shanghai Aladdin Biochemical Technology Co, Ltd. All reagents were used without further purification.2.2 Synthetic strategy
Using an ethanol/water mixture as solvent, the catalyst (PPC-X, X = 75, 100, 125, 175) was synthesized by a hydrothermal method. The specific synthesis process is as follows: first, 0.2 g of proanthocyanidin (OPC) was added to 4.5 mL ultrapure water, followed by 0.5 mL ethanol and 1 mL sulfuric acid solution (3 mol L−1), and sonicated for 20 min. The resulting mixed solution was transferred to a hydrothermal reaction vessel and sealed. Finally, the sealed reaction vessel was hydrothermally reacted at different temperatures for 10 h, and the reaction temperature was set to 75 °C, 100 °C, 125 °C, and 175 °C, respectively. After the reaction was complete, it was allowed to naturally cool to room temperature. The precipitate in the reactor was washed with ultra-pure water and centrifuged, and this was repeated three times. The washed precipitate was then dried at 60 °C for 36 h. Finally, the obtained polymer was ground to obtain a powdery single-dye polymer, labeled PPC-X, where X represents the polymerization temperature.3. Results and discussion
3.1 Morphology and structure
The morphology of the catalyst was observed by a scanning electron microscope (SEM). It can be seen from Fig. 1(a)–(d) that the polymer PPC-X obtained at different polymerization temperatures is composed of microspheres. However, by comparison, it can be found that the catalyst polymerized at a lower temperature (PPC-75) has better dispersion than that polymerized at higher temperatures. The catalyst polymerized at a high temperature (PPC-175) has a wide range of agglomeration phenomena. Fig. 1(e) shows the X-ray diffraction (XRD) patterns of the single dye polymer catalysts PPC-X, where the diffraction peaks at 21° and 45° demonstrate that PPC-X was amorphous.39,40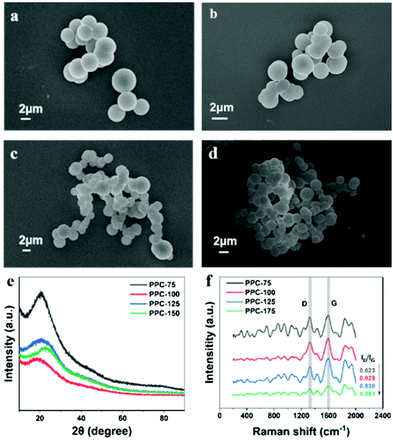 | ||
| Fig. 1 SEM images of (a) PPC-75, (b) PPC-100, (c) PPC-125 and (d) PPC-175 catalysts. (e) XRD patterns, and (f) Raman spectra of PPC-X catalysts (X = 75, 100, 125, 175). | ||
Fig. 1(f) shows the Raman spectra of catalysts PPC-X, which displays two peaks centered at 1360 cm−1 and 1600 cm−1, corresponding to the D band with sp3 defect and the G band caused by the in-plane vibration of sp2 carbon. The ratio of the D band to G band (ID/IG) indicates the defect characteristics of the catalyst. As shown in Fig. 1(f), the ID/IG ratio increases with the increase in temperature, which indicates that defects are more likely to occur at high temperatures. Therefore, when the temperature is too high, there are likely to be numerous defects, which is not conducive to the catalytic performance of the sample. The Fourier transform infrared spectroscopy in Fig. S1(a) (ESI†) indicates that the single dye polymer catalyst (PPC-X) obtained at different polymerization temperatures has similar infrared spectra, and the surface of the materials contains functional groups such as C–O, C![[double bond, length as m-dash]](https://www.rsc.org/images/entities/char_e001.gif) C, C
C, C![[double bond, length as m-dash]](https://www.rsc.org/images/entities/char_e001.gif) O, and C–OH bonds. Fig. S1(b), ESI† shows the FT-IR spectra of OPC and PPC-100. It can be seen from the FT-IR spectrum of OPC that it contains functional groups such as C–O, –Ph, and C–OH bonds. Compared with the FT-IR spectrum of OPC, the FT-IR spectrum of PPC-100 has a slight difference, with the peak at 1650 cm−1 corresponding to the C
O, and C–OH bonds. Fig. S1(b), ESI† shows the FT-IR spectra of OPC and PPC-100. It can be seen from the FT-IR spectrum of OPC that it contains functional groups such as C–O, –Ph, and C–OH bonds. Compared with the FT-IR spectrum of OPC, the FT-IR spectrum of PPC-100 has a slight difference, with the peak at 1650 cm−1 corresponding to the C![[double bond, length as m-dash]](https://www.rsc.org/images/entities/char_e001.gif) O bond of the catalyst. The morphology of the single-dye polymer catalyst was further analyzed by transmission electron microscopy, and the results are shown in Fig. S2(a), ESI.† It can be seen that the surface of the microspheres composed of the polymer PPC-100 is relatively smooth, accompanied by some lamellar structures peeled off from the microspheres in the catalyst. Fig. S2(b) (ESI†) shows the particle size distribution of the single-dye polymer PPC-100, indicating that the average particle size of the polymer is mainly about 2500 nm.
O bond of the catalyst. The morphology of the single-dye polymer catalyst was further analyzed by transmission electron microscopy, and the results are shown in Fig. S2(a), ESI.† It can be seen that the surface of the microspheres composed of the polymer PPC-100 is relatively smooth, accompanied by some lamellar structures peeled off from the microspheres in the catalyst. Fig. S2(b) (ESI†) shows the particle size distribution of the single-dye polymer PPC-100, indicating that the average particle size of the polymer is mainly about 2500 nm.
The functional groups and bond energies of the catalysts were further analyzed by X-ray photoelectron spectroscopy (XPS). Fig. 2 shows the C 1s spectra of different catalysts. It can be seen from Fig. 2 that the C 1s spectra of the catalysts obtained at different temperatures can be fitted to four peaks located at 284.6, 285.3, 286.3, and 288.2 eV, corresponding to the C![[double bond, length as m-dash]](https://www.rsc.org/images/entities/char_e001.gif) C, C–C, C–O and C
C, C–C, C–O and C![[double bond, length as m-dash]](https://www.rsc.org/images/entities/char_e001.gif) O of the polymer components.41,42 From the C 1s spectra of OPC in Fig. S8 (ESI†), it can be seen that the C 1s spectra of the catalysts obtained at different temperatures can be fitted into three peaks located at 284.6, 285.3, and 286.3 eV, corresponding to the C
O of the polymer components.41,42 From the C 1s spectra of OPC in Fig. S8 (ESI†), it can be seen that the C 1s spectra of the catalysts obtained at different temperatures can be fitted into three peaks located at 284.6, 285.3, and 286.3 eV, corresponding to the C![[double bond, length as m-dash]](https://www.rsc.org/images/entities/char_e001.gif) C, C–C, and C–O components of the polymer. This result is consistent with the FT-IR spectra. The elemental analysis in Table S1 (ESI†) shows that all catalysts were composed of C, H, O, and S, and the S comes from the residual sulfuric acid on the surface of the catalyst. Simultaneously, it can be seen that the content of C in the polymer increases first and then decreases with the increase in the polymerization temperature, and reaches a maximum value when the polymerization temperature is 100 °C. The thermogravimetric spectrum of PPC-100 is shown in Fig. S7 (ESI†). When the temperature reaches 900 °C, the decomposition of PPC-100 is complete, and the carbon content was found to be 27.60%.
C, C–C, and C–O components of the polymer. This result is consistent with the FT-IR spectra. The elemental analysis in Table S1 (ESI†) shows that all catalysts were composed of C, H, O, and S, and the S comes from the residual sulfuric acid on the surface of the catalyst. Simultaneously, it can be seen that the content of C in the polymer increases first and then decreases with the increase in the polymerization temperature, and reaches a maximum value when the polymerization temperature is 100 °C. The thermogravimetric spectrum of PPC-100 is shown in Fig. S7 (ESI†). When the temperature reaches 900 °C, the decomposition of PPC-100 is complete, and the carbon content was found to be 27.60%.
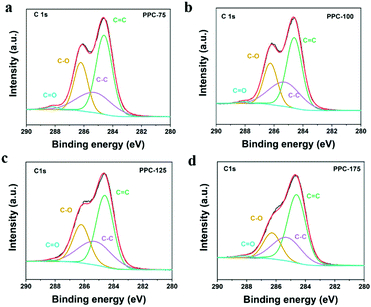 | ||
| Fig. 2 C 1s spectra of PPC-X catalysts. (a), (b), (c) and (d) for PPC-75, PPC-100, PPC-125 and PPC-175, respectively. | ||
3.2 Band structure
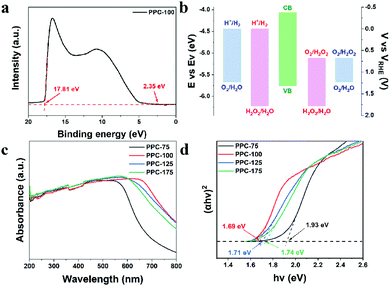
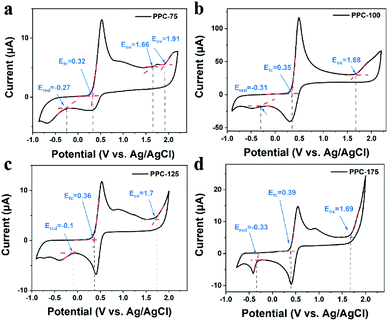
To determine the band location of the catalyst, the ionization potential of catalyst PPC-100 was determined by ultraviolet photoelectron spectroscopy (UPS) to further explore the band structure of the sample. As shown in Fig. 3(a), the valence band (VB) position of the catalyst PPC-100 can be obtained at 5.76 eV by subtracting the spectral width of the ultraviolet photoelectron spectrum of He I from the excitation energy (21.22 eV); the conduction band (CB) position can be further calculated at 4.07 eV through the bandgap.43 To better display the relationship between the conduction band/valence band of the catalyst and the redox potential of H2O and O2, the unit is converted from eV into electrochemical potential energy V according to the reference standard, where 0 V (vs. RHE) equals −4.44 eV (vs. Evac). As shown in Fig. 3(b), the CB of single-dye polymer PPC-100 is higher than the level of H2O2 produced by oxygen reduction, and the VB is lower than the level of O2 produced by water oxidation, but it cannot reach the level of H2O2 produced by water oxidation. Therefore, it can be inferred that the catalyst can theoretically achieve the reduction reaction of O2 and the oxidation reaction of water. Fig. 3(c) shows the UV-Vis absorption spectra of the catalysts PPC-X. It can be seen from the figure that the as-prepared single-dye polymer photocatalyst PPC-X has strong absorption in the ultraviolet and near-infrared regions, and its absorption value reaches a maximum value at about 600 nm, indicating that the catalyst can effectively utilize solar energy. In addition, it can also be seen from Fig. 3(c) that with the increase in the polymerization temperature, the optimal absorption wavelength of the catalyst first increases and then decreases, and the optimal absorption wavelength can reach 640 nm for PPC-100. The Tauc diagram obtained by the UV-Vis absorption spectrum can be used to calculate the optical band gap of a catalyst.24,44 The (αhν)2–hν curve obtained by the UV-Vis absorption spectrum is shown in Fig. 3(d). The curve shows a good linear relationship, indicating that photocatalyst PPC-X is a direct bandgap material. The bandgap of photocatalyst PPC-100 is 1.69 eV. The bandgap of photocatalyst PPC-175 is 1.93 eV. A low bandgap is more favorable for the generation of photogenic charge, which improves the photocatalytic activity of the catalyst and completes the conversion of solar energy.Due to the existence of defects in carbon materials, they have different band gaps. The oxidation and reduction state of catalysts can be studied by cyclic voltammetry (CV), and the band structure of the catalyst can be further deduced. Fig. 4 shows the CV curve of catalysts PPC-X. It can be seen from Fig. 4(a) that PPC-75 has multiple oxidation peaks, which are 1.66 and 1.91 V. However, other catalysts PPC-100, PPC-125, and PPC-175 have only one, at 1, 68, 1.7 and 1.69 V, respectively. The multiple oxidation levels occurring in the catalyst PPC-75 are due to the unfixed type of defects.
3.3 Photochemical properties
As shown in Fig. S3 (ESI†), all PPC-X samples generated photocurrent once exposed to light, indicating that all the polymer catalysts generate photocarriers under light conditions. In addition, by comparing the samples obtained at different temperatures, it was found that catalyst PPC-100 produced the maximum photocurrent under light conditions, while catalyst PPC-175 produced the minimum photocurrent under the light conditions, indicating that catalyst PPC-100 has the best photoresponse performance, which provides a basis for its photocatalytic application.3.4 The transient photovoltage (TPV) measurements
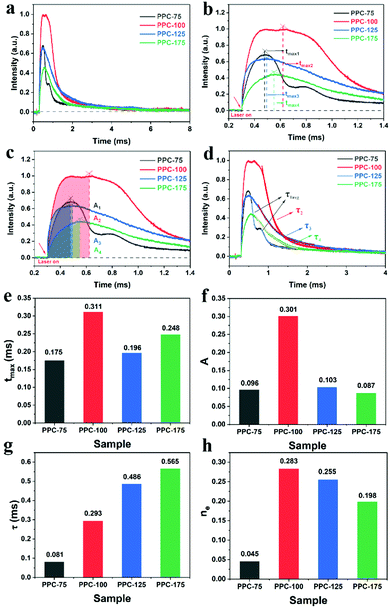
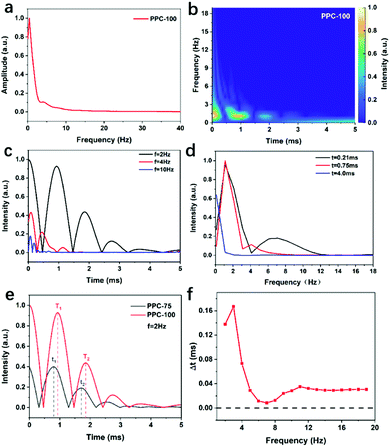
As shown in Fig. 5(a), PPC-100 has the strongest photovoltage, indicating that after excitation, PPC-100 generates more photo-charge compared to other catalysts, which is conducive to oxygen reduction in the H2O2 generation process. As shown in Fig. 5(b), tmax represents the time required from lighting up to maximum charge extraction. There is no significant difference between each catalyst, indicating that there is little difference in the photo-charge transfer rate. Fig. 5(c) shows the maximum charge extraction amount A, which represents the maximum value of photogenerated charge excited on the surface of the catalyst. In Fig. 5(f), the A value of PPC-100 is significantly higher than that of PPC-75 (A1 = 0.098), PPC-125 (A3 = 0.108), and PPC-175 (A4 = 0.087), indicating that PPC-100 had better photo-charge extraction ability. Fig. 5(d) shows the τ values of different catalysts. Here, τ represents the time decay constant of the photo-charge. The larger the τ value is, the longer the lifetime of the photo-charge is.45 It can be seen from Fig. 5(d) that PPC-100, PPC-125, and PPC-175 have only one attenuation stage, while PPC-75 has two attenuation stages, which are composed of a fast decay process (τ1 = 0.066 ms) and a slow decay process (τ2 = 0.168 ms), which may be related to the heterogeneity of components. The average decay constant of PPC-75 (τ2avg = 0.081 ms) is calculated by a formula in ESI.†The signal characteristics of TPV indicate that it is a typical non-static signal. Fig. 6(a) shows the FFT curve of PPC-100. It can be seen that the curve reaches its maximum amplitude when the frequency is close to zero, which is a typical non-static signal characteristic. To further analyze the frequency and time characteristics of this non-static signal, we adopted the continuous wavelet transform (CWT) based on Bior3.9 to analyze both time and frequency scales.46 We selected three frequencies f = 2 Hz, f = 4 Hz, and f = 10 Hz, and the CWT signal in the whole-time scale is shown in Fig. 6(c). When f = 2 Hz, it has signal distribution in the time range from 0 to 5 ms, indicating that both the fast and slow process of charge transfer plays an important role in the overall process. When f = 4 Hz, the CWT signal range is 0–1.4 ms, indicating that the fast electron transfer process occupies the main part of charge transfer. When f = 10 Hz, the CWT signal only exists in the range of 0–0.4 ms, which proves that the fast electron transfer process only exists in the initial stage of the charge transfer process. Fig. 8(d) shows CWT signals at t = 0.21 ms, t = 0.75 ms, and t = 4.0 ms in different frequency ranges. When t = 0.21 ms, signals exist in the range of 0–12 Hz, indicating that charge transfer is composed of both fast and slow processes. However, when t = 0.75 ms, the signal range is reduced to 0–8 Hz, and the signal at this time is mainly a medium and low-frequency signal. As time continues to increase to t = 4 ms, only the low-frequency part (0–2 Hz) of the signal in Fig. 8(d) is left, and almost the whole charge transmission process is composed of the slow process.
We used the peak delay time (ΔT) of the intensity time curve to study the charge transfer process between the catalyst interfaces and determined the speed of the charge transfer process. Fig. 6(e) shows the comparison between the peak position of PPC-75 and PPC-100 at f = 2 Hz, and we observed the time scale delay of the peak position of PPC-100.47Fig. 6(f) shows the relationship between its peak delay time (ΔT) and frequency (see ESI† for the specific calculation method). It can be seen that the peak delay time (ΔT) is greater than zero in all frequency ranges, and the peak delay time (ΔT) of PPC-100, PPC125 and PPC-175 is also greater than zero in all frequency ranges (Fig. S4–S6, ESI†). These results indicate that the charge transfer process of PPC-100 is slower than that of the catalysts at other temperatures, and the slower charge transfer is helpful to the improvement of photogenic electron stability and catalytic activity.
3.5 Photocatalytic experiments
In the photocatalytic experiments, a multi-channel photocatalytic reaction system was used to evaluate the photocatalytic activity of the catalyst in a 40 mL glass bottle reactor with a visible light source, and the wavelength of visible light was λ ≥ 420 nm, without adding any sacrificial agent or cocatalyst. In a typical catalytic reaction process, 10 mg catalyst was dispersed in 20 mL ultrapure water for 10 min by ultrasound, and then the reactor was placed in a multi-channel photocatalytic reaction system and exposed to visible light for 6 h at room temperature. After the reaction, the reaction solution was centrifuged and filtered, and then the H2O2 in the filtrate was quantitatively analyzed.For the stability of the catalyst catalyzed reaction, the reactor was shaded and settled for 12 h after each illumination. After that, 10 mL supernatant was filtered to measure its hydrogen peroxide yield. The remaining solution and catalyst were dried thoroughly and then the cycling experiment was carried out. The cycle was repeated 5 times, each time under the same conditions, and the quantitative determination of hydrogen peroxide was carried out after each experiment.
According to the influence of the wavelength of light on the yield of H2O2 catalyzed by the catalyst, light source with different wavelengths was used to illuminate the catalyst, and the wavelengths were 365, 420, 485, 595, and 620 nm respectively. The reaction system comprised 10 mg PPC-100 dispersed in 20 mg ultrapure water, and the reaction time was 6 h. After the reaction, the yield of H2O2 in the system was quantitatively determined. To study the effects of different atmospheres on the yield of H2O2, gas bubbles were used to create different atmospheres. The reaction system with 10 mg catalyst was bubbled with N2 and O2 for 20 min to create an N2 and O2 saturated atmosphere. Then, the reaction system was sealed and placed in a multi-channel photocatalytic reaction system for 6 h. H2O2 in the system was quantitatively determined after the reaction. To analyze the effect of adding a sacrificial agent on H2O2 production. Electron sacrificial agent, hole sacrificial agent, superoxide free radical capture agent, and hydroxyl free radical capture agent were added to the reaction system, respectively. During the reaction, 0.2 mmol of silver nitrate (AgNO3), methanol (CH3OH), benzoquinone (BQ), and tert-butanol (TBA) were added to the reaction system. H2O2 in the system was quantitatively determined after 6 h illumination. To validate the effect of the reaction environment on the catalytic activity of the catalyst, N2, and O2 bubbles were used to create different reaction environments. Taking N2 as an example, the reaction system with dispersed catalyst PPC-100 was bubbled with N2 for 30 min, so that the solution reached N2 saturation. The reactor was then sealed and placed under visible light for 6 h. After the reaction, the H2O2 in the filtrate was quantitatively analyzed. For all the above methods, the quantitative determination of H2O2 was carried out using KMnO4 titration. During the titration process, 10 mL of the filtered solution after completion of the reaction, was collected and titrated with 0.02 mol L−1 of KMnO4 standard solution (KMnO4![[thin space (1/6-em)]](https://www.rsc.org/images/entities/char_2009.gif) :
:![[thin space (1/6-em)]](https://www.rsc.org/images/entities/char_2009.gif) H2SO4 = 1
H2SO4 = 1![[thin space (1/6-em)]](https://www.rsc.org/images/entities/char_2009.gif) :
:![[thin space (1/6-em)]](https://www.rsc.org/images/entities/char_2009.gif) 1) until the solution turned red and did not fade for 30 s. Finally, the amount of H2O2 produced in the catalytic system was calculated according to the volume of potassium permanganate used in the titration.
1) until the solution turned red and did not fade for 30 s. Finally, the amount of H2O2 produced in the catalytic system was calculated according to the volume of potassium permanganate used in the titration.
3.6 Evaluation of catalytic activity
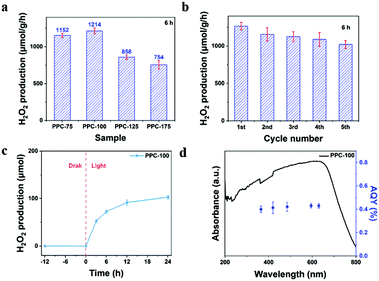
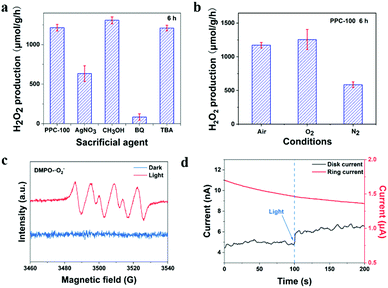
First, the photocatalytic activity of PPC-X was studied under different polymerization temperatures. As shown in Fig. 7(a), the catalyst PPC-100 obtained at the polymerization temperature of 100 °C had the highest catalytic activity, and its yield reached 1214 μmol g−1 h−1. With the increase in the polymerization temperature, the catalytic activity of the obtained catalyst decreased. Among the as-prepared catalysts, catalyst PPC-175 had the lowest activity. It is worth noting that the H2O2 yield of PPC-75 is not significantly different from that of PPC-100, which is inconsistent with its less effective charge (ne). Combined with the CV curve, we propose that the partially unoxidized part may act as a sacrificial agent, leading to higher H2O2 production. In addition, the conversion efficiency of solar energy to chemical energy (SCC) was calculated, and the SCC of the PPC-100 catalyst reached 0.15% (see ESI† for calculation details). Fig. 7(b) shows the cycling stability of the catalyst. It can be seen from Fig. 7(b) that the activity of the catalyst remains unchanged within the fifth cycle. In the fifth cycle, the H2O2 synthesis rate of catalyst PPC-100 was maintained at 1021 μmol g−1 h−1. The results indicate that the single dye polymer PPC-100 has good photocatalytic stability. The FT-IR spectra of fresh PPC-100 and recovered PPC-100 are shown in Fig. S1(c) (ESI†). It can be seen that compared with the fresh PPC-100, the structure/functional groups of recovered PPC-100 have not changed. Fig. 7(c) shows the relationship between the amount of H2O2 synthesis and the time of catalyst PPC-100 in the photocatalytic reaction. As shown in Fig. 7(c), no H2O2 was detected under dark conditions, indicating the result of the photocatalytic reaction of catalyst when H2O2 is generated. Under light conditions, the yield of H2O2 increases linearly with the increase in time, indicating the dependence of the catalytic reaction on light, and also indicating the stability and persistence of the catalytic reaction. Fig. 9(d) shows the calculated apparent quantum yield of single-dye polymer PPC-100 at different wavelengths. It can be seen from the figure that the AQY value of catalyst PPC-100 at the wavelength 595 nm is the largest, reaching up to 0.43% (see ESI† for calculation details). In addition, by comparing the UV-visible absorption spectra of AQY with the catalyst at different wavelengths, it can be seen that the variation trend of AQY is consistent with the UV absorption, indicating that the catalyst carries out the photocatalytic reaction through bandgap excitation.Fig. 8(a) reveals the yield of H2O2 under different sacrificial additives. Among them, AgNO3, CH3OH, benzoquinone (BQ), and tert-butanol (TBA) were used as the trapping agents of electrons (e−), hole (h+), superoxide radical (˙O2−), and hydroxyl radical (˙OH), respectively.48,49 As shown in the figure, the yield of H2O2 decreased significantly with the addition of AgNO3. The yield of H2O2 increased with the addition of CH3OH. It can be said that H2O2 is formed by the reaction in which electrons are involved. When electrons are consumed, the activity decreases, while when holes are captured, the separation efficiency of photogenerated charge is improved, resulting in a higher H2O2 yield. In addition, when benzoquinone was added, the content of H2O2 in the reaction solution was very low, and the addition of tert-butanol had almost no effect on the catalytic activity of PPC-100. These results indicate that when catalyst PPC-100 performs photocatalytic reaction, photogenerated electrons reduce O2, producing H2O2 (O2 → ˙O2− → H2O2) and photogenerated holes participate in the water oxidation reaction, releasing O2 (H2O → O2).
The catalytic activity of single dye catalyst PPC-100 in different atmospheres was studied. As shown in Fig. 8(b), the yield of H2O2 increased in the O2 environment, while that in nitrogen was greatly reduced. This is because, in the O2 saturated environment, sufficient O2 ensures the oxygen reduction reaction, improving the electron utilization efficiency, and then increasing the yield of H2O2. In the N2 saturated environment, O2 is mainly generated by the oxidation reaction of water, and this O2 then participates in the oxygen reduction reaction to produce H2O2. Due to the limitation of the water oxidation rate and oxygen content, the catalytic activity of the catalyst is limited, and the yield of H2O2 decreases. Therefore, it can be preliminarily inferred that the photocatalytic reaction is the oxygen reduction reaction involving O2.
The free radicals in the reaction were further confirmed by electron paramagnetic resonance. As shown in Fig. 8(c), under dark conditions, no superoxide radical was detected, while under light conditions, four distinct superoxide radical signals were observed. The results show that the photocatalytic reaction of PPC-100 is the reaction of H2O2 production oxygen reduction. The process of H2O2 production was further confirmed by the rotating ring electrode. As shown in Fig. 8(d), in pure water saturated with N2, the disk current of the rotating ring disk electrode increased significantly after the addition of light, while the ring current did not change after the addition of light. Alternatively, during the oxidation of water, no H2O2 is produced. The number of electrons transferred in the process of water oxidation is 4.50 The results show that the oxidation of water only releases O2 but does not produce H2O2.
Based on the above results and analysis, a catalytic mechanism for single dye polymer catalysts PPC-75 and PPC-100 was proposed. As shown in Fig. 9(a), the catalyst generates a photogenerated charge under light excitation. The conduction band electrons react with O2 in the water, reducing O2 to H2O2. The holes in the valence band participate in the oxidation reaction of water, releasing O2. The reaction mechanism of PPC-75 is shown in Fig. 9(b). Oxygen reduction produces hydrogen peroxide in the same way as PPC-100, but the reaction of water oxidation depletion holes is partially replaced by catalyst self-sacrifice, which corresponds to a two-stage attenuation in the TPV test, as shown in Fig. 7(a). Moreover, due to the presence of the self-sacrificial reaction, the hydrogen peroxide production of PPC-75 increases significantly, second only to that of PPC-100.
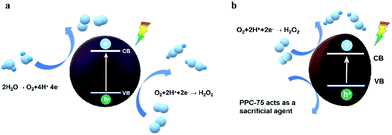 | ||
| Fig. 9 (a) The mechanism diagram of photocatalytic H2O2 production over the PPC-100 photocatalyst. (b) Possible mechanism diagram of photocatalytic H2O2 production over the PPC-75 photocatalyst. | ||
4. Conclusions
In this study, single-dye polymer catalyst PPC-X was designed and synthesized by a hydrothermal polymerization method, in which, the catalyst PPC-100 shows the best catalytic activity for H2O2 photoproduction. The conversion efficiency of solar energy to hydrogen energy of the PPC-100 catalyst reached 0.15% at the light intensity of 32.6 mW cm−2, and the production rate of H2O2 reached 1214 μmol g−1 h−1. Combined with various characterization and transient photovoltage tests, the diverse catalytic behavior of the dye-based polymer metal-free catalysts as well as the photocatalytic reaction mechanism was demonstrated. Under light excitation, for PPC-100, PPC-125, and PPC-175, the catalyst reduced O2 to produce H2O2 through the two-electron transfer pathway and oxidized water to release O2 through the four-electron transfer pathway. For the PPC-75 catalyst, the O2 was reduced by photo-generated electrons on the catalyst surface via the two-electron transfer pathway, while the PPC-75 catalyst itself also served as a sacrificial agent. This work provides a practical research example and idea for an in-depth understanding and design of efficient polymer-based photocatalysts.Author contributions
The manuscript was written through contributions of all authors. All authors have given approval to the final version of the manuscript.Conflicts of interest
The authors declare no conflict of interest.Acknowledgements
This work is supported by National Key R&D Program of China (2020YFA0406104, 2020YFA0406101), National MCF Energy R&D Program of China (2018YFE0306105), Innovative Research Group Project of the National Natural Science Foundation of China (51821002), National Natural Science Foundation of China (51725204, 21771132, 51972216, 52041202), Natural Science Foundation of Jiangsu Province (BK20190041), Key-Area Research and Development Program of Guangdong Province (2019B010933001), Collaborative Innovation Center of Suzhou Nano Science & Technology, the 111 Project, and Suzhou Key Laboratory of Functional Nano & Soft Materials.References
- X. Chen, Y. Kondo, Y. Kuwahara, K. Mori, C. Louis and H. Yamashita, Metal–organic framework-based nanomaterials for photocatalytic hydrogen peroxide production, Phys. Chem. Chem. Phys., 2020, 22, 14404–14414 RSC.
- H. Song, L. Wei, C. Chen, C. Wen and F. Han, Photocatalytic production of H2O2 and its in situ utilization over atomic-scale Au modified MoS2 nanosheets, J. Catal., 2019, 376, 198–208 CrossRef CAS.
- Y. Peng, L. Wang, Y. Liu, H. Chen, J. Lei and J. Zhang, Visible-light-driven photocatalytic H2O2 production on g-C3N4 loaded with CoP as a noble metal free cocatalyst, Eur. J. Inorg. Chem., 2017, 4797–4802 CrossRef CAS.
- Z. Li, N. Xiong and G. Gu, Fabrication of a full-spectrum-response Cu2(OH)2CO3/g-C3N4 heterojunction catalyst with outstanding photocatalytic H2O2 production performance via a self-sacrificial method, Dalton Trans., 2018, 48, 182–189 RSC.
- S. Li, G. Dong, R. Hailili, L. Yang, Y. Li, F. Wang, Y. Zeng and C. Wang, Effective photocatalytic H2O2 production under visible light irradiation at g-C3N4 modulated by carbon vacancies, Appl. Catal., B, 2016, 190, 26–35 CrossRef CAS.
- Y. Wang, S. Hu, Q. Li, G. Gu, Y. Zhao, H. Liang and W. Li, One step synthesis of high-efficiency AgBr–Br-g-C3N4 composite catalysts for photocatalytic H2O2 production via two channel pathway, RSC Adv., 2018, 8, 36903–36909 RSC.
- G. Wu, S. Hu, Z. Han, C. Liu and Q. Li, The effect of Ni(I)–N active sites on the photocatalytic H2O2 production ability over nickel doped graphitic carbon nitride nanofibers, New J. Chem., 2017, 41, 15289–15297 RSC.
- Y. Fu, C. a. Liu, M. Zhang, C. Zhu, H. Li, H. Wang, Y. Song, H. Huang, Y. Liu and Z. Kang, Photocatalytic H2O2 and H2 generation from living chlorella vulgaris and carbon micro particle comodified g-C3N4, Adv. Energy Mater., 2018, 8, 1802525 CrossRef.
- C. Zhu, M. Zhu, Y. Sun, Y. Zhou, J. Gao, H. Huang, Y. Liu and Z. Kang, Carbon-supported oxygen vacancy-rich Co3O4 for robust photocatalytic H2O2 Production via coupled water oxidation and oxygen reduction reaction, ACS Appl. Energy Mater., 2019, 2, 8737–8746 CrossRef CAS.
- Y. Liu, Y. Zhao, Y. Sun, J. Cao, H. Wang, X. Wang, H. Huang, M. Shao, Y. Liu and Z. Kang, A 4e-2e- cascaded pathway for highly efficient production of H2 and H2O2 from water photo-splitting at normal pressure, Appl. Catal., B, 2020, 270, 118875 CrossRef CAS.
- L. Zheng, J. Zhang, Y. H. Hu and M. Long, Enhanced photocatalytic production of H2O2 by Nafion coatings on S,N-codoped graphene-quantum-dots-modified TiO2, J. Phys. Chem. C, 2019, 123, 13693–13701 CrossRef CAS.
- L. Yang, G. Dong, D. L. Jacobs, Y. Wang, L. Zang and C. Wang, Two-channel photocatalytic production of H2O2 over g-C3N4 nanosheets modified with perylene imides, J. Catal., 2017, 352, 274–281 CrossRef CAS.
- L. Zheng, H. Su, J. Zhang, L. S. Walekar, H. Vafaei Molamahmood, B. Zhou, M. Long and Y. H. Hu, Highly selective photocatalytic production of H2O2 on sulfur and nitrogen co-doped graphene quantum dots tuned TiO2, Appl. Catal., B, 2018, 239, 475–484 CrossRef CAS.
- J. Cao, H. Wang, Y. Zhao, Y. Liu, Q. Wu, H. Huang, M. Shao, Y. Liu and Z. Kang, Phosphorus-doped porous carbon nitride for efficient sole production of hydrogen peroxide via photocatalytic water splitting with a two-channel pathway, J. Mater. Chem. A, 2020, 8, 3701–3707 RSC.
- Y. Fu, C. a. Liu, C. Zhu, H. Wang, Y. Dou, W. Shi, M. Shao, H. Huang, Y. Liu and Z. Kang, High-performance NiO/g-C3N4 composites for visible-light-driven photocatalytic overall water splitting, Inorg. Chem. Front., 2018, 5, 1646–1652 RSC.
- Y. Yang, Z. Zeng, G. Zeng, D. Huang, R. Xiao, C. Zhang, C. Zhou, W. Xiong, W. Wang, M. Cheng, W. Xue, H. Guo, X. Tang and D. He, Ti3C2 Mxene/porous g-C3N4 interfacial Schottky junction for boosting spatial charge separation in photocatalytic H2O2 production, Appl. Catal., B, 2019, 258, 117956 CrossRef CAS.
- C. Zhu, C. a. Liu, Y. Fu, J. Gao, H. Huang, Y. Liu and Z. Kang, Construction of CDs/CdS photocatalysts for stable and efficient hydrogen production in water and seawater, Appl. Catal., B, 2019, 242, 178–185 CrossRef CAS.
- Z.-Q. Li, Y. Wang, Z.-Q. Wu, M.-Y. Wu and X.-H. Xia, Bioinspired multivalent ion responsive nanopore with ultrahigh ion current rectification, J. Phys. Chem. C, 2019, 123, 13687–13692 CrossRef CAS.
- M. Teranishi, R. Hoshino, S. Naya and H. Tada, Gold-nanoparticle-loaded carbonate-modified titanium(IV) oxide surface: Visible-light-driven formation of hydrogen peroxide from oxygen, Angew. Chem., Int. Ed., 2016, 55, 12773–12777 CrossRef CAS PubMed.
- H. Hou, X. Zeng and X. Zhang, Production of hydrogen peroxide by photocatalytic processes, Angew. Chem., Int. Ed., 2020, 59, 17356–17376 CrossRef CAS PubMed.
- Z. Mo, X. Zhu, Z. Jiang, Y. Song, D. Liu, H. Li, X. Yang, Y. She, Y. Lei, S. Yuan, H. Li, L. Song, Q. Yan and H. Xu, Porous nitrogen-rich g-C3N4 nanotubes for efficient photocatalytic CO2 reduction, Appl. Catal., B, 2019, 256, 117854 CrossRef CAS.
- Z. Li, Y. Zhi, P. Shao, H. Xia, G. Li, X. Feng, X. Chen, Z. Shi and X. Liu, Covalent organic framework as an efficient, metal-free, heterogeneous photocatalyst for organic transformations under visible light, Appl. Catal., B, 2019, 245, 334–342 CrossRef CAS.
- Z. Wei, M. Liu, Z. Zhang, W. Yao, H. Tan and Y. Zhu, Efficient visible-light-driven selective oxygen reduction to hydrogen peroxide by oxygen-enriched graphitic carbon nitride polymers, Energy Environ. Sci., 2018, 11, 2581–2589 RSC.
- Z. He, C. Kim, L. Lin, T. H. Jeon, S. Lin, X. Wang and W. Choi, Formation of heterostructures via direct growth CN on h-BN porous nanosheets for metal-free photocatalysis, Nano Energy, 2017, 42, 58–68 CrossRef CAS.
- K. Zhao, Y. Su, X. Quan, Y. Liu, S. Chen and H. Yu, Enhanced H2O2 production by selective electrochemical reduction of O2 on fluorine-doped hierarchically porous carbon, J. Catal., 2018, 357, 118–126 CrossRef.
- J. Liu, Y. Liu, N. Y. Liu, Y. Z. Han, X. Zhang, H. Huang, Y. Lifshitz, S. T. Lee, J. Zhong and Z. H. Kang, Metal-free efficient photocatalyst for stable visible water splitting via a two-electron pathway, Science, 2015, 347, 970–974 CrossRef CAS PubMed.
- S. Gogoi and N. Karak, Solar-driven hydrogen peroxide production using polymer-supported carbon dots as heterogeneous catalyst, Nano-Micro Lett., 2017, 9, 40 CrossRef PubMed.
- C. Krishnaraj, H. S. Jena, L. Bourda, A. Laemont, P. Pachfule, J. Roeser, C. V. Chandran, S. Borgmans, S. M. J. Rogge, K. Leus, C. V. Stevens, J. A. Martens, V. Van Speybroeck, E. Breynaert, A. Thomas and P. Van der Voort, Strongly reducing (diarylamino)benzene-based covalent organic framework for metal-free visible light photocatalytic H2O2 generation, J. Am. Chem. Soc., 2020, 142, 20107–20116 CrossRef CAS PubMed.
- W.-C. Hou and Y.-S. Wang, Photocatalytic generation of H2O2 by graphene oxide in organic electron donor-free condition under sunlight, ACS Sustainable Chem. Eng., 2017, 5, 2994–3001 CrossRef CAS.
- J. Xiong, X. Li, J. Huang, X. Gao, Z. Chen, J. Liu, H. Li, B. Kang, W. Yao and Y. Zhu, CN/rGO@BPQDs high-low junctions with stretching spatial charge separation ability for photocatalytic degradation and H2O2 production, Appl. Catal., B, 2020, 266, 118602 CrossRef CAS.
- L. Zhou, J. Lei, F. Wang, L. Wang, M. R. Hoffmann, Y. Liu, S.-I. In and J. Zhang, Carbon nitride nanotubes with in situ grafted hydroxyl groups for highly efficient spontaneous H2O2 production, Appl. Catal., B, 2021, 288, 119993 CrossRef CAS.
- S. Zhao, T. Guo, X. Li, T. Xu, B. Yang and X. Zhao, Carbon nanotubes covalent combined with graphitic carbon nitride for photocatalytic hydrogen peroxide production under visible light, Appl. Catal., B, 2018, 224, 725–732 CrossRef CAS.
- Y. Zhao, Y. Liu, J. Cao, H. Wang, M. Shao, H. Huang, Y. Liu and Z. Kang, Efficient production of H2O2via two-channel pathway over ZIF-8/C3N4 composite photocatalyst without any sacrificial agent, Appl. Catal., B, 2020, 278, 119829 Search PubMed.
- J. Zhang, C. Yu, J. Lang, Y. Zhou, B. Zhou, Y. H. Hu and M. Long, Modulation of Lewis acidic–basic sites for efficient photocatalytic H2O2 production over potassium intercalated tri-s-triazine materials, Appl. Catal., B, 2020, 277, 119225 CrossRef CAS.
- Y. L. Wong, J. M. Tobin, Z. Xu and F. Vilela, Conjugated porous polymers for photocatalytic applications, J. Mater. Chem. A, 2016, 4, 18677–18686 RSC.
- X. Yu, B. Viengkeo, Q. He, X. Zhao, Q. Huang, P. Li, W. Huang and Y. Li, Electronic tuning of covalent triazine framework nanoshells for highly efficient photocatalytic H2O2 production, Adv. Sustainable Syst., 2021, 5, 2100184 CrossRef CAS.
- Y. Shiraishi, T. Takii, T. Hagi, S. Mori, Y. Kofuji, Y. Kitagawa, S. Tanaka, S. Ichikawa and T. Hirai, Resorcinol-formaldehyde resins as metal-free semiconductor photocatalysts for solar-to-hydrogen peroxide energy conversion, Nat. Mater., 2019, 18, 985–993 CrossRef CAS PubMed.
- L. Chen, L. Wang, Y. Wan, Y. Zhang, Z. Qi, X. Wu and H. Xu, Acetylene and diacetylene functionalized covalent triazine frameworks as metal-free photocatalysts for hydrogen peroxide production: A new two-electron water oxidation pathway, Adv. Mater., 2020, 32, e1904433 CrossRef PubMed.
- N. Karikalan, M. Elavarasan and T. C. K. Yang, Effect of cavitation erosion in the sonochemical exfoliation of activated graphite for electrocatalysis of acebutolol, Ultrason. Sonochem., 2019, 56, 297–304 CrossRef CAS PubMed.
- B. Murugesan, N. Pandiyan, M. Arumugam, M. Veerasingam, J. Sonamuthu, A. R. Jeyaraman, S. Samayanan and S. Mahalingam, Two dimensional graphene oxides converted to three dimensional P, N, F and B, N, F tri-doped graphene by ionic liquid for efficient catalytic performance, Carbon, 2019, 151, 53–67 CrossRef CAS.
- S. Asadzadeh-Khaneghah, A. Habibi-Yangjeh and M. Abedi, Decoration of carbon dots and AgCl over g-C3N4 nanosheets: Novel photocatalysts with substantially improved activity under visible light, Sep. Purif. Technol., 2018, 199, 64–77 CrossRef CAS.
- Y. Li, W. Ho, K. Lv, B. Zhu and S. C. Lee, Carbon vacancy-induced enhancement of the visible light-driven photocatalytic oxidation of NO over g-C3N4 nanosheets, Appl. Surf. Sci., 2018, 430, 380–389 CrossRef CAS.
- R. Yang, X. Teng, X. Lu, X. Li, L. Kuai, R. Zhang, C. Zhang and Z. Wu, Effect of interface contact between C and C3N4 on photocatalytic water splitting, Catal. Lett., 2018, 148, 1435–1444 CrossRef CAS.
- G.-h. Moon, M. Fujitsuka, S. Kim, T. Majima, X. Wang and W. Choi, Eco-friendly photochemical production of H2O2 through O2 reduction over carbon nitride frameworks incorporated with multiple heteroelements, ACS Catal., 2017, 7, 2886–2895 CrossRef CAS.
- Y. Li, Y. Zhao, J. Wu, Y. Han, H. Huang, Y. Liu and Z. Kang, Photo-charge regulation of metal-free photocatalyst by carbon dots for efficient and stable hydrogen peroxide production, J. Mater. Chem. A, 2021, 9, 25453–25462 RSC.
- Y. Han, J. Wu, Y. Li, X. Gu, T. He, Y. Zhao, H. Huang, Y. Liu and Z. Kang, Carbon dots enhance the interface electron transfer and photoelectrochemical kinetics in TiO2 photoanode, Appl. Catal., B, 2022, 304, 120983 CrossRef CAS.
- H. Nie, Y. Liu, Y. Li, K. Wei, Z. Wu, H. Shi, H. Huang, Y. Liu, M. Shao and Z. Kang, In-situ transient photovoltage study on interface electron transfer regulation of carbon dots/NiCo2O4 photocatalyst for the enhanced overall water splitting activity, Nano Res., 2022, 15, 1786–1795, DOI:10.1007/s12274-021-3723-2.
- S. Z. Hu, X. Y. Qu, P. Li, F. Wang, Q. Li, L. J. Song, Y. F. Zhao and X. X. Kang, Photocatalytic oxygen reduction to hydrogen peroxide over copper doped graphitic carbon nitride hollow microsphere: The effect of Cu(I)–N active sites, Chem. Eng. J., 2018, 334, 410–418 CrossRef CAS.
- Y. Y. Liu, Z. J. Liao, X. L. Ma and Z. H. Xiang, Ultrastable and efficient visible-light-driven hydrogen production based on donor–acceptor copolymerized covalent organic polymer, ACS Appl. Mater. Interfaces, 2018, 10, 30698–30705 CrossRef CAS PubMed.
- L. Luo, Z.-j. Wang, X. Xiang, D. Yan and J. Ye, Selective activation of benzyl alcohol coupled with photoelectrochemical water oxidation via a radical relay strategy, ACS Catal., 2020, 10, 4906–4913 CrossRef CAS.
Footnotes |
| † Electronic supplementary information (ESI) available. See DOI: https://doi.org/10.1039/d2ma00162d |
| ‡ These authors contributed equally. |
| This journal is © The Royal Society of Chemistry 2022 |

