 Open Access Article
Effect of copper ferrite (CuFe2O4) in the thermal decomposition of modified nitrotriazolone
Pragnesh N.
Dave
 *a,
Riddhi
Thakkar
a,
Ruksana
Sirach
a and
Shalini
Chaturvedi
b
aDepartment of Chemistry, Sardar Patel University, Vallabh Vidyanagar, 388 120, Gujarat, India. E-mail: Pragnesh7@yahoo.com
bDepartment of Chemistry, SOIS, Silver Oak University, Ahmedabad, 380 061, Gujarat, India
First published on 29th April 2022
Abstract
Nano-crystalline copper ferrite (CuFe2O4) was prepared by a co-precipitation method and physicochemically characterized by powder X-ray diffraction (XRD), Raman, and ultraviolet-visible spectroscopy. Its catalytic effect was studied by the thermal decomposition of nitrotriazolone (NTO, 3-nitro-1,2,4-triazol-5-one) and nano-NTO using thermogravimetric analysis-differential scanning calorimetry-differential thermal analysis (TGA-DSC-DTA). XRD showed the amorphous structure of the CuFe2O4 nanoparticles with the crystallite size found to be between 18 and 29 nm, whereas the nanoparticle size of modified NTO was 10–45 nm. For the purpose of comparison, variations in particle size, absorbance, Raman small shift and kinetics, and differences in the thermal decomposition peak temperature were observed. All samples showed absorbance in the ultraviolet region at 200–400 nm. Kinetic parameters confirmed that the prepared CuFe2O4 catalyst enhanced the thermolysis of nano-NTO as compared to the pure NTO, nNTO, and NTO + CuFe2O4.
1. Introduction
The nanoparticles of spinel ferrite such as copper ferrite (CuFe2O4) are important materials due to their major applications in thermal catalysis, gas sensors, drug delivery systems, and many more magnetic applications.1–4 It is also an interesting ferrite due to its inverse spinel structure of octahedral and tetrahedral sites, where ions (Cu2+ and Fe3+) occupy either one or both sites through switching their places, as well as copper with a unique electronic configuration of valence orbitals 3d10 4s1.5–7 Ferrites are generally synthesized by a co-precipitation8 method due to its ease, safety, and simplicity, and the final product mainly depends on the synthesis process, which could assist in increasing the thermal catalysis applications of ferrites.9–11For efficient solid chemical propulsion, expelled high energetic particles such as nitrotriazolone (NTO, 3-nitro-1,2,4-triazol-5-one), ammonium nitrate (AN), octahydro-1,3,5,7-tetranitro1,3,5,7-tetrazocine (HMX), ammonium perchlorate (AP), and 2,4,6,8,10,12-hexanitro-2,4,6,8,10,12-hexazisowurtzitane (CL-20) are required, which is why they are widely used in rocket science for thrust production.12–15 Among these materials, NTO is an insensitive energetic material, due to its very low sensitivity. Prepared on a laboratory scale, the processes include easy steps, less hazardous, and satisfactory stability. NTO is widely used in propellants, explosives, and pyrotechnics because of its advantages of great performance due to the release of a huge amount of energy/force.16–18 Among many modification methods,19–21 the solvent–antisolvent method is widely applied to produce nanoparticles with improved performance based on their physicochemical characteristics.22
Recently, there has been a great deal of research in the field of chemical propulsion systems in which energetic materials play an important role because they possess propellant, explosive, and pyrotechnic characteristics. Insensitive high energetic materials (HEMs) usually release immense energy and gases that can produce maximum thrust to boost rockets and military-based equipment. Thus, they are important in different fields such as construction, rocket propellants, missiles, gunpowder, and mining. However, research has been carried out to increase the thermal decomposition performance of NTO by use of additives such as metal oxides that form co-crystals with other HEMs such as HNTO/AN, preparing nanosized particles of HEMs, and the use of polymers coordinated with graphene oxide (GO)-functionalized catalysts that can directly impart a great influence in the burning and combustion performance of chemical propulsion systems.29–35 To gain increased insight into the effect of the nano-size of catalysts, the synthesis and properties of various catalysts such as metal oxides,23 metals,24 ferrites,25 and mixed metal ferrites26 have been deeply studied to mainly ascertain how they affect the thermal decomposition of NTO. These are helpful to identify ferrite synthesis that can occur on a laboratory scale, with low cost and reproducible processes, and does not require specialized equipment systems.
In the present work, we precisely investigated the optimized parameters for the preparation of spinel ferrite of copper and the insensitive energetic organic compound NTO. Moreover, the effect of copper ferrite as a catalyst for the thermal decomposition of NTO and modified NTO was investigated using a kinetic approach. In this study, the synthesis, characterization, and thermal decomposition of NTO and nNTO with and without catalyst metal ferrite CuFe2O4 are briefly discussed, of which very little work has been previously reported.32–39
2. Experimental
2.1 Synthesis of copper ferrite nanoparticles
The required raw chemicals were copper(II) nitrate trihydrate Cu(NO3)2·3H2O (0.01 mol), iron(III) nitrate nonahydrate Fe(NO3)3·9H2O (0.02 mol), and sodium hydroxide (NaOH) used in the following co-precipitation procedure. The synthesis of CuFe2O4 involves the following steps: first, Cu2+ salts and Fe3+ salts were dissolved in the ratio of 1![[thin space (1/6-em)]](https://www.rsc.org/images/entities/char_2009.gif) :
:![[thin space (1/6-em)]](https://www.rsc.org/images/entities/char_2009.gif) 2 mol and added to 150 ml triple-distilled water with continuous stirring at room temperature to ensure that a homogeneous solution was obtained. Then, a 2 M solution of sodium hydroxide was added dropwise until precipitation was completed at pH of approximately 12. Subsequently, the formed precipitate was filtered, washed with warm distilled water, dried overnight at 60 °C, and calcined at 350 °C for 4 h to obtain satisfactory crystallinity. Finally, the copper ferrite powder was stored in a vacuum desiccator to avoid hygroscopicity.
2 mol and added to 150 ml triple-distilled water with continuous stirring at room temperature to ensure that a homogeneous solution was obtained. Then, a 2 M solution of sodium hydroxide was added dropwise until precipitation was completed at pH of approximately 12. Subsequently, the formed precipitate was filtered, washed with warm distilled water, dried overnight at 60 °C, and calcined at 350 °C for 4 h to obtain satisfactory crystallinity. Finally, the copper ferrite powder was stored in a vacuum desiccator to avoid hygroscopicity.
2.2 Preparation of NTO and modified NTO
NTO was prepared as described in the literature.27 For NTO synthesis, semicarbazide hydrochloride, formic acid, and nitric acid were employed. The procedure included condensation of semicarbazide hydrochloride and formic acid at 102 °C, which produced the intermediate triazolone. Nitration of triazolone was performed by adding nitric acid at 0–5 °C and was balanced until NTO completely precipitated. The reaction progress was monitored using thin-layer chromatography (TLC) employing ethyl acetate: n-hexane (8![[thin space (1/6-em)]](https://www.rsc.org/images/entities/char_2009.gif) :
:![[thin space (1/6-em)]](https://www.rsc.org/images/entities/char_2009.gif) 2) as the mobile phase. After the completion of the reaction, the solution mixture was poured onto ice, and then, NTO was filtered, re-crystallized using ethanol as the solvent, and dried in an oven overnight at 60 °C. Modified NTO was prepared by a solvent–antisolvent method19 using tetrahydrofuran (THF) as the solvent and n-hexane as the antisolvent. The NTO solution was dissolved in 100 ml THF, and was subsequently added dropwise into 400 ml chilled (<5 °C) n-hexane, followed by continuous stirring of the NTO particles, which precipitated and were then purified. The CuFe2O4 (CuF) nanocatalyst was mixed with NTO and nNTO in 5
2) as the mobile phase. After the completion of the reaction, the solution mixture was poured onto ice, and then, NTO was filtered, re-crystallized using ethanol as the solvent, and dried in an oven overnight at 60 °C. Modified NTO was prepared by a solvent–antisolvent method19 using tetrahydrofuran (THF) as the solvent and n-hexane as the antisolvent. The NTO solution was dissolved in 100 ml THF, and was subsequently added dropwise into 400 ml chilled (<5 °C) n-hexane, followed by continuous stirring of the NTO particles, which precipitated and were then purified. The CuFe2O4 (CuF) nanocatalyst was mixed with NTO and nNTO in 5![[thin space (1/6-em)]](https://www.rsc.org/images/entities/char_2009.gif) :
:![[thin space (1/6-em)]](https://www.rsc.org/images/entities/char_2009.gif) 95 mass ratios to produce a mixture of NTO + CuF and nNTO + CuF, respectively.
95 mass ratios to produce a mixture of NTO + CuF and nNTO + CuF, respectively.
2.3 Characterization techniques
XRD data were collected on a Rigaku Ultima IV Powder X-ray diffractometer using a Cu-Kα radiation source (λ = 1.5406 Å) at 35 kV and 40 mA. The ferrite and organic compound were scanned between 2θ = 10°–70° diffraction angle with a 0.02° step size. The morphology of the material was observed using a scanning electron microscope (ESEM XL-30 Philips, The Netherlands) using a LaB6 filament at 30 kV.Spectroscopic data were collected on a Shimadzu UV-1800 UV-visible spectrophotometer within the range of 200 to 800 nm wavelengths and a Jobin Yvon Horiba LabRam, HR800 Raman instrument with laser sources of 532 nm wavelengths.
Simultaneous thermal analyses (thermogravimetric analysis (TGA), differential scanning calorimetry (DSC), and differential thermal analysis (DTA)) were performed on a PerkinElmer STA 8000 instrument. The milligram samples were analyzed in 95![[thin space (1/6-em)]](https://www.rsc.org/images/entities/char_2009.gif) :
:![[thin space (1/6-em)]](https://www.rsc.org/images/entities/char_2009.gif) 5 weight ratios of NTO and catalyst heated from 30 to 400 °C at 5, 10, and 15 °C min−1 heating rates under an N2 atmosphere in a platinum pan.
5 weight ratios of NTO and catalyst heated from 30 to 400 °C at 5, 10, and 15 °C min−1 heating rates under an N2 atmosphere in a platinum pan.
3. Results and discussion
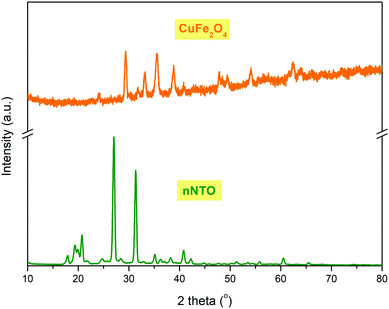
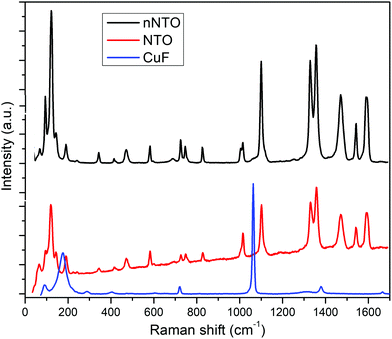
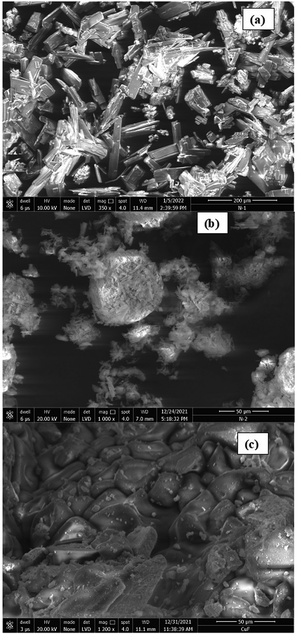
The NTO and CuF powder X-ray diffraction (PXRD) patterns are shown in Fig. 1. The average crystallite size was determined by Debye–Scherrer's formula as discussed elsewhere.28,34 Transition metal ferrite CuFe2O4 nanoparticles stood with a crystal size of 18–29 nm, while NTO nanoparticles were 10–45 nm in size. The major diffraction peaks for both samples found between diffraction angle (2θ) = 20–45°, and the amorphous phases were observed with a cubic spinel structure for catalyst CuFe2O4 and tetragonal crystal structure for the energetic material nNTO. The CuF diffraction pattern showed (220), (311), (222), (400), (331), (422), (511), and (440) lattice planes at diffraction angles 2θ of 29.35°, 32.5°, 35.53°, 38.85°, 41.34°, 47.84°, 54.13°, and 63.94°, respectively. However, the XRD pattern for NTO showed four main lattice planes of (011), (311), (221), and (111) at 2θ of 19°, 25°, 29°, and 37°, respectively. The peaks of n-NTO appearing at 17.89°, 19.35°, 20.73°, 24.75°, 27.03°, 31.35°, 35.13°, 36.26°, 38.26°, 40.82°, 42.25°, 51.24°, 55.81°, 60.52°, and 65.47° confirmed the presence of n-NTO diffraction peak angles.27 In the X-ray diffraction pattern of the samples, a broadening shape is associated with a decrement in sizes.The Raman spectral behavior of NTO, nNTO, and CuFe2O4 is shown in Fig. 2. It is a very important spectroscopy tool for analysis of samples with nanoparticles in terms of change in slight vibrations and polarizability of molecules because it allows identification of the structural changes in a wide range of nanosized materials.30 Raman scattering for spinel ferrite was found between 50 to 800 cm−1. Raman shift due to the molecular vibrations of metals and their oxides changed the polarizability and was found at a lower range with five active modes: A1g + 3F2g + Eg found between 100–700 cm−1. Raman shift was associated with symmetric stretching, symmetric bending, asymmetric stretching, asymmetric bending, and translation movement between the metal-oxygen bond of CuFe2O4 in the tetrahedral and octahedral sites.24 The Raman modes observed in higher Raman shift corresponded to tetrahedral sites, while modes observed in lower Raman shift corresponded to octahedral sites.25 A higher Raman shift value >1000 cm−1 was observed, which can be due to the adsorption of atmospheric CO2 molecules on the surface of nanoparticles or the presence of the orthorhombic phase. The organic compound NTO and nNTO exhibited Raman bands in the Raman shift range of 50 to 1700 cm−1. The Raman modes of lower region Raman shift are due to the presence of stretching, wagging, twisting, and rocking vibrations of the N–H bond, while Raman modes of higher region Raman shift are due to stretching and bending vibrations of the N–O and C–N bonds.36 Moreover, it can be seen that slight redshifting of the Raman modes of nNTO in comparison with NTO occurred due to the nanoparticle size reduction and the agglomeration of the nNTO particles. This result also validates the SEM images (Fig. 4).
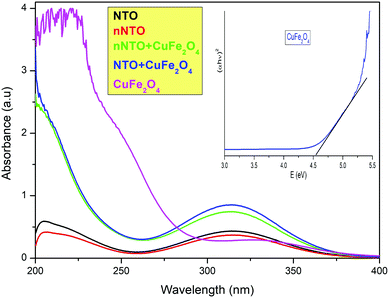
As shown in Fig. 3, higher absorbance was observed in the UV-visible spectrum of spinel ferrite CuFe2O4 due to the strong electronic transition of metal ions. In the copper ferrite with NTO and nNTO spectra, the absorbance decreased because of binding with organic molecules. Finally, the least absorbance was observed for the organic compound species NTO and nNTO, in which the nNTO spectrum was at a lower absorbance UV region due to its smaller particle size as compared to the pure NTO. Here, the entire analysis was carried out using a diluted hydrochloric acid solution. In the UV-Vis spectra, it was reported that the absorption bands depended on the size and shape of the nanoparticles.36 Catalyst CuFe2O4 showed higher absorbance at lower wavelengths due to its smaller size, and the solvent effect led to both hyperchromic and hypsochromic effects. However, for the mixtures NTO + CuF and nNTO + CuF, the absorption increased and there was a shift to a longer wavelength as compared to the pure NTO and nNTO that was associated with mechanical agglomeration and the solvent effect.
In the band structure of copper ferrite, the 2p orbital of the oxygen atom is designated as the valence band, while the 3d orbital of an iron atom is designated as the conductance band. The excitation of electrons from the valence band to the conductance band is responsible for ferrites’ adsorption in the UV-Vis region, and it was determined by Tauc plot. According to Tauc's relation,20 the absorption coefficient (alpha) is related to photon energy by the known equation:
| (αhυ)2 = A(hυ − Eg) |
The plotting of (αhυ)2vs. the photon energy (hυ) gives a straight line in a certain region. The extrapolation of this straight line will intercept the (hυ)-axis to provide the value of the direct optical energy gap (Eg). A lower Eg value of CuF assists in the fast movement of electron transition during the thermal decomposition study of nitrotriazolone. The Eg value for CuF was approximately 4.5 eV, while the Eg value for a mixture of CuF + nNTO or CuF + NTO was approximately 5.4 eV. The increment in Eg value for the mixture was associated with larger possible photon energy, and implies a transition across the gap. Therefore, copper ferrite assists in carrying phonons or electrons to facilitate improvement in the thermal decomposition of NTO or nNTO.
Fig. 4 shows the FEG-SEM images of NTO, nNTO, and CuFe2O4. NTO exhibited a rectangular rod shape, nanoparticles with agglomeration were observed for nNTO, and CuF exhibited a polyhedron-like shape. The average particle sizes were calculated using ImageJ software, with 12 to 30 nm for NTO and nNTO, and 27 nm for CuF. It was noticeable that the particle sizes differed from the crystalline sizes due to polycrystalline agglomeration or the presence of a single crystal.
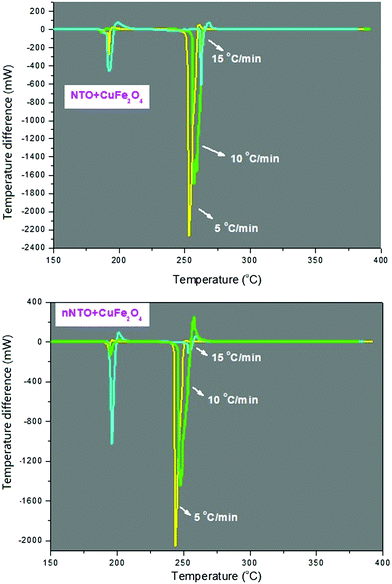
Fig. 5–9 show the curves of simultaneous thermal analyses (TG-DSC-DTA) of thermolysis of NTO and nNTO at 5, 10, and 15 °C min−1 heating rates in the presence of catalyst spinel ferrite CuFe2O4 to determine its catalytic activity. Fig. 5 shows the TG, DTG, and DSC curves at 5, 10, and 15 °C min−1 heating rates for NTO and nNTO. As the heating rates increased, the peaks shifted towards higher temperatures. It is widely known that an endothermic peak is absent in the thermal decomposition of NTO, and its complete decomposition was found between 250–280 °C. In our case, the exothermically decomposed DSC peak for NTO was found at approximately 275 °C, while nNTO was found at approximately 265 °C. In addition, nNTO exhibited a peak with high sharpness at a 5 °C min−1 heating rate as compared to the peak for the NTO sample.
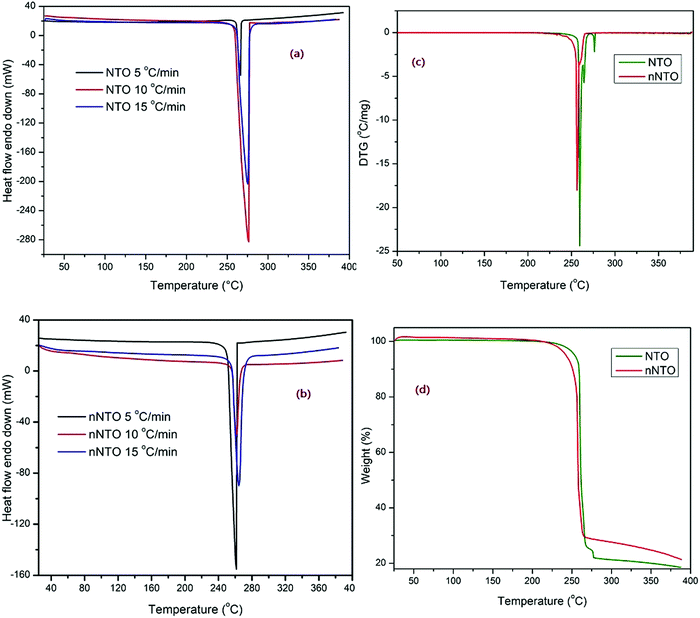 | ||
| Fig. 5 (a) and (b) DSC with 5, 10, 15 °C min−1 heating rates. (c) DTG and (d) TG graphs of NTO and nNTO. | ||
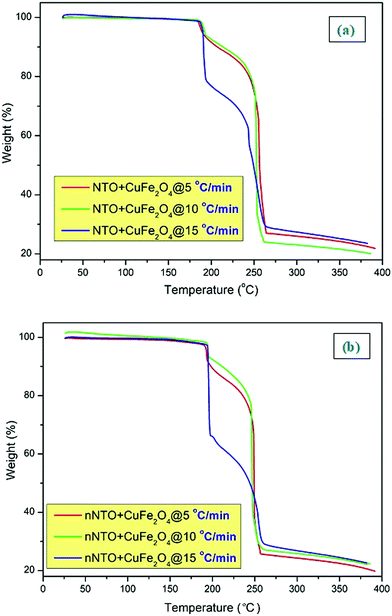 | ||
| Fig. 6 TG graphs of (a) NTO + CuFe2O4 and (b) nNTO + CuFe2O4 with 5, 10, and 15 °C min−1 heating rates. | ||
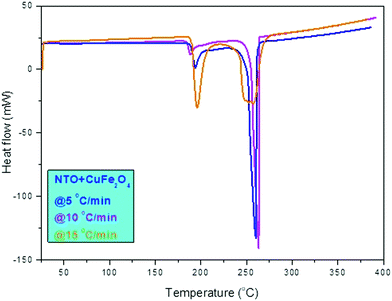 | ||
| Fig. 8 DSC (heat flow endo down) graphs for NTO + CuFe2O4 with 5, 10, and 15 °C min−1 heating rates. | ||
The modified NTO results confirmed the strong influences of the solvent–antisolvent method in the decomposition curve. Thermolysis of NTO occurred between 265–275 °C, with approximately 78% weight loss. However, nNTO thermolysis occurred between 258–265 °C, with approximately 72% weight loss because of the particle nano-size. Nitrotriazolone gravimetric decomposition occurred by polymeric residues that remained at the completion of decomposition.37
Similarly, the DTG curves for NTO and nNTO were found between 250–275 °C. Furthermore, the TG-DTG curves for NTO and n-NTO revealed that n-NTO decomposes within a short time, at a lower temperature value, and with a lower mass loss than pure NTO. Comparative studies of catalytic thermolysis of NTO (with references) are listed in Table 1. However, it was interesting in the current study to study the thermolysis of nNTO in the presence of catalyst CuF, which has also been described in previous studies38,39 on the synthesis, characterization, and thermolysis of nano-sized NTO.
In the presence of catalyst CuF, the NTO and nNTO TG analysis curves revealed (Fig. 6) that at all heating rates (5, 10, and 15 °C min−1), decomposition occurred between 250 °C to 260 °C with a 70–75% mass loss. In the TG-DTG curve for NTO, the additional small peaks and mass loss after its decomposition peak temperature is associated with its self-heating or autocatalysis.43,44 This corresponds to NTO and nNTO interacting with CuF nanoparticles through the proton transfer mechanism and subsequently decreasing the decomposition temperature and increasing the residue. The results depict that as the heating rates increased, the residual loss increased.
In Fig. 6, the thermogravimetric curves of NTO + CuFe2O4 and nNTO + CuFe2O4 at three heating rates of 5, 10, and 15 °C min−1 were associated with mass losses of a watery compound and unreacted organic species as the temperature increased from room temperature to 400 °C. Here, the curve at a 15 °C min−1 heating rate shows a different curve pattern than the other TGA curve. The straight line at the x-axis <200 °C was associated with water weight losses (0%), and it remained constant for all NTO samples, while between 200–275 °C, the major loss (approximately 80%) of mass corresponded to the presence of organic traces in NTO and nNTO material.
In the presence of catalyst CuF, the mass losses of NTO and nNTO followed two steps:39,41,44,45 the first step relates to the lower temperature decomposition due to the synergistic effects between the two compounds or evolution of NO vapors,17 while the second step relates to the complete decomposition of NTO and nNTO. However, at the 15 °C min−1 heating rate for both samples, the y-axis straight line below 200 °C corresponded to its steady mass loss (approximately 35%) of occluded water molecules.
Catalytic thermal decomposition of NTO using CuFe2O4 took place with multiple pathways, and its preliminary outcome depends on the heating rate. As heating rates increased, the decomposition peak was shifted to a higher temperature. The main step for NTO decomposition involves C–NO2 bond cleavage through a proton transfer mechanism by evolving less harmful chemical and gaseous products to indicate the completion of the decomposition process. For the same, DSC and DTA analyses at 5, 10, and 15 °C min−1 heating rates for NTO + CuFe2O4 and nNTO + CuFe2O4 are briefly discussed below.
In Fig. 7, the DTA curve of NTO + CuFe2O4 is shown with three heating rates in which at a lower temperature below 200 °C, the decomposition peak was associated with the thermally abnormal vibration of NTO molecules in the presence of CuFe2O4 catalyst. At a higher temperature at approximately 255 °C, the peak was associated with the complete catalytic decomposition of the NTO molecule. A similar pattern was observed for the DTA thermographic results of the nNTO + CuFe2O4 mixture (Fig. 7). Here, at 5 °C min−1 heating rates, a much lower decomposition peak temperature was observed for nNTO + CuFe2O4 at approximately 247 °C as compared to NTO + CuFe2O4 at approximately 252 °C. The decrease in the decomposition peak temperature resulted due to the effectiveness of the applied solvent–antisolvent modification method on NTO and the presence of catalyst CuFe2O4.
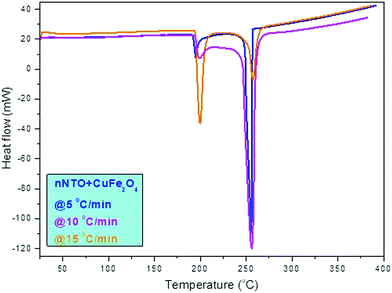
Fig. 8 shows the DSC curve of NTO + CuFe2O4, and Fig. 9 shows the DSC curve nNTO + CuFe2O4 at 5, 10, and 15 °C min−1 heating rates. These revealed that two decomposition peak temperatures were observed, as stated above (Fig. 7). The complete decomposition peak for NTO + CuFe2O4 was found at approximately 260 °C, while for nNTO + CuFe2O4, the decomposition peak was found at approximately 254 °C. These studies provided further assistance in the calculation of kinetic parameters, such as the activation energy in Table 2. A similar trend of DSC and DTA curves showed the effect of CuF catalyst on the thermolysis of NTO or nNTO. During catalytic decomposition of NTO or nNTO, there were two exothermic peaks observed – a lower temperature decomposition associated with intermediate transition state molecular exothermic decomposition, and higher temperature decomposition associated with complete decomposition of NTO or nNTO.
The kinetic parameters29 were calculated using the following equation:
where Tp denotes the peak temperature, the Boltzmann constant (KB) = 1.381 × 10⁻²³ J K−1 and Planck constant (h) = 6.626 × 10⁻³⁴ J s, β denotes the heating rate, Ea denotes the activation energy, and A denotes the preexponential factor.
The detailed average values of the kinetics parameters for pure NTO, nNTO, NTO + CuFe2O4, and nNTO + CuFe2O4 are listed in Table 3. From the calculations, the results of Arrhenius parameters such as activation energy revealed that the mixture of nano NTO with CuFe2O4 required lower energy of approximately 137 kJ mol−1 to start the reaction compared to other materials such as pure NTO, nNTO, and NTO + CuFe2O4. Thus, such an invention is helpful in the development of applications in the area of chemical propulsion systems. Herein, it was observed that nano spinel ferrite CuFe2O4 acts as an excellent catalyst with an outstanding performance for ease of preparation, energy content, thermal stability, and rapid thermal decomposition of insensitive energetic materials through a proton transfer mechanism.
| Kinetics/samples | NTO | nNTO | NTO + CuFe2O4 | nNTO + CuFe2O4 |
|---|---|---|---|---|
| Ea (kJ mol−1) | 205 ± 2 | 189 ± 2 | 168 ± 4 | 137 ± 4 |
| lnA | 25.2 ± 3 | 22.7 ± 3 | 19.5 ± 2 | 16.8 ± 2 |
Previous studies40–42 on the thermolysis of NTO have concluded that there were unsolved issues regarding the NTO decomposition phases and their overall mechanism pathways. The thermolysis process is complex, and it changes depending on the various parameters such as experimental conditions. The majority of theoretical studies have shown that thermolysis starts with C-NO2 homolysis because it requires the least amount of energy. One of the studies37 included the decomposition products of the thermolysis of NTO as follows:
4. Conclusion
A nano spinel ferrite CuFe2O4 catalyst was successfully prepared with the assistance of a facile co-precipitation route. NTO was synthesized by the nitration method and modified by a solvent–antisolvent method. NTO, nNTO, and CuF were characterized by XRD, UV-Vis, Raman, and SEM analyses, while catalytic thermolysis of NTO and nNTO was studied by TG-DSC-DTA analyses. The results showed that samples displayed nano-sized particles, low production cost, and satisfactory electronic, vibrational, diffraction, and thermal stability. The catalysis results revealed a noticeable decrement in activation energy for the nNTO + CuFe2O4 mixture as compared to the pure NTO, nNTO, and NTO + CuFe2O4.The overall thermal studies clearly confirmed the complete decomposition steps of NTO and nNTO with the catalyst, but pure NTO and nNTO completely decomposed through a single step via leaving autocatalytic traces. This may be due to the synergistic effects between the two compounds. The prepared ferrite, with excellent catalytic behavior and the best fit for the energetic decomposition mechanisms, would be a vital material for the formulations of various chemical propulsion systems.
Author contributions
The authors’ contributions are as follows: Pragnesh N Dave – project administration, funding acquisition, visualization, writing – review & editing, and supervision; Riddhi Thakkar – methodology, investigation, data curation, validation, and writing – original draft; Ruksana Sirach – methodology, investigation, and formal analysis; Shalini Chaturvedi – conceptualization and resources.Conflicts of interest
There are no conflicts to declare.Acknowledgements
The authors are thankful to the Department of Physics and the Department of Chemistry, Sardar Patel University, Vallabh Vidyanagar, Gujarat, India, for providing their scientific support and facilities to carry out the research project. It was sanctioned by the Department of Science and Technology (DST) Nanomission (SR/NM/NT-1014/2016 (G)). Furthermore, RT and RS are grateful for the research associate and junior research fellow fellowships. The authors also thankful to SICART (Sophisticated Instrumentation Centre for Applied Research and Testing), Vallabh Vidyanagar, Gujarat, India, for availing FE-SEM instrument facility and Indukaka Ipcowala Center for Interdisciplinary Studies in Science and Technology (IICISST), Vallabh Vidyanagar, Gujarat, India, for thermal analyses.References
- G. A. Ozin, A. Arsenault and L. Cademartiri, Nanochemistry: a chemical approach to nanomaterials, Royal Society of Chemistry, 2015 Search PubMed.
- N. Velinov, T. Petrova, R. Ivanova, T. Tsoncheva, D. Kovacheva and I. Mitov, Hyperfine Interact., 2020, 241, 1–12 CrossRef.
- M. W. Mushtaq, M. Imran, S. Bashir, F. Kanwal and L. Mitu, Bulg. Chem. Commun., 2016, 48, 565–570 Search PubMed.
- W. Wang, S. Guo, D. Zhang and Z. Yang, J. Saudi Chem. Soc., 2019, 23, 133–140 CrossRef CAS.
- D. Trache, A. Abdelaziz and B. Siouani, J. Therm. Anal. Calorim., 2017, 128, 335–348 CrossRef CAS.
- D. Trache, T. M. Klapötke, L. Maiz, M. Abd-Elghany and L. T. DeLuca, Green Chem., 2017, 19, 4711–4736 RSC.
- R. R. Sirach and P. N. Dave, Chem. Heterocycl. Comp., 2021, 57, 720–730 CrossRef CAS.
- S. Joshi, M. Kumar, S. Chhoker, G. Srivastava, M. Jewariya and V. N. Singh, J. Mol. Struct., 2014, 1076, 55–62 CrossRef CAS.
- B. C. Beard and J. Sharma, J. Energ. Mater., 1993, 11, 325–343 CrossRef CAS.
- J. I. Steinfeld and J. Wormhoudt, Annu. Rev. Phys. Chem., 1998, 49, 203–232 CrossRef CAS PubMed.
- Q. Li, Y. Wang and C. Chang, J. Alloys Compd., 2010, 505, 523–526 CrossRef CAS.
- G. Baudin, M. Roudot, M. Genetier, P. Mateille and A. Lefrançois, J. Phys.: Conf. Ser., 2014, 500, 052004 CrossRef CAS.
- S. Zhou, F. Wu, G. Tang, Y. Wang and A. Pang, Energetic Mater. Front., 2021, 2, 96–104 CrossRef.
- L. Kang, S. Li, B. Wang, X. Li and Q. Zeng, J. Phys. Chem. C, 2018, 122, 15937–15944 CrossRef CAS.
- Y. Yang, Y. Bai, F. Zhao, E. Yao, J. Yi, C. Xuan and S. Chen, RSC Adv., 2016, 6, 67308–67314 RSC.
- S. Singh, A. Sahai, S. C. Katyal and N. Goswami, Mater. Sci. Pol., 2018, 36, 722–732 CrossRef CAS.
- T. Dippong, E. A. Levei, C. L. Lengauer, A. Daniel, D. Toloman and O. Cadar, Mater. Charact., 2020, 163, 110268 CrossRef CAS.
- T. Zhou, X. Qi, Y. Ma, C. Pei, X. Duan and B. Wu, Appl. Organomet. Chem., 2020, 34, 1–9 Search PubMed.
- R. Kumar, P. Soni and P. F. Siril, ACS Omega, 2019, 4, 5424–5433 CrossRef CAS PubMed.
- X. Zhang, Y. Niu, Y. Li, X. Hou, Y. Wang, R. Bai and J. Zhao, Mater. Lett., 2013, 99, 111–114 CrossRef CAS.
- P. Gogoi, U. Mohan, M. P. Borpuzari, A. Boruah and S. K. Baruah, Arabian J. Chem., 2019, 12, 4522–4532 CrossRef CAS.
- C. Singh, A. Goyal and S. Singhal, Nanoscale, 2014, 6, 7959–7970 RSC.
- B. Gao, Z. Qiao and G. Yang, Nanomater. Rocket Propul. Syst., 2019, 31–79 CAS.
- P. Galinetto, B. Albini, M. Bini and M. C. Mozzati, Raman Spectrosc., 2018, 223–251 CAS.
- P. Thakur, D. Chahar, S. Taneja, N. Bhalla and A. Thakur, Ceram. Int., 2020, 46, 15740–15763 CrossRef CAS PubMed.
- G. Lan, J. Li, G. Zhang, J. Ruan, Z. Lu, S. Jin, D. Cao and J. Wang, Fuel, 2021, 295, 120655 CrossRef CAS.
- J. T. Wu, J. G. Zhang, T. Li, Z. M. Li and T. L. Zhang, RSC Adv., 2015, 5, 28354–28359 RSC.
- T. A. Hameed, A. A. Azab, R. S. Ibrahim and K. E. Rady, Ceram. Int., 2022 DOI:10.1016/J.CERAMINT.2022.03.327.
- S. Hanafi, D. Trache, A. Mezroua, H. Boukeciat, R. Meziani, A. F. Tarchoun and A. Abdelaziz, RSC Adv., 2021, 11, 35287–35299 RSC.
- A. Benhammada, D. Trache, M. Kesraoui, A. F. Tarchoun, S. Chelouche and A. Mezroua, Thermochim. Acta, 2020, 686, 178570 CrossRef CAS.
- J. K. Sharma, P. Srivastava, G. Singh, M. S. Akhtar and S. Ameen, Thermochim. Acta, 2015, 614, 110–115 CrossRef CAS.
- S. Hanafi, D. Trache, W. He, W.-X. Xie, A. Mezroua and Q.-L. Yan, J. Phys. Chem. C, 2020, 124, 5182–5195 CrossRef CAS.
- S. Hanafi, D. Trache, R. Meziani, H. Boukciat, A. Mezroua, A. F. Tarchoun and M. Derradji, Chem. Eng. J., 2021, 417, 128010 CrossRef CAS.
- A. Benhammada and D. Trache, J. Therm. Anal. Calorim., 2021, 147, 1–16 CrossRef.
- S. Touidjine, K. M. Boulkadid, D. Trache, S. Belkhiri and A. Mezroua, Propellants, Explos., Pyrotech., 2022, 47, 1–16 CrossRef.
- D. Campbell, A. R. Pethrick and J. R. White, Polymer characterization: physical techniques, CRC Press, 2000 Search PubMed.
- E. F. Rothgery, D. E. Audette, R. C. Wedlich and D. A. Csejka, Thermochim. Acta, 1991, 185, 235–243 CrossRef CAS.
- G. Yang, F. Nie, J. Li, Q. Guo and Z. Qiao, J. Energy Mater., 2007, 25, 35–47 CrossRef CAS.
- S. Hanafi, D. Trache, W. He, W. X. Xie, A. Mezroua and Q. L. Yan, Thermochim. Acta, 2020, 692, 178747 CrossRef CAS.
- S. Hanafi, D. Trache, S. Abdous, Z. Bensalem and A. Mezroua, Chin. J. Energ. Mater., 2019, 27, 326–347 CAS.
- G. T. Long, B. A. Brems and C. A. Wight, J. Phys. Chem. B, 2002, 106, 4022–4026 CrossRef CAS.
- V. P. Sinditskii, S. P. Smirnov and V. Y. Egorshev, Propellants, Explos., Pyrotech., 2007, 32, 277–287 CrossRef CAS.
- A. K. Burnham, V. L. Stanford, S. Vyazovkin and E. M. Kahl, Thermochim. Acta, 2021, 699, 178908 CrossRef CAS.
- B. N. Kondrikov, S. P. Smirnov, A. V. Minakin and R. M. Doherty, Propellants, Explos., Pyrotech., 2004, 29, 27–33 CrossRef CAS.
- Q. Yu, C. Zhao, L. Liao, H. Li, H. Sui, Y. Yin and J. Li, Phys. Chem. Chem. Phys., 2020, 22, 13729–13736 RSC.
| This journal is © The Royal Society of Chemistry 2022 |

