 Open Access Article
Unexpected behavior during methylene blue adsorption over H-titanate nanotubes and nanosheets
A. H.
Zaki
 *ab,
Shimaa
Rashad
b,
Ming-Jer
Lee
 a and
Nabila
Shehata
c
aDepartment of Chemical Engineering, National Taiwan University of Science and Technology, 43 Keelung Road, Section 4, Taipei 106-07, Taiwan. E-mail: ayman.zaki@psas.bsu.edu.eg
bMaterials Science and Nanotechnology Department, Faculty of Postgraduate Studies for Advanced Sciences, Beni-Suef University, Beni-Suef, Egypt
cEnvironmental Science and industrial development Department, Faculty of Postgraduate Studies for Advanced Sciences, Beni-Suef University, Beni-Suef, Egypt
First published on 7th October 2022
Abstract
2D titanate nanosheets (H-TNS) and 1D titanate nanotubes (H-TNT) were synthesized by using a simple hydrothermal technique to effectively adsorb cationic methyl blue (MB) dye from aqueous solutions. These nanomaterials were characterized by X-ray diffraction (XRD) and transmission electron microscopy (TEM). The effects of pH values, contact time, and the initial concentration of the dye on the adsorption behavior were investigated. The studies on the equilibrium and the kinetic behavior of adsorption are also included in this work. Various equilibrium adsorption models (including the Langmuir and the Freundlich models) and kinetic models were adopted to correlate the experimental data taken in the present study. The results showed that the adsorption capacity of methylene blue was 7.25 mg g−1 and 6.67 mg g−1 for H-TNT and H-TNS, respectively. Moreover, the effects of the morphology of titanate, the initial concentration of the dye, and the temperature of the solution on the chromatic behavior of cationic methylene blue dye were investigated. Finally the reusability of the nanomaterials was also tested.
1. Introduction
Due to the increasing growth of urbanization and industrialization, large amounts of industrial dyes are discharged from numerous industries, such as cosmetic, pharmaceutical, textile, leather, food, and paint industries. These dyes, which include more than 10![[thin space (1/6-em)]](https://www.rsc.org/images/entities/char_2009.gif) 000 types, are harmful to the environment and human beings.1,2 Moreover, dyes can be teratogenic, mutagenic or carcinogenic which can cause severe damage to humans. In particular, the organs most sensitive to dye contamination are the kidneys, brain, liver and the central nervous and reproductive systems. The major challenge is the resistance to degradation of these dyes as well as their toxicity due to the existence of toxic constituents such as amines. Due to their negative impacts on humans and ecosystems, removing or lowering the concentration of these dyes is gaining much interest. Therefore, focus on innovative techniques and materials to scavenge dyes from wastewater streams is preferable.3
000 types, are harmful to the environment and human beings.1,2 Moreover, dyes can be teratogenic, mutagenic or carcinogenic which can cause severe damage to humans. In particular, the organs most sensitive to dye contamination are the kidneys, brain, liver and the central nervous and reproductive systems. The major challenge is the resistance to degradation of these dyes as well as their toxicity due to the existence of toxic constituents such as amines. Due to their negative impacts on humans and ecosystems, removing or lowering the concentration of these dyes is gaining much interest. Therefore, focus on innovative techniques and materials to scavenge dyes from wastewater streams is preferable.3
Methylene blue (MB) is an azo dye with a heterocyclic aromatic cation structure that is commonly used in the textile industry. Because of its complex aromatic structure, it is difficult to break down using traditional biological treatment methods.4,5 To solve these problems, many research groups have developed various methods including coagulation, ozone oxidation, photocatalytic oxidation, Fenton oxidation, magnetic separation, and adsorption.6 One of the most efficient and cost-effective methods is adsorption. The dye molecules in the solution phase transfer to the surface of the adsorbent via the adsorption process. With the rapid advancement of nanotechnology in recent years, it is a common practice to use nanomaterials in environmental applications.7–9
Incorporation of nanotechnology to the traditional adsorption method forms an effective route to economically treat large volumes of wastewater.3 This is attributed to the promising properties of nanoparticles used in water treatment. Due to their promising characteristics, such as high surface area, nanosize, high reactivity, mobility solution, good mechanical properties, high porosity, and dispersibility, nanomaterials have proven their efficiency in treating wastewater from numerous pollutants.7–9 These nanoparticles can be engineered to be in the form of different morphologies including nanospheres, nanosheets, nanotubes, etc.6–8 The adsorption of dyes by nanomaterials has also attracted the attention of researchers. The use of nanoparticles as adsorbents has increased during the last decade, due to their high surface area and morphology control compared to bulk materials.10–14 Among these nanomaterials, titania and titanate nanostructures still attract attention from all researchers, because they are non-toxic, commercially available, and also their size and shape can be easily manipulated. These nanomaterials have unique physico-mechanicals properties, such as large surface area and porosity, which yields much more –OH sites, high stability, and ion-exchange characteristics as well as low-cost of production.3,6,7 Recently layered titanate nanostructures have attracted more attention because of their ability to exchange cations with dyes and heavy metals.15–17 1D and 2D titanate nanostructures are ideal candidates for dye removal because of the high surface area and exchange ability compared to bulk titania and titanate.18–20 Recently, titante showed promising results for the removal of different dyes.
However, previous investigations related to titanate nanotubes focused on the synthesis, structure characteristics and evaluation of the developed catalysts in photocatalysis, but little attention was given to studying the characteristic adsorption of organic materials onto titanate. Yuan et al.21 prepared and applied titanate nanosheets for MB adsorption. They noticed for the first time that at certain concentrations, MB molecules desorb to form dimers and trimers. In our work, as a representative of organic azo pollutants, MB, which is widespread in industrial wastewater, was used. The adsorption capacity of H-TNT and H-TNS toward MB was evaluated. The adsorption kinetics data were correlated with the Langmuir and the Freundlich models. Several studies reported on the synthesis of titante nanosheets as well as their adsorption activity, but no study was made on investigating the correlations for the adsorption behavior of MB onto 1D and 2D titanate nanostructures at different initial concentrations of MB and temperature. A comparison of the MB adsorptive characteristics onto different titante materials is shown in Table 1.
| Adsorbent | Temp. | Initial concn | Equilibrium time | pH | Adsorption capacity | Ref. |
|---|---|---|---|---|---|---|
| Sodium titanates | 25 | 50–300 | 120 | 7 | 52.8–51.8 | 22 |
| Titanate nanotubes sensitized with zinc tetra(4-carboxyphenyl) porphyrin | 300 | 20 | 15 | 6 | 96.5 | 23 |
| Graphene-titanate nanocomposite | 25 | 10–100 | 1440 | 7 | 270.27 | 24 |
| Titanate nanotubes | — | 5–50 | — | — | 5.6–8.2 | 25 |
| H-TNT | Room temp. | 100 | 90 | 7 | 7.25 | This study |
| H-TNS | 6.67 |
2. Materials and methods
2.1 1D and 2D titanate preparation and characterization
The reagents used in this study were bought from Sigma-Aldrich and used directly. Methylene blue (C16H18CIN3S·XH2O [X = 2, 3]) was supplied from General Drug House (P) Ltd, (India), and the chemical structure of MB is illustrated in Scheme 1. H-titanate nanosheets (2D) and nanotubes (1D) were prepared using a simple hydrothermal method, as in our recently published work.6 In a typical synthesis, 10 g of powder titania nanoparticles were mixed with 10 N NaOH for 30 min until a milky-white suspension was obtained, and the suspension was then transferred into a Teflon-lined autoclave with a vessel capacity of about 1000 mL. The autoclave was subject to heating in an oven at 160 °C for 6 and 20 h to obtain the nanosheets (H-TNS) and nanotubes (H-TNT), respectively. The autoclave was allowed to cool down to room temperature, and then the white powders formed were washed several times with distilled water, and then with 0.1 M HCl under sonication. At the end all samples were placed in a muffle furnace at 500 °C for 4 h. The prepared titanate was characterized using high-resolution transmission electron microscopy (HRTEM) micrographs obtained from a JEOL-JEM 2100 (Japan) with an acceleration voltage of 200 kV. X-ray diffraction (XRD) patterns were recorded on a PANalytical (Empyrean) XRD using Cu Ka radiation (wavelength 0.154 cm−1) at an accelerating voltage of 40 kV, current of 35 mA, scan angle range of 5–80, and scan step of 0.02°. The zeta potential was measured using a Zetasizer Nano-ZS90 (Malvern, UK). The Brunauer–Emmett–Teller (BET) surface area was measured by N2 adsorption using a Micromeritics TriStar II.2.2 Adsorption study
A 200 ppm stock solution of methylene blue was prepared by dissolving the powder in distilled water, and different concentrations of methylene blue were prepared by diluting in certain volumes of the stock solution; solutions of 5, 10, 25, 30, 40, and 50 ppm were prepared. The adsorption experiments were performed in a glass batch-reactor, and the circulated water from the thermostatic bath maintained the temperature. The effect of temperature was studied at certain concentrations to evaluate their action on dimer and trimer formation. The removal efficiency was followed-up by withdrawing samples (500 μL) at certain time intervals, separating by gravitational force, and analyzing them using Jasco, V-300, UV-Vis. Spectrophotometer.3. Results and discussion
3.1 Titanate characterization
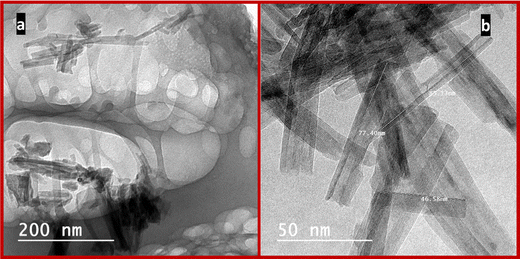
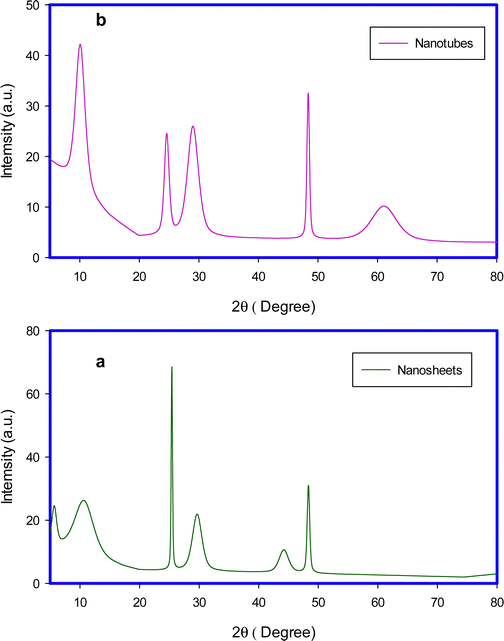
HRTEM images as shown in Fig. 1 confirm the successful preparation of the desired titanate nanosheets and nanotubes. In Fig. 2a, the multilayered nanosheets can be observed; the nanosheets are stacked with each other and are not uniform in size. While the nanotubes are shown in Fig. 2b, the tubular structure with internal cavities are clear in all tubes, and all tube diameters are less than 10 nm.Fig. 2 shows the recorded XRD patterns of H-TNS and H-TNT, the observed reflections of nanosheets at 2θ; 5.6°, 10.6° 25.3°, 29.6°, 44.1°, and 48.3° (Fig. 2a) were compared with [ICDD card no. 01-077-4140] of the monoclinic phase of dihydrogen trititanate (H2Ti3O7), while the reflections of H-TNT were observed at 2θ; 9.8°, 24.2°, 28.2°, 48.2°, 61.7°), and were found to coincide with [ICDD card no. 00-047-0124], of hydrogen titanium oxide hydrate nanotubes.
Surface areas, pore volumes, and pore sizes were obtained and are listed in Table 2. For titanate nanotubes, the surface area is 83 m2 g−1, pore volume is 0.1305 cm3 g−1, and pore size is 5.8 nm. On the other hand, for the nanosheets these values are 72 m2 g−1, 0.085 cm3 g−1, and 4.8 nm, respectively. It is clear from the results that the nanotubes are higher in their specific surface area and pore width and volume by 13.25, 34.9 and 17.2%, respectively, compared to the nanosheets. This is due to the fact that the development of the nanomaterial in tube geometry increased their internal surface area rather than the sheet configuration.6
| Morphology | BET (m2 g−1) | Pore volume (cm3 g−1) | Pore size (nm) |
|---|---|---|---|
| Nanosheets | 72 | 0.085 | 4.8 |
| Nanotubes | 83 | 0.1305 | 5.8 |
3.2 Adsorption study
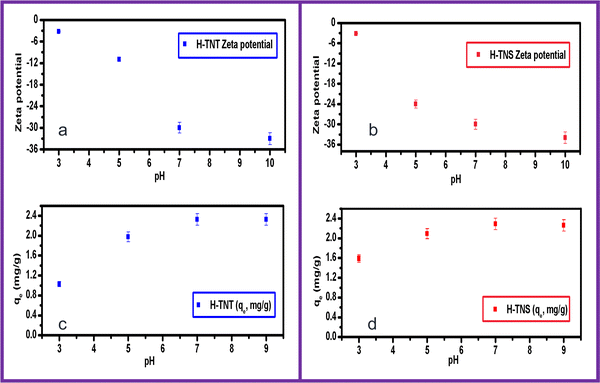
Hence, the adsorption mechanism might be attributed mainly to the electrostatic attraction between the MB and sorbents under investigation. This is in agreement with ref. 26, in which it was also reported that the adsorption was basically controlled by electrostatic forces.
However, titanate developed using a hydrothermal synthesis route is characteristic with an ion-exchange property which encourages the sorption of basic dyes such as MB via a cation exchange mechanism.27
Although there is a difference in the surface area between the two adsorbents, the efficiency is too close, which is may be attributed to the preferred orientations in the crystal structure of H-TNS and H-TNT, as found in our recent study.6
3.3 The chromatic behavior of MB
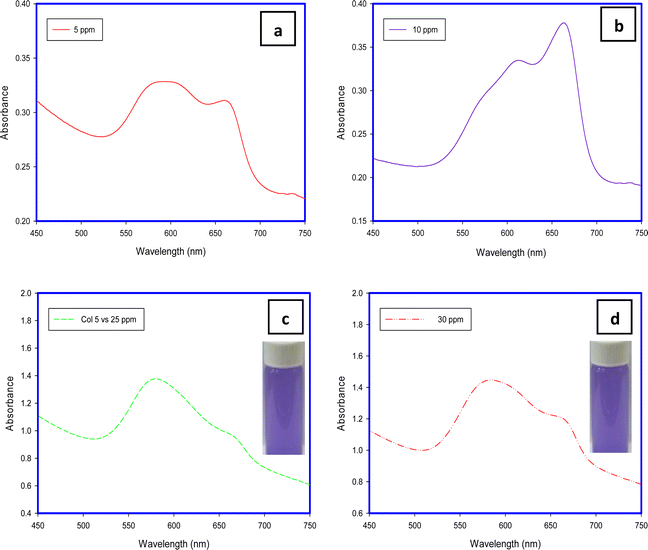
MB aggregation is most encouraged in water due to its methachromic characteristic in addition to the high dielectric constant of water which minimizes the electrostatic repulsion among dye molecules. This phenomenon depends on some factors such as temperature, dye concentration, ionic strength, and solvent dielectric.28The band around 668 nm is present with low intensity at low concentrations (5 and 25 mg L−1) and also at a high concentration (30 mg L−1). In contrast to that at an initial concentration of 10 mg L−1. This may be attributed to the tendency of the MB molecule to excise in dimer form at specific concentrations. For example, Huiyu Yuan stated that the dimers are present more than monomers at a concentration of 10−3 mol L−1 while the monomers are present more than dimers at a concentration of 10−7 mol L−1.21
The shapes of the band and the shoulder refer to the fact that the monomers are the predominant species present at a concentration of 10 mg L−1. At lower than this value (5 mg L−1) and at higher concentrations (≥25 mg L−1), the dimers are dominant in the dye solution which is in line with ref. 29.
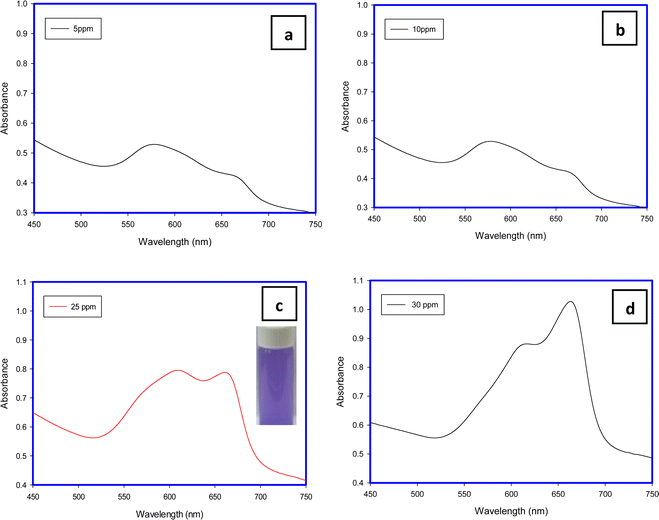 | ||
| Fig. 7 UV-Visible spectra of concentrations of 5 (a), 10 (b), 25 (c) and 30 (d) mg L−1 of MB after removal using H-TNS. | ||
The dimensions of the MB molecule are close to a rectangular shape with dimensions of 1.70 × 0.76 × 0.33 nm, compared to H-TNS, and the morphology of the H-TNS sheets facilitates the stacking of MB molecules above each other or face each other to form dimers, and subsequently the ratio monomers will increase compared to the dimer in the remaining solution (MB after adsorption). And the morphology of the nanomaterials plays an important role as adsorbents.
The mechanism of MB sorption onto H-TNS and H-TNT due to ion exchange between inter-layered (H+) and MB cations in addition to complexation due to the abundance of negative charge on the sorbent surface.
3.4 Adsorption isotherm
Langmuir and Freundlich models have been widely applied to describe the adsorption systems as the following equations:30,31| Langmuir: Ce/qe = Ce/qm + 1/qe·KL | (1) |
Freundlich: log![[thin space (1/6-em)]](https://www.rsc.org/images/entities/char_2009.gif) qe = (1/n)·log qe = (1/n)·log![[thin space (1/6-em)]](https://www.rsc.org/images/entities/char_2009.gif) Ce + log Ce + log![[thin space (1/6-em)]](https://www.rsc.org/images/entities/char_2009.gif) kF kF | (2) |
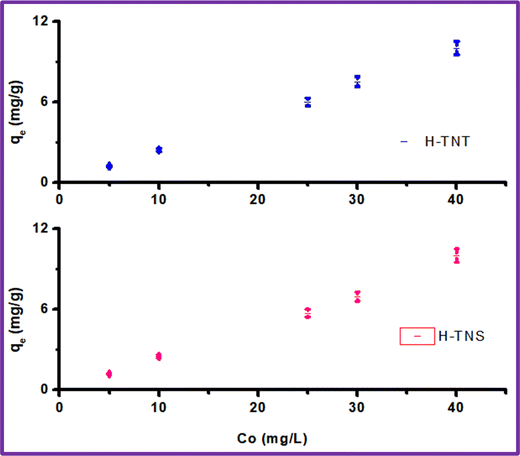
As shown in Fig. 9 and Table 3, and based on the correlation coefficients (R2 0.95–0.98) the Freundlich model is more suitable for MB adsorption onto H-TNT and H-TNS. The Langmuir model is not suitable for the adsorption of H-TNS (R2 0.61) and this attributed to the fact that this model is based on the assumption that the adsorption sites of the adsorbent are energetically equivalent and there is no interaction between the adjacent adsorbed molecules and this couldn’t occur since the sheets encourage MB dimerization on its surface which agreed with the above results. In contrast to H-titante nanotubes (R2 0.82) where this phenomena is minimized.
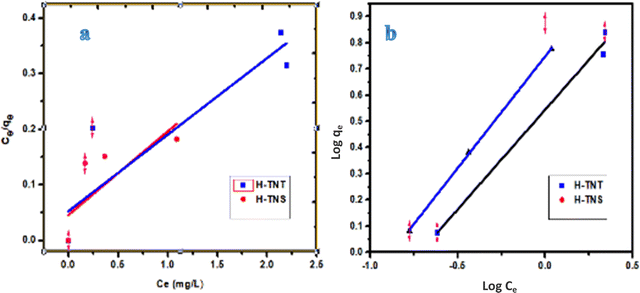 | ||
| Fig. 9 Modeling of the MB adsorption process onto H-TNT and H-TNS using Langmuir (a) and Freundlich (b) models. | ||
| Linear models | ||||||
|---|---|---|---|---|---|---|
| Model | Langmuir | Freundlich | ||||
| Parameter | K e | q m | R 2 | K F | n | R 2 |
| H-TNT | 2.63 | 7.25 | 0.82 | 3.2 | 1.76 | 0.95 |
| H-TNS | 0.007 | 6.67 | 0.61 | 6.4 | 1.068 | 0.98 |
| Non-linear models | ||||||||||
|---|---|---|---|---|---|---|---|---|---|---|
| Parameter | Langmuir | Freundlich | Redlich–Peterson | |||||||
| K e | q m | R 2 | K F | n | R 2 | K R | a R | b | R 2 | |
| H-TNT | 0.34 | 14.98 | 0.68 | 3.48 | 1.3 | 0.68 | 54.5 | 14.63 | 0.24 | 0.68 |
| H-TNS | 0.004 | 4722 | 0.6 | 57453 | 0.2 | 0.99 | 0.94 | 0.006 | 1.15 | −1.03 |
Table 3 also shows the parameters of the non-linear modeling for the adsorption of MB onto the sorbents under study. The results show that the non-linear models can’t describe the process where the correlation coefficient values are very low or negative and the calculated values of q are very high.
3.5 Kinetic studies
Five kinetic models were investigated in order to clear the MB mechanism and rate of MB adsorption onto titanate nanomaterials as follows:Pseudo 1st order model:32 Log(qe − qt) = log![[thin space (1/6-em)]](https://www.rsc.org/images/entities/char_2009.gif) qe − (K1/2.303)·t
qe − (K1/2.303)·t
Pseudo 2nd order model:33t/qt = [1/(k2·qe2)] + t/qe
Intraparticle diffusion model:34–36qt = kit0.5 + c
Avrami model:35,37qt = qe·[1 − exp[−kAV·t]nAV]
Mixed 1st and 2nd order model: qt/qe = [1 − exp(−k1t)]/[(1 − f2−![[thin space (1/6-em)]](https://www.rsc.org/images/entities/char_2009.gif) exp(−k1t)]where qe refers to the equilibrium adsorption capacity (mg g−1), and qt is due to the adsorption capacity (mg g−1) at time (t), K1 is the pseudo 1st order rate constant (min−1), K2 is the pseudo 2nd order rate constant (g mg−1 min−1), Ki is the intraparticle diffusion rate constant (mg g−1 min−0.5), c is the intercept related to the thickness of the boundary layer, kAV and nAV are the constants (min−1) and exponent (−) of the Avrami equation and f2 refers to the constant of the mixed 1st and 2nd order model.
exp(−k1t)]where qe refers to the equilibrium adsorption capacity (mg g−1), and qt is due to the adsorption capacity (mg g−1) at time (t), K1 is the pseudo 1st order rate constant (min−1), K2 is the pseudo 2nd order rate constant (g mg−1 min−1), Ki is the intraparticle diffusion rate constant (mg g−1 min−0.5), c is the intercept related to the thickness of the boundary layer, kAV and nAV are the constants (min−1) and exponent (−) of the Avrami equation and f2 refers to the constant of the mixed 1st and 2nd order model.
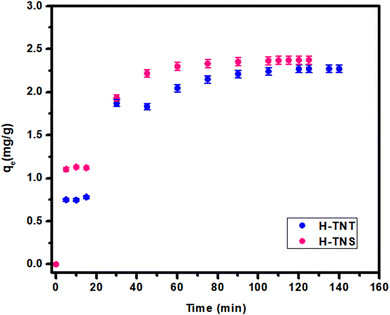
Based in the results illustrated in Fig. 10 and Table 4, the pseudo first order is fit to the data with high correlation coefficient (R2) values of 0.97 and 0.95 for H-TNT and H-TNS, respectively. Additionally the calculated maximum capacity for adsorption is very close to the experimental values. Although modeling of the system using the pseudo 2nd order model yields high R2 (0.96) the theoretical maximum adsorption values are higher than those for the experimental values. In the case of the intraparticle diffusion models, the calculated values of adsorption capacities are far away from the experimental one beside lower values of the correlation factor (R2, 0.87–0.89).
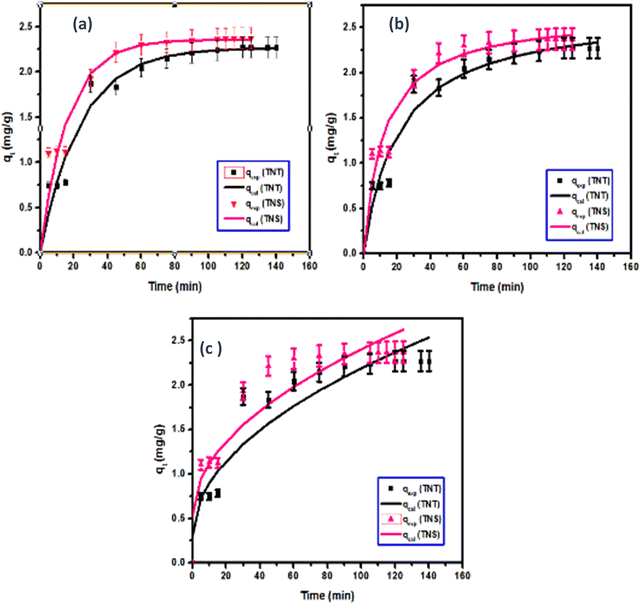 | ||
| Fig. 10 Fitting of the two parameters-models: pseudo first order, pseudo second order and intraparticle diffusion models to the experimental data for the adsorption of MB onto H-TNT and H-TNS. | ||
| Pseudo-first-order | ||||
|---|---|---|---|---|
| Material | q e,exp (mg g−1) | k 1 (min−1) | q e,cal (mg g−1) | R 2 |
| H-TNT | 2.27 | 0.042 | 2.27 | 0.97 |
| H-TNS | 2.37 | 0.061 | 2.36 | 0.95 |
| Pseudo-second-order | ||||
|---|---|---|---|---|
| Material | q e,exp | k 2 (g mg−1 min−1) | q e,cal | R 2 |
| H-TNT | 2.27 | 0.018 | 2.68 | 0.96 |
| H-TNS | 2.37 | 0.031 | 2.65 | 0.96 |
| Intraparticle diffusion | ||||
|---|---|---|---|---|
| Material | q e,exp | K ip (mg g−1 min−0.5) | C ip (mg g−1) | R 2 |
| H-TNT | 2.27 | 0.189 | 0.30 | 0.89 |
| H-TNS | 2.37 | 0.188 | 0.53 | 0.87 |
| Mixed 1st and 2nd order | |||||
|---|---|---|---|---|---|
| Material | q e,exp | K | q e (mg g−1) | f 2 | R 2 |
| H-TNT | 2.27 | 0.0003 | 2.67 | 0.990 | 0.96 |
| H-TNS | 2.37 | 0.0002 | 2.77 | 0.996 | 0.90 |
| Avrami | |||||
|---|---|---|---|---|---|
| Material | q e,exp | K av | q e (mg g−1) | n av | R 2 |
| H-TNT | 2.27 | 0.209 | 2.27 | 0.20 | 0.97 |
| H-TNS | 2.37 | 0.246 | 2.36 | 0.25 | 0.95 |
The three parameters-models were also investigated. As shown in Fig. 11, the Avrami model could describe the adsorption process under study with high accuracy according to the values of R2 (0.95–0.97) and matching the calculated values to that of the experimental one. The mixed 1st and 2nd order kinetic model was similar to the pseudo 2nd order, where the calculated capacities for MB adsorption into the nanosheets and tubes are higher than the experimental one while the correlation coefficient is high (0.90–0.96).
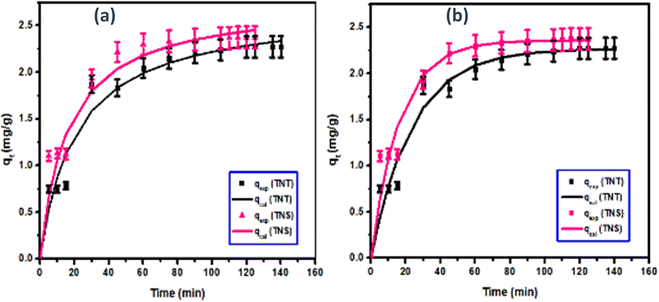 | ||
| Fig. 11 Fitting of the three parameters-models: Avrami and mixed 1st and 2nd order models to the experimental studies for the adsorption of MB onto H-TNT and H-TNS. | ||
In conclusion, the adsorption process of MB onto H-TNT and H-TNS is well described using pseudo 1st order and Avrami models. Pseudo 2nd order and the mixed 1st and 2nd order are acceptable while the intraparticle diffusion model is not suitable for this system.
3.6 Reusability
The band-gaps of H-TNT and H-TNS were measured using UV-Visible spectroscopy. The obtained values are 3.4 eV and 3.5 eV, respectively. These values are too close to previously published work,6 in which these morphologies were used as effective photocatalysts for organic dye degradation (Crystal violet). Hence, these materials can be easily recycled using UV irradiation, where the formed reactive oxygen species can easily degrade methylene blue to CO2 and water.384. Conclusion
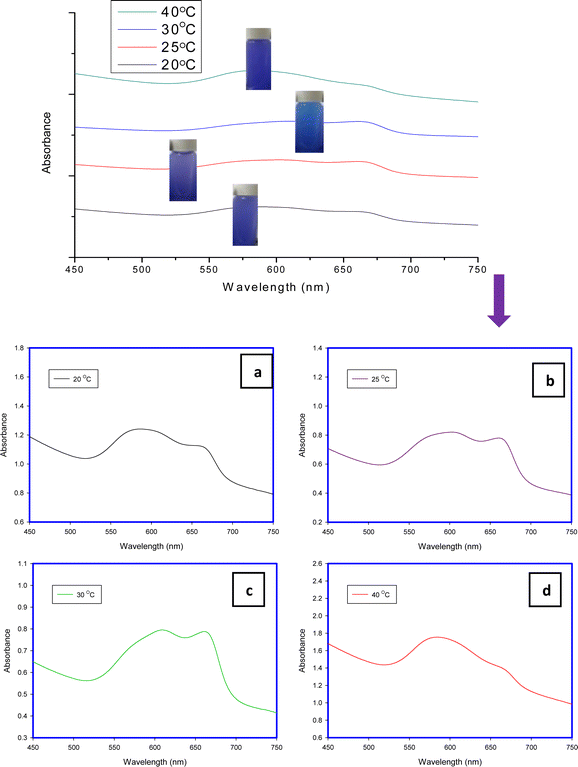
In the current study, titanate nanotubes (H-TNT) and titanate nanosheets (H-TNS) were developed and characterized. In order to explore their adsorption mechanism toward the cationic methylene blue dye, the maximum adsorption capacities of H-TNT and H-TNS are 7.25 and 6.67 mg g−1, respectively, and the adsorption modeling has been carried out using the two traditional models; Langmuir and Freundlich. The results showed that both H-TNT and H-TNS followed the Freundlich model. The adsorption kinetics was studied using five kinetic models: i.e., pseudo 1st order model, pseudo 2nd order model, intraparticle diffusion model, Avrami model, and mixed 1st and 2nd order model. However, intraparticle diffusion is not the controlling step in the adsorption process under study. During the adsorption arrays, unfamiliar behaviour of the MB spectra was detected where the standard spectrum was changed continuously. The morphology of the nanomaterials and the initial concentration of the dye play an important role in the adsorptivity process. In the case of H-TNT the monomers are the predominant species at a lower concentration (5 and 10 mg L−1) while in H-TNS, the monomers are the predominant at a higher concentration (30 mg L−1). Consequently, some experiments have been carried out to study the reasons for this behaviour and it can be concluded that the spectrum of the methylene blue dye is affected by the variation in dye concentration and solution temperature. So, it is highly recommended to perform a full scan to the MB dye spectra during analysis to consider the presence of the dye molecules in the monomer or dimer form in addition to defining the maximum absorbance of the dye solution at specific operating conditions.Conflicts of interest
The authors have no relevant financial or non-financial interests to disclose.References
- S. Khan, M. Naushad, A. Al-Gheethi and J. Iqbal, Engineered nanoparticles for removal of pollutants from wastewater: Current status and future prospects of nanotechnology for remediation strategies, J. Environ. Chem. Eng., 2021, 9(5), 106160 CrossRef CAS.
- M. E. Elkartehi, R. Mahmoud, N. Shehata, A. Farghali, S. Gamil and A. Zaher, LDH nanocubes synthesized with zeolite templates and their high performance as adsorbents, Nanomaterials, 2021, 11(12), 3315 CrossRef CAS PubMed.
- R. Saleh, A. H. Zaki, F. I. A. El-Ela, A. A. Farghali, M. Taha and R. Mahmoud, Consecutive removal of heavy metals and dyes by a fascinating method using titanate nanotubes, J. Environ. Chem. Eng., 2021, 9(1), 104726 CrossRef CAS.
- A. Tkaczyk, K. Mitrowska and A. Posyniak, Synthetic organic dyes as contaminants of the aquatic environment and their implications for ecosystems: A review, Sci. Total Environ, 2020, 717, 137222 CrossRef CAS PubMed.
- A. M. Elgarahy, K. Z. Elwakeel, S. H. Mohammad and G. A. Elshoubaky, A critical review of biosorption of dyes, heavy metals and metalloids from wastewater as an efficient and green process, Clean. Eng. Technol., 2021, 100209 CrossRef.
- S. Rashad, A. H. Zaki and A. A. Farghali, Morphological effect of titanate nanostructures on the photocatalytic degradation of crystal violet, Nanomater. Nanotechnol., 2019, 9, 1847980418821778 CAS.
- A. A. Abdel-Khalek, S. A. Mahmoud and A. H. Zaki, Visible light assisted photocatalytic degradation of crystal violet, bromophenol blue and eosin Y dyes using AgBr-ZnO nanocomposite, Environ. Nanotechnol., Monit. Manage., 2018, 9, 164–173 Search PubMed.
- A. A. Farghali, A. H. Zaki and M. H. Khedr, Control of selectivity in heterogeneous photocatalysis by tuning TiO2 morphology for water treatment applications, Nanomater. Nanotechnol., 2016, 6, 12 CrossRef.
- A. H. Zaki, S. Adel, A. El-hafiez, M. Mahmoud and A. A. Abdel-Khalek, Improved production of titanate nanotubes by hydrothermal method for adsorption of organic dyes, Beni Suef Univ. J. Basic Appl. Sci., 2021, 10(1), 1–8 CrossRef.
- M. R. Rahman-Setayesh, A. Rahbar Kelishami and H. Shayesteh, Equilibrium, kinetic, and thermodynamic applications for methylene blue removal using Buxus sempervirens leaf powder as a powerful low-cost adsorbent, J. Part. Sci. Technol., 2019, 5(4), 161–170 CAS.
- H. Shayesteh, A. Ashrafi and A. Rahbar-Kelishami, Evaluation of Fe3O4@ MnO2 core-shell magnetic nanoparticles as an adsorbent for decolorization of methylene blue dye in contaminated water: synthesis and characterization, kinetic, equilibrium, and thermodynamic studies, J. Mol. Struct., 2017, 1149, 199–205 CrossRef CAS.
- R. Nodehi, H. Shayesteh and A. Rahbar-Kelishami, Fe3O4@ NiO core–shell magnetic nanoparticle for highly efficient removal of Alizarin red S anionic dye, Int. J. Environ. Sci. Technol., 2022, 19(4), 2899–2912 CrossRef CAS.
- A. Zaher and N. Shehata, Recent advances and challenges in management of urea wastewater: A mini review, IOP Conf. Ser. Mater. Sci. Eng., IOP Publishing, 2021, p. 12021 Search PubMed.
- N. Shehata, E. T. Sayed, M. A. Abdelkareem, T. Wilberforce and A. G. Olabi, Bio-Based Adsorbents in Water/Wastewater Treatment, Ref. Modul. Mater. Sci. Mater. Eng., Elsevier, 2021 DOI:10.1016/b978-0-12-815732-9.00119-4.
- S. Mohanty, S. Moulick and S. K. Maji, Adsorption/photodegradation of crystal violet (basic dye) from aqueous solution by hydrothermally synthesized titanate nanotube (TNT), J. Water Process Eng., 2020, 37, 101428 CrossRef.
- L. Xu, C. Pan, S. Li, C. Yin, J. Zhu, Y. Pan and Q. Feng, Electrostatic Self-Assembly Synthesis of Three-Dimensional Mesoporous Lepidocrocite-Type Layered Sodium Titanate as a Superior Adsorbent for Selective Removal of Cationic Dyes via an Ion-Exchange Mechanism, Langmuir, 2021, 37(19), 6080–6095 CrossRef CAS PubMed.
- C. Liu, Y. Li, X. Wang, B. Li, Y. Zhou, D. Liu, D. Liu and S. Liu, Efficient extraction of antimony (III) by titanate nanosheets: Study on adsorption behavior and mechanism, Ecotoxicol. Environ. Saf., 2021, 207, 111271 CrossRef CAS PubMed.
- T. M. F. Marques, D. A. Sales, L. S. Silva, R. D. S. Bezerra, M. S. Silva, J. A. Osajima, O. P. Ferreira, A. Ghosh, E. C. Silva Filho and B. C. Viana, Amino-functionalized titanate nanotubes for highly efficient removal of anionic dye from aqueous solution, Appl. Surf. Sci., 2020, 512, 145659 CrossRef CAS.
- A. M. Tayeb, D. S. Hussein and R. Farouq, Optimization of photocatalytic degradation of methylene blue dye using titanate nanotube, J. Nanophotonics, 2020, 14, 26008 CAS.
- J. N. D. de León, J. Rojas, D. Dominguez, Y. Esqueda-Barrón, J. M. Romo-Herrera and S. Fuentes-Moyado, The effect of shape and size of 1D and 0D titanium oxide nanorods in the photocatalytic degradation of red amaranth toxic dye, Nano-Struct. Nano-Objects, 2021, 26, 100738 CrossRef.
- H. Yuan, S. Ma, X. Wang, H. Long, X. Zhao, D. Yang, W. H. Lo and Y. H. Tsang, Ultra-high adsorption of cationic methylene blue on two dimensional titanate nanosheets, RSC Adv., 2019, 9, 5891–5894 RSC.
- W. Zhang, C. Huo, B. Hou, C. Lin, X. Yan, J. Feng and W. Yan, Secondary particle size determining sedimentation and adsorption kinetics of titanate-based materials for ammonia nitrogen and methylene blue removal, J. Mol. Liq., 2021, 343, 117026 CrossRef CAS.
- H. Wang, Y. Fu, T. Han, J. Wan and X. Zheng, Adsorption and photocatalytic behavior of titanate nanotubes sensitized with zinc tetra (4-carboxyphenyl) porphyrin, RSC Adv., 2015, 5(42), 33570–33578 RSC.
- A. H. Zaki, A. A. Motagaly, R. Khaled, M. J. Lee, A. A. Farghali and N. Shehata, Economic and facile approach for synthesis of graphene–titanate nanocomposite for water reclamation, J. Contam. Hydrol., 2022, 104052 CrossRef CAS PubMed.
- M. N. Subramaniam, P. S. Goh, N. Abdullah, W. J. Lau, B. C. Ng and A. F. Ismail, Adsorption and photocatalytic degradation of methylene blue using high surface area titanate nanotubes (TNT) synthesized via hydrothermal method, J. Nanopart. Res., 2017, 19(6), 1–13 CrossRef CAS.
- L. Xiong, Y. Yang, J. Mai, W. Sun, C. Zhang, D. Wei and J. Ni, Adsorption behavior of methylene blue onto titanate nanotubes, Chem. Eng. J., 2010, 156(2), 313–320 CrossRef CAS.
- C. K. Lee, S. S. Liu, L. C. Juang, C. C. Wang, M. D. Lyu and S. H. Hung, Application of titanate nanotubes for dyes adsorptive removal from aqueous solution, J. Hazard. Mater., 2007, 148(3), 756–760 CrossRef CAS PubMed.
- N. Florence and H. Naorem, Dimerization of methylene blue in aqueous and mixed aqueous organic solvent: A spectroscopic study, J. Mol. Liq., 2014, 198, 255–258 CrossRef CAS.
- F. W. Weaver, Studies of methylene blue monomer-dimer reaction in super-cooled glycerol, Texas Tech University, 2003 Search PubMed.
- I. Langmuir, The constitution and fundamental properties of solids and liquids. Part I. Solids, J. Am. Chem. Soc., 1916, 38, 2221–2295 CrossRef CAS.
- H. M. F. Freundlich, Over the adsorption in solution, J. Phys. Chem, 1906, 57, 1100–1107 Search PubMed.
- K. Narasimharao, L. P. Lingamdinne, S. Al-Thabaiti, M. Mokhtar, A. Alsheshri, S. Y. Alfaifi and J. R. Koduru, Synthesis and characterization of hexagonal MgFe layered double hydroxide/grapheme oxide nanocomposite for efficient adsorptive removal of cadmium ion from aqueous solutions: Isotherm, kinetic, thermodynamic and mechanism, J. Water Process Eng., 2022, 47, 102746 CrossRef.
- L. P. Lingamdinne, S. K. Godlaveeti, G. K. R. Angaru, Y. Y. Chang, R. R. Nagireddy, A. R. Somala and J. R. Koduru, Highly efficient surface sequestration of Pb2+ and Cr3+ from water using a Mn3O4 anchored reduced graphene oxide: Selective removal of Pb2+ from real water, Chemosphere, 2022, 299, 134457 CrossRef CAS PubMed.
- W. Plazinski and W. Rudzinski, Kinetics of adsorption at solid/solution interfaces controlled by intraparticle diffusion: a theoretical analysis, J. Phys. Chem. C, 2009, 113, 12495–12501 CrossRef CAS.
- H. Shayesteh, F. Raji and A. R. Kelishami, Influence of the alkyl chain length of surfactant on adsorption process: a case study, Surf. Interfaces, 2021, 22, 100806 CrossRef CAS.
- H. Shayesteh, A. Rahbar-Kelishami and R. Norouzbeigi, Evaluation of natural and cationic surfactant modified pumice for congo red removal in batch mode: Kinetic, equilibrium, and thermodynamic studies, J. Mol. Liq., 2016, 221, 1–11 CrossRef CAS.
- J. Li, J. Cai, L. Zhong, H. Wang, H. Cheng and Q. Ma, Adsorption of reactive dyes onto chitosan/montmorillonite intercalated composite: multi-response optimization, kinetic, isotherm and thermodynamic study, Water Sci. Technol., 2018, 77, 2598–2612 CrossRef CAS PubMed.
- A. H. Zaki and M. J. Lee, Effects of K+, Mg2+, Ca2+, Zn2+, La3+, Cr3+, Ce3+, Ce4+, and Mo5+ doping on the adsorption performance and optical properties of sodium titanate nanotubes, ACS omega, 2019, 4(22), 19623–19634 CrossRef CAS PubMed.
| This journal is © The Royal Society of Chemistry 2022 |


