 Open Access Article
Ternary-phase nanostructure W3P/WP/W for high-performance pH-universal water/seawater electrolysis†
Dongkui
Huo
 ,
Zhichao
Sun
 *,
Ying-Ya
Liu
 ,
Zhiquan
Yu
,
Yao
Wang
,
Zhiquan
Yu
,
Yao
Wang
 * and
Anjie
Wang

School of Chemical Engineering, State Key Laboratory of Fine Chemicals, and Liaoning Key Laboratory of Petrochemical Technology and Equipments, Dalian University of Technology, Dalian, 116024, P. R. China. E-mail: wangyao@dlut.edu.cn; sunzhichao@dlut.edu.cn
First published on 26th April 2022
Abstract
With the rapid availability of electricity generated from renewable energy resources, the desire to realize industrialized low-carbon hydrogen production through direct electrolysis of water is no longer an illusion. However, the requirement of traditional electrolysis technology for large amounts of freshwater electrolytes remains a great challenge. Seawater seems to be an ideal substitute for freshwater because of its abundant reserves. However, harsh requirements for electrocatalysts in seawater electrolysis significantly limit its wide application. Here, we report an efficient ternary-phase catalyst (W3P/WP/W) for the hydrogen evolution reaction (HER). The metal-rich phosphide, W3P, reappears in our field of vision after more than 50 years through a more straightforward synthesis and acts as the active phase in the HER for the first time. W3P/WP/W outperforms most counterparts in pH-universal electrolytes. For freshwater electrolytes, it only requires 94 mV (acidic conditions) and 146 mV (alkaline conditions) to attain a current density of 10 mA cm−2 with an extremely low mass loading. And for seawater, in KOH + seawater, only 0.966 V and 1.441 V cell voltages are needed to reach current densities of 10 and 100 mA cm−2. Furthermore, an ion exchange resin pretreatment method is used to meet the demands of proton exchange membrane (PEM) electrolyzers for neutral electrolytes. In this electrolyte, the current decay of the highly non-toxic catalyst in continuous operation for 200 hours is almost negligible. The abundant vacancies, defects and the synergistic effect resulted in the outstanding performance. Consequently, the novel pH-universal electrocatalyst is promising for both freshwater and seawater electrolysis to realize large-scale green hydrogen production.
Introduction
As an ideal route to decarbonize our existing fossil-fuel-dependent energy systems, hydrogen is now in the spotlight. Currently, more than 95% of hydrogen production is contributed by steam methane reforming (SMR), accompanied by a large amount of carbon dioxide production.1 Thus, developing a low-carbon footprint technology to generate hydrogen sustainably is imperative.2 Hydrogen production from water electrolysis is gaining momentum worldwide as renewable electricity costs continue to fall.3Alkaline electrolysis and proton exchange membrane (PEM) systems are two commercial water electrolysis technologies. Alkaline electrolysis is a mature technology that first appeared in the 1920s.4 However, the need for stable catalysts under strong base conditions and the safety threat posed by the extreme corrosiveness are two under-solved problems. Therefore, PEM water electrolysis has been investigated since the early fifties to overcome the drawbacks of alkaline electrolysis.5 A PEM electrolyzer usually uses neutral or weakly acidic electrolytes, avoiding the previous shortcomings. However, most of the catalysts used are still noble metal Pt-based catalysts, and thus a dramatic increase in the cost is inevitable.5 Furthermore, the electrolytes for alkaline electrolyzers and PEM electrolyzers are mainly freshwater. If it is to be industrialized, it will unavoidably lead to a deterioration of the freshwater resources. Seawater would be an ideal candidate to replace freshwater due to its abundance.6 However, two bottleneck problems impede its further utilization. The first is the chlorine evolution reaction (CER) occurring at the anode.7 The concentration of chloride ions in seawater is exceptionally high compared to freshwater. Thereby it is possible they will react on the anode, competing with the oxygen evolution reaction (OER).8 When CER occurs, our target reaction, the hydrogen evolution reaction (HER),9 is greatly hindered and can lead to electrode corrosion. However, in a strong alkaline electrolyte, if the catalyst can generate the required current density at a lower voltage, the CER reaction will not occur.10 This requires catalysts with high activity and high stability under alkaline conditions, and the best candidates are still noble metal catalysts.11 The second bottleneck problem is the emerging insoluble precipitates, mainly calcium hydroxide and magnesium hydroxide, around the electrode as the hydrogen evolution reaction occurs.10 Since seawater is essentially a non-buffered electrolyte, the pH near the electrode surface will change vastly during the electrolysis process, resulting in the precipitation of abundant calcium and magnesium ions in seawater in the form of hydroxides. These residues will adhere to the catalyst surface, hindering or even cutting off the progress of the HER.12 For these two tough problems, designing a non-precious metal catalyst with high activity (to avoid CER) and stability (against strong acid/alkali and poisoning) is vital.
In early studies, transition metal phosphides (TMPs) have emerged as efficient HER electrocatalysts due to their excellent intrinsic catalytic activity, easily tunable composition, and high mechanical stability.13–15 And in recent years, many modified TMPs have been used for efficient seawater electrolysis. In Wu's group, heterogeneous Ni2P–Fe2P micro sheets were synthesized by phosphating nickel foam soaked in hydrochloric acid and iron nitrate solution.16 The synergistic effect brought by the two-phase composition and the corrosion resistance due to the self-support effect makes it an excellent catalyst for the HER. In 1 M KOH + seawater, the catalyst only requires voltages of 1.811 and 2.004 V to achieve current densities of 100 and 500 mA cm−2, respectively. Xu et al. used the dealloying method to obtain nanoporous C-doped Co2P (C-Co2P) successfully.17 In 1 M KOH, C-Co2P only needs an overpotential of 30 mV to deliver a current density of 10 mA cm−2, which is better than commercial Pt/C. Furthermore, only slight degradation over 60 hours at a constant current density from 10 to 1000 mA cm−2 further verified its superior durability in water-splitting devices. Li's group prepared Mo3P/Mo nanobelts by reducing MoO3 precursor in H2/PH3 flow at 750 °C.18 This metal-rich phosphide (Mo3P compared with MoP) is not only shown to be thermodynamically stable, but according to density functional theory (DFT) calculations, the dissociation rate of water on its (321) plane is even faster than that of Pt(111). Furthermore, the introduction of the homologous metal Mo can balance the electronic structure of Mo3P to create additional active sites and accelerate charge transport.19 The overpotential required for Mo3P/Mo nanobelts to reach a current density of 10 mA cm−2 is only 78 mV, and the Tafel slope is also a lower 43 mV dec−1. Furthermore, under alkaline conditions, the stability improvement brought by this particular structure even makes its durability surpass that of Pt wire. The metals tungsten and molybdenum are in the same subgroup (VIB), so they would have similar chemical properties. Metal W has an extremely small resistivity (5.60 × 10⁻⁸ Ω m), and WP has also been attested as an efficient HER catalyst. Therefore, we initially designed a catalyst with a tungsten-rich phosphide WxP (x > 1)/W structure. However, there are very few reports on W3P, including only two articles in 1965.20,21 Hsu et al. obtained W3P crystals by electrolysis of a molten sodium metaphosphate bath containing tungsten trioxide and sodium chloride at about 900 °C. This harsh preparation method may shed light on the scarcity of reports. However, the superconducting properties of W3P under certain conditions are crucial for the HER reaction, which stimulates our research interest again.20 Considering the thermodynamic premise for the preparation of W3P, we chose the H2 temperature-programmed reduction (H2-TPR) for preparation.22 This method can utilize high temperatures to activate the metal and phosphorus components to promote their bonding, and the ratio of metal and phosphorus can be easily regulated.23 Meanwhile, we also adopted the citric acid aging method to weaken the disadvantages of particle agglomeration and overgrowth caused by high temperature, as we reported previously.24
Herein, a unique ternary-crystal, W3P/WP/W, was successfully synthesized via the H2-TPR method. By comparing the relationship between different reduction temperatures and the ratio of each component in the final catalysts, we found the most desirable reduction temperature for the HER. The optimal catalyst (TPM-3) exhibits excellent performance in freshwater HER. The overpotentials required to achieve a current density of 10 mA cm−2 are 94 mV, 146 mV, and 245 mV in acid, alkaline, and neutral electrolytes. This efficient pH-universal catalyst will be a good alternative for the noble metal Pt in freshwater electrolysis. Furthermore, in the natural seawater electrolysis experiment, we adopted the method of adjusting the seawater pH with KOH to meet the demands of traditional alkaline electrolyzers and innovatively employed ion exchange resin to obtain near-neutral seawater to meet the needs of PEM electrolyzers. TPM-3 requires only cell voltages of 0.966 V and 1.441 V to achieve current densities of 10 and 100 mA cm−2 in 1 M KOH seawater, respectively. And its super durability is verified by continuous operation for 200 hours in the ion exchange resin purified seawater at a current density of 100 mA cm−2. The unique ternary-crystal composite (W3P/WP/W), along with the numerous vacancies and defects, is the key to its superior HER performance. All in all, this work not only explores an efficient and facile path for the preparation of metal-rich phosphides; at the same time, it may also provide new ideas for industrial-grade hydrogen production via the electrolysis of both fresh water and seawater.
Results and discussion
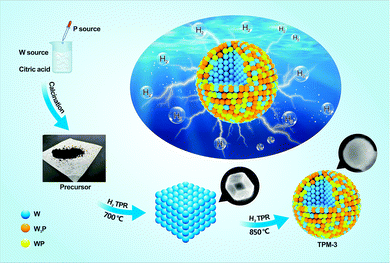
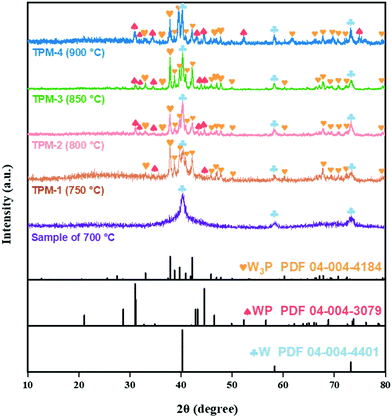
To construct the ternary-phase structure of W3P/WP/W we employed an in situ H2 temperature-programmed reduction (H2-TPR), including two facile steps, as shown in Fig. 1 (for details of the preparation and characterization of the catalysts as well as the procedures of the HER refer to the ESI†). First, we mixed (NH4)6W12O39·xH2O (W source) and citric acid well while adding (NH4)2HPO4 (P source) dropwise and calcined the dewatered product to prepare the precursor. Then, a series of ternary-phase catalysts (TPM-1, TPM-2, TPM-3, TPM-4) were obtained via adjusting the final reduction temperature (750 °C, 800 °C, 850 °C, 900 °C) of H2-TPR.The compositions features were corroborated by X-ray diffraction (XRD) analysis. In Fig. 2, the sample synthesized at 700 °C is well-indexed with metal W (PDF 04-004-4401), including the low-height and wide-FWHM (full width at half maxima) diffraction peaks at 40.3°, 58.3°, and 73.2°, which match well with the (100), (200), and (211) planes of W, respectively.25 Compared with the sample synthesized at 700 °C, TPM-3 (850 °C) exhibited other peaks which can be assigned to W3P and WP. Peaks located at 21.1°, 28.7°, 31.0°, 31.2°, 34.4°, 42.9°, 43.2°, 44.6°, 46.5°, 56.6°, 68.8°, 73.5°, and 73.8° are in accordance with the (101), (002), (010), (200), (201), (202), (112), (211), (103), (020), (114), (222), and (411) planes of WP (PDF 04-004-3079), while the others (except the ones ascribed to W and WP) belong to tetragonal W3P (PDF 04-004-4184).26 Therefore, the main phase indicated from the XRD pattern of TPM-3 is a ternary mixed crystal of W3P, WP, and W. Then, the figure further shows us the changing trend of the phases with increasing reduction temperature. When the final reduction temperature increased from 700 °C to 750 °C, the main crystal phase changed from pure W to a ternary crystal. As the temperature increases to 850 °C, the peaks become sharper. However, when the temperature reaches 900 °C, the peak intensities become weaker but remain a ternary mixed crystal mode. Using the Debye–Scherrer equation,27 we found that the average particle size decreases from TPM-1 to TPM-3 and soars for TPM-4, while the trend of crystallinity is the opposite (Table S1a and b, ESI†). Furthermore, after XRD fitting calculation, we obtained the relative content of each component. The mole ratio of (W3P + WP)/W reaches its climax of TPM-3, far exceeding others. Fig. S1 (ESI†) demonstrates that we successfully synthesized W, WP/W and obtained W3P/WP without an obvious impurity peak after a delicate process, respectively. Based on the existing XRD data, the phase composition changes from a single metal W phase to a ternary crystal one (W3P/WP/W) as the temperature increases from 700 °C to 900 °C. Except for TPM-4, the high-temperature-induced overgrowth and agglomeration are not so severe due to the introduction of citric acid, as we reported before.24 However, at an excessively high temperature (900 °C), the increase in particle size due to agglomeration and the decrease in crystallinity brought by the loss of non-metallic phase P are still inevitable.28 Therefore, 850 °C is a moderate reduction temperature for forming the ternary mixed crystal, W3P/WP/W. At the phase composition level, our goal to synthesize a tungsten-rich tungsten-phosphorus material (WxP/W) has been initially realized, and TPM-3 seems to have the most favorable structure.
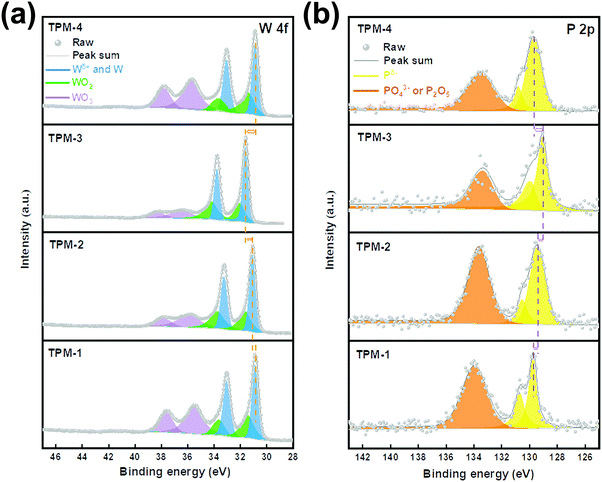
We then applied X-ray photoelectron spectroscopy (XPS) to analyze the chemical states of the elements on the catalyst surface. Fig. 3 shows the spectra of two elements, W and P. Transition metal phosphides are covalent compounds, and the electron cloud density is shared by metal and phosphorus atoms, so the electron binding energies of Wδ+ and Pδ− in W3P, WP are close to their elemental substances.29 When the content of P in the composition is higher, more electrons are adsorbed by the Pδ− species. Therefore, the binding energy of Pδ− is smaller, and the binding energy of W is larger.19,30 As depicted in Fig. 3a, peaks centered at around 33.5 and 31.5 eV account for W 4f5/2 and W 4f7/2 of Wδ+ in W–P bonds.31 The gradual left shift of the central axes demonstrates an increasing binding energy, which indicates an increase in (W3P + WP)/W ratio. Therefore, the content of W3P in TPM-3 is the highest, followed by TPM-2 and TPM-1, and TPM-4 is the lowest. The doublet peaks located at ∼34.5 and 32.5 eV reveal the existence of W4+ (WO2), while the presence of WO3 is also proved by the peaks near 38.0 eV and 36.0 eV.32 The passivation operation in the final step of the synthesis method could shed light on this phenomenon. In the P 2p spectrum (Fig. 3b), the peaks near 129.2 eV and 130.1 eV form doublet peaks which can be attributed to the Pδ−. Furthermore, the binding energy of Pδ− gradually shifts towards a lower one from TPM-1 to TPM-3, while TPM-4 has a positive displacement.31 And similar to the tungsten oxides in the W 4f spectrum, the peaks of phosphorus oxides appear between 133.4 and 134 eV. If we consider the shifts of both Wδ+ and Pδ−, the following conclusions can be drawn. With the increase of reduction temperature (750 °C to 850 °C), the (W3P + WP)/W ratio gradually increased, which can be proved by the positive shift of Wδ+ and the negative shift of Pδ−. At the same time, a larger binding energy leads to more robust electron transfer and more stable bonding, and thus could lead to better electrochemical activity.33 Moreover, the XPS results also provide us with the surface element ratio of W![[thin space (1/6-em)]](https://www.rsc.org/images/entities/char_2009.gif) :
:![[thin space (1/6-em)]](https://www.rsc.org/images/entities/char_2009.gif) P (Table S1a, ESI†). A lower proportion of W:P indicates a higher content of the surface element P, resulting in more W3P and WP. Furthermore, the HER occurs mainly on the catalyst surface, whose performance can be largely enhanced by more exposed active sites.18 Therefore, owing to the considerable amount of facial W3P and WP, TPM-3 shows potential for an excellent performance in the HER.
P (Table S1a, ESI†). A lower proportion of W:P indicates a higher content of the surface element P, resulting in more W3P and WP. Furthermore, the HER occurs mainly on the catalyst surface, whose performance can be largely enhanced by more exposed active sites.18 Therefore, owing to the considerable amount of facial W3P and WP, TPM-3 shows potential for an excellent performance in the HER.
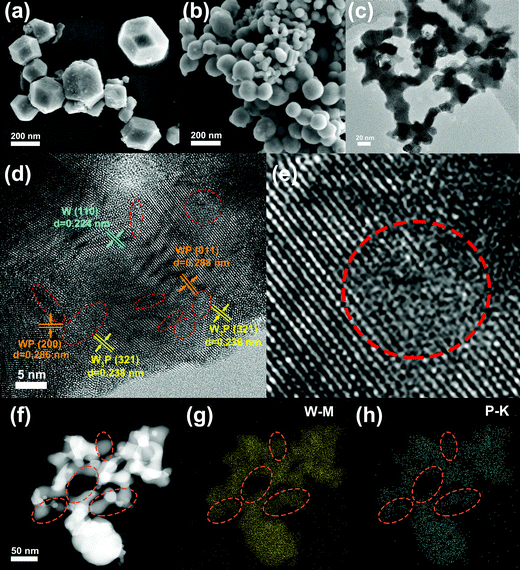
We further revealed the microstructure of the catalysts using a field emission scanning electron microscope (FE-SEM) and transmission electron microscopy (TEM). As shown in Fig. 4a, the sample reduced at 700 °C appears in a cubic shape, and the enlarged image is displayed in the upper right corner. When the temperature rises to 850 °C (TPM-3), the shape gradually becomes a sphere, and it also has a slight size reduction (Fig. 4b). However, when the temperature was raised to 900 °C (TPM-4), severe overgrowth and agglomeration occurred, in line with the XRD results (Fig. S2, ESI†). For the TEM patterns, a low-resolution image for TPM-3 was displayed in Fig. 4c. The particles are highly dispersed, and the average particle size of TPM-3 is 21.2 nm after measurement, which is smaller than the other counterparts (Table S1b, ESI†). Moreover, high-resolution TEM (HR-TEM) shows us the details of the inner structure of TPM-3. In Fig. 4d, TPM-3 is demonstrated to have a high crystallinity owing to the legible lattice fringes. Furthermore, the widths of the textures are consistent with W3P(321) (0.238 nm), WP(011) (0.288 nm), WP(200) (0.286 nm), and W(110) (0.224 nm).34 More importantly, numerous defects and vacancies appear between the phase interfaces, and Fig. 4e shows details of the defects and vacancies. These defects could rearrange the local electronic structure, thereby changing the adsorption/desorption behavior, leading to a more favorable catalytic performance.35,36 Moreover, the corresponding electron diffraction image (SAED) shows that the luminous concentric rings are composed of discrete points corresponding to the W3P(321) and WP(011) plane.37 Together with the bright faculae corresponding to W(110), these two circles further attest TPM-3, a ternary-phase crystal with high crystallinity (Fig. S3, ESI†). Energy-dispersive X-ray spectroscopy (EDS) mapping is also employed to investigate the elemental distribution (Fig. 4f–h). The mappings of W and P reveal a uniform distribution of the two elements. In particular, the density of bright spots representing P is much lower than in other regions in the circled region, which confirms a higher proportion of W3P and W in this area.
Since we obtained a polycrystalline catalyst, a quantitative analysis by ICP-OES to testify its main elemental composition is essential. Table S1a (ESI†) shows the calculated results. The exact metal percentages of W/P for all these samples are larger than 3 (the initial adding ratio), indicating a loss of P during the preparation. However, among all the catalysts, TPM-3 has the lowest W/P value, and this also proves that it contains the largest total amount of W3P and WP, which is also consistent with the XRD and XPS results. For a catalytic reaction, having a larger specific surface area may expose larger active sites, thereby improving the reaction activity. We therefore further tested the specific surface area and average pore size of the samples (Table S1b, ESI†). The low-temperature nitrogen adsorption-desorption isotherms of the TPMs are all type II (Fig. S4, ESI†). The BET surface area shrinks from low temperature to high temperature. And the BET surface area of TPM-3 (4.6 m2 g−1) is nearly fourfold of TPM-4 (1.2 m2 g−1), which means that the introduction of citric acid can inhibit the sintering caused by high temperature to a certain extent. The large specific surface area is conducive to the exposure of active sites, which is extremely important for the HER reaction that mainly occurs on the catalyst surface.38 Therefore, the electrochemical performance of TPM-3 is anticipated.
Electrochemical performance
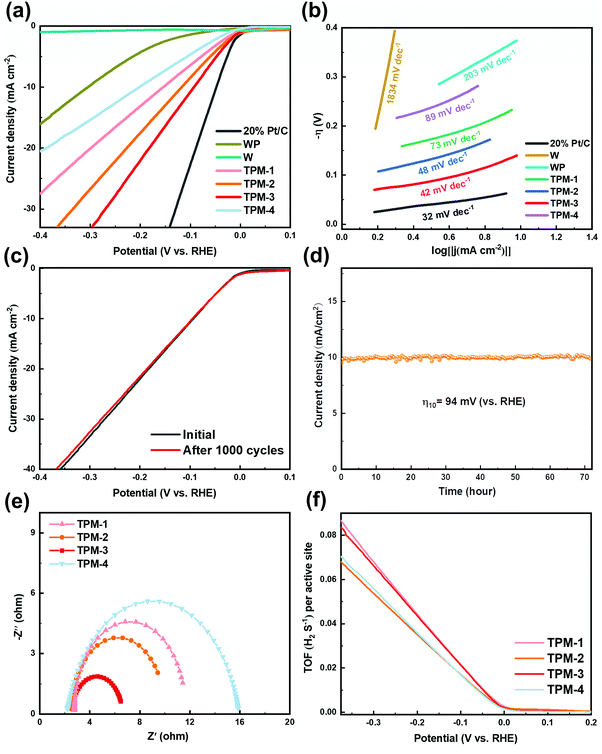
The electrochemical performance was first assessed in an acid electrolyte (0.5 M H2SO4). For linear sweep voltammogram (LSV) tests, 20 wt% Pt/C for commercial use was selected as the benchmark, and the other catalysts were all examined under identical conditions. From Fig. 5a, we can see the outstanding performance of commercial Pt/C with a near-zero initial overpotential and the lowest overpotential (47 mV) to attain a current density of 10 mA cm−2, which is in coincidence with earlier studies.33,39 TPM-3 exhibited a better HER performance (94 mV) than TPM-2 (117 mV), TPM-1 (153 mV), and TPM-4 (202 mV). And the pure WP and W were ranked the lowest (304 mV and over 800 mV), which is in accordance with previous studies.40,41 The superior HER performance of TPM-3 exceeded most WP-based electrocatalysts in an acid medium, and the details are listed in Table S2 (ESI†). Due to the low catalytic performance of W, we are not wholly sure whether to regard it as a main active phase. Furthermore, as the mole ratio ((W3P + WP)/W) increases (Table S1a, ESI†), the overpotential gradually becomes lower and the performance improves. This result echoes the defects caused by W3P and WP. Catalysts with P vacancies always show enhanced HER activity because of the increased number of active sites and the optimized hydrogen adsorption free energy by tuning the d orbital electron density of the parent metal (W).42,43 To further probe the influence of each component, we added a comparison of WP/W, W3P/WP, and TPM-3 in the overpotential. As depicted in Fig. S4 (ESI†), WP/W showed the worst activity (284 mV) but it was better than pure WP and W. At the same time, the overpotential of W3P/WP (227 mV) decreased not as drastically as WP/W, and is better than pure WP. Therefore, W may play a more important role in promoting charge transport in this ternary mixed crystal catalyst than acting as a main active phase, and the proportion of W should not be too high. A large number of vacancies and active sites brought about by the introduction of W3P may motivate the synergistic effect of WP and W3P, which can highly enhance the performance. To further investigate the reaction pathway, we drew the Tafel curves and calculated the Tafel slopes according to the Tafel equation (η = b × log|j| + a, where j, b and a stand for the current density, Tafel slope, and a constant parameter, respectively) (Fig. 5b). According to its mathematical meaning, a small Tafel slope can obtain a larger overpotential with a smaller current density increment, thereby showing better electrocatalytic activity. Notably, 20% Pt/C exhibited the smallest Tafel slope (32 mV dec−1), the same as the reported data.44 The trend of the Tafel slope is similar to the overpotential. Namely, TPM-3 (42 mV dec−1), TPM-2 (48 mV dec−1), TPM-1 (73 mV dec−1), and TPM-4 (89 mV dec−1) are in the first echelon, and WP (203 mV dec−1) is in the second. The minimal Tafel slope of W (1834 mV dec−1) further proves its poor activity. Generally, in an acidic electrolyte, a Tafel slope over 118 mV dec−1 indicates that the rate-determining step is the Volmer step. And the Tafel slopes of 39 and 29 mV dec−1 indicate the Heyrovsky and Tafel steps, respectively.45 In this section, TPM-1, TPM-2, TPM-3, and TPM-4 are all in the interval of 39 to 118 mV dec−1, which can be speculated to be a mixed Volmer–Heyrovsky mechanism, and the primary rate-determining step is the Heyrovsky reaction. And for W, the reaction pathway is the Volmer step.To further assess the durability of TPM-3, two stability testing methods were adopted: a chronoamperometry test with a scan rate of 2 mV s−1 for 1000 cycles (Fig. 5c) and a chronopotentiometry test at an overpotential η10 = 94 mV for 72 hours (Fig. 5d). After 1000 cycles, the attenuation is almost negligible at a low current density, while at a high current density (40 mA cm−2), an additional voltage of 1.94% is required to be maintained. In the long-period experiment of over 72 hours, the catalyst still maintained a relatively stable current density. Furthermore, we characterized the catalyst after the stability test. In Fig. S6 (ESI†), the catalyst still maintained the composition from the patterns of XRD and XPS. All these results signify an excellent endurance for repeated use and favorable durability at high current density.
In order to further explore the internal factors boosting the electrocatalytic HER activity of TPM-3, an EIS measurement was obtained. Typically, the semicircular-like impedance curve indicates the charge transfer rate near the electrode surface.46 The smaller the radius of the semicircular plot, the lower the surface-charge resistance (Rct) and the faster the electron transfers on the interface. The fitted Nyquist plots (at 150 mV) of TPM-1, TPM-2, TPM-3, and TPM-4 are profiled in Fig. 5e. Among all four catalysts, the smallest radius of the Nyquist plot of TPM-3 leads to the minimum surface-charge resistance, thus indicating a superfast interface electron transfer rate, a better electrical conductivity, and an improved performance. Meanwhile, we also carried out EIS tests on TPM-3, WP/W, and W3P/WP to investigate the effects of the components on the electrochemical performance, and the data are shown in Table S3 and Fig. S7 (ESI†). Although their overpotentials differ significantly, the Rp, which stands for the resistance related to the surface porosity and conductivity, is almost the same for TPM-3 and WP/W.47 However, TPM-3 and W3P/WP showed quite different Rp but a similar Rct. This means the surface conductivity is enhanced by the W component, while W3P can reduce the Rct efficiently, thus facilitating the reaction as the main active phase.
The HER is a reaction that mainly occurs on the surface of the catalyst and its reaction rate is proportional to the electrochemically active surface area (ECSA).48 We use cyclic voltammograms (CVs) to calculate the double-layer capacitance (Cdl), half of which is the value of ECSA. More details are available in Fig. S8 (ESI†). After calculation, the ECSA of TPM-3 is the largest (940 cmECSA2), consistent with its excellent catalytic performance. The EIS and ECSA data of TPM-3 confirm the high charge conduction efficiency and exposed active sites, proving our original idea of introducing a tungsten-rich tungsten-phosphorus material (WxP/W) to diminish the surface-charge resistance and metal tungsten to improve the conductivity.
For a catalytic reaction, the turnover frequency (TOF) is a vital indicator to evaluate its intrinsic activity.47 Generally, the larger the turnover frequency, the more reactant molecules are converted per unit active center per unit time, and the better the catalytic performance. The HER reaction is no exception, and its TOF value is closely related to the rate at which hydrogen molecules are generated. Fig. 5f shows us the relationship between TOF value and overpotential. In particular, we calculated the TOF value at −300 mV (details are available in Fig. S9 and Table S4, ESI†). We found that the values of TPM-3 (0.066 H2 s−1) and TPM-1 (0.068 H2 s−1) were similar and much larger than the other two. TPM-3 can maintain a high electrochemical active area and TOF value after being reduced at a high temperature of 850 °C, which are the intrinsic factors for its excellent activity. In contrast, although the ECSA of TPM-1 is not large, the TOF value is higher than TPM-3, which may be due to the full dispersion of its low content active phase.
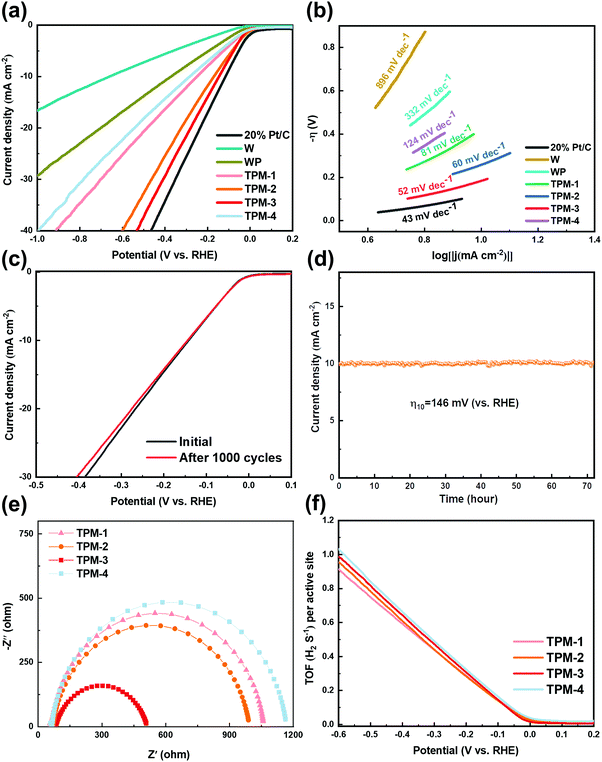
To test its performance under alkaline conditions, we selected 1 M KOH as the electrolyte. Fig. 6a illustrates the LSV results after iR-correction. The commercial Pt/C shows the lowest overpotential in obtaining a cathodic current density of 10 mA cm−2 again. Compared to the acidic conditions, TPM-3 narrowed the gap between Pt/C with an overpotential of 146 mV, exhibiting prominent HER activity in an alkaline electrolyte. TPM-3 outperforms all the other catalysts we have synthesized and most WP-based ones (more details are in Table S5, ESI†). Also, we compared the performance of WP/W, W3P/WP, and TPM-3 again. Unsurprisingly, much more voltage is needed for these two binary-phase crystals to deliver 10 mA cm−2, identical to the results in the acid medium (Fig. S10, ESI†). For the Tafel slope, TPM-3 presents 52 mV dec−1 in Fig. 6b, much smaller than pristine W or WP in KOH electrolyte. Both the overpotentials and Tafel slope results confirm that TPM-3 has a considerable application prospect in an alkaline electrolyte. It should be noted that under alkaline conditions, both the overpotential and the Tafel slope are much larger than under acidic conditions, which also proves the hardship of the HER under alkaline conditions.18 As for the reaction pathway, except for the TPM-4, all the ternary crystal-based electrocatalysts display a mixed Volmer–Heyrovsky mechanism, and the primary rate-determining step is the Heyrovsky reaction. After a successive 1000 CV scanning cycles, the LSV curve of TPM-3 was recorded to detect its stability (Fig. 6c). Little performance degradation is observed in a low current density (10 mA cm−2). But more voltage (4.93%) is needed to achieve a current density of 30 mA cm−2, larger than that in 0.5 M H2SO4 (1.94%). Furthermore, during the long-term stability test, TPM-3 can maintain a current density of 10 mA cm−2 for up to 72 hours with an overpotential of 146 mV, but the decay and fluctuation frequencies are more apparent than those in the acidic medium (Fig. 6d). The XRD and XPS results confirm no significant change in its structure and composition before and after the reaction (Fig. S11, ESI†). As we can see from Fig. 6e and Fig. S12 and Table S6 (ESI†), the EIS results show that TPM-3 has the smallest Rct value (431.2 Ω), which means a faster electron transfer rate and thus significantly faster HER kinetics. Additionally, the Rp of W3P/WP is larger than TPM-3, and the Rct of WP/W diminished due to the absence of active phase W3P. These phenomena are consistent with those found under acidic conditions.
Furthermore, the ECSA values of TPMs are also calculated through the curves presented in Fig. S13 (ESI†). TPM-3 outperforms all the other TPMs with an ECSA of 85.0 cm2ECSA, which could shed light on its excellent electrochemical activity. Abundant defects and vacancies lead to highly exposed active sites, thus a large ECSA. However, the ECSA values in 1 M KOH is much smaller than in an acid electrolyte (0.5 M H2SO4), implying a tougher reaction pathway under alkaline conditions. And for the TOF values, at the overpotential of −300 mV, TPM-3 (0.473 s−1) and TPM-4 (0.490 s−1) show higher TOFs as compared to TPM-2 (0.441 s−1) and TPM-1 (0.439 s−1) (Fig. 6f). The calculation process is shown in the ESI.† Though the TOF of TPM-3 is a little smaller than TPM-4, the ECSA value of TPM-3 is nearly twice that of TPM-3 (40.0 cmECSA2), which confers TPM-3 a better electrochemical performance as shown in the LSV curves.
To realize our original intention of designing a pH-universal electrocatalyst, we chose 1 M PBS as a neutral experimental condition. Once again, TPM-3 demonstrates superior HER performance over TPM-1, TPM-2, and TPM-4 with a smaller overpotential of only 245 mV at 10 mA cm−2 and a smaller Tafel slope of 117 mV dec−1 (Fig. S14a and b, ESI†). The comparison of TPM-3 and some recently reported catalysts in 1 M PBS are listed in Table S7 (ESI†). Besides, TPM-3 also shows good stability in the 1000 cycle test (Fig. S14c, ESI†) and the 72 hour long-term stability test (Fig. S14d, ESI†). Characterization of the catalyst used for 72 consecutive hours demonstrates no significant change in its structure (Fig. S15, ESI†). Furthermore, the minimum diameter in the Nyquist curves and the smallest Rct among the TPMs exhibited in Fig. S14e and Table S8 (ESI†) also indicate the favorable charge transfer processes on its electrode surface. Other calculated results such as ECSA (Fig. S16, ESI†) and TOF (Fig. S14f, ESI†) values also attest to the excellent HER performance of TPM-3 in 1 M PBS. The details of the calculation are shown in the ESI.†
All the above results demonstrate that TPM-3 achieves significantly enhanced HER catalytic activity in the pH-universal electrolytes compared with other TPMs, which can be attributed to the reinforced charge conduction brought about by the introduction of homologous metal tungsten, and the enhanced effect of the defects and vacancies caused by the unique ternary-crystal structure.
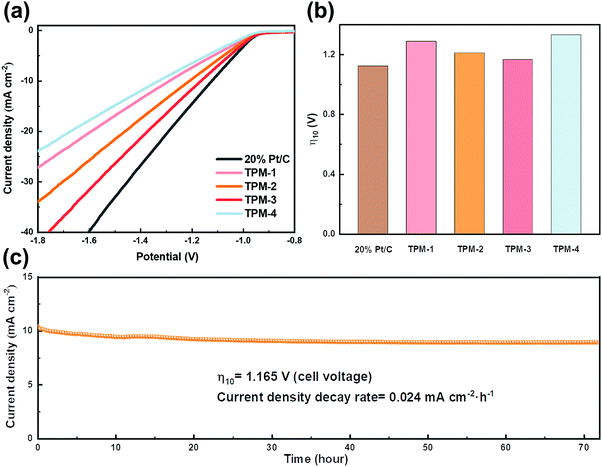
The remarkable activity of these catalysts makes us look forward to their performance in seawater splitting. We first started the experiment in simulated alkaline seawater. Even suffering from the impact of Ca and Mg ions, TPM-3 still showed higher catalytic activity compared to other catalysts (Fig. 7a). The cell voltage required to achieve the current density of 10 mA cm−2 is only 1.165 V, which is comparable to the Pt/C (1.122 V), and outperforms most of the counterparts under the same conditions (Fig. 7b and Table S9, ESI†). Moreover, TPM-3 proved its long cycle stability through a high-current operation for up to 72 hours with a slight potential decay of 0.024 mA cm−2 h−1 at a current density of 10 mA cm−2 (Fig. 7c). After the stability test, the phase composition and microstructures of TPM-3 were also investigated by XRD, XPS, and TEM (Fig. S17, ESI†). No distinct structural collapse is detected, demonstrating its high structural durability. Of particular notice are the new signals of Ca 2p and Mg 1s detected by XPS, which means that the Ca and Mg ions in the solution dissolved out and attached to the catalyst surface with the water splitting.49 And this would result in the hindrance of active sites and surface poisoning.17 Therefore, we further detected the concentration change of Ca and Mg ions before and after the reaction (Table S10, ESI†). The results revealed a slight decrease (about 5% for Mg and 4% for Ca) which confirms an anti-poisoning ability of TPM-3 in this artificial alkaline seawater.
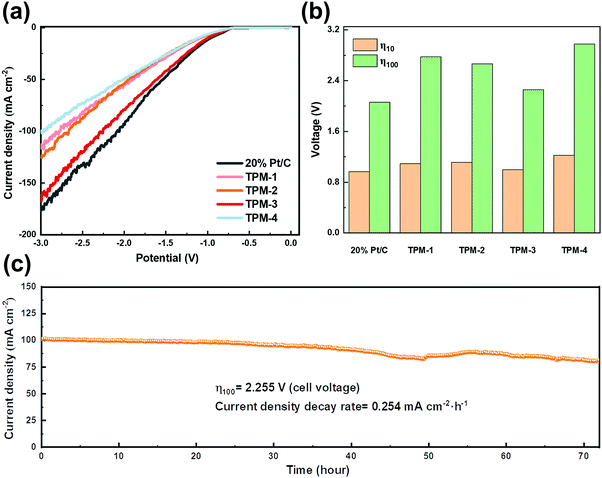
The benign results in the simulated seawater give us confidence in its practical usage on natural seawater. We collected natural seawater from Xinghai Bay in Dalian, Liaoning, China (details are given in Fig. S18 and Table S11, ESI†). After simply filtering out the insoluble, we directly used the filtrate as the electrolyte for LSV testing. TPM-3 required a cell voltage of 0.998 V to obtain a current density of 10 mA cm−2, which is competitive to both Pt/C (0.965 V) and the recently reported catalysts (Table S9, ESI†); while an extra cell voltage of 1.257 V is needed for 100 mA cm−2 (2.255 V) (Fig. 8a and b). From Video S1 (ESI†), we can see that accompanied by the hydrogen emission is the excessive insoluble precipitation of the white solid. These sediments (the main components are calcium hydroxide and magnesium hydroxide) could veil the electrode surface, thus diminishing the number of active sites.50 This may shed light on the dramatically increased voltage to achieve a higher current density. Next, a 72 hour stability test was carried out (Fig. 8c). The current density degradation rate is 0.254 mA cm−2 h−1, much higher than expected, and many seditions emerged at the bottom of the electrolytic cell (Fig. S20, ESI†). Moreover, from the XRD and XPS patterns of TPM-3 after the stability test, though the main structure does not change, the intensities of Ca 2p and Mg 1s are much more robust (Fig. S19, ESI†). And as shown in Fig. S19f (ESI†), high concentrations of calcium and magnesium ions will also blur the lattice fringes of the catalyst during the reaction. As the previous research shows, the concentration of alkaline earth metal cations, such as Ca and Mg ions, has a significant impact.17 We further measured the content of these two ions in the electrolyte before and after the long-cycle reaction and found a considerable reduction after the test (Table S10, ESI†). The loss of magnesium ions is about 6.9 times that under simulated seawater conditions, while the loss of calcium ions is about 6.4 times. It is not difficult to imagine that these residues will attach to the active site, thereby significantly impeding the catalytic process. Hence, pretreatment to reduce the concentration of calcium and magnesium ions in the natural seawater will efficiently enhance the reaction performance, stability, and thus the economy.
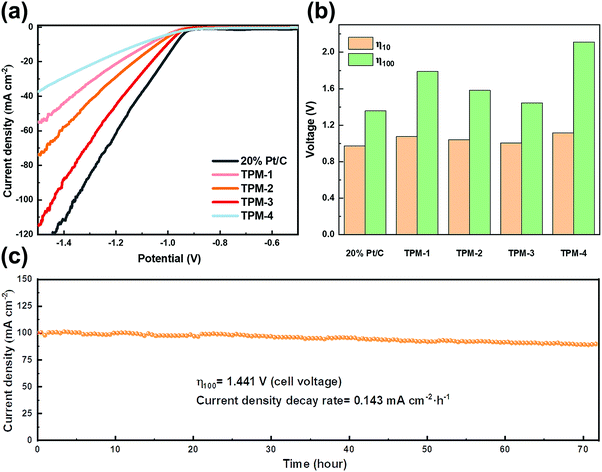
Along this line, we first applied KOH to adjust the content of the two ions and simultaneously acquired an alkaline seawater electrolyte (1 M KOH + seawater). This optimization method is also intended to simulate the commercial alkaline seawater electrolysis mode. Under the same test conditions, though TPM-3 showed no significant improvement at a low current density (0.966 V for 10 mA cm−2), the voltage required to achieve 100 mA cm−2 is 36% lower than that of natural seawater (1.441 V compared with 2.255 V) (Fig. 9a and b). Both the cell voltages required for current densities of 10 and 100 mA cm−2 outperform most of the electrocatalysts in alkaline seawater (Table S9, ESI†). Furthermore, an operation at 100 mA cm−2 for 72 hours only resulted in a degradation rate of 0.143 mA cm−2 h−1, which is 43% lower than the untreated natural seawater (Fig. 9c). And no apparent structural degradation is perceived for TPM-3, revealing high durability in alkaline seawater (Fig. S21, ESI†). As shown in Table S10 (ESI†), Ca and Mg ions exhibited a relatively low initial concentration and a slight concentration loss. The former facilitates the high performance by minimizing the poisoning caused by high concentration, while the latter indicates fewer residuals on the active sites, thus leading to higher stability. All these results demonstrate that TPM-3 is promising as an efficient and durable electrocatalyst for commercial alkaline electrolyzers.
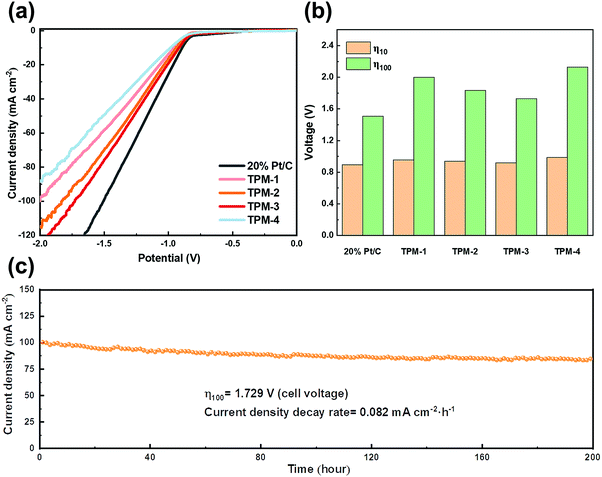
Furthermore, another method of gently softening seawater is utilizing ion exchange resin. This strategy is designed to meet the demand for a proton exchange membrane (PEM) based electrolyzer, which requires a neutral or near-neutral electrolyte environment (∼7.4) for seawater splitting.51 Amberlite IR120, a representative industrialized ion exchange resin, can exchange calcium and magnesium ions for removing both ions with little change in pH. Pretreatment and regeneration steps for resin pellets are shown in the ESI.† After the pretreatment, natural seawater was washed with the ion resin filter column several times. After ion exchange, the color of the resin spheres is obviously darker, which indicates the efficient removal of calcium and magnesium ions (Fig. S22, ESI†). Furthermore, the pH (approximately 7.5) is maintained after the softening process. Then, in the electrolyte of pretreated seawater, the LSV test was conducted, and the curves are shown in Fig. 10a and b. TPM-3 requires voltages of 0.917 and 1.729 V to drive current densities of 10 and 100 mA cm−2, respectively. It is noteworthy that the gap between the commercial Pt/C and TPM-3 is much narrower than that in the untreated seawater, confirming a more satisfying performance against a noble-metal-based electrocatalyst (Table S9, ESI†). And its durability is guaranteed by not only the current density decay rate (0.082 mA cm−2 h−1), but also the almost unchanged structure after a stability test of up to 200 hours (Fig. S23, ESI†). In addition, the weak peak intensity of Ca 2p and Mg 1s implies a minimal residue on the surface (Fig. S23d and e, ESI†), which demonstrates the high efficiency of the treatment method. Compared with other seawater-based electrolytes, the XRD characteristic peaks and the lattice fringes of the TEM patterns were more transparent after the stability test (Fig. S23a and f, ESI†). Also, there was no evident precipitation in the electrolytic cell after 200 hours of operation, which corresponds to the tiny concentration change of calcium and magnesium ions before and after the reaction (Fig. S24 and Table S10, ESI†).
Therefore, the HER performance is greatly improved after removing calcium and magnesium ions from the seawater. The large number of defect sites and vacancies brought by this ternary-phase catalyst can be exposed to the greatest extent. At low current densities, the ion resin exchange method has a more significant improvement, which may be due to the mild processing conditions and near-neutral reaction conditions. At high current densities, the advantages of the KOH-treatment method are manifested, which may be attributed to the better kinetics of the HER reaction under alkaline conditions than under neutral ones.
Conclusions
W3P, which first and only appeared over 50 years ago, is awakened again. We synthesized a series of unique W3P-containing-ternary-crystal catalysts (W3P/WP/W, denominated as TPMs) using a temperature-programmed reduction method and applied them to the hydrogen evolution reaction (HER). The unique ternary-phase structure and a high reduction temperature successfully induced numerous defects, vacancies and the synergistic effect between the active phases, which render TPM-3 a highly efficient pH-universal electrocatalyst. Overpotentials as small as 94 mV and 146 mV are required for TPM-3 to achieve a current density of 10 mA cm−2 in acid and alkaline electrolyte, respectively. TPM-3 also shows excellence in Tafel slope, stability tests, EIS, ECSA, and TOF value. Moreover, for seawater splitting, we utilized simulated seawater and natural seawater as electrolytes. The cell voltages for TPM-3 to achieve 10 mA cm−2 are small. Moreover, we designed two methods to soften the seawater and adjust the pH of the electrolyte to suit the two leading seawater electrolysis equipment, alkaline electrolyzer and proton exchange membrane (PEM) based electrolyzer. In 1 M KOH + seawater, TPM-3 outperforms most electrocatalysts by a cell voltage of 0.966 V to achieve 10 mA cm−2 and 1.441 V for 100 mA cm−2. Then, after the ion exchange resin softening treatment, the seawater maintained a near-neutral pH, and TPM-3 also showed high performance and a neglectable current decay rate of 0.082 mA cm−2 h−1 in a stability test of up to 200 hours. All in all, the study presents a series of W3P-based ternary-phase electrocatalysts for pH-universal hydrogen evolution reaction, especially for seawater splitting. TPMs are expected to meet the needs of two existing industrial seawater electrolyzers and, at the same time, provide new ideas for the design of new metal-rich phosphide catalysts to substitute noble-metal-based catalysts in the future.Author contributions
Dongkui Huo: conceptualization, investigation, methodology, validation, data curation, formal analysis, writing – original draft, writing-review & editing. Zhichao Sun: supervision, visualization, data curation, project administration, validation, writing – review & editing. Ying-Ya Liu: resources, funding acquisition, data curation, validation, writing – review & editing. Zhiquan Yu: resources, data curation, validation, writing – review & editing. Yao Wang: resources, funding acquisition, supervision, project administration, validation, writing – review & editing. Anjie Wang: resources, funding acquisition.Conflicts of interest
There are no conflicts to declare.Acknowledgements
This research was financially supported by the Natural Science Foundation of China (22172015, 22172012, 21972014, 21872014), the International S&T Cooperation Program of China (2016YFE0109800), and the Key R&D Program of Ningxia in China (2018YBZD0763).References
- H. Idriss, Energy Technol., 2021, 9, 2194 CrossRef.
- Y. H. Liao, S. F. Koelewijn, G. Van den Bossche, J. Van Aelst, S. Van den Bosch, T. Renders, K. Navare, T. Nicolai, K. Van Aelst, M. Maesen, H. Matsushima, J. M. Thevelein, K. Van Acker, B. Lagrain, D. Verboekend and B. F. Sels, Science, 2020, 367, 1385 CrossRef CAS PubMed.
- G. Glenk and S. Reichelstein, Nat. Energy, 2019, 4, 216 CrossRef CAS.
- S. Dunn, Int. J. Hydrogen Energy, 2002, 27, 235 CrossRef CAS.
- M. Carmo, D. L. Fritz, J. Merge and D. Stolten, Int. J. Hydrogen Energy, 2013, 38, 4901 CrossRef CAS.
- S. Dresp, F. Dionigi, M. Klingenhof and P. Strasser, ACS Energy Lett., 2019, 4, 933 CrossRef CAS.
- S. H. Hsu, J. W. Miao, L. P. Zhang, J. J. Gao, H. M. Wang, H. B. Tao, S. F. Hung, A. Vasileff, S. Z. Qiao and B. Liu, Adv. Mater., 2018, 30, 261 CrossRef PubMed.
- W. J. Zang, T. Sun, T. Yang, S. B. Xi, M. Waqar, Z. K. Kou, Z. Y. Lyu, Y. P. Feng, J. Wang and S. J. Pennycook, Adv. Mater., 2021, 33, 3846 CrossRef PubMed.
- J. A. Turner, Science, 2004, 305, 972 CrossRef CAS PubMed.
- F. Dionigi, T. Reier, Z. Pawolek, M. Gliech and P. Strasser, ChemSusChem, 2016, 9, 962 CrossRef CAS PubMed.
- V. R. Stamenkovic, B. S. Mun, M. Arenz, K. J.-J. Mayrhofer, C. A. Lucas, G. Wang, P. N. Ross and N. M. Markovic, Nat. Mater., 2007, 6, 241 CrossRef CAS PubMed.
- A. J. Esswein, Y. Surendranath, S. Y. Reece and D. G. Nocera, Energy Environ. Sci., 2011, 4, 499 RSC.
- Q. Lian, L. Zhong, C. Du, Y. Luo, J. Zhao, Y. Zheng, J. Xu, J. Ma, C. Liu, S. Li and Q. Yan, ACS Nano, 2019, 13, 7975 CrossRef PubMed.
- X. Wang, Y. Chen, B. Yu, Z. Wang, H. Wang, B. Sun, W. Li, D. Yang and W. Zhang, Small, 2019, 15, 2613 Search PubMed.
- S. Chu, W. Chen, G. Chen, J. Huang, R. Zhang, C. Song, X. Wang, C. Li and K. Ostrikov, Appl. Catal., B, 2019, 243, 537 CrossRef CAS.
- L. Wu, L. Yu, F. Zhang, B. McElhenny, D. Luo, A. Karim, S. Chen and Z. Ren, Adv. Funct. Mater., 2020, 31, 6484 Search PubMed.
- W. Xu, G. Fan, S. Zhu, Y. Liang, Z. Cui, Z. Li, H. Jiang, S. Wu and F. Cheng, Adv. Funct. Mater., 2021, 31, 7333 Search PubMed.
- F. Li, G. F. Han, H. J. Noh, Y. Lu, J. Xu, Y. Bu, Z. Fu and J. B. Baek, Angew. Chem., Int. Ed., 2018, 57, 14139 CrossRef CAS PubMed.
- P. Xiao, M. A. Sk, L. Thia, X. Ge, R. J. Lim, J. Y. Wang, K. H. Lim and X. Wang, Energy Environ. Sci., 2014, 7, 2624 RSC.
- R. D. Blaugher and J. K. Hiulm, J. Phys. Chem. Solids, 1965, 26, 2037 CrossRef CAS.
- S. Rundqvist, Nature, 1966, 211, 847 CrossRef CAS.
- Z. Yu, Y. Wang, Z. Sun, X. Li, A. Wang, D. M. Camaioni and J. A. Lercher, Green Chem., 2018, 20, 609 RSC.
- Z. Yu, F. Meng, Y. Wang, Z. Sun, Y. Liu, C. Shi, W. Wang and A. Wang, Ind. Eng. Chem. Res., 2020, 59, 7416 CrossRef CAS.
- D. Huo, Z. Sun, Y. Liu, Z. Yu, Y. Wang and A. Wang, ACS Sustainable Chem. Eng., 2021, 9, 12311 CrossRef CAS.
- Q. Liang, Q. Zhang, X. Zhao, M. Liu and A. T.-S. Wee, ACS Nano, 2021, 15, 2165 CrossRef CAS PubMed.
- F. Li, C. Wang, X. Han, X. Feng, Y. Qu, J. Liu, W. Chen, L. Zhao, X. Song, H. Zhu, H. Chen, M. Zhao, Z. Deng, J. Wu, P. Zhang and L. Gao, ACS Appl. Mater. Interfaces, 2020, 12, 22741 CrossRef CAS PubMed.
- M. V. Takarkhede, S. A. Band, K. R. Nemade and S. A. Fadanavis, Ceram. Int., 2016, 42, 1021 CrossRef CAS.
- S. J. Marje, P. K. Katkar, S. B. Kale, A. C. Lokhande, C. D. Lokhande and U. M. Patil, J. Alloys Compd., 2019, 779, 49 CrossRef CAS.
- X. Liu, J. Chen and J. Zhang, Ind. Eng. Chem. Res., 2008, 47, 5362 CrossRef CAS.
- A. Kondori, M. Esmaeilirad, A. Baskin, B. Song, J. Wei, W. Chen, C. U. Segre, R. Shahbazian-Yassar, D. Prendergast and M. Asadi, Adv. Energy Mater., 2019, 9, 2639 Search PubMed.
- Z. Xing, Q. Liu, A. M. Asiri and X. Sun, ACS Catal., 2014, 5, 145 CrossRef.
- J. M. McEnaney, J. C. Crompton, J. F. Callejas, E. J. Popczun, C. G. Read, N. S. Lewis and R. E. Schaak, Chem. Commun., 2014, 50, 11026 RSC.
- Y. Duan, Y. Sun, S. Pan, Y. Dai, L. Hao and J. Zou, ACS Appl. Mater. Interfaces, 2016, 8, 33572 CrossRef CAS PubMed.
- K. Xu, X. Fu, H. Li and Z. Peng, Appl. Surf. Sci., 2018, 456, 230 CrossRef CAS.
- T. Zheng, W. Sang, Z. He, Q. Wei, B. Chen, H. Li, C. Cao, R. Huang, X. Yan, B. Pan, S. Zhou and J. Zeng, Nano Lett., 2017, 17, 7968 CrossRef CAS PubMed.
- X. Wang, X. Gan, T. Hu, K. Fujisawa, Y. Lei, Z. Lin, B. Xu, Z. H. Huang, F. Kang, M. Terrones and R. Lv, Adv. Mater., 2017, 29, 3617 Search PubMed.
- D. Li, D. Liu, S. Zhao, S. Lu, Y. Ma, M. Li, G. Chen, Y. Wang, G. Zhou and C. Xiao, Int. J. Hydrogen Energy, 2019, 44, 31072 CrossRef CAS.
- Z. Cheng, Y. Xiao, W. Wu, X. Zhang, Q. Fu, Y. Zhao and L. Qu, ACS Nano, 2021, 15, 11417 CrossRef CAS.
- W. Gao, M. Yan, H.-Y. Cheung, Z. Xia, X. Zhou, Y. Qin, C.-Y. Wong, J. C. Ho, C.-R. Chang and Y. Qu, Nano Energy, 2017, 38, 290 CrossRef CAS.
- J. Wang, K. Chang, Z. Sun, J. H. Lee, B. M. Tackett, C. Zhang, J. G. Chen and C. J. Liu, Appl. Catal., B, 2019, 251, 162 CrossRef CAS.
- L. Wu, Z. H. Pu, Z. K. Tu, I. S. Amiinu, S. J. Liu, P. Y. Wang and S. C. Mu, Chem. Eng. J., 2017, 327, 705 CrossRef CAS.
- M. A.-R. Anjum and J. S. Lee, ACS Catal., 2017, 7, 3030 CrossRef CAS.
- T. A. Shifa, F. Wang, K. Liu, Z. Cheng, K. Xu, Z. Wang, X. Zhan, C. Jiang and J. He, Small, 2017, 13, 3706 CrossRef PubMed.
- M. Shi, W. Li, J. Fang, Z. Jiang, J. Gao, Z. Chen, F. Sun and Y. Xu, Electrochim. Acta, 2018, 283, 834 CrossRef CAS.
- A. Adam, M. H. Suliman, H. Dafalla, A. R. Al-Arfaj, M. N. Siddiqui and M. Qamar, ACS Sustainable Chem. Eng., 2018, 6, 11414 CrossRef CAS.
- Z. Cheng, Y. Xiao, W. Wu, X. Zhang, Q. Fu, Y. Zhao and L. Qu, ACS Nano, 2021, 15, 11417 CrossRef CAS PubMed.
- Y. Yu, K. Jiang, M. Luo, Y. Zhao, J. Lan, M. Peng, F. M.-F. de Groot and Y. Tan, ACS Nano, 2021, 15, 5333 CrossRef CAS PubMed.
- M. Cabán-Acevedo, M. L. Stone, J. R. Schmidt, J. G. Thomas, Q. Ding, H.-C. Chang, M.-L. Tsai, J.-H. He and S. Jin, Nat. Mater., 2015, 14, 1245 CrossRef PubMed.
- L. Yu, Q. Zhu, S. Song, B. McElhenny, D. Wang, C. Wu, Z. Qin, J. Bao, Y. Yu, S. Chen and Z. Ren, Nat. Commun., 2019, 10, 5106 CrossRef PubMed.
- H. Jin, X. Wang, C. Tang, A. Vasileff, L. Li, A. Slattery and S. Z. Qiao, Adv. Mater., 2021, 33, 7508 Search PubMed.
- Z. Zhou, Z. Pei, L. Wei, S. Zhao, X. Jian and Y. Chen, Energy Environ. Sci., 2020, 13, 3185 RSC.
Footnote |
| † Electronic supplementary information (ESI) available: Details of the experiment, XRD patterns, ICP, XPS survey spectra, SEM images, EDS pattern, nitrogen adsorption–desorption isotherms, LSV curves, CV, EIS fitting values (Rs, Rp, and Rct), calculation of electrochemically active surface area, turnover frequency, characterization of the catalyst after reaction (XRD, XPS, and TEM), details about the natural seawater, and comparison of electrocatalysts for the HER (PDF). See DOI: https://doi.org/10.1039/d2ma00288d |
| This journal is © The Royal Society of Chemistry 2022 |

