 Open Access Article
Customizing the spatial distribution and release of silver for the antibacterial action via biomineralized self-assembling silver-loaded hydroxyapatite†
Yunping
Qiao
a,
Guangqing
Mai
a,
Yujing
Li
a,
Rengui
Guan
a,
Yanyang
Han
a,
Wei
Cui
 a,
Xinglong
Wang
a,
Shiliang
Liu
b,
Shanshan
Liu
a,
Xinglong
Wang
a,
Shiliang
Liu
b,
Shanshan
Liu
 *a and
Tao
He
*a
aCollege of Chemistry and Chemical Engineering, Yantai University, Yantai 264005, China. E-mail: liushanshan@ytu.edu.cn; ytuht@ytu.edu.cn
bWeifang Branch Company, Shandong HI-speed Transportation Construction Group Co., Ltd, Qingzhou, 262500, China
First published on 5th August 2022
Abstract
The fabrication of a rationally designed silver-loaded hydroxyapatite (Ag–HA) material to balance antibacterial activity, biological safety and chemical stability is a significant challenge. The key to solving this problem lies in controlling the release of Ag+ ions. This ambition has been skillfully fulfilled by a layer-by-layer self-assembly approach via Staphylococcus aureus (S. aureus)-templated mineralization. The abundant functional groups, namely teichoic acid and carboxyl groups, on S. aureus could induce the nucleation and growth of Ag–HA because of the strong chelating effect on the Ca2+ and Ag+ ions. The spatial distribution of silver in Ag–HA microspheres has been designed by modifying the sedimentary order of the Ag+ and Ca2+ ions. The as-prepared samples were characterized by XRD, SEM, EDS, TEM, XPS, FT-IR and Zate potential methods. The release of Ag+ ions was measured by atomic absorption spectrometry. The results indicate that the derived Ag–HA hybrid antibacterial materials do not only inherit the uniform size of the S. aureus template well but also exhibit customized spatial distribution and release of Ag+ ions.
1. Introduction
The invasion of microorganisms and viruses not only threatens human lives and health but also affects social and economic development. Developing new antibacterial materials is of great significance for preventing the spread of pathogenic microorganisms.1,2 Because of safety and durability, inorganic antibacterial materials (silver, copper, zinc oxide, titanium dioxide, copper oxide) have greatly attracted the attention of chemical and biological researchers.3 Especially, Ag-based antibacterial materials (Ag+, Ag nanoparticles) are widely used in food packaging, plastic products, paints, coatings, textiles, medical equipment and medical dressings4–7 due to their high and broad-spectrum antibacterial activity, as well as low toxicity to mammalian cells.8However, owing to the photochemical activity, high solubility and oxidability of silver ions (Ag+ ions), the application of silver-based antibacterial materials is limited. Accurately controlling the release rate of Ag+ ions is crucial to mitigate these drawbacks. At present, although loading Ag+ ions on an inert matrix (zirconium phosphate, silica, or zeolite) is the usual approach to inhibit chemical reactions with the environment or media,9–12 employing structural design to control the release of silver from materials is still in the infancy stage.13 For example, Ag+ ions were absorbed by the mesoporous molecular sieve SBA-1514 and also imported to zirconium phosphate or bentonite materials by the ion-exchange method;10,11 yet, in these cases, the Ag+ ions are released quickly due to the porous structure and weak interactions,15 failing to realize sustained antibacterial action. Moreover, the burst release of silver increased the concentration of Ag+ ions significantly in a short time, bringing about biological toxicity. In order to decrease the release rate of Ag+ ions, hydrothermal and high-temperature sintering methods were applied to insert Ag+ ions into the zirconium phosphate lattice.16,17 However, the high-temperature conditions increased the size of the matrix particles, resulting in an excessively low release rate of Ag+ ions. The antibacterial activity decreased eventually.
Hence, we believe that designing and synthesizing silver-based antibacterial materials with controllable silver ion release rates is the key to balancing antibacterial properties (antibacterial activity and durable antibacterial), biological safety and chemical stability. Generally, the release rate of Ag+ ions mainly depends on the following factors: Firstly, the chemical state of silver (elemental Ag, soluble Ag+ ions and insoluble silver salt) affects the release rate of silver ions.5 Secondly, the diversity of Ag spatial distribution in the matrix particles leads to differences in diffusion resistance. Additionally, large particle and small specific surface also bring about high diffusion resistance for Ag+ ions.18–20 To sum up, precisely regulating the composition, structure and morphology of Ag-based antibacterial materials at the molecular level and nano-scale is the fundamental strategy for achieving the controlled release of Ag+ ions.
Due to its biocompatibility, biodegradability and thermal stability, hydroxyapatite (HA) is not only an excellent candidate for bone repair and drug delivery but also a suitable inert matrix for Ag+ ions.21–23 For example, as a tooth or bone repairing material, HA doped with Ag+ ions can inhibit the formation of bacterial membranes and mitigate the risk of wound infection.24 The common methods for preparing Ag-loaded HA (Ag–HA) antibacterial materials are ion doping25 and surface deposition.26,27 However, neither of these methods has achieved controllable Ag+ ion distribution and HA particle morphology. This work provides a self-assembling biomineralization approach to customize Ag–HA nanoparticles with different spatial distributions of Ag, based on which the controllable release of Ag+ ions can be realized. The particle size of the synthesized Ag–HA antibacterial nanoparticles was uniform and controllable owing to the microbial template. Microbial cells (bacteria, fungi, and microalgae) display uniform morphology and size, which are dominated by genes and do not change under different culture conditions. On the other hand, the surface of microbial cells is usually negatively charged,28,29 and the functional groups (carboxyl, amino, sulfhydryl, and hydroxyl) on the surface can form strong chemical bonds with metal ions, thus providing sites for the heterogeneous nucleation and growth of inorganic compounds. In addition, being a mature microbial technology, microbial cultures ensure the large-scale preparation of microbial cells. Therefore, microorganisms are the ideal templates for preparing inorganic particles with uniform size and morphology. So far, yeast and Escherichia coli (E. coli) cells have been employed as templates to prepare hollow spheres, zinc oxide tubes, zirconia and titanium dioxide porous structure.30–34 Nevertheless, the preparation of an Ag–HA antibacterial material with the controllable spatial distribution of Ag to regulate the release rate of Ag+ ions has not been reported. For the construction of Ag–HA antibacterial materials with the controllable spatial distribution of Ag, Staphylococcus aureus (S. aureus), the surface of which contains abundant teichoic acid and carboxyl groups, was used as the template. These functional groups have a strong chelating effect on Ag+ and Ca2+ ions and can induce nucleation. The Ag+ and Ca2+ ions were alternately deposited on the S. aureus templates layer by layer. The spatial distribution of Ag in a single Ag–HA microsphere was customized by modifying the order of Ag+ and Ca2+ ion addition. Consequently, Ag–HA antibacterial materials with different release rates of Ag+ ions were obtained. This work provides a new perspective and strategy for the development of advanced HA-based biomedical materials with antibacterial properties.
2. Experimental details
2.1 Preparation of silver-loaded hydroxyapatite antibacterial nanoparticles
The traditional microbial experiment technology was applied for the S. aureus culture.35 The core-shell structured Ag–HA antibacterial nanoparticles (Ag–HA–HA, HA–Ag–HA, HA–HA–Ag) with different spatial distributions of Ag were prepared by ionic layer-by-layer self-assembly method at room temperature, as shown in Fig. 1, by employing S. aureus as the template.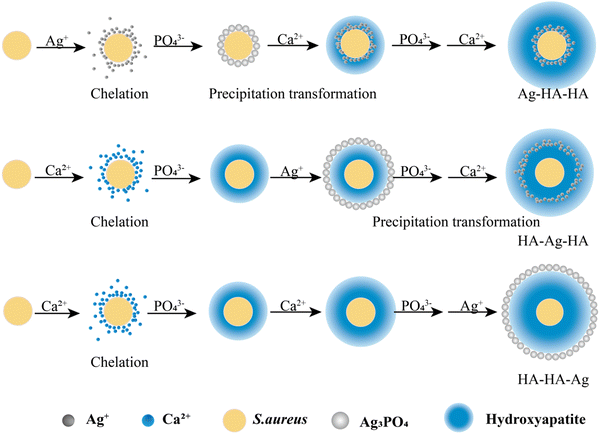 | ||
| Fig. 1 The preparation of antibacterial Ag-loaded hydroxyapatite (HA) by the ionic layer-by-layer self-assembly method with S. aureus as the template. | ||
The specific experimental procedures were as follows (Fig. 2):
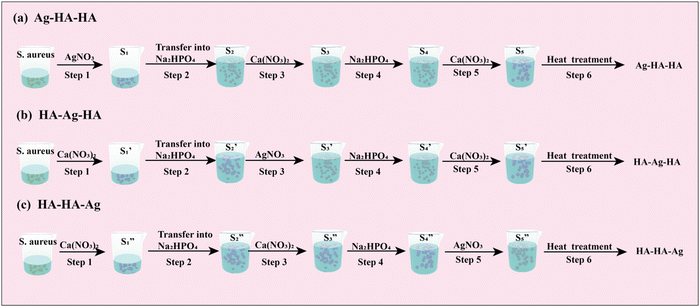 | ||
| Fig. 2 Schematic of the step-by-step procedure of preparing the Ag–HA antibacterial particles: (a) Ag–HA–HA (b) HA–Ag–HA and (c) HA–HA–Ag. | ||
Step 1: 20 mL S. aureus culture (∼109 CFU mL−1) was mixed with 10 mL AgNO3 (0.01 g mL−1), 10 mL Ca(NO3)2 (0.225 M), and 10 mL Ca(NO3)2 (0.225 M) under mechanical stirring to obtain the S1,  , and
, and  suspensions, respectively.
Step 2: The S1,  and
and  suspensions were mixed with 80 mL Na2HPO4 solution (pH = 12), and the mixtures were stirred for 20 min to form the S2,
  , and
, and  suspensions, respectively.
Step 3: 10 mL Ca(NO3)2 solution (0.225 M), 10 mL AgNO3 solution (0.01 g mL−1) and 10 mL Ca(NO3)2 solution (0.225 M) were separately added dropwise to the S2,  ,
,  suspensions under stirring to form the S3,
  , and
, and  suspensions, respectively.
Step 4: 10 mL of a Na2HPO4 solution (0.14 M and pH = 12) was added dropwise to S3,  , and
, and  to prepare the S4,
  , and
, and  suspensions, respectively.
Step 5: 10 mL Ca(NO3)2 solution (0.225 M),10 mL Ca(NO3)2 solution (0.225 M) and 10 mL AgNO3 solution (0.01 g mL−1) were added dropwise to solutions S4,  , and
, and  to obtain the S5,
  , and
, and  suspensions, respectively.
Afterward, the S5,  , and
, and  solutions were centrifuged respectively, and a sodium chloride solution was added to the supernatant. No precipitation was observed, indicating that the Ag+ ions were loaded on hydroxyapatite completely.
Step 6: The S5,  , and
, and  solutions were centrifuged at 4500 rpm for 3 min and washed three times with 30 mL absolute ethanol, respectively. Afterwards, the particles were dissolved in 30 mL polyethylene glycol-400 by the ultrasonic dispersion method. The dispersions were heated at 220 °C for 10 minutes followed by centrifugation for 3 minutes at 4000 rpm. The precipitates were washed three times with absolute ethanol. Finally, the precipitates were dried at 60 °C to obtain the three silver-loaded hydroxyapatite powder samples, namely Ag–HA–HA, HA–Ag–HA, and HA–HA–Ag.
2.2 Sample characterization
The as-prepared samples were characterized by X-ray diffraction (XRD, Rigaku Smart Lab III), scanning electron microscopy (SEM, JEOL JSM-7900F), energy-dispersive spectroscopy Mapping (EDS, OXFORD, ULTIM EXTREME), transmission electron microscopy (TEM, JEOL JEM-2100F), X-ray photoelectron spectroscopy (XPS, Thermo ESCALAB 250xi), Fourier transform infrared spectroscopy (FT-IR, SHIMADZU IRAffinity-1S) and Zeta potential analysis (Zetasizer Nano force potentiometer, Malvern Nano-ZS90).2.3 Antibacterial activity measurements
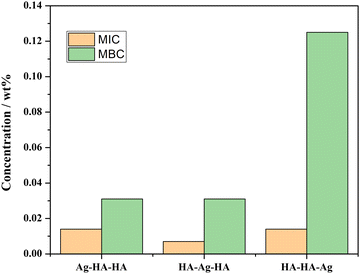
The release of Ag was studied by atomic absorption spectrometry (AAS, TAS-990super). The measurement details are described in the ESI† (ESI,† Release of Ag). The minimum inhibitory concentration (MIC),36 minimum bactericidal concentration (MBC), the kinetics of inactivation and microbial growth inhibition (ESI,† inhibition zone experiment)37 were evaluated to characterize the antibacterial performance.3. Results and discussion
3.1 Zeta potential
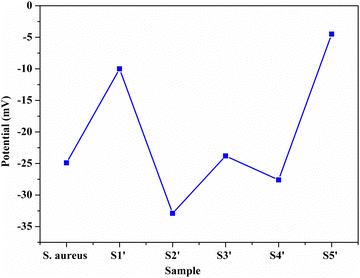
In order to monitor the deposition of the ions on the template surfaces, the Zeta potential was measured at each step (Fig. 3). Taking the HA–Ag–HA particles as an example, the Zeta potentials of the particle surface in the S. aureus solution, and the ,
,  ,
,  ,
,  , and
, and  solutions were measured, respectively. As shown in Fig. 3, all the particles were negatively charged, and interparticular repulsion could effectively inhibit particle aggregation. When the HA–Ag particles were prepared without the S. aureus templates according to the procedure described in the experimental section (ESI,† Ag–HA prepared by the co-precipitation method), the HA–Ag nanocrystals agglomerated greatly (Fig. S1, ESI†), indicating that the participation of the S. aureus templates effectively inhibited aggregation.
Initially, the surface of the S. aureus template is negatively charged due to the teichoic acid on the surface. After adding Ca(NO3)2 ( solution), the Ca2+ cations are chelated by the teichoic acids on S. aureus (Ca2+@S. aureus), and the potential increases. With the addition of Na2HPO4, in the
  solution, the OH− and PO43− ions react with the Ca2+ ions on the S. aureus to form HA@S. aureus. The excessive PO43− ions decrease the surface potential of the particles obviously. Afterwards, with the addition of AgNO3, in the
  solution, the Ag+ ions precipitate on the particle surface (Ag3PO4/HA@S. aureus) owing to the PO43− ions. The excessive Ag+ ions slightly increase the surface potential. After adding Na2HPO4 again, in the
  solution, the PO43− ions react with the Ag+ ions on the particle decreasing the potential again. Finally, when Ca(NO3)2 is added, the
  solution demonstrates substantially increased potential due to the deposition of Ca2+ ions.
Although biotemplate routes have been extensively applied for the preparation of inorganic nanostructures,31,33,38,39 the controllable space distribution of certain metal ions (Ag+) in inorganic carrier particles has not been realized through the simple biotemplate method. Intentionally utilizing the natural functional groups on the templates as nucleation sites to induce inorganic nanostructures is an effective approach to controlling the distribution of ions. In this work, the Zeta potential results showed that the Ca2+, PO43− and Ag+ ions were deposited on the S. aureus templates alternately. The formation of the Ag–HA particles was carried out by the layer-by-layer mineralization of ions on the S. aureus templates (Fig. 4). The strong chelation of S. aureus to the metal ions (Ca2+ or Ag+ ions) provides the nucleation sites for HA–Ag particles due to the teichoic acid and carboxyl groups, followed by the layer-by-layer encapsulation of the S. aureus templates by the ions.
3.2 FT-IR
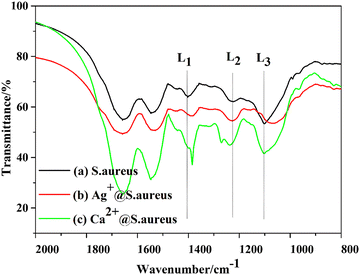
FT-IR spectroscopy is a reliable technique to analyze the chemical bonds or functional groups involved in proteins, fatty acids, carbohydrates, nucleic acids, and lipopolysaccharides of bacteria. In order to further confirm the biotemplate role of S. aureus, the FT-IR spectra of the precipitates Ag+@S. aureus from the S1 suspension, Ca2+@S. aureus from the suspension and S. aureus were collected after freeze drying (ESI,† FT-IR), respectively (Fig. 5). Herein, we focused on the three bands located at 1398.9 (L1), 1223.7 (L2) and 1134–980 (L3) cm−1, which correspond to different groups,40 as demonstrated in Table 1. The L1 band was derived from the COO− groups. Compared with the spectrum of S. aureus, the L1 bands of both Ag+@S. aureus and Ca2+@S. aureus had shifted to lower wavenumbers, indicating that the Ag+ or Ca2+ ions interacted with the COO− groups. Besides, the L2 band of Ca2+@S. aureus was split into two bands due to the chemical interactions between Ca2+ and phospholipids. The L3 band of Ag+@S. aureus had shifted to a lower wavenumber because of the chemical interactions formed between the Ag+ ions and phospholipids.40 Therefore, the FT-IR results confirm that the Ag+ and Ca2+ ions were anchored on the S. aureus templates via different absorption mechanisms. Both Ag+ and Ca2+ ions apparently interact with the functional groups on S. aureus, which effectively provides nucleation sites for Ag–HA particles. Thus, Ag–HA nucleates and grows on S. aureus templates and encapsulates them finally.
| Band | Wavenumber (cm−1) | Assignment |
|---|---|---|
| L1 | 1398.9 | COO− groups in amino acids, fatty acids |
| L2 | 1223.7 | P![[double bond, length as m-dash]](https://www.rsc.org/images/entities/char_e001.gif) O of phosphodiesters in phospholipids O of phosphodiesters in phospholipids |
| L3 | 1134–980 | P![[double bond, length as m-dash]](https://www.rsc.org/images/entities/char_e001.gif) O in DNA, RNA and phospholipids O in DNA, RNA and phospholipids |
3.3 XRD
The phase composition of the Ag–HA particles Ag–HA–HA, HA–Ag–HA and HA–HA–Ag was determined by the XRD method. Further, the transformation of phase composition in each step was also monitored (ESI,† XRD step-by-step). The XRD patterns obtained at each step of the Ag–HA–HA, HA–Ag–HA and HA–HA–Ag sample synthesis are presented in Fig. 6.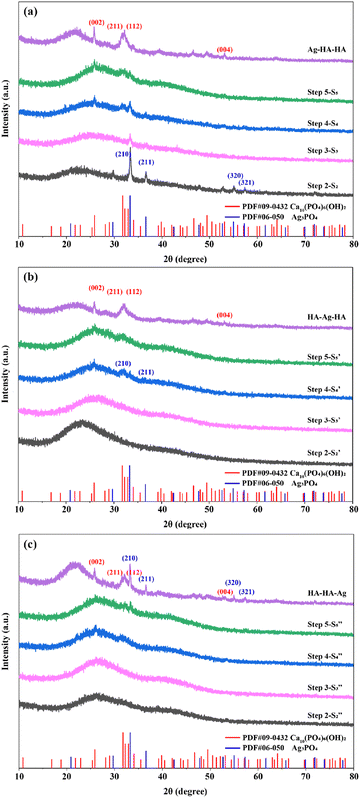 | ||
| Fig. 6 Determination of the phase evolution during Ag–HA particle preparation using XRD: (a) Ag–HA–HA, (b) HA–Ag–HA, and (c) HA–HA–Ag. | ||
The XRD patterns of the Ag–HA–HA sample are shown in Fig. 6a. Ag3PO4 was formed after loading the Ag+ cations and PO43− ions (Step2-S2) on the S. aureus templates, but with the addition of the Ca2+ cations and PO43− ions (Step3-S3, Step4-S4), the peaks of the (210) and (211) planes of Ag3PO4 gradually decreased, and the characteristic peaks of planes (002), (211), (112) of HA gradually appeared. Finally, the characteristic peaks of Ag3PO4 were hardly observed. The XRD patterns in Step1- and Step2-
 of the HA–Ag–HA sample in Fig. 6b indicate that amorphous HA was formed with the addition of Ca2+ and PO43−. The characteristic peaks of the (210) and (211) planes of Ag3PO4 in the Step4-
 spectrum suggest that Ag3PO4 was formed with the addition of the Ag+ ions (Step3-
 ) and PO43− ions (Step4-
 ). However, with the addition of the Ca2+ ions (Step5-
 ), the characteristic peak of Ag3PO4 also disappeared.
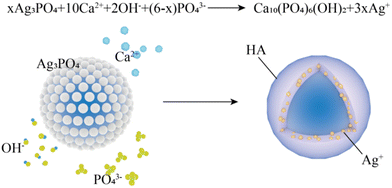
The reason for the disappearance of the Ag3PO4 phase in the Ag–HA–HA and HA–Ag–HA samples is that the product solubility constant (Ksp(HA) = (6.3 ± 2.1) × 10−59, 25 °C) of HA is much lower than that (Ksp(Ag3PO4) = 8.89 × 10⁻¹⁷, 25 °C) of Ag3PO4, and precipitation transformation occurs with the addition of Ca2+ (Fig. 7). After an excess of Ca2+ ions was added, most Ag3PO4 was converted to HA and Ag+ ions. Moreover, in the whole experiment, the PO43− ions were in excess relative to the Ag+ ions, and there were no dissociative Ag+ ions in the final supernatant. Hence, it can be concluded that all the Ag+ ions generated from the precipitation transformation were in-situ loaded in the HA shell. The Ag+ ions were distributed in the inner HA shell of the Ag–HA–HA sample and the middle HA shell of the HA–Ag–HA sample. Generally, Ag+ ions are easily reduced to Ag NPs because of strong oxidability. Many efforts have been devoted to the development of Ag NP-encapsulated porous materials, such as mesoporous silica and zeolite.13–16,41 Liu et al.42 prepared Ag-MMT with high dispersivity, narrow size distribution and good thermal stability by chemical reduction and the supercritical ethanol drying method. In this experiment, the XRD spectra of Ag–HA–HA and HA–Ag–HA showed no diffraction peaks for any silver phase, indicating that silver mainly existed in the form of Ag+ ions embedded in the HA framework, and the reduction is avoided effectively.
As demonstrated by the XRD patterns of the HA–HA–Ag sample in Fig. 6c, only amorphous HA was present before Ag+ was loaded (Step5- ), and Ag3PO4 was gradually formed with the addition of Ag+ ions. The XRD pattern of the final HA–HA–Ag sample showed strong Ag3PO4 peaks, indicating that silver in the particles existed mainly in the Ag3PO4 phase, which is different from Ag–HA–HA and HA–Ag–HA samples. During the preparation of HA–HA–Ag, Ag+ ions are added at the last and reacted with PO43− ions on the surface of the particles. There was no further precipitation transformation because trace or no Ca2+ ions existed in the solution.
Owing to the heating treatment in Step 4, the final Ag–HA–HA, HA–Ag–HA and HA–HA–Ag samples presented better crystallization. The XRD patterns of all the final samples showed the (002), (211), (122) and (004) diffraction peaks of HA, confirming that the final material was HA. However, the intensity of peaks was very weak and wide. The (211) and (112) peaks were overlapping, suggesting that the crystallinity of HA was low or it mainly existed in an amorphous state.
The S. aureus templates play a very important role in realizing the controllable growth of nanostructures. Carmen Steluta Ciobanu et al. synthesized antibacterial Ag-doped nano-hydroxyapatite nanocrystallites at 100 °C by co-precipitation,43 in which HA was evidently crystalline. Herein, the metal ions (Ca2+, Ag+) can be anchored solidly on the S. aureus templates due to strong chelation. As a result, the ordered arrangement of the crystal structure may be impeded, resulting in low crystallinity or even an amorphous structure. In order to verify this point, the co-precipitation method without the S. aureus templates was used to prepare the Ag–HA materials (ESI,† Ag–HA prepared by co-precipitation method). It was found that all the Ag–HA samples prepared by the co-precipitation method without templates showed apparent crystalline phases, including the AgPO4 and HA phases (Fig. S2, ESI†). Therefore, the biomineralization route using the S. aureus templates can prevent the crystallization of the HA and Ag phases effectively.
3.4 XPS
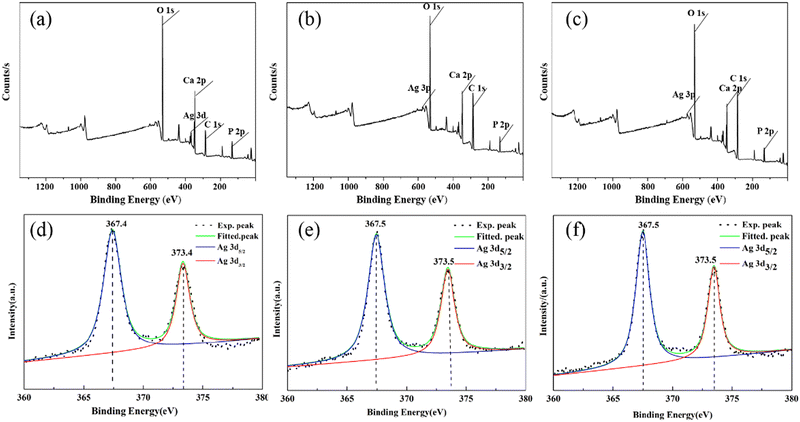
In order to further confirm the chemical state and distribution of Ag, the XPS spectra of the Ag–HA–HA, HA–Ag–HA, and HA–HA–Ag particles were collected. All three particles contained Ca, P, Ag, and O elements, as shown in Fig. 8a–c, respectively. Their corresponding fine Ag3d orbital spectra are shown in Fig. 8d–f. The two characteristic peaks of the spin orbits Ag3d3/2 and Ag3d5/2 were located at 373.5 and 367.5 eV, respectively. The difference between the two characteristic peaks was 6.0 eV, proving that silver existed in the form of Ag(I).43–45 On the other hand, for solid samples, the XPS method can reflect the mole percentage of each element on the ultra-surface in the depth range of less than 10 nm. The results show that the atomic ratio of Ca/Ag, P/Ag and O/Ag on the surface (Table 2) increased in the sequence of Ag–HA–HA → HA–Ag–HA → HA–HA–Ag because Ag was mainly distributed in the inner layer of Ag–HA–HA, the middle layer of HA–Ag–HA, and the surface layer for HA–HA–Ag. In brief, the spatial distribution of Ag was different in the Ag–HA–HA, HA–Ag–HA, and HA–HA–Ag particles.| Sample | Ca/Ag | P/Ag | O/Ag |
|---|---|---|---|
| Ag–HA–HA | 13.3 | 11.02 | 54.25 |
| HA–Ag–HA | 10.2 | 8.88 | 52.16 |
| HA–HA–Ag | 8.5 | 7.54 | 49.41 |
3.5 SEM and EDS
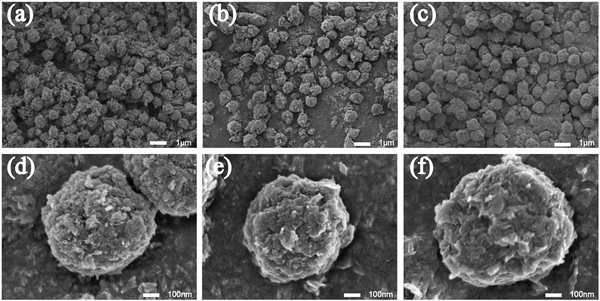
The SEM images are shown in Fig. 9. All the particles were spherical with a uniform diameter of about 500 nm. Each sphere surface was rough and dense and was stacked in the form of layered crystals because of the growth habits of HA. Fig. 10 shows the element distribution in the samples. Nitrogen (N) distribution shows the information about the S. aureus templates. The distributions of N, Ca, P and Ag prove that the synthesis of Ag–HA was based on the S. aureus cell templates. However, the distribution of Ag in the three samples was different. The Ag elemental distribution was relatively homogeneous on the Ag–HA–HA and HA–Ag–HA particles. The HA–HA–Ag particles obviously showed local Ag enrichment probably due to the Ag3PO4 particles, according to the XRD results.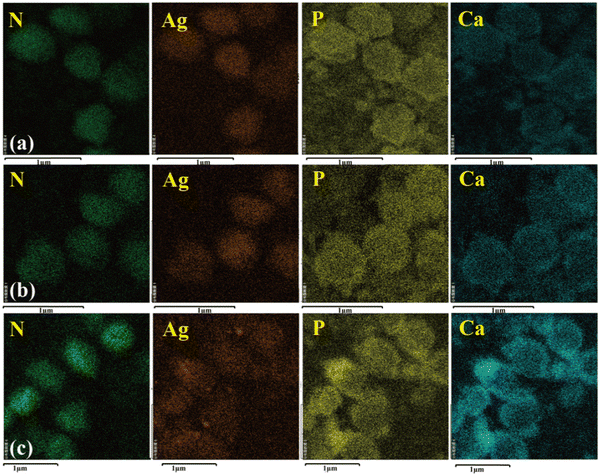 | ||
| Fig. 10 The elemental distribution of the Ag–HA particles: (a) Ag–HA–HA, (b) HA–Ag–HA, and (c) HA–HA–Ag. | ||
Currently, Ag-based antibacterial materials are obtained by ion-exchange, co-precipitation, absorption and sintering methods.46–52 However, according to the structure and morphology of the final products prepared by these routes, it is still very difficult to accurately control the particle size, dispersion and morphology of HA, as well as the spatial distribution of Ag in the HA particles. Herein, the size and morphology of the HA particles are precisely customized with uniform dispersion using the layer-by-layer biomineralization strategy. On the other hand, altering the order of Ca2+ and Ag+ ion addition not only can control the distribution of Ag but also can adjust the phase of silver.
3.6 TEM
The TEM image of the HA–Ag–HA particle in Fig. 11b shows a hollow structure, unlike those of Ag–HA–HA and HA–HA–Ag shown in Fig. 11a and c, respectively. The HA particles in all the samples were amorphous, which presents low contrast in TEM images. Hence, the difference in mass thickness contrast is not obvious for hollow structures. For the Ag–HA–HA particles, the high image contrast close to S. aureus in Fig. 11a suggests that Ag existed in the inner layer since the mass thickness contrast of Ag is much greater than those of calcium and phosphorus.Although some Ag3PO4 nanoparticles appeared in the TEM images of the Ag–HA–HA (Fig. 11a) and HA–Ag–HA(Fig. 11b) particles, there was no Ag3PO4 phase according to XRD results. This is because the Ag element mainly exists in the form of Ag+ ions in the HA framework and only in trace amounts in the Ag3PO4 phase.
3.7 Silver ion release
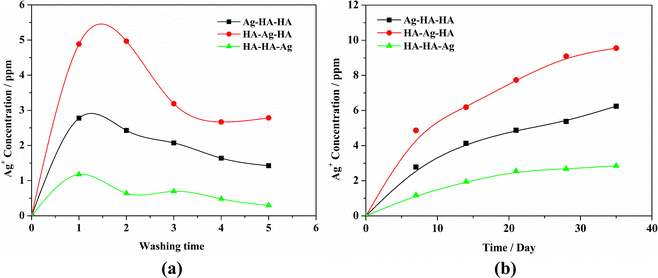
The controlled release of Ag is critical for optimum antibacterial performance without cytotoxicity. In general, hydrothermal and high-temperature sintering methods are usually employed to synthesize Ag-loaded zirconium phosphate materials. Magana et al.53 synthesized nano-silver-loaded montmorillonite by ion exchange and calcination at 400 or 550 °C. However, the silver particles loaded in the interlayer congregated at high temperatures, leading to a decrease in antibacterial activity. On the other hand, Ag resides mostly on the outer surface of the material prepared by the ion-exchange method and is quickly depleted without exerting a long-term antibacterial effect.54 Hong Wu et al. synthesized self-detoxifying hollow zinc silica nanospheres with tunable Ag-ion-release–recapture capability at 500 °C.55 In this study, the Ag–HA antibacterial materials have been prepared by a simple process and under mild reaction conditions (room temperature). Ag+ ion release from all the samples was investigated by the AAS method. The results are shown in Fig. 12. HA–Ag–HA had the highest Ag+ release rate and quantity, both of which were the lowest for HA–HA–Ag. This can be attributed to the diffusion, dissolution and state of the Ag+ ions. Specifically, silver exists mainly in the form of Ag+ ions in the HA–Ag–HA particles, from which Ag+ ions diffuse into the aqueous solution easily. The release rate of Ag+ ions in HA–HA–Ag was the lowest because of the particle-specific effect of the large AgPO4 nanoparticles. Therefore, Ag–HA materials with different Ag phases, particle sizes, and spatial distributions can lead to different release rates of Ag+ ions, which can be tuned to meet different antibacterial requirements.3.8 Antibacterial properties
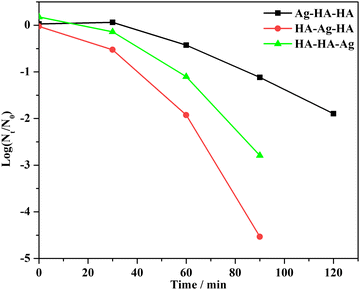
Log![[thin space (1/6-em)]](https://www.rsc.org/images/entities/char_2009.gif) (Nt/N0) = −kt (Nt/N0) = −kt |
Fig. 14 shows the kinetics of the antibacterial activities of Ag–HA–HA, HA–Ag–HA and HA–HA–Ag, respectively. The bactericidal effect could be mainly attributed to Ag+ ion dissolution. On account of the controlled release of Ag+ ions, the kinetics of inactivation did not ideally accord with the Chick–Watson model.
When Ag–HA–HA was used to inactivate S. aureus, the population of bacteria slightly increased in 30 minutes and then decreased. The delayed bactericidal effect is mainly brought about by diffusion barriers. Since the Ag+ ions are distributed in the innermost layer of Ag–HA–HA particles, only after the Ag+ ions spread from the inner layer and are exposed to the bacteria, the antibacterial activity can be achieved. The diffusion resistance was the highest in this case, resulting in the lowest inactivation rate.
The antibacterial activity of the HA–HA–Ag sample is ascribed to Ag3PO4 nanocrystallites located on the surface of particles. The exposure-dependent effect and low diffusion resistance lead to a higher microbial inactivation rate than that of Ag–HA–HA. This is the reason the antibacterial results disagree with the Ag+ ions release rates of the Ag–HA–HA and HA–HA–Ag samples.
The HA–Ag–HA particles, in which the Ag+ ions exist in the middle layer of the particles, possessed the highest inactivation rate. Synthetically, the lower diffusion resistance and easy dissolution of Ag+ ions contribute to the highest inactivation rate.
4. Conclusion
A self-assembling biomineralization approach at room temperature was applied to realize the controlled release of Ag+ ions by customizing the spatial distribution of Ag in Ag-loaded HA (Ag–HA) hybrid materials. In the experiment, S. aureus templates with abundant teichoic acid functional groups on the surface could induce the nucleation and growth of HA because of the strong chelating ability with the metal ions. The Ag+ and Ca2+ ions were alternately deposited on S. aureus templates layer by layer. The spatial distribution of Ag in a single Ag–HA microsphere was customized by modifying the deposition order of the Ag+ and Ca2+ ions and precipitation transformation. This work has not only realized tunable Ag+ release behavior in silver-based antibacterial materials but also the balance between antibacterial action and biological safety. A new perspective and strategy for the development of advanced HA biomedical materials with antibacterial properties are provided. Besides, durable silver-loaded HA materials with safe antibacterial properties can also be potential candidates for antibacterial textiles and antibacterial cosmetics. The development of biomedical materials involved in orthopedics, dentistry and medicine can be promoted using this strategy.Conflicts of interest
There are no conflicts to declare.Acknowledgements
This work is financially supported by the project ZR2020MB069, ZR202103030521 supported by Natural Science Foundation of Shandong Province and National Natural Science Foundation of China (grant 51702034).References
- Z. A. Ratan, F. R. Mashrur, A. P. Chhoan, S. M. Shahriar, M. F. Haidere, N. J. Runa, S. Kim, D. H. Kweon, H. Hosseinzadeh and J. Y. Cho, Pharmaceutics, 2021, 13, 8894–8918 CrossRef PubMed.
- T. Thi Ngoc Dung, V. Nang Nam, T. Thi Nhan, T. T. B. Ngoc, L. Q. Minh, B. T. T. Nga, V. Phan Le and D. Viet Quang, Mater. Res. Express, 2020, 6, 1250–1259 CrossRef.
- M. Gautam, D. H. Park, S. J. Park, K. S. Nam, G. Y. Park, J. Hwang, C. S. Yong, J. O. Kim and J. H. Byeon, ACS Nano, 2019, 13, 12798–12809 CrossRef CAS PubMed.
- R. J. Pinto, P. A. Marques, C. P. Neto, T. Trindade, S. Daina and P. Sadocco, Acta Biomater., 2009, 5, 2279–2289 CrossRef CAS PubMed.
- S. Kittler, C. Greulich, J. Diendorf, M. Koller and M. Epple, Chem. Mater., 2010, 22, 4548–4554 CrossRef CAS.
- I. Mohamed Hamouda, J. Biomed. Res., 2012, 26, 143–151 Search PubMed.
- A. A. Yaqoob, H. Ahmad, T. Parveen, A. Ahmad, M. Oves, I. M. I. Ismail, H. A. Qari, K. Umar and M. N. Mohamad Ibrahim, Front. Chem., 2020, 8, 341 CrossRef CAS PubMed.
- K. Mijnendonckx, N. Leys, J. Mahillon, S. Silver and R. Van Houdt, Biometals, 2013, 26, 609–621 CrossRef CAS PubMed.
- S. Saengmee-Anupharb, T. Srikhirin, B. Thaweboon, S. Thaweboon, T. Amornsakchai, S. Dechkunakorn and T. Suddhasthira, Asian Pac. J. Trop. Biomed., 2013, 3, 47–52 CrossRef CAS PubMed.
- D. Guldiren and S. Aydin, Mater. Sci. Eng., C, 2017, 78, 826–832 CrossRef CAS PubMed.
- B. Kwakye-Awuah, C. Williams, M. A. Kenward and I. Radecka, J. Appl. Microbiol., 2008, 104, 1516–1524 CrossRef CAS PubMed.
- M. Servatan, P. Zarrintaj, G. Mahmodi, S. J. Kim, M. R. Ganjali, M. R. Saeb and M. Mozafari, Drug Discovery Today, 2020, 25, 642–656 CrossRef CAS PubMed.
- Y. Le, P. Hou, J. Wang and J.-F. Chen, Mater. Chem. Phys., 2010, 120, 351–355 CrossRef CAS.
- C. C. Chen, H. H. Wu, H. Y. Huang, C. W. Liu and Y. N. Chen, Int. J. Environ. Res. Public Health, 2016, 13, 99 CrossRef PubMed.
- L. Wang, H. He, C. Zhang, L. Sun, S. Liu and R. Yue, J. Appl. Microbiol., 2014, 116, 1106–1118 CrossRef CAS PubMed.
- X. Wan, L. Zhuang, B. She, Y. Deng, D. Chen and J. Tang, Mater. Sci. Eng., C, 2016, 65, 323–330 CrossRef CAS PubMed.
- K. Sugiura, US8313780B2, 2012.
- A. Panacek, R. Prucek, J. Hrbac, T. Nevecna, J. Steffkova, R. Zboril and L. Kvitek, Chem. Mater., 2014, 26, 1332–1339 CrossRef CAS.
- M. Wuithschick, B. Paul, R. Bienert, A. Sarfraz, U. Vainio, M. Sztucki, R. Kraehnert, P. Strasser, K. Rademann, F. Emmerling and J. Polte, Chem. Mater., 2013, 25, 4679–4689 CrossRef CAS.
- G. A. Sotiriou, A. Meyer, J. T. Knijnenburg, S. Panke and S. E. Pratsinis, Langmuir, 2012, 28, 15929–15936 CrossRef CAS PubMed.
- T. Cao, W. Tang, J. Zhao, L. Qin and C. Lan, J. Bionic Eng., 2014, 11, 125–133 CrossRef.
- X. Jiang, D. Zhang, R. Sun, H. Wang, Y. Yang, H. Guo and Y. Tang, Appl. Surf. Sci., 2021, 542, 148667 CrossRef CAS.
- Y. Limami, D. Y. Leger, B. Liagre, N. Pecout and M. Viana, Eur. J. Pharm. Sci., 2021, 158, 105679 CrossRef CAS PubMed.
- J. Kolmas, E. Groszyk and D. Kwiatkowska-Rozycka, BioMed Res. Int., 2014, 2014, 178123 Search PubMed.
- M.-l Qi, Z. Huang, A. Phakatkar, W. Yao, Y. Yuan, T. Foroozan, G.-y Xiao, R. Shahbazian-Yassar, Y.-P. Lu and T. Shokuhfar, CrystEngComm, 2018, 20, 1304–1312 RSC.
- C. Guo, Y. Zhang, F. Shao, X. Sheng and Y. Dong, Micro Nano Lett., 2012, 7, 904–906 CrossRef.
- C. Guo, J. Xue and Y. Dong, Mater. Lett., 2018, 219, 182–185 CrossRef CAS.
- J. Lei, L. Sun, S. Huang, C. Zhu, P. Li, J. He, V. Mackey, D. H. Coy and Q. He, Am. J. Transl. Res., 2019, 11, 3919–3931 CAS.
- B. A. Jucker, H. Harms and A. J. Zehnder, J. Bacteriol., 1996, 178, 5472–5479 CrossRef CAS PubMed.
- T. Nomura, Y. Morimoto, H. Tokumoto and Y. Konishi, Mater. Lett., 2008, 62, 3727–3729 CrossRef CAS.
- T. Nomura, Y. Morimoto, M. Ishikawa, H. Tokumoto and Y. Konishi, Adv. Powder Technol., 2010, 21, 8–12 CrossRef CAS.
- H. Zhou, T. Fan and D. Zhang, Microporous Mesoporous Mater., 2007, 100, 322–327 CrossRef CAS.
- H. Zhang, C. Xu, P. Sheng, Y. Chen, L. Yu and Q. Li, Sens. Actuators, B, 2013, 181, 99–103 CrossRef CAS.
- T. Nomura, S. Tanii, M. Ishikawa, H. Tokumoto and Y. Konishi, Adv. Powder Technol., 2013, 24, 1013–1016 CrossRef CAS.
- L. Pla, S. Santiago-Felipe, M. Á. Tormo-Mas, J. Pemán, F. Sancenón, E. Aznar and R. Martínez-Máñez, Sens. Actuators, B, 2020, 320, 128281 CrossRef CAS.
- Y. H. Lim, K. M. Tiemann, G. S. Heo, P. O. Wagers, Y. H. Rezenom, S. Zhang, F. Zhang, W. J. Youngs, D. A. Hunstad and K. L. J. A. N. Wooley, ACS Nano, 2015, 9, 1995–2008 CrossRef CAS PubMed.
- N. Zhou, L. Wang, P. You, L. Wang, R. Mu and J. Pang, Int. J. Biol. Macromol., 2021, 172, 515–523 CrossRef CAS PubMed.
- D.-P. Yang, S. Chen, P. Huang, X. Wang, W. Jiang, O. Pandoli and D. Cui, Green Chem., 2010, 11, 2038–2042 RSC.
- F. Baino and M. Ferraris, Int. J. Appl. Ceram. Technol., 2017, 14, 507–520 CrossRef CAS.
- T. He, Y. Weng, P. Yu, C. Liu, H. Lu, Y. Sun, S. Zhang, X. Yang and G. Liu, J. Phys. Chem. C, 2014, 118, 4607–4617 CrossRef CAS.
- J. Zhang, L. Wang, B. Zhang, H. Zhao, U. Kolb, Y. Zhu, L. Liu, Y. Han, G. Wang, C. Wang, D. S. Su, B. C. Gates and F.-S. Xiao, Nat. Catal., 2018, 1, 540–546 CrossRef CAS.
- J. Liu, Y. Yu, Q. Wu and J. Zhang, Chin. J. Inorg. Chem., 2004, 20, 321–323 CAS.
- C. S. Ciobanu, F. Massuyeau, L. V. Constantin and D. Predoi, Nanoscale Res. Lett., 2011, 6, 1–8 CrossRef PubMed.
- Y. Yan, X. Zhang, Y. Huang, Q. Ding and X. Pang, Appl. Surf. Sci., 2014, 314, 348–357 CrossRef CAS.
- O. Akhavan and E. Ghaderi, Surf. Coat. Technol., 2010, 204, 3676–3683 CrossRef CAS.
- A. Perdikaki, A. Galeou, G. Pilatos, I. Karatasios, N. K. Kanellopoulos, A. Prombona and G. N. Karanikolos, ACS Appl. Mater. Interfaces, 2016, 8, 27498–27510 CrossRef CAS PubMed.
- Y. Yang, X. Wu, C. He, J. Huang, S. Yin, M. Zhou, L. Ma, W. Zhao, L. Qiu, C. Cheng and C. Zhao, ACS Appl. Mater. Interfaces, 2020, 12, 13698–13708 CrossRef CAS PubMed.
- M. Pica, M. Nocchetti, B. Ridolfi, A. Donnadio, F. Costantino, P. L. Gentili and M. Casciola, J. Mater. Chem. A, 2015, 3, 5525–5534 RSC.
- H. Jia, W. Hou, L. Wei, B. Xu and X. Liu, Dent. Mater., 2008, 24, 244–249 CrossRef CAS PubMed.
- T. T. T. Vi, S. R. Kumar, J.-H. S. Pang, Y.-K. Liu, D. W. Chen and S. J. Lue, Nanomaterials, 2020, 10, 366–378 CrossRef CAS PubMed.
- A. Pereira, D. T. Reis, K. M. Barbosa, G. N. Scheidt, L. S. da Costa and L. S. S. Santos, Carbohydr. Res., 2020, 488, 107891 CrossRef CAS PubMed.
- A. Mahanty and D. Shikha, Int. J. Mater. Res., 2021, 922–930, DOI:10.1515/ijmr-2020-8181.
- S. M. Magaña, P. Quintana, D. H. Aguilar, J. A. Toledo, C. Ángeles-Chávez, M. A. Cortés, L. León, Y. Freile-Pelegrín, T. López and R. M. T. Sánchez, J. Mol. Catal. A: Chem., 2008, 281, 192–199 CrossRef.
- G. Xu, X. Qiao, X. Qiu and J. Chen, J. Mater. Sci. Technol., 2011, 27, 685–690 CrossRef CAS.
- H. Wu, H. Tian, J. Li, L. Liu, Y. Wang, J. Qiu, S. Wang and S. Liu, Composites, Part B, 2020, 202, 108415 CrossRef CAS.
- S. Unluturk, M. R. Atilgan, A. H. Baysal and M. S. Unluturk, Int. J. Food Microbiol., 2010, 142, 341–347 CrossRef PubMed.
- V. Lakshmi Prasanna and R. Vijayaraghavan, Langmuir, 2015, 31, 9155–9162 CrossRef CAS PubMed.
Footnote |
| † Electronic supplementary information (ESI) available. See DOI: https://doi.org/10.1039/d2ma00291d |
| This journal is © The Royal Society of Chemistry 2022 |

