 Open Access Article
Creative Commons Attribution 3.0 Unported Licence
Competing phases in the room-temperature M2(2,6-ndc)2(dabco) metal–organic framework thin film synthesis†
Lucile
Hamon
a,
Iryna
Andrusenko
 b,
Aurelio
Borzì
a,
Michael
Stiefel
c,
Stephan
Carl
d,
Ruggero
Frison
a,
Antonio
Cervellino
e,
Mauro
Gemmi
 b,
Gustavo
Santiso-Quinones
f,
Eric
Hovestreydt
f,
Antonia
Neels
 a and
Ines E.
Collings
 *a
*a
aCenter for X-ray Analytics, Empa – Swiss Federal Laboratories for Materials Science and Technology, Überlandstrasse 129, 8600 Dübendorf, Switzerland. E-mail: collings.ie@gmail.com
bIstituto Italiano di Tecnologia, Center for Materials Interfaces, Electron Crystallography, Viale Rinaldo Piaggio 34, 56025 Pontedera (PI), Italy
cTransport at Nanoscale Interfaces, Empa – Swiss Federal Laboratories for Materials Science and Technology, Überlandstrasse 129, 8600 Dübendorf, Switzerland
dLaboratory of Multiscale Studies in Building Physics, Empa – Swiss Federal Laboratories for Materials Science and Technology, Überlandstrasse 129, 8600 Dübendorf, Switzerland
eLaboratory for Synchrotron Radiation – Condensed Matter, Swiss Light Source, Paul Scherrer Institute, 5232 Villigen, Switzerland
fELDICO Scientific AG, 5232 Villigen, Switzerland
First published on 29th July 2022
Abstract
The targeted synthesis of DUT-8 metal–organic framework thin films of composition M2(2,6-ndc)2(dabco), where 2,6-ndc = 2,6-naphthalenedicarboxylate, and dabco = 1,4-diazabicyclo[2.2.2]octane were performed using a dip-coating synthesis strategy on functionalised gold-coated silicon substrates at room temperature. The thin films were characterised using atomic force microscopy (AFM), scanning electron microscopy (SEM), and powder X-ray diffraction (XRD), revealing a crystalline and oriented thin film with a homogeneous nanoparticle formation when M = Cu, and an inhomogeneous distribution of micron-sized crystals for M = Zn. However, the refined unit cell parameters indicated a large reduction to the known DUT-8 unit cells (−5% and −13% in the ab-plane for M = Cu and Zn, respectively). Three-dimensional electron diffraction (3D ED) was performed on the crystals from the thin film synthesis of M = Zn, revealing the formation of Zn(2,6-ndc)(H2O), instead of the intended Zn2(2,6-ndc)2(dabco) compound. Similarly, in the case of M = Cu thin films, Rietveld refinements of the powder X-ray diffraction data indicated that Cu(2,6-ndc) was the most likely phase grown. Our results highlight the competing phases possible for a room-temperature dip-coating synthesis strategy of DUT-8, and demonstrate the advantage of using 3D ED in thin film research.
1 Introduction
Metal–organic frameworks (MOFs) are a class of porous materials with a highly tuneable chemical and structural diversity, allowing pore functionalisation for various applications in gas storage, separations, and sensing.1–3 In particular for sensing applications, the fabrication of MOFs as thin films enhance their pore orientation control, and their integration into electronic devices.4–6The synthesis procedures of high-quality oriented MOF thin films are already well-established.7 In order to control MOF growth direction for pore orientation on the film, the substrate surface usually needs to be functionalised.7 This process also has the added advantage of providing an attachment point between the MOF and the substrate. One of the functionalisation process is through the use of self-assembled monolayers (SAMs) with a SH group on one part of the molecule, which chemisorbs or bonds to a gold-coated substrate, while the other end of the SAM provides coordinating groups to allow attachment of the MOF.7,8 Additionally, through choice of different coordinating groups in the SAM, the growth direction can be varied.9 Layer-by-layer (LbL) growth techniques have given rise to high-quality homogeneous thin films, and have the additional control over film thickness through the number of cycles performed. Moreover, LbL synthesis is carried out close to room temperature, limiting cracking of the MOF film upon cooling from a high-temperature synthesis.
The MOF family M2L2P, where M, L and P are the metal cation, the dicarboxylate ligand, and the pillar ligand, respectively, are of great interest for thin film growth. The orientation of these MOF films can be controlled through growth along the dicarboxylate or pillar ligands,9 and the pores can be easily functionalised using a wide variety of available dicarboxylate ligands. In addition, many of these MOFs exhibit responsive and selective adsorption/desorption of different gases.10–12 For thin film synthesis, the pillar ligand typically employed is dabco (1,4-diazabicyclo[2.2.2]octane), while the dicarboxylate ligand has been varied, such as 1,4-benzenedicarboxylate (bdc),13,14 various functionalised bdc ligands,15–18 anthracene-9,10-dicarboxylate (adc),19 1,4-naphtalene dicarboxylate (1,4-ndc),9,20–22 and camphoric acid (cam).23,24
The 2,6-naphtalene dicarboxylate (2,6-ndc) ligand has not yet been employed for thin film synthesis of M2L2P type MOFs. It is a longer ligand, and thus the porosity of the thin film will be greater, compared to the ligands mentioned above [Fig. 1]. In the bulk form, M2(2,6-ndc)2(dabco), named DUT-8, has been synthesised under hydrothermal conditions for MII = Ni, Co, Cu, Zn, and have exhibited different sorption-induced responses.26,27 In particular, DUT-8(Ni) exhibits large flexibility upon desolvation and adsorption of different gases, with up to 254% changes in volume,28 while DUT-8(Cu) remains rigid upon desolvation and adsorption, and finally DUT-8(Zn) and DUT-8(Co) exhibit an irreversible and reversible transition, respectively, upon desolvation to an unknown phase.27 Recent studies have highlighted that the conformation of the 2,6-ndc linker is important for the interchange between the closed and open forms, which enables the large flexibility.29,30
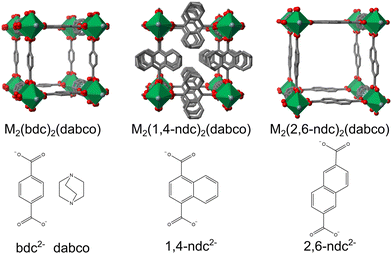 | ||
| Fig. 1 M2(L)2(dabco) MOFs with the ligands used shown below the structures, reproduced using the cifs from ref. 10, 25 and 26. Note that the 1,4-ndc2− ligand is disordered over four sites. | ||
Due to the interesting sorption properties of DUT-8 and the possibility to tune its structural flexibility with the choice of metal cation and synthesis conditions, we aim to synthesise DUT-8 in thin film form using the LbL strategy at room-temperature conditions. In this paper, we show first the DUT-8 bulk powder room-temperature synthesis and its characterisation by XRD. The thin-film synthesis using functionalised gold silicon substrates as well as non-functionalised glass slides is then reported. Characterisation of the films using XRD confirms crystalline and oriented thin films are formed for both M = Cu and Zn syntheses. The surface morphology and roughness are determined using AFM and SEM imaging. Additionally, 3D ED,31 a method recently used for the structure determination of various nanocrystalline materials that cannot be addressed by XRD methods,32–34 was employed for the crystal structure determination of crystals from the film surface. In contrast to the M = Cu and Zn synthesises, the M = Ni thin film synthesis did not yield any crystalline product. We highlight the competing phases possible for room-temperature synthesis of DUT-8, and the preferred synthesis pathways for the different metal cations.
2 Experimental section
2.1 Synthesis
We note that ambient temperature synthesis of DUT-8 has already been performed with DMF as the solvent, assisted with mixing in an ultrasonic bath and heating to 55 °C.35 The metal salt to 2,6-ndc and dabco ratio used was 1![[thin space (1/6-em)]](https://www.rsc.org/images/entities/char_2009.gif) :
:![[thin space (1/6-em)]](https://www.rsc.org/images/entities/char_2009.gif) 1
1![[thin space (1/6-em)]](https://www.rsc.org/images/entities/char_2009.gif) :
:![[thin space (1/6-em)]](https://www.rsc.org/images/entities/char_2009.gif) 2, so an excess of dabco is added compared to the high-temperature synthesis which uses the ratio as found in the formula unit of 1
2, so an excess of dabco is added compared to the high-temperature synthesis which uses the ratio as found in the formula unit of 1![[thin space (1/6-em)]](https://www.rsc.org/images/entities/char_2009.gif) :
:![[thin space (1/6-em)]](https://www.rsc.org/images/entities/char_2009.gif) 1
1![[thin space (1/6-em)]](https://www.rsc.org/images/entities/char_2009.gif) :
:![[thin space (1/6-em)]](https://www.rsc.org/images/entities/char_2009.gif) 0.5.27
0.5.27
For SAM functionalisation, the substrates (two at a time) were immersed into a 20 mM solution of 16-mercaptohexadecanoic acid (90%, Sigma-Aldrich) (MHDA) in ethanol/acetic acid (5% in volume) for 24 h. Afterwards, they were washed in a ethanol/acetic acid solution (10%) and used directly. We note that this functionalisation uses a much more concentrated solution than the typical 20 μM of MHDA employed,9,18 however, the higher concentration did not affect the surface roughness as investigated by AFM [Fig. S9, ESI†].
For the thin film growth, an automated inhouse-built dip coater that could move in the horizontal and vertical directions was employed. The substrate was submerged first in the metal acetate solution (1 mmol L−1) for 5 minutes, then in the 2,6-ndc (0.1 mmol L−1), and finally in the dabco solution (0.1 mmol L−1) for 10 minutes in each for the ligand solutions with a washing step in ethanol for 5 minutes in between each step. The concentration and the submersion times in solution were chosen based on the previous literature procedures, which often show a factor of 10 dilution from the metal salt solution to the ligand solutions, and double the submersion time for the ligand solutions [see Table S4, ESI†].9,13,18,22,36,37 This cycle was repeated 40 times.
The thin films were additionally grown on glass slides for comparison to the thin films grown on SAM-functionalised substrates. For these dip coatings, 80 cycles were employed with the same concentrations and dipping times as detailed above.
Thin film synthesis was also performed using the SAM 4-mercaptopyridine (95%, Sigma-Aldrich) (4-PyS) in order to explore different thin film growth directions. The substrates were immersed into a 10 mM solution of 4-PyS in ethanol for 24 h. Afterwards, they were washed in ethanol and used directly. AFM and SEM imaging revealed that at this concentration, the 4-PyS molecule self-assembled into multiple layers ontop of the substrate, forming a film [Fig. S9, ESI†]. Thus, a second functionalisation was used with a lower concentration of 4-PyS in ethanol at 0.1 mM, forming a much smoother functionalised surface [Fig. S9, ESI†]. The dip-coating procedure was performed by first submersion of the substrate in the metal acetate solution (1 mmol L−1) for 5 minutes, followed by the ligand solution (both 2,6-ndc and dabco; 0.1 mmol L−1) for 10 minutes with a washing step in ethanol for 5 minutes between each step. This procedure was identified as favouring growth along a different orientation.9 This cycle was repeated for 40 cycles.
2.2 X-ray diffraction
Powder X-ray diffraction on the bulk powders were measured using a PANalytical X'Pert Pro MPD diffractometer, operating in reflection mode. A Cu Kα source, rotating stage, and the X'Celerator detector were used.Synchrotron powder X-ray diffraction for the Cu2(2,6-ndc)2 (dabco) bulk synthesis was performed at the X04SA-MS beamline38 of the Swiss Light Source (Paul Scherrer Institute, Villigen, CH). The beam energy was set at 22 keV (λ = 0.5636 Å), and the single-photon counting silicon microstrip detector (MYTHEN II) was employed. The powder sample was loaded in a 0.5 mm diameter quartz capillary.
Powder X-ray diffraction was measured on the thin films using a PANalytical Empyrean diffractometer, operating in reflection mode. A Cu Kα source, the iCore and dCore optics, and the PIXcel1D detector were used.
Powder X-ray diffraction was measured on the thin films when SAM = 4-PyS using a Bruker D8 Davinci, operating in reflection mode. A two-bounce Ge(022) monochromator was employed, selecting the Cu Kα1 wavelength, and the LYNXEYE 1D detector was used.
Single-crystal X-ray diffraction on a 0.7 × 0.4 × 0.36 mm crystal of 2,6-ndc:dabco was measured using a Stoe IPDS-II diffractometer equipped with a graphite-monochromatised MoKα radiation and an image plate detector. The measured frames were converted into ESPERANTO format39 for indexing and integration using the CrysAlisPro software.40 The crystal structure was solved using a dual-space algorithm implemented in the SHELXT program.41 The iterative structure refinements were performed with the use of the SHELXL program built in the ShelXle graphical user interface.42,43
2.3 Electron diffraction
High-angle annular dark-field scanning transmission electron microscopy (HAADF-STEM) imaging and electron diffraction (ED) data were recorded with a Zeiss Libra TEM operating at 120 kV and equipped with a LaB6 source. 3D ED was performed in STEM mode after defocusing the beam in order to have a parallel illumination on the sample. ED patterns were collected with a beam size of about 150 nm in diameter, obtained using a 5 μm C2 condenser aperture. Data were recorded by a single-electron ASI MEDIPIX detector.44 An extremely low dose illumination was adopted in order to avoid beam damage.3D ED acquisitions were performed at room temperature by rotating the sample around the TEM goniometer axis in steps of 1°, in total tilt ranges up to 120°. The exposure time per frame was 1 s. The camera length was 180 mm, allowing resolution in real space up to 0.7 Å. During the experiment, the beam was processed around the optical axis by an angle of 1°. Precession was obtained using a Nanomegas Digistar P1000 device. After each tilt, a diffraction pattern was acquired and the crystal position was tracked by STEM imaging.
3D ED data were analysed using the software PETS2.0.45 Structure determination was obtained by standard direct methods as implemented in the software SIR2014.46 Data were treated with a fully kinematical approximation, assuming that Ihkl was proportional to |Fhkl|2. Least-squares structure refinement was performed with the software SHELXL using electron atomic scattering factors.47
2.4 AFM
AFM images were collected in peak force tapping mode using etched silicon tips, SCANASYST-AIR (Bruker, Santa Barbara, CA), with a spring constant range of 0.2 to 0.8 N m−1 and a resonant frequency range of 45 to 95 kHz. 1 Hz scan rate was used to collect images of 500 × 500 nm and 5 × 5 μm sizes at different locations on the thin film. In the case of very rough thin films, as for Zn(2,6-ndc)(H2O), the scan rate was reduced to 0.1 Hz. Image corrections and analysis was performed using Gwyddion.482.5 SEM
Scanning Electron Microscopy (SEM) images were recorded with a FEI Nova NanoSEM 230 (FEI, Hillsboro, Oregon, USA) at an accelerating voltage of 10–15 kV and a working distance of 5 mm, in some cases going to 3.8 mm for the higher magnification. The immersion mode was employed with the Through-Lens-Detector (TLD) for imaging.3 Results and discussion
The structures of DUT-8 (M2(2,6-ndc)2(dabco)), synthesised under hydrothermal conditions, were first reported by ref. 26 and 27. Only DUT-8(Ni) was grown as single crystals, while M = Co, Cu, or Zn compositions were solved from powder diffraction data. Since then, a re-evaluation of the DUT-8(Ni) and DUT-8(Zn) structures based upon the orientation of the non-linear 2,6-ndc ligand was determined, which was found to be important for the MOF flexibility [Fig. 2].29,30,49 The crystal sizes, linked to different synthesis conditions, were also found to influence the flexibility and guest-response properties of DUT-8(Ni), with the smaller particle sizes (below ∼500 nm) exhibiting a rigid response.35,49–52 For flexible DUT-8, changes in their crystal structure could be initiated by the presence of different solvent or gas molecules in the pores due to the varying interaction between the guest and the MOF.28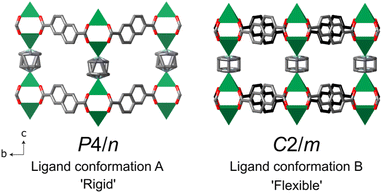 | ||
| Fig. 2 The DUT-8(Ni) crystal structures at 300 K from ref. 26 and 29 in the open pore form, with the different possible conformations of the 2,6-ndc ligand. The two different orientations are highlighted in the C2/m structure with the grey and black coloured carbons of the ligands. Note that in both structures the dabco ligand is disordered. The green square pyramids indicate the NiII coordination, O is in red, N in blue, C in grey or black, and hydrogen atoms have been omitted for clarity. | ||
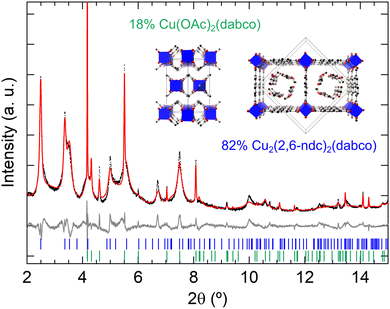
Prior to thin film synthesis, we performed the synthesis of M2(2,6-ndc)2(dabco) in bulk powder form at room temperature by layering the metal salt and ligands dissolved in ethanol. Synchrotron powder XRD measurements revealed that DUT-8(Cu) formed as a phase mixture of DUT-8(Cu)·3EtOH P4/n phase and Cu(OAc)2 (dabco) [Fig. 3].53 The mismatch in some of the measured diffraction intensities of the DUT-8(Cu)·3EtOH phase likely arises from the simplified model of the ethanol molecules in the pores [see Fig. S1 (ESI†) for a Pawley fit]. In the case of the DUT-8(Zn) synthesis, the powder diffraction pattern could not be identified to a particular known phase, and moreover, the formed sample changed with time as indicated by powder XRD measurements performed after three weeks of the sample being exposed to air [Fig. S2, ESI†]. This is in contrast to the DUT-8(Cu)·3EtOH sample, which remained stable with time. In one of the synthesis trials of DUT-8(Zn), acetic acid was added as a modulator to slow down the MOF formation for promoting single crystal growth.54 This synthesis condition resulted in the formation of single crystals of a new 2,6-ndc:dabco co-crystal [Fig. S3 and Table S1, ESI†]. For the DUT-8(Ni) synthesis, only a poorly crystalline/nanocrystalline powder formed [Fig. S4, ESI†]. Further studies on room-temperature (RT) synthesis optimisation are needed, in particular with EtOH used as the solvent. Increasing the molar ratios of ligands, and additional mixing steps could be future directions to try and optimise DUT-8 RT synthesis.
Despite the challenges encountered in the RT synthesis of DUT-8, the synthesis as thin films for MII = Cu, Zn, and Ni were carried out since the different synthesis conditions of LbL growth may be beneficial for selecting phase pure DUT-8 growth. The silicon substrates employed were functionalised by firstly gold coating and secondly by chemisorption of the self-assembled monolayer (SAM) 16-mercaptohexadecanoic acid (MHDA). The carboxylate ending of MHDA mimics the coordination of the 2,6-ndc ligand and is thus expected to promote growth of the MOF along the (110) direction [Fig. S10, ESI†]. A systematic study on the deposition sequence for the LbL growth of the related Cu2(1,4-ndc)2(dabco) MOF suggests the order of Cu(OAc)2 or Zn(OAc)2 → H2ndc → dabco, with an ethanol washing step in between, for oriented and crystalline films using the MHDA SAM.9 This sequence was thus employed here and repeated for 40 cycles using an automated homemade dip coater. For comparison, the same synthesis procedure was repeated on a glass substrate, containing no functionalised surface, for 80 cycles.
The homogeneity and morphology of the synthesised thin films were determined from atomic force microscopy (AFM) and scanning electron microscopy (SEM) measurements. AFM images were recorded on different positions of the thin film, and the average surface roughness was calculated within Gwyddion48 with the error representing the standard deviation. The initial gold surface has a root mean square (RMS) roughness (Rq) of 0.99(3) nm, which does not change upon MHDA functionalisation (Rq = 0.99(7) nm), consistent with the literature.55 However, the features in the MHDA film do become noticeably larger compared to the native gold surface, suggesting a change in surface morphology [Fig. S9, ESI†]. For the M = Cu thin film synthesis, the RMS roughness increases by a magnitude to 13(3) nm. However, in the case of the M = Zn synthesis, the thin film roughness is much larger with a two orders of magnitude increase at Rq = 150(20) nm [Fig. 4(a)]. The inhomogeneous surface of the M = Zn synthesis film was further confirmed by SEM, which revealed individual crystals on the surface at 0.5 to 1 μm in size. This contrasts with the M = Cu synthesis, which exhibits a dense film with particle sizes of 30–50 nm [Fig. 4(a)].
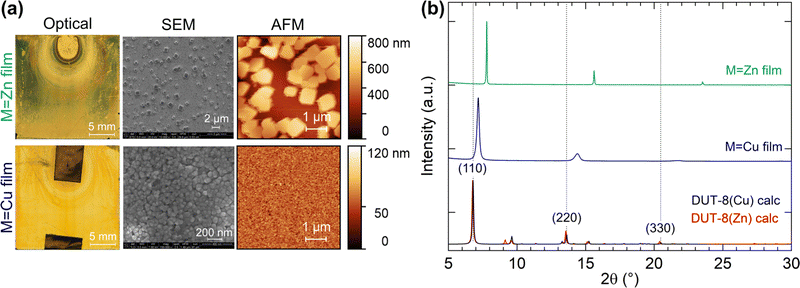 | ||
| Fig. 4 (a) Optical, SEM, and AFM images on the thin films for the M = Zn and Cu syntheses. (b) Powder X-ray diffraction patterns of the thin films with the calculated powder patterns of empty-pore DUT-8(Cu) and DUT-8(Zn) from ref. 27. | ||
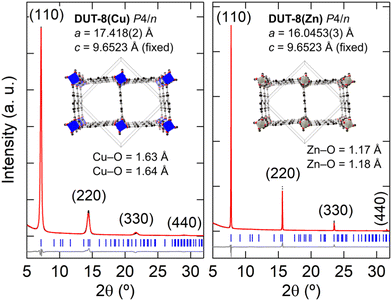
Fig. 4(b) shows the XRD patterns measured for the thin films when M = Cu and Zn. In the case of the thin film synthesis for M = Ni, no crystalline product was formed, which is consistent with the formation of a poorly crystalline powder in the bulk synthesis. The M = Cu and Zn thin film powder patterns could be fitted with the unit-cell parameters and P4/n symmetry of DUT-8,27 with a preferred orientation along the (110) direction, however, there is a large reduction in the ab-axes by 4.8% and 13.0% for M = Cu, and Zn, respectively [Fig. 5]. In order to validate whether this change in unit cell dimensions can still be chemically realistic, Rietveld refinements were performed where the 2,6-ndc ligand was treated as a rigid body and its orientation was refined with bonding restraints to the metal cation. Due to the limited number of diffraction peaks, all other structural parameters were kept fixed, many of which were imposed because of the high symmetry. The P4/n symmetry was employed for DUT-8(Zn) instead of the P2/n model since both structures fitted equally well and employing the P4/n model reduced the number of refineable parameters. These fits resulted in unphysically short M–O bonding distances of Cu–O at 1.6 Å and Zn–O at 1.2 Å [Fig. 5].56,57 In addition, the relative intensities of the diffraction peaks do not follow the DUT-8·xEtOH predicted pattern, but rather the empty-pore DUT-8 powder diffraction patterns, even though the films were not heated for desolvation. These points indicate that DUT-8 was not grown as intended, but that a different crystalline thin film formed instead.
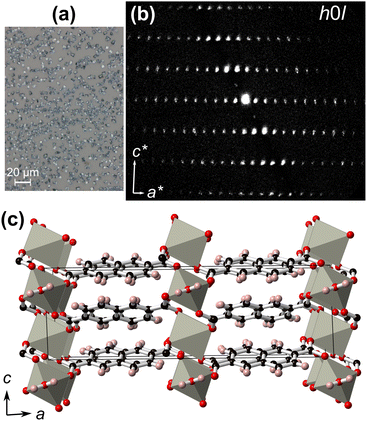
In order to elucidate the thin film crystal structure, the micron-sized crystals from the M = Zn synthesis were removed from the film surface [Fig. 6(a)], and measured using 3D ED. Electron diffraction was favoured over single-crystal X-ray diffraction due to the small crystal sizes. The crystals were isolated and directly dispersed on a carbon-coated Cu TEM grid. 3D ED data were recorded from six crystal fragments with sizes less than 1 μm [Fig. S5, ESI†]. All 3D ED data sets were consistent with a C-centred monoclinic cell with approximate unit-cell parameters of a = 22.7 Å, b = 6.3 Å, c = 7.3 Å, and β = 91.7° [Fig. 6(b) and Fig. S6, ESI†]. A search in the CCDC58 indicated a possible match with the coordination polymer Zn(2,6-ndc)(H2O).59,60
Ab initio structure solution was performed in the space group C2/c using the most complete 3D ED data set that was collected from one single nanocrystal. The obtained structural model confirms that the non-porous Zn(2,6-ndc)(H2O) coordination polymer is formed [Fig. 6(c) and Fig. S7, Table S2, ESI†]. This model was subsequently least-squares refined against 3D ED data imposing geometrical restraints for the interatomic distances and for the planarity of the flat naphthalene. All hydrogen atoms were generated in geometrically idealized positions. More details about structure determination and refinement are reported in Table S3 (ESI†).
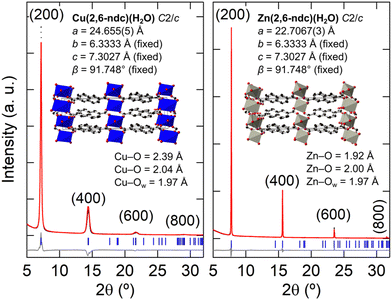
Using the result from the 3D ED, the thin-film XRD patterns were fitted with the M(2,6-ndc)(H2O) structural model. For these refinements the 2,6-ndc ligand was treated as a rigid body, and its orientation was allowed to refine with bonding restraints in place to Zn or Cu. Since the orientation of the film is along the (100) direction, the a-axis was refined. All other structural parameters were kept fixed due to the limited number of diffraction peaks. This resulted in an excellent fit for M = Zn and a reasonable fit for M = Cu, with the models exhibiting physically sound M–O bonding distances at Cu–O = 2.0 and 2.4 Å and Zn–O = 2.0 and 1.9 Å [Fig. 7; see Fig. S12 (ESI†) for an enlarged fit of Zn(2,6-ndc)(H2O)].56,57 The optical, SEM, and AFM images of the Zn(2,6-ndc)(H2O) thin film are shown in Fig. 4(a) and Fig. S13 (ESI†). However, Cu(2,6-ndc)(H2O) is not a known crystal structure, and trigonal bipyramidal CuII coordination does not display such large differences in the Cu–O distances, especially within the equatorial plane.61–63 Yet, the long Cu–O bonding distances are required for fitting the larger a-axis for M = Cu at a = 24.655(5) Å compared to a = 22.7067(3) Å for M = Zn. Unfortunately, electron diffraction on the nanocrystals recovered from the M = Cu thin film did not result in unit cell indexation nor structure solution due to the tendency of the crystals to aggregate and their poor diffraction quality [Fig. S8(a), ESI†].
Further thin films were synthesised with different substrate functionalisations in order to encourage other growth directions and thus observe a different set of hkl diffraction peaks to help elucidate the M = Cu thin film structure. In addition to the thin films with MHDA used as SAM, the SAM 4-mercaptopyridine (4-PyS) and a synthesis without any substrate functionalisation (glass substrate) were employed. For the thin film synthesis of M = Cu and (i) SAM = MHDA, (ii) SAM = 4-PyS, and (iii) no SAM functionalisation, all the diffraction patterns were identical [Fig. S11, ESI†]. In the case of the thin film synthesis with M = Zn and the MHDA SAM, 100% of (100) oriented Zn(2,6-ndc)(H2O) is formed. When 4-PyS is employed as SAM or no SAM used, the main peaks of Zn(2,6-ndc)(H2O) are preceded by peaks at lower angles. The position of these additional peaks match the peak positions found in the XRD patterns of M = Cu thin films [Fig. S11, ESI†]. These observations point towards a different phase that forms for all M = Cu thin film synthesises, and as a competing phase when M = Zn and SAM = 4-PyS or no SAM are used. Fig. S14 and S16 (ESI†) show the Rietveld fits using a two-phase fit for M = Zn when SAM = 4-PyS or no SAM are used, and the corresponding optical, SEM and AFM images are given in Fig. S15 and S17 (ESI†). The electron diffraction results also suggest a different structure than Zn(2,6-ndc)(H2O) for the M = Cu thin film due to the large difference in diffraction quality, which could arise from a more disordered and porous structure in the case of the M = Cu nanocrystals.
The thin film XRD patterns of the M = Cu synthesis resemble closely the thin film XRD of Cu(2,6-ndc) reported by ref. 64 [Fig. S18, ESI†]. Liu et al. report a structural model and unit cell of Cu(2,6-ndc) based upon ab initio electronic structure calculations as a = c = 13.35 Å, b = 5.6 Å, α = β = γ = 90° with P2 symmetry,64 although their XRD patterns were not fitted. Here we use the unit cell proposed by ref. 64, but reduce the symmetry to P1 in order to freely refine the 2,6-ndc ligand orientations. Our refinement of the experimental diffraction data leads to a = c = 12.3215(15) Å, with all other unit cell parameters kept fixed since only (h00) and (00l) reflections are observed. The smaller ac-plane necessitates the 2,6-ndc ligand to be coordinated to the CuII ions on a diagonal along the b-axis [Fig. 8]. This leads to a chain of equally-separated CuII ions which are linked with four 2,6-ndc ligands, with the centre of the ligands above and below the plane of the CuO4 square planar coordination [see Table S5 (ESI†) for the atomic coordinates]. This coordination differs from the expected paddle-wheel copper coordination geometries from ref. 64. However, the refined model gives Cu–O bonding in the expected range: 2.0–2.2 Å and a good fit to the experimental XRD pattern [Fig. 8; see Fig. S19 (ESI†) for an enlarged Rietveld fit]. The corresponding optical, SEM, and AFM images are given in Fig. 4(a) and Fig. S20 (ESI†). The thin films made with 4-PyS SAM or when no SAM is employed gave similar thin film diffraction patterns, which could be fitted using the Cu(2,6-ndc) model [Fig. S21 and S23, ESI†]. The corresponding optical, SEM, and AFM images are given in Fig. S22 and S24 (ESI†). Out of the three structural models refined for the M = Cu thin film, Cu(2,6-ndc) gives the most chemically feasible model with the d-spacings observed. For a complete structural validation, DFT-optimisation of the MOF structure and/or further efforts to crystallise more robust single crystals of Cu(2,6-ndc) for single-crystal or electron diffraction would be needed.
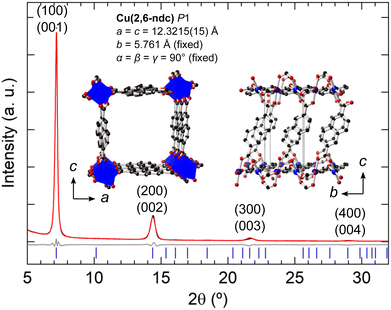 | ||
| Fig. 8 Rietveld fits of the X-ray powder diffraction of the thin films using Cu(2,6-ndc) as the structural model. Preferred orientation along the (001) was refined using the March-Dollase factor. | ||
In all thin film syntheses, the incorporation of the neutral pillar ligand dabco did not occur, and instead the coordination polymer Zn(2,6-ndc)(H2O) and metal–organic framework Cu(2,6-ndc) and Zn(2,6-ndc) were formed. The synthesized films gave contrasting morphologies depending on the phase grown. The Zn(2,6-ndc)(H2O) grows as isolated μm-sized crystals giving rise to extremely rough film surfaces of thicknesses of ∼480 nm [Fig. S25, ESI†], while the Cu(2,6-ndc) film exhibits homogeneous and flat surfaces with densely-packed nanoparticle-sized particles with film thicknesses of ∼166 nm [Fig. S26, ESI†]. While powder XRD is typically used to characterise MOF thin films, in the case of an unexpected phase growth it is extremely challenging to characterise the film crystal structure due to the limited number of diffraction peaks from a textured sample. In this study, we highlight that 3D ED is a powerful tool to be employed in thin film research in order to determine unambiguously the crystal structure of the film. We suggest that for future synthesis of DUT-8 thin film, much greater concentrations of dabco should be employed. However, there may be other synthesis parameters to optimise, since some MOF phases can form in a very narrow concentration, temperature, and pH range.65–67 In order go through many synthesis conditions for M2(2,6-ndc)2(dabco) thin films, a faster synthesis strategy could be adopted, such as the use of an aluminium-doped ZnO functionalisation on the substrate surface. MOF growth then requires only one submersion in the metal salt solution followed by the ligand solution.68
4 Conclusions
In summary, we show that DUT-8 synthesis at room temperature gives rise to a variety of other phases, such as mixtures of DUT-8(Cu) and Cu(OAc)2(dabco) in bulk powder synthesis, and in thin film LbL synthesis Zn(2,6-ndc)(H2O)/Zn(2,6-ndc) mixtures, and phase pure Zn(2,6-ndc)(H2O) or Cu(2,6-ndc). Due to the growth of unexpected thin film phases, 3D ED was used to elucidate the crystal structure of the thin film in the M = Zn synthesis. These results pave the way for future studies in DUT-8 thin film research.Author contributions
IEC: conceptualization, investigation, formal analysis, visualisation, writing – original draft, writing – review and editing. LH: formal analysis, investigation. IA: investigation, formal analysis, visualisation, writing – review and editing. AB, RF: investigation, writing – review and editing. MS: resources, investigation. SC: resources, software. AC, MG, GSQ, EH: resources. AN: resources, supervision.Conflicts of interest
GSQ and EH work at Eldico Scientific AG, which is a company that develops, produces, and sells electron diffractometers.Acknowledgements
I. E. C. acknowledges the European Unions Horizon 2020 research and innovation programme under the Marie Skłodowska-Curie grant agreement number 754364 for funding. I. E. C. is grateful to Robin Pauer, Andrea Arcifa, and Roman Furrer for the training and assistance on the SEM, AFM, and optical microscope, respectively. We are grateful to Lars Sommerhäuser for the chemistry lab access. I. A. and M. G. would like to thank Regione Toscana for funding the purchase of the ASI MEDIPIX detector through the FELIX project (POR CREO FERS 2014-2020). The Swiss Light Source is acknowledged for the provision of beamtime.Notes and references
- P. Kumar, A. Deep and K.-H. Kim, Trends Anal. Chem., 2015, 73, 39–53 CrossRef CAS.
- X. Fang, B. Zong and S. Mao, Nano-Micro Lett., 2018, 10, 64 CrossRef PubMed.
- H.-Y. Li, S.-N. Zhao, S.-Q. Zang and J. Li, Chem. Soc. Rev., 2020, 49, 6364–6401 RSC.
- I. Stassen, N. Burtch, A. Talin, P. Falcaro, M. Allendorf and R. Ameloot, Chem. Soc. Rev., 2017, 46, 3185–3241 RSC.
- M. Rivera-Torrente, L. D. Mandemaker, M. Filez, G. Delen, B. Seoane, F. Meirer and B. M. Weckhuysen, Chem. Soc. Rev., 2020, 49, 6694–6732 RSC.
- J. Ellis, S. Crawford and K.-J. Kim, Mater. Adv., 2021, 2, 6169–6196 RSC.
- J.-L. Zhuang, A. Terfort and C. Wöll, Coord. Chem. Rev., 2016, 307, 391–424 CrossRef CAS.
- O. Shekhah, J. Liu, R. Fischer and C. Wöll, Chem. Soc. Rev., 2011, 40, 1081–1106 RSC.
- D. Zacher, K. Yusenko, A. Bétard, S. Henke, M. Molon, T. Ladnorg, O. Shekhah, B. Schüpbach, T. de los Arcos, M. Krasnopolski, M. Meilikhov, J. Winter, A. Terfort, C. Wöll and R. A. Fischer, Chem. – Eur. J., 2011, 17, 1448–1455 CrossRef CAS PubMed.
- D. N. Dybtsev, H. Chun and K. Kim, Angew. Chem., Int. Ed., 2004, 43, 5033–5036 CrossRef CAS PubMed.
- K. Uemura, Y. Yamasaki, Y. Komagawa, K. Tanaka and H. Kita, Angew. Chem., Int. Ed., 2007, 46, 6662–6665 CrossRef CAS PubMed.
- S. Henke, A. Schneemann, A. Wütscher and R. A. Fischer, J. Am. Chem. Soc., 2012, 134, 9464–9474 CrossRef CAS PubMed.
- O. Shekhah, H. Wang, M. Paradinas, C. Ocal, B. Schüpbach, A. Terfort, D. Zacher, R. A. Fischer and C. Wöll, Nat. Mater., 2009, 8, 481–484 CrossRef CAS PubMed.
- B. D. McCarthy, T. Liseev, A. M. Beiler, K. L. Materna and S. Ott, ACS Appl. Mater. Interfaces, 2019, 11, 38294–38302 CrossRef CAS PubMed.
- O. Shekhah, H. K. Arslan, K. Chen, M. Schmittel, R. Maul, W. Wenzel and C. Wöll, Chem. Commun., 2011, 47, 11210–11212 RSC.
- Z. Wang, J. Liu, H. K. Arslan, S. Grosjean, T. Hagendorn, H. Gliemann, S. Bräse and C. Wöll, Langmuir, 2013, 29, 15958–15964 CrossRef CAS PubMed.
- J. L. Zhuang, M. Kind, C. M. Grytz, F. Farr, M. Diefenbach, S. Tussupbayev, M. C. Holthausen and A. Terfort, J. Am. Chem. Soc., 2015, 137, 8237–8243 CrossRef CAS PubMed.
- S. Wannapaiboon, A. Schneemann, I. Hante, M. Tu, K. Epp, A. L. Semrau, C. Sternemann, M. Paulus, S. J. Baxter, G. Kieslich and R. A. Fischer, Nat. Commun., 2019, 10, 346 CrossRef CAS PubMed.
- J. Zhuang, J. Friedel and A. Terfort, Beilstein J. Nanotechnol., 2012, 3, 570–578 CrossRef PubMed.
- O. Shekhah, K. Hirai, H. Wang, H. Uehara, M. Kondo, S. Diring, D. Zacher, R. A. Fischer, O. Sakata, S. Kitagawa, S. Furukawa and C. Wöll, Dalton Trans., 2011, 40, 4954–4958 RSC.
- A. Bétard, H. Bux, S. Henke, D. Zacher, J. Caro and R. A. Fischer, Microporous Mesoporous Mater., 2012, 150, 76–82 CrossRef.
- B. Liu, M. Tu and R. A. Fischer, Angew. Chem., Int. Ed., 2013, 52, 3402–3405 CrossRef CAS PubMed.
- B. Liu, O. Shekhah, H. K. Arslan, J. Liu, C. Wöll and R. A. Fischer, Angew. Chem., Int. Ed., 2012, 51, 807–810 CrossRef CAS PubMed.
- Z.-G. Gu, J. Bürck, A. Bihlmeier, J. Liu, O. Shekhah, P. G. Weidler, C. Azucena, Z. Wang, S. Heissler, H. Gliemann, W. Klopper, A. S. Ulrich and C. Wöll, Chem. – Eur. J., 2014, 20, 9879–9882 CrossRef CAS PubMed.
- H. Chun, D. N. Dybtsev, H. Kim and K. Kim, Chem. – Eur. J., 2005, 11, 3521–3529 CrossRef CAS PubMed.
- N. Klein, C. Herzog, M. Sabo, I. Senkovska, J. Getzschmann, S. Paasch, M. R. Lohe, E. Brunner and S. Kaskel, Phys. Chem. Chem. Phys., 2010, 12, 11778–11784 RSC.
- N. Klein, H. C. Hoffmann, A. Cadiau, J. Getzschmann, M. R. Lohe, S. Paasch, T. Heydenreich, K. Adil, I. Senkovska, E. Brunner and S. Kaskel, J. Mater. Chem., 2012, 22, 10303–10312 RSC.
- V. Bon, N. Klein, I. Senkovska, A. Heerwig, J. Getzschmann, D. Wallacher, I. Zizak, M. Brzhezinskaya, U. Mueller and S. Kaskel, Phys. Chem. Chem. Phys., 2015, 17, 17471–17479 RSC.
- P. S. Petkov, V. Bon, C. L. Hobday, A. B. Kuc, P. Melix, S. Kaskel, T. Düren and T. Heine, Phys. Chem. Chem. Phys., 2019, 21, 674–680 RSC.
- S. Ehrling, E. M. Reynolds, V. Bon, I. Senkovska, T. E. Gorelik, J. D. Evans, M. Rauche, M. Mendt, M. S. Weiss, A. Pöppl, E. Brunner, U. Kaiser, A. L. Goodwin and S. Kaskel, Nat. Chem., 2021, 13, 568–574 CrossRef CAS PubMed.
- M. Gemmi, E. Mugnaioli, T. E. Gorelik, U. Kolb, L. Palatinus, P. Boullay, S. Hovmöller and J. P. Abrahams, ACS Cent. Sci., 2019, 5, 1315–1329 CrossRef CAS PubMed.
- J. Hynek, P. Brázda, J. Rohlíček, M. G. S. Londesborough and J. Demel, Angew. Chem., Int. Ed., 2018, 57, 5016–5019 CrossRef CAS PubMed.
- N. Portolés-Gil, A. Lanza, N. Aliaga-Alcalde, J. A. Ayllón, M. Gemmi, E. Mugnaioli, A. M. López-Periago and C. Domingo, ACS Sustainable Chem. Eng., 2018, 6, 12309–12319 CrossRef.
- S. Yuan, J.-S. Qin, H.-Q. Xu, J. Su, D. Rossi, Y. Chen, L. Zhang, C. Lollar, Q. Wang, H.-L. Jiang, D. H. Son, H. Xu, H. Zhehao, X. Zou and H.-C. Zhou, ACS Cent. Sci., 2018, 4, 105–111 CrossRef CAS PubMed.
- S. Ehrling, I. Senkovska, V. Bon, J. D. Evans, P. Petkov, Y. Krupskaya, V. Kataev, T. Wulf, A. Krylov, A. Vtyurin, S. Krylova, S. Adichtchev, E. Slyusareva, M. S. Weiss, B. Büchner, T. Heine and S. Kaskel, J. Mater. Chem. A, 2019, 7, 21459–21475 RSC.
- H. K. Arslan, O. Shekhah, D. F. Wieland, M. Paulus, C. Sternemann, M. A. Schroer, S. Tiemeyer, M. Tolan, R. A. Fischer and C. Wöll, J. Am. Chem. Soc., 2011, 133, 8158–8161 CrossRef CAS PubMed.
- O. Shekhah, L. Fu, R. Sougrat, Y. Belmabkhout, A. J. Cairns, E. P. Giannelis and M. Eddaoudi, Chem. Commun., 2012, 48, 11434–11436 RSC.
- P. R. Willmott, D. Meister, S. J. Leake, M. Lange, A. Bergamaschi, M. Böge, M. Calvi, C. Cancellieri, N. Casati, A. Cervellino, Q. Chen, C. David, U. Flechsig, F. Gozzo, B. Henrich, S. Jäggi-Spielmann, B. Jakob, I. Kalichava, P. Karvinen, J. Krempasky, A. Lüdeke, R. Lüscher, S. Maag, C. Quitmann, M. L. Reinle-Schmitt, T. Schmidt, B. Schmitt, A. Streun, I. Vartiainen, M. Vitins, X. Wang and R. Wullschleger, J. Synchrotron Rad., 2013, 20, 667–682 CrossRef CAS PubMed.
- S. Rashchenko, Data transfer from STOE IPDS2T to CrysAlis esperanto format, 2016 Search PubMed.
- CrysalisPro, Rigaku Oxford Diffraction, Yarnton, England, 2015.
- G. M. Sheldrick, Acta Crystallogr., Sect. A, 2015, 71, 3–8 CrossRef PubMed.
- G. M. Sheldrick, Acta Crystallogr., Sect. A, 2008, 64, 112–122 CrossRef CAS PubMed.
- C. B. Hübschle, G. M. Sheldrick and B. Dittrich, J. Appl. Crystallogr., 2011, 44, 1281–1284 CrossRef PubMed.
- I. Nederlof, E. van Genderen, Y.-W. Li and J. P. Abrahams, Acta Crystallogr., Sect. D, 2013, 69, 1223–1230 CrossRef CAS PubMed.
- L. Palatinus, P. Brázda, M. Jelínek, J. Hrdá, G. Steciuk and M. Klementová, Acta Crystallogr., Sect. B, 2019, 75, 512–522 CrossRef CAS PubMed.
- M. C. Burla, R. Caliandro, B. Carrozzini, G. L. Cascarano, C. Cuocci, C. Giacovazzo, M. Mallamo, A. Mazzone and G. Polidori, J. Appl. Crystallogr., 2015, 48, 306–309 CrossRef CAS.
- G. M. Sheldrick, Acta Crystallogr., Sect. C, 2015, 71, 3–8 CrossRef PubMed.
- D. Necas and P. Klapetek, Open Phys., 2012, 10, 181–188 Search PubMed.
- L. Abylgazina, I. Senkovska, S. Ehrling, V. Bon, P. S. Petkov, J. D. Evans, S. Krylova, A. Krylov and S. Kaskel, CrystEngComm, 2021, 23, 538–549 RSC.
- N. Kavoosi, V. Bon, I. Senkovska, S. Krause, C. Atzori, F. Bonino, J. Pallmann, S. Paasch, E. Brunner and S. Kaskel, Dalton Trans., 2017, 46, 4685–4695 RSC.
- H. Miura, V. Bon, I. Senkovska, S. Ehrling, S. Watanabe, M. Ohba and S. Kaskel, Dalton Trans., 2017, 46, 14002–14011 RSC.
- M. J. Thompson, C. L. Hobday, I. Senkovska, V. Bon, S. Ehrling, M. Maliuta, S. Kaskel and T. Düren, J. Mater. Chem. A, 2020, 8, 22703–22711 RSC.
- V. M. Rao, D. N. Sathyanarayana and H. Manohar, J. Chem. Soc., Dalton Trans., 1983, 2167–2173 RSC.
- T. Tsuruoka, S. Furukawa, Y. Takashima, K. Yoshida, S. Isoda and S. Kitagawa, Angew. Chem., Int. Ed., 2009, 48, 4739–4743 CrossRef CAS PubMed.
- L. Roussille, G. Brotons, L. Ballut, G. Louarn, D. Ausserré and S. Ricard-Blum, Anal. Bioanal. Chem., 2011, 401, 1601 CrossRef CAS PubMed.
- A. G. Orpen, L. Brammer, F. H. Allen, O. Kennard, D. G. Watson and R. Taylor, J. Chem. Soc., Dalton Trans., 1989, S1–S83 RSC.
- A. Nimmermark, L. Öhrström and J. Reedijk, Z. Kristallogr., 2013, 228, 311–317 CAS.
- C. R. Groom, I. J. Bruno, M. P. Lightfoot and S. C. Ward, Acta Crystallogr., Sect. B, 2016, 72, 171–179 CrossRef CAS PubMed.
- K. O. Kongshaug and H. Fjellvåg, Solid State Sci., 2002, 4, 443–447 CrossRef CAS.
- D. W. Min, S. S. Yun, C. U. Lee, C. Y. Lee, M. G. Seo, Y. J. Hwang, W. S. Han and S. W. Lee, Bull. Korean Chem. Soc., 2001, 22, 531–533 CAS.
- R. K. Eby and F. C. Hawthorne, Acta Crystallogr., Sect. B, 1993, 49, 28–56 CrossRef.
- H. Effenberger, Z. Kristallogr. Cryst. Mater., 1987, 180, 43–50 CrossRef CAS.
- H. Effenberger, J. Solid State Chem., 1988, 73, 118–126 CrossRef CAS.
- J. Liu, B. Lukose, O. Shekhah, H. K. Arslan, P. Weidler, H. Gliemann, S. Bräse, S. Grosjean, A. Godt, X. Feng, K. Müllen, I.-B. Magdau, T. Heine and C. Wöll, Sci. Rep., 2012, 2, 921 CrossRef PubMed.
- N. Stock and S. Biswas, Chem. Rev., 2012, 112, 933–969 CrossRef CAS PubMed.
- C. Ma, L. Zheng, G. Wang, J. Guo, L. Li, Q. He, Y. Chen and H. Zhang, Aggregate, 2022, 3, e145 Search PubMed.
- A. Gheorghe, I. Imaz, J. I. Van Der Vlugt, D. Maspoch and S. Tanase, Dalton Trans., 2019, 48, 10043–10050 RSC.
- K.-J. Kim, J. E. Ellis, B. H. Howard and P. R. Ohodnicki, ACS Appl. Mater. Interfaces, 2021, 13, 2062–2071 CrossRef CAS PubMed.
Footnote |
| † Electronic supplementary information (ESI) available: Powder X-ray diffraction patterns of the bulk powder synthesis of DUT-8 and the single-crystal diffraction details and structure of the 2,6-ndc:dabco co-crystal; 3D electron diffraction collection and refinement details; thin film X-ray diffraction patterns and their Rietveld fits; optical, AFM, and SEM images of the thin films; and cross-section SEM images of the thin films. The 2,6-ndc:dabco co-crystal structure was submitted to the CCDC with the number CCDC 2154582. For ESI and crystallographic data in CIF or other electronic format see DOI: https://doi.org/10.1039/d2ma00389a |
| This journal is © The Royal Society of Chemistry 2022 |

