DOI:
10.1039/D2MA00621A
(Paper)
Mater. Adv., 2022,
3, 6862-6868
A 2-chloroethyl ethyl sulfide (2-CEES) gas sensor based on a WO3/graphite nanocomposite with high selectivity and fast response-recovery properties†
Received
1st June 2022
, Accepted 19th July 2022
First published on 21st July 2022
Abstract
Sensitive detection of toxic and harmful gases is essential in the field of environmental monitoring and human health. Among the detection strategies, gas sensors based on metal oxides are widely adopted. However, the gas sensor based on a single metal oxide has some problems such as poor selectivity and long response recovery time, which limit its further practical application. This paper is committed to improving the selectivity and shortening the response-recovery time toward 2-chloroethyl ethyl sulfide (2-CEES, dichlorodiethyl sulfide simulation). Tungsten oxide (WO3)/graphite nanocomposites were prepared by simple blending, and the sensing performance toward 2-CEES gas was explored. The experimental results show that the WO3/graphite gas sensor with a WO3 mass fraction of 97% exhibits excellent sensing performance. In more detail, the device has a high response of 63% for 5.70 ppm 2-CEES at a working temperature of 260 °C, a fast response-recovery time (8 s/34 s) and high selectivity compared with ammonia, acetone, ethanol, and other toxic gas simulation gases [dimethyl methylphosphonate (DMMP) and acetonitrile]. This study provides an effective strategy to realize a high-performance gas sensor for dichlorodiethyl sulfide.
Introduction
Toxic and harmful gases existing in daily life can damage the human body. These agents are classified into blister agents, nerve agents, blood agents and pulmonary agents according to their toxic mechanism toward the human body.1,2 Among them, the main representative of blister agents is dichlorodiethyl sulfide. Studies have shown that when the human body is exposed to an atmosphere of dichlorodiethyl sulfide, it can cause local damage to the skin, eyes, respiratory tract and other parts, and even in low concentrations of dichlorodiethyl sulfide, it will cause death.3,4 Therefore, effectively detecting low concentrations of dichlorodiethyl sulfide has great importance in both environmental protection and human healthcare. At present, the detection of dichlorodiethyl sulfide mainly adopts ion migration spectrometry, mass spectrometry, gas chromatography, micro-cantilever sensors, surface acoustic wave sensors, quartz-crystal microbalance sensors (QCMs), and fluorescence detection kits.5–13 However, these techniques are complex, expensive, time-consuming to operate, and the accuracy of the equipment decreases due to aging.14 By contrast, gas sensors based on metal oxide have the advantages of simple preparation, fast response speed and high sensitivity.15–22
Due to the great toxicity of toxic and harmful gases, it is very dangerous to directly use toxic and harmful gases for experiments in the laboratory. Therefore, simulants with physicochemical properties and structures similar to toxic and harmful gases are generally used for experiments, and the chemical gas 2-chloroethyl ethyl sulfide (2-CEES) is commonly used for dichlorodiethyl sulfide simulants.23,24 In recent years, 2-CEES sensors based on metal oxides have been reported successively. For example, Pt-doped CdSnO3 and Ru-doped CdSnO3 nanostructured films prepared by ultrasonic spray pyrolysis were used to sense 2-CEES, and the results showed that the sensor has good detection ability, but the recovery time of this sensor for 2-CEES gas is too long.24,25 Ran Yoo et al. investigated the sensing properties of ZnO nanoparticles and Al-doped ZnO nanoparticles for 2-CEES. The response of ZnO nanoparticles to 1 ppm 2-CEES at a temperature of 250 °C is 15, and the response of Al-doped ZnO nanoparticles to 20 ppm 2-CEES at a temperature of 500 °C is 954.2. Although ZnO-based sensors have good responses, they suffer from higher operating temperatures.26
Due to the poor sensor recovery ability and lack of selectivity in the above-mentioned literature, a gas sensor based on tungsten oxide (WO3)/graphite composites was fabricated with a fast response-recovery time and excellent selectivity to 2-CEES gas in this paper. The gas sensor has a 63% response toward 5.70 ppm 2-CEES at a temperature of 260 °C, a rapid response/recovery time (8 s/34 s), and excellent reproducibility and long-term stability. It can detect a relatively low concentration of 2-CEES gas. The detection limit is 0.10 ppm, and the sensitivity is 22%. The response of the gas sensor to 2-CEES gas is almost 30 times higher than that of ammonia and acetonitrile at the same concentration, 10 times higher than that of ethanol, 5 times higher than that of DMMP, and 4 times higher than that of acetone, indicating that the sensor has good selectivity. This study provides an effective strategy for realizing a dichlorodiethyl sulfur gas sensor with high selectivity and a fast response recovery time.
Experimental methods
Chemical reagent
All chemicals used in this study were not further purified. Acetone (C3H6O), ammonia (NH3(aq)), and ethanol (C2H5OH), were purchased from Sinopharm Chemical Reagent Co., Ltd. 2-Chloroethy ethyl sulfide (C4H9ClS), dimethyl methylphosphonate (C3H9O3P), acetonitrile (C2H3N), and tungsten oxide (WO3, average particle size <100 nm) were purchased from Shanghai Macklin Biochemical Co., Ltd. Deionized (DI) water was used in the whole experiment.
Materials synthesis
In a typical experiment, a given quantity of graphite was dispersed in ethanol/deionized water (volume fraction of 5![[thin space (1/6-em)]](https://www.rsc.org/images/entities/char_2009.gif) :1) to obtain a uniform mixture (0.09 mg ml−1). Afterwards, WO3 nanopowders with various weights of 80 mg, 90 mg, 100 mg and 110 mg were respectively added into graphite solution (30 ml) under magnetic stirring for 24 h. Then, the mixed materials were put into an oven for 24 hours at a temperature of 60 °C, and were marked as S1, S2, S3 and S4, respectively.
:1) to obtain a uniform mixture (0.09 mg ml−1). Afterwards, WO3 nanopowders with various weights of 80 mg, 90 mg, 100 mg and 110 mg were respectively added into graphite solution (30 ml) under magnetic stirring for 24 h. Then, the mixed materials were put into an oven for 24 hours at a temperature of 60 °C, and were marked as S1, S2, S3 and S4, respectively.
Characterization
The morphology and structure of the sensing materials were characterized using a transmission electron microscope (TEM, JEM-2100), scanning electron microscopy (SEM, S-4800) and X-ray diffraction (XRD, SmartLab, 9 KW).
Measurements
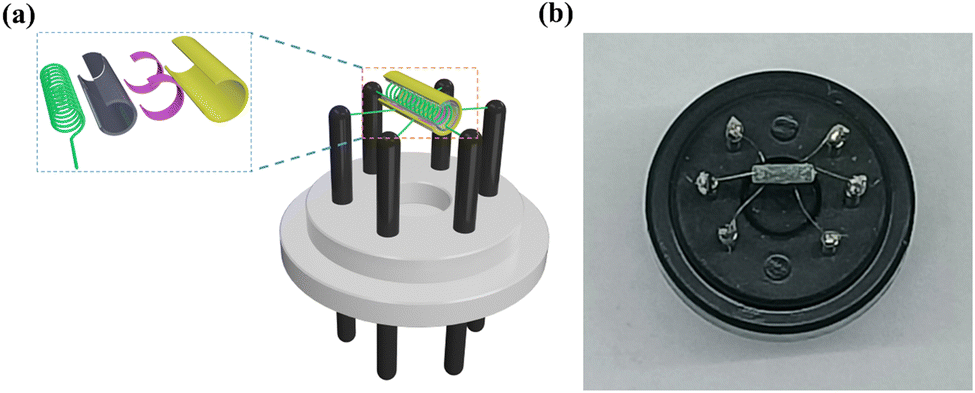
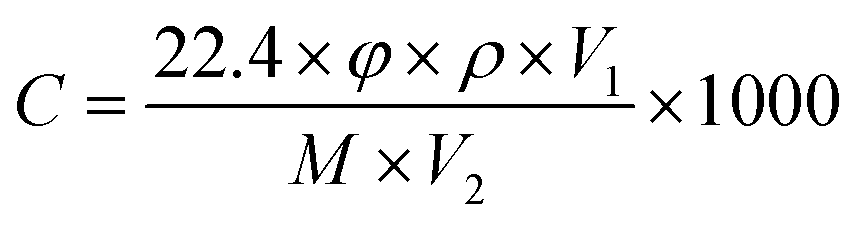
The WS-30B gas sensor test system (Zhengzhou Weisheng Electronic Technology Co., Ltd) was used to test the sensor performance. The width of both gold electrodes on the ceramic tube is 0.6 mm, and the gap between the two gold electrodes is 1.0 mm. First, the sensing material was dispersed in agate mortar, mixed with an appropriate amount of deionized water, and ground to obtain a uniform slurry. The slurry was uniformly coated on the Al2O3 ceramic tube containing gold electrodes. Then the ceramic tube was put into the oven at a temperature of 180 °C for half an hour, to remove moisture. The ceramic tube was welded on a pedestal with six probes, and a Ni–Cr alloy coil was inserted into the tube, as shown in Fig. 1a. The working temperature can be controlled by adjusting the heating current flowing through the heater. An actual photo of the sensor is shown in Fig. 1b. The sensor is inserted into the measuring board of the sensor measurement system for gas sensing measurement. Inject a corresponding amount of liquid corresponding to a certain concentration calculated in advance through a micro syringe. A specific concentration of test gas can be obtained by heating and evaporating a corresponding amount of liquid. The corresponding amount of injected liquid is obtained from the following formula:  , where C (ppm) is the target gas concentration, ρ (g mL−1) is the density of the liquid, φ is the required gas volume fraction, V1 (μL) is the volume of liquid, V2 (L) is the volume of the chamber, and M (g mol−1) is the molecular weight of the liquid. The resistance change is displayed in real time through the software on the computer. The sensor sensitivity formula is defined as S (%) = (Ra − Rg)/Ra × 100, where Ra and Rg are the resistances in the air and in the test gas atmosphere, respectively. Gas response time and recovery time are defined as the time required for 90% of the total resistance change.
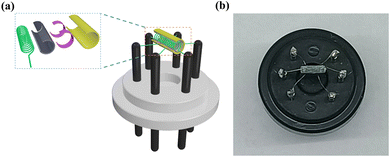 |
| | Fig. 1 The gas sensor used in the experiment. (a) Schematic diagram and (b) physical photo of the gas sensor. | |
Results and discussion
Material characterizations
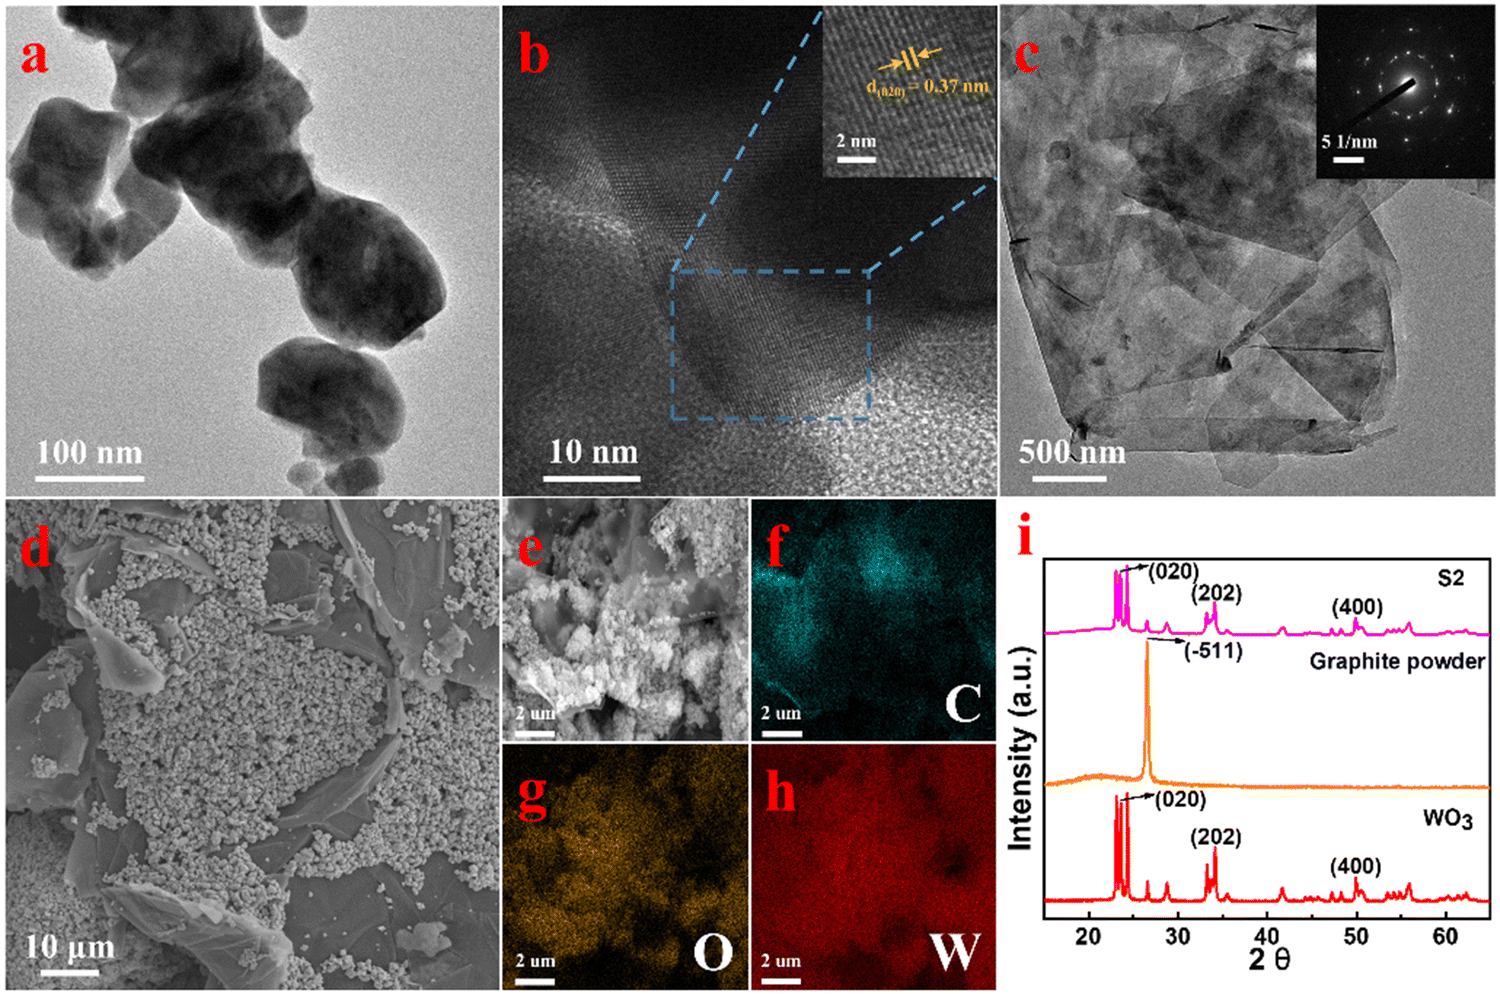
Firstly, the morphology and microstructure of raw materials and composites were studied. From Fig. 2a and Fig. S1a (ESI†), it can be seen that WO3 is in the shape of nanoparticles. The high resolution TEM (HRTEM) indicates that the lattice spacing of WO3 is 0.37 nm and the corresponding crystal plane is (020), as shown in Fig. 2b. The TEM and SEM images of graphite are shown in Fig. 2c and Fig. S1b (ESI†). From the figures, it can be seen that the graphite presents a multi-layer flake structure. Fig. 2d and Fig. S2 (ESI†) show the SEM images of WO3/graphite composites with different mass ratios of WO3 to graphite. The WO3 nanoparticles are firmly attached to the graphite sheet, and the WO3 adheres and clusters together on the surface of graphite more and more with an increase of mass ratios. The composition of the S2 was further characterized using elemental mapping analyses, and the results are shown in Fig. 2(e–h). C, O and W elements were evenly dispersed in the whole product, confirming that the composites are composed of WO3 and graphite without other impurities. The structure of S2 was further characterized by X-ray diffraction (XRD), as shown in Fig. 2i. The main diffraction peaks of S2 are located at angles of 23.6°, 34.2° and 49.9°, respectively, corresponding to the (020), (202) and (400) planes of WO3 (JCPDS # 83-0950). The XRD results indicated that the incorporation of graphite did not cause any change in the crystalline phase of the WO3 nanoparticles. In addition, no other diffraction peaks were observed, which indicates that the high purity of the synthetic powder was guaranteed by the high purity of raw materials and the cleanness of the synthesis process. The specific surface areas of the WO3 and WO3/graphite were, respectively, 5.3456 and 6.1215 m2 g−1 (Table 1).
 |
| | Fig. 2 Characterization of WO3, graphite and WO3/graphite. (a) TEM images of WO3 nanoparticles. (b) HRTEM image of WO3 nanoparticles. (c) TEM images of graphite. (d) SEM image of WO3/graphite (S2). (e–h) elemental mapping images of WO3/graphite (S2). (i) XRD patterns of WO3, graphite and WO3/graphite (S2). | |
Table 1 BET analysis results
| Parameter |
WO3 |
WO3/graphite |
|
a
BET (m2 g−1) |
5.3456 |
6.1215 |
| Total pore volume@p/p0 = 0.990 (cm3 g−1) |
0.050367 |
0.076678 |
Gas-sensing properties
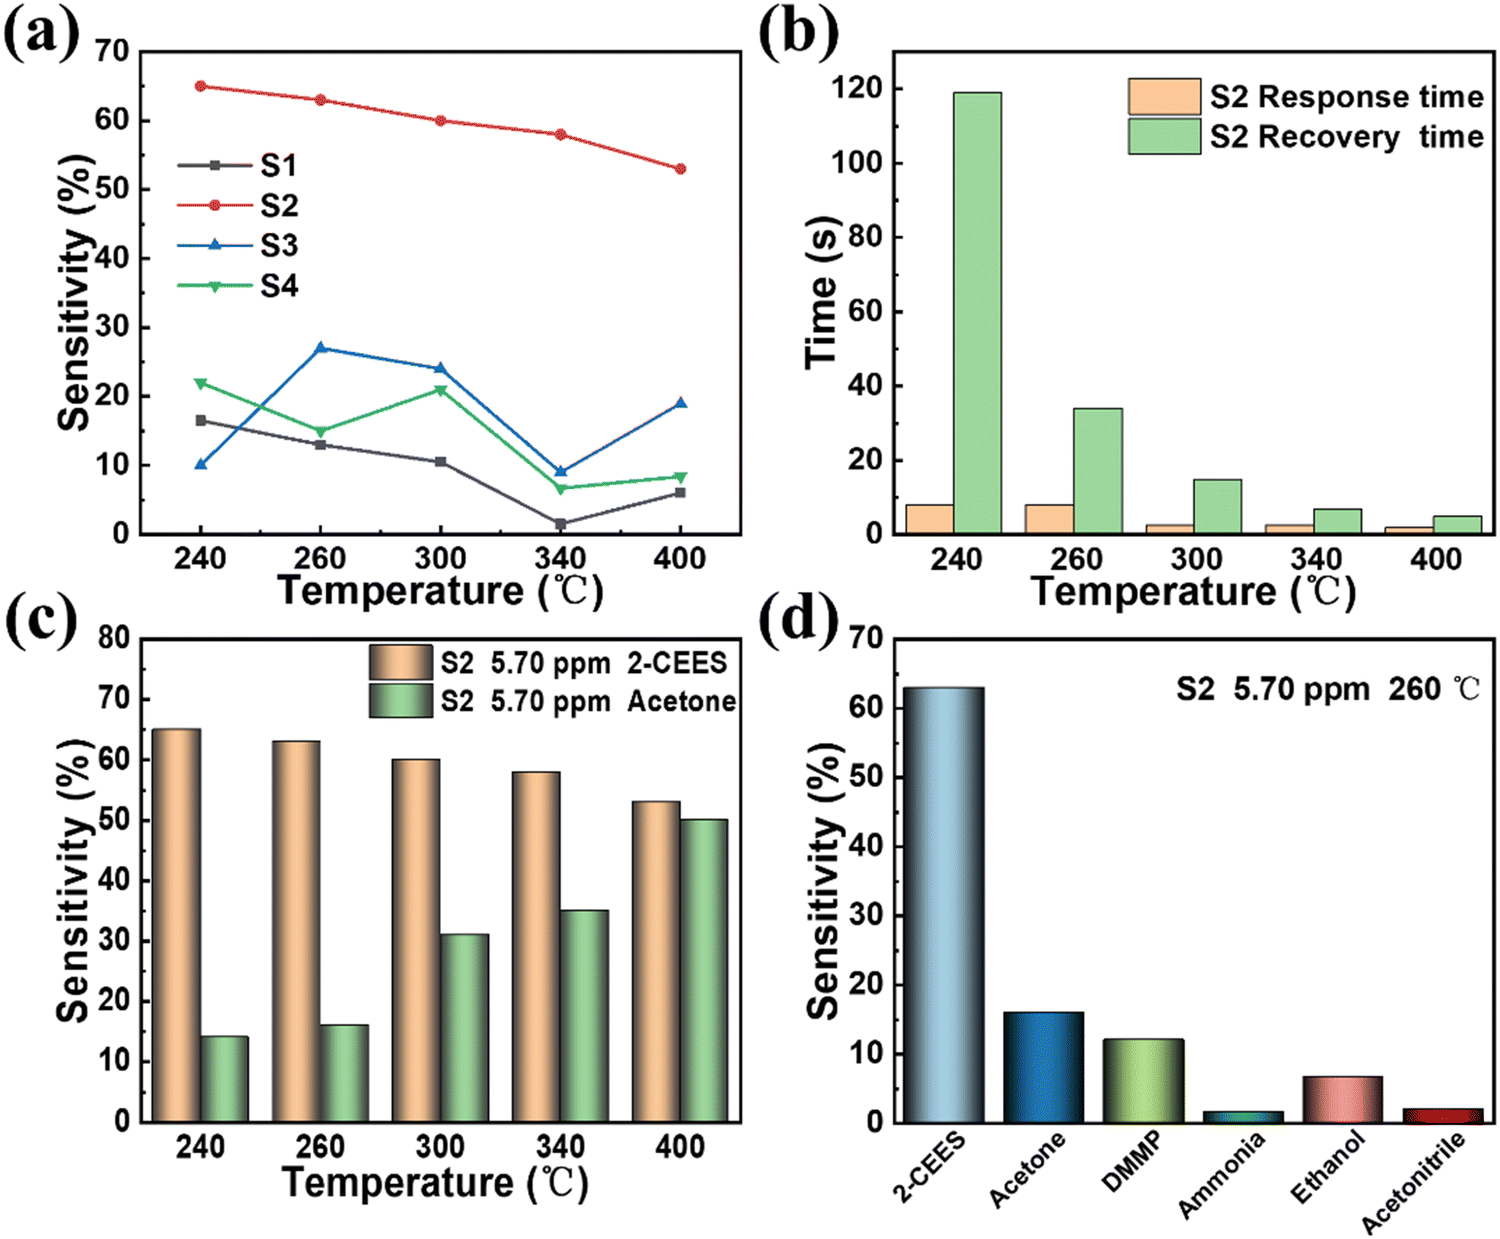
The influence of the working temperature on the response of the sensors was first studied, as shown in Fig. 3a and Fig. S3 (ESI†). The concentration of the measured 2-CEES gas is 5.70 ppm. It can be seen that the S2 sensor had the highest response at all operating temperatures. The response of S1, S3 and S4 sensors at all operating temperatures is relatively small, no more than 30%. This is because with the gradual addition of WO3 concentration, more adsorption sites participate in the molecular adsorption process, resulting in a significant response enhancement. In particular in the case of the S2 sensor, the sensing response is very large. However, with a further increase in WO3 concentration, the sensing response begins to decrease, which is due to the overflow film resistance. Therefore, the sensor based on S2 has the best response, that is, the best content of WO3 is 97%. Besides, the sensitivity of the S2 sensor decreases with the increase of the working temperature. This phenomenon may be explained as follows. As the operating temperature increases to a certain extent, the number of electrons in the conduction band of WO3 is greatly reduced, and the electron supply is insufficient to react with oxygen in the atmosphere, so that species containing oxygen ions cannot be formed. Due to the loss of oxygen-containing ions that act as active sites on the surface of the sensing materials, the reaction with 2-CEES gas becomes less, and the corresponding response is reduced.27 The response recovery time of the S2 sensor at different operating temperatures was further calculated. The response time and recovery time of the S2 sensor toward 2-CEES gas with a concentration of 5.70 ppm at different operating temperatures are shown in Fig. 3b. It can be seen from the figure that under all operating temperatures, the response time is relatively short, within 10 s. This shows that the sensor has good responsiveness. In addition, the response time reduces as the operating temperature increases. However, when the operating temperature is low, that is, below 240 °C, the recovery time is relatively long, which is not conducive to the detection of 2-CEES gas. With the increase of operating temperature, i.e. higher than 240 °C and lower than 260 °C, the recovery time is significantly reduced. At the operating temperature of 260 °C, the recovery time decreases a lot to 34 s. This shows that the sensor has good recoverability. With the further increase of operating temperature, i.e. higher than 260 °C, the recovery time continues to decrease. Fig. 3c, Fig. S3b, and Fig. S4a (ESI†) show the sensing responses of the S2 sensor toward 5.70 ppm of 2-CEES and acetone gas at different temperatures. It can be found that when the operating temperature is 240 °C or 260 °C, the sensor has a large response toward 2-CEES gas, but the response to acetone gas is relatively small. At this time, the sensitivity of 2-CEES is almost 4 times that of acetone. As the operating temperature gets higher and higher, when it reaches 300 °C, the response of 2-CEES decreases slightly, but the response of acetone increases greatly. At this time, the response of acetone has almost reached half of that of 2-CEES. With the further increase of operating temperature, the response of 2-CEES decreases gradually, and the response of acetone further increases, and the ratio of the two responses becomes smaller and smaller. When the operating temperature reaches 400 °C, the response of acetone is almost equal to that of 2-CEES. Through the above analysis, S2 was selected as the gas sensor material of 2-CEES, the best content of WO3 is 97%, and the optimal operating temperature is 260 °C. The sensing responses of the S2 sensor toward 5.70 ppm of other interfering gases, such as acetone, DMMP, ammonia, ethanol, and acetonitrile at an operating temperature of 260 °C were also studied, as shown in Fig. 3d and Fig. S4b (ESI†). The sensor has a relatively small response toward interfering gases compared with 2-CEES gas, which indicates that the S2 sensor has good selectivity, and can detect 2-CEES in the presence of interfering gases, and has a good development prospect.
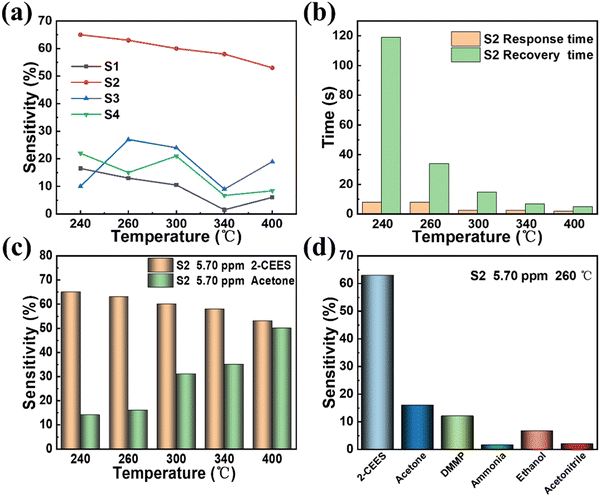 |
| | Fig. 3 Sensing performance of the WO3/graphite sensor. (a) Optimization of the amount of WO3 dopant and operating temperature. (b) Response time and recovery time of the WO3/graphite (S2) sensor toward 5.70 ppm 2-CEES at different temperatures. (c) The sensing responses of the WO3/graphite (S2) sensor toward 5.70 ppm of 2-CEES and acetone gas at different temperatures. (d) The sensing responses of WO3/graphite (S2) sensor toward 5.70 ppm of 2-CEES and other gases (acetone, DMMP, ammonia, ethanol, and acetonitrile) at an operating temperature of 260 °C. | |
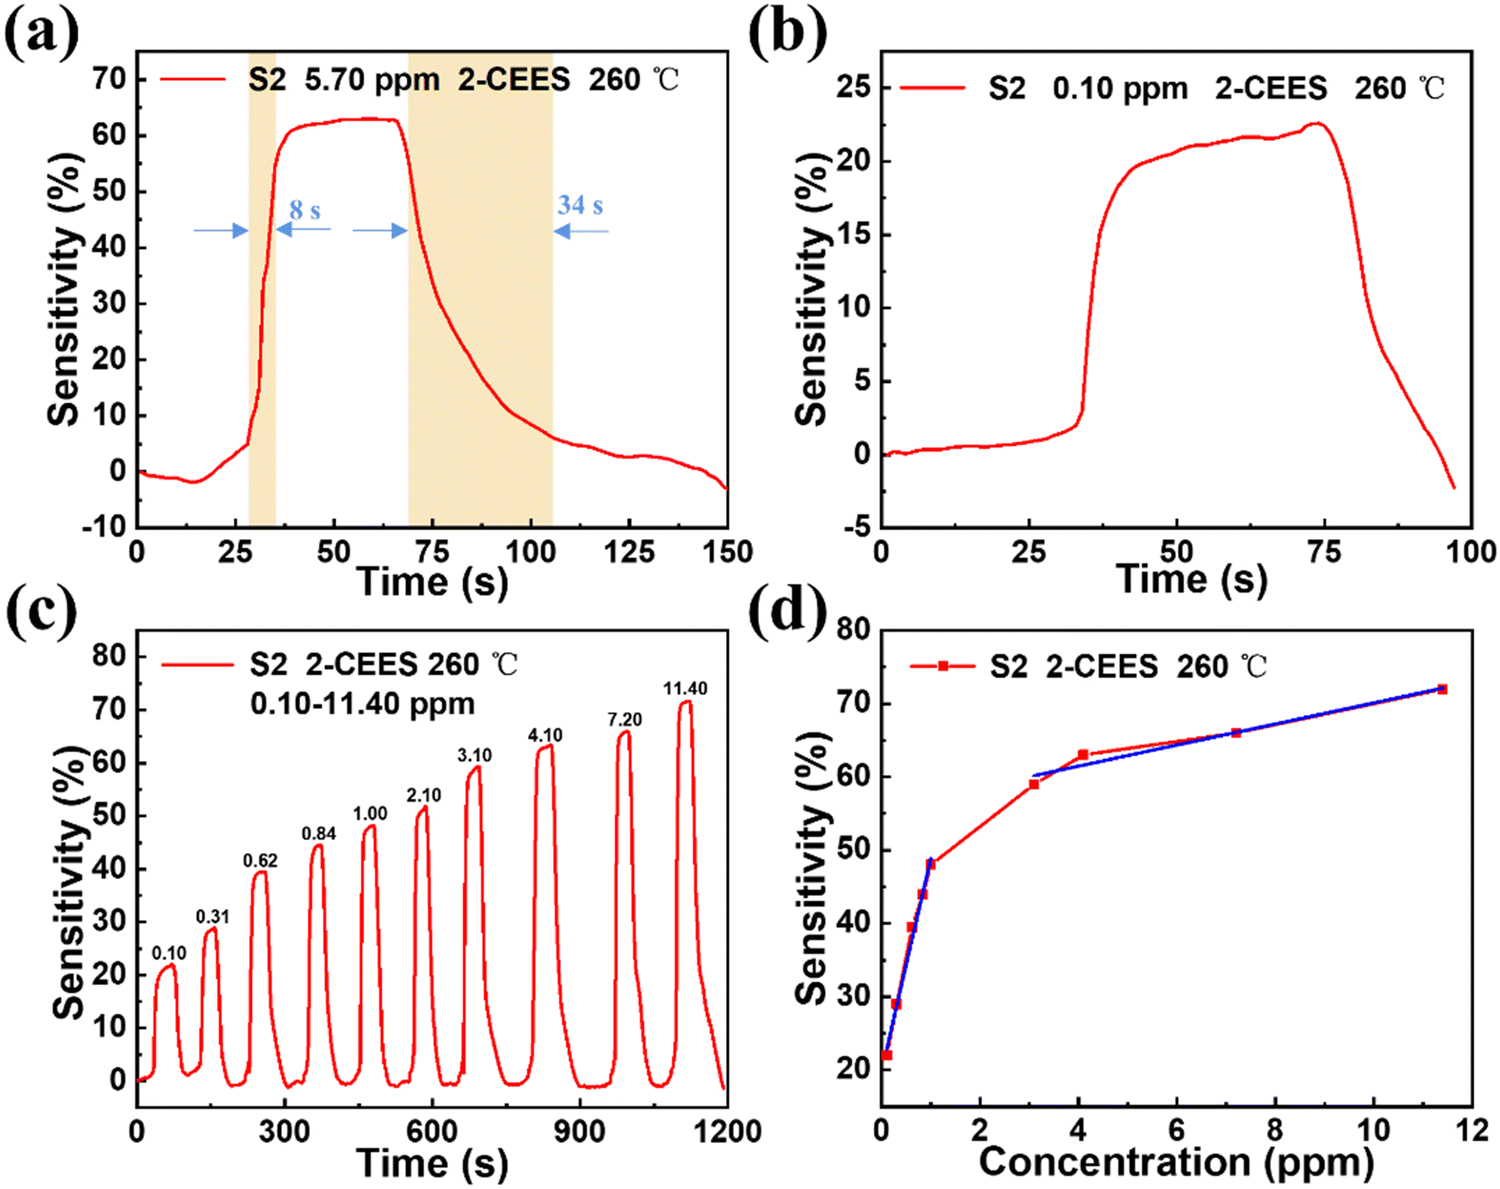
Fig. 4a displays the response time and recovery time of the S2 sensor toward 2-CEES gas with a concentration of 5.70 ppm at an operating temperature of 260 °C. It can be seen that the response time and recovery time are 8 s and 34 s, respectively. As shown in Fig. 4b, the S2 sensor can detect the 2-CEES gas with a tiny concentration of 0.10 ppm. The response-recovery curves of the S2 sensor toward 0.10, 0.31, 0.62, 0.84, 1.00, 2.10, 3.10, 4.10, 7.20, and 11.40 ppm of 2-CEES gas at an operating temperature of 260 °C are presented in Fig. 4c. The response of the S2 sensor increases with the increase of 2-CEES concentration from 0.10 ppm to 4.10 ppm, and the sensitivity increases rapidly. When the concentration of 2-CEES is greater than 4.10 ppm, the response increases slowly. This shows that the S2 sensor has a wide detection range. The linear dependence relationship of the response of the S2 sensor toward different concentrations of 2-CEES gas at an operating temperature of 260 °C is shown in Fig. 4d.
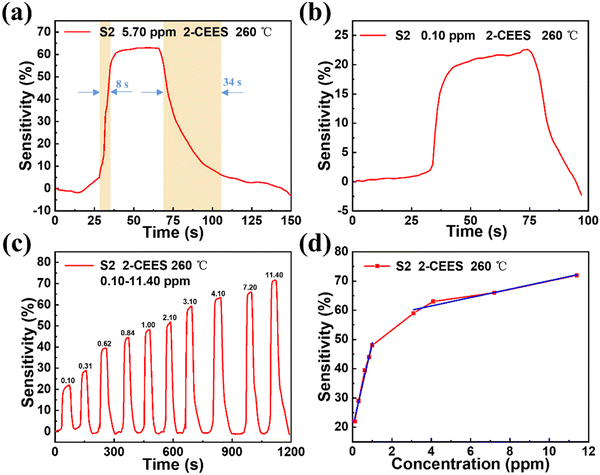 |
| | Fig. 4 Sensing performance of the WO3/graphite (S2) sensor. (a) Response time and recovery time of the WO3/graphite (S2) sensor for 5.70 ppm 2-CEES at an operating temperature of 260 °C. (b) The sensing responses of the WO3/graphite (S2) sensor toward 0.10 ppm of 2-CEES at an operating temperature of 260 °C. (c) The response-recovery curves of the WO3/graphite (S2) sensor toward 0.10, 0.31, 0.62, 0.84, 1.00, 2.10, 3.10, 4.10, 7.20 and 11.40 ppm of 2-CEES gas at an operating temperature of 260 °C. (d) The linear dependence relation of the response of the WO3/graphite (S2) sensor toward different concentrations of 2-CEES gas at an operating temperature of 260 °C. | |
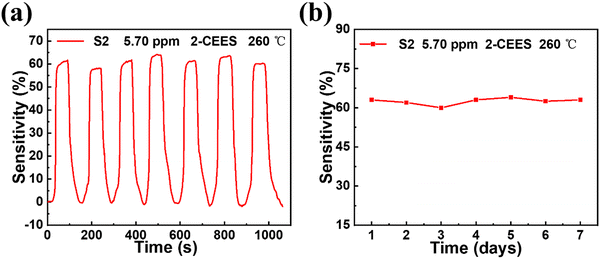
The repeatability and long-term stability of the S2 sensor were also studied, as shown in Fig. 5. The S2 sensor has good repeatability in response to 2-CEES gas with a concentration of 5.70 ppm, and the sensitivity is almost maintained at 63%, as shown in Fig. 5a. The long-term stability test of the S2 sensor for 2-CEES gas with a concentration of 5.70 ppm at an operating temperature of 260 °C is displayed in Fig. 5b. After 7 days of detection, the response of the sensor is also maintained at 63%, which illustrates the sensor has good long-term stability.
 |
| | Fig. 5 Repeatability and stability test of the WO3/graphite (S2) sensor. (a) When the operating temperature is 260 °C, the repeatability of the WO3/graphite (S2) sensor toward 5.70 ppm 2-CEES during the seven testing cycles. (b) Long term stability of the WO3/graphite (S2) sensor toward 2-CEES gas with a concentration of 5.70 ppm at an operating temperature of 260 °C. | |
According to the experiment, it can be known that the concentration of 2-CEES gas has a significant impact on the response time and recovery time of the sensor. Table 2 shows the response time and recovery time of the S2 sensor under different concentrations of 2-CEES gas with an operating temperature of 260 °C. In this experiment, when the concentration of 2-CEES gas increases, the recovery time will increase and the response time will decrease. The response time reduction rate and recovery time extension rate were 0.752 s ppm−1 and 2.478 s ppm−1, respectively. After comparing the performance of the S2 sensor with some studies on detecting 2-CEES gas (Table 3), it is found that the working temperature required by the sensor in this study is not high, which shows that the prepared gas sensor is energy efficient. At the same time, the sensor has a response time of 8 s and a recovery time of 34 s, which are lower than those of other sensors. These suggest that graphite doped WO3 is a promising material in the application of detecting 2-CEES gas.
Table 2 Response time and recovery time for 2-CEES gas with various concentrations at an operating temperature of 260 °C
| 2-CEES concentration (ppm) |
Response time (s) |
Recovery time (s) |
Sensitivity (%) |
| 0.10 |
14.5 |
15 |
22 |
| 0.84 |
10 |
25 |
44 |
| 4.10 |
9 |
33 |
63 |
| 5.70 |
8 |
34 |
62 |
| 11.40 |
6 |
43 |
72 |
Table 3 Comparison of the 2-CEES sensor performances in this research with recent studies
| Sensing material |
2-CEES (ppm) |
Temperature (°C) |
Response time (s) |
Recovery time (s) |
Ref. |
| WO3/graphite |
5.70 |
260 |
8 |
34 |
This work |
| Pt-CdSnO3 |
4 |
300 |
8 |
125 |
25
|
| Ru-CdSnO3 |
4 |
350 |
5 |
185 |
24
|
| ZnO NPs |
1 |
250 |
34 |
— |
30
|
| Al-doped ZnO NPs |
20 |
500 |
10 |
400 |
26
|
| Al-doped ZnO QDs |
20 |
450 |
3 |
406 |
14
|
| Sm2O3 doped SnO2 |
10 |
200 |
50 |
20 |
31
|
Sensing mechanism
The 2-CEES gas sensing is based on a chemiresistive process provided by the interaction of 2-CEES gas with chemisorbed oxygen on the surface of the WO3/graphite, as shown in Fig. 6. When the surface of the WO3/graphite sensor is exposed to air, oxygen molecules are physically adsorbed first. After absorbing activation energy, the physically adsorbed oxygen molecules are chemically adsorbed. Oxygen molecules attract electrons from the WO3 conduction band, forming O2−, which increases the resistance of the WO3/graphite sensor. At higher temperatures, O2− anion attracts another electron to form a 2O− anion, and the O− anion attracts another electron to form an O2− anion as follows (1)–(4):| | | O2(ads) + e− → O2−(ads) | (2) |
| | | O2−(ads) + e− → 2O−(ads) | (3) |
| | | O−(ads) + e− → O2−(ads) | (4) |
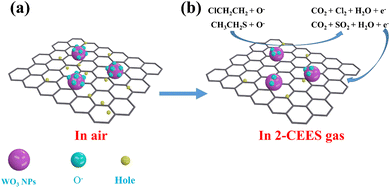 |
| | Fig. 6 Schematic diagram of the sensing mechanism of the WO3/graphite sensor toward 2-CEES gas. | |
As oxygen ions continue to diffuse outward, a depletion layer is formed. 2-CEES gas is a reducing gas. At a certain working temperature, when 2-CEES gas is introduced to the surface of the sensing material, the 2-CEES will quickly decompose into ClCH2CH2 and CH3CH2S. Due to the strong electrophilicity of Cl and S, oxygen ions will react quickly with it. Through the interaction of oxygen ions with ClCH2CH2 and CH3CH2S, respectively, the stripped electrons are released back to the conduction band of WO3 nanoparticles, that is, the electrons are released back to the depletion layer, so as to reduce the resistance of the sensor. The reaction is as follows (5) and (6):
| | | 2CICH2CH2 + 8O− → 2CO2 + CI2 + 4H2O + 8e− | (5) |
| | | 2CH3CH2S + 13O− → 2SO2 + 5H2O + 2CO2 + 13e− | (6) |
For nanocomposites containing graphite, graphite inhibits the agglomeration of WO3 nanoparticles, which increases the specific surface area of WO3 nanoparticles.28 Moreover, the porous structure of WO3/graphite is conducive to the diffusion of oxygen molecules and 2-CEES gas, which increases the surface reactive sites of the sensing material, thereby improving the performance of the sensor.29
Conclusion
In conclusion, the sensing properties of WO3/graphite nanocomposites prepared by simple blending for 2-CEES gas were studied. The results show that the sensing performance of WO3/graphite hybrid materials is better compared with pure WO3 materials, and when the WO3 mass fraction is 97%, the gas sensor exhibits the best performance. The gas sensor has a 63% response toward 5.70 ppm 2-CEES at an operating temperature of 260 °C, a rapid response/recovery time (8 s/34 s), and excellent reproducibility, long-term stability and selectivity. Based on the above results and discussions, the detection of dichlorodiethyl sulfide based on the WO3/graphite gas sensor has good development prospects.
Author contributions
C. Q., K. L. and W. Y. conceived the idea, performed the experiments and drafted the manuscript. W. Z. and Y. F. participated in the results discussion. C. X. and C. S. helped with the characterization analysis. S. W. reviewed and revised the manuscript.
Conflicts of interest
The authors declare no competing financial interest.
Acknowledgements
This work was supported by the National Natural Science Foundation of China (12004002), the Anhui Provincial Natural Science Foundation (1908085QF251, 2008085MF210), China Postdoctoral Science Foundation (2021M690996), Funds for scientific research activities of postdoctoral researchers in Anhui Province (2021B544), the Foundation for Introduction of High-Level Talents of Anhui University (S020118002/061), and the Support Project of Outstanding Young Talents in Anhui Provincial Universities (gxyqZD2018006).
References
- S. Chauhan, R. D’cruz, S. Faruqi, K. Singh, S. Varma, M. Singh and V. Karthik, Environ. Toxicol. Pharmacol., 2008, 26, 113–122 CrossRef CAS PubMed.
- K. Kim, O. G. Tsay, D. A. Atwood and D. G. Churchill, Chem. Rev., 2011, 111, 5345–5403 CrossRef CAS PubMed.
- K. Ganesan, S. Raza and R. Vijayaraghavan, J. Pharm. BioAllied Sci., 2010, 2, 166 CrossRef CAS PubMed.
- Y. Fan, K. Li, X. Ren, W. Yan, C. Zhu, Y. Zhao, W. Zeng, Z. Chen and S. Wang, J. Mater. Chem. C, 2021, 9, 17496–17503 RSC.
- C. Karnati, H. Du, H.-F. Ji, X. Xu, Y. Lvov, A. Mulchandani, P. Mulchandani and W. Chen, Biosens. Bioelectron., 2007, 22, 2636–2642 CrossRef CAS PubMed.
- R. C. Thomas, H. C. Yang, C. R. DiRubio, A. J. Ricco and R. M. Crooks, Langmuir, 1996, 12, 2239–2246 CrossRef CAS.
- R. A. McGill, V. K. Nguyen, R. Chung, R. E. Shaffer, D. DiLella, J. L. Stepnowski, T. E. Mlsna, D. L. Venezky and D. Dominguez, Sens. Actuators, B, 2000, 65, 10–13 CrossRef CAS.
- D. D. Dominguez, R. Chung, V. Nguyen, D. Tevault and R. A. McGill, Sens. Actuators, B, 1998, 53, 186–190 CrossRef CAS.
-
G. M. Milner, 2005.
- C. Zimmermann, P. Mazein, D. Rebiere, C. Dejous, J. Pistre and R. Planade, IEEE Sens. J., 2004, 4, 479–488 CrossRef CAS.
- W. P. Carey and B. R. Kowalski, Anal. Chem., 1986, 58, 3077–3084 CrossRef CAS.
- O. S. Milanko, S. A. Milinković and L. V. Rajaković, Anal. Chim. Acta, 1992, 269, 289–300 CrossRef CAS.
- S.-W. Zhang and T. M. Swager, J. Am. Chem. Soc., 2003, 125, 3420–3421 CrossRef CAS PubMed.
- J. H. Lee, H. Jung, R. Yoo, Y. Park, H.-S. Lee, Y.-S. Choe and W. Lee, Sens. Actuators, B, 2019, 284, 444–450 CrossRef CAS.
- S. M. Kanan, A. Waghe, B. L. Jensen and C. P. Tripp, Talanta, 2007, 72, 401–407 CrossRef CAS PubMed.
- D. C. Meier, C. J. Taylor, R. E. Cavicchi, M. Ellzy, K. Sumpter and S. Semancik, IEEE Sens. J., 2005, 5, 712–725 CAS.
- Y. Hu, T. Li, J. Zhang, J. Guo, W. Wang and D. Zhang, Sens. Actuators, B, 2022, 352, 130912 CrossRef CAS.
- D. Zhang, Y. Cao, J. Wu and X. Zhang, Appl. Surf. Sci., 2020, 503, 144063 CrossRef CAS.
- D. Wang, D. Zhang, J. Guo, Y. Hu, Y. Yang, T. Sun, H. Zhang and X. Liu, Nano Energy, 2021, 89, 106410 CrossRef CAS.
- S. Yu, D. Zhang, Y. Zhang, W. Pan, B. E. Meteku, F. Zhang and J. Zeng, Nanoscale, 2020, 12, 18815–18825 RSC.
- D. Zhang, Z. Yang, S. Yu, Q. Mi and Q. Pan, Coord. Chem. Rev., 2020, 413, 213272 CrossRef CAS.
- D. Zhang, Y. Cao, Z. Yang and J. Wu, ACS Appl. Mater. Interfaces, 2020, 12, 11979–11989 CrossRef CAS PubMed.
- Y. H. Park, H.-K. Song, C.-S. Lee and J.-G. Jee, J. Ind. Eng. Chem., 2008, 14, 818–823 CrossRef CAS.
- L. Patil, V. Deo, M. Shinde, A. Bari, D. Patil and M. Kaushik, Sens. Actuators, B, 2014, 191, 130–136 CrossRef CAS.
- L. Patil, V. Deo, M. Shinde, A. Bari and M. Kaushik, Sens. Actuators, B, 2011, 160, 234–243 CrossRef CAS.
- R. Yoo, D. Lee, S. Cho and W. Lee, Sens. Actuators, B, 2018, 254, 1242–1248 CrossRef CAS.
- R. Mishra, S. Upadhyay, A. Kushwaha, T.-H. Kim, G. Murali, R. Verma, M. Srivastava, J. Singh, P. Sahay and S. H. Lee, Nanoscale, 2015, 7, 11971–11979 RSC.
- A. Singh, A. Sharma, M. Tomar and V. Gupta, Sens. Actuators, B, 2017, 245, 590–598 CrossRef CAS.
- C. A. Zito, T. M. Perfecto and D. P. Volanti, Sens. Actuators, B, 2017, 244, 466–474 CrossRef CAS.
- R. Yoo, C. Oh, M.-J. Song, S. Cho and W. Lee, J. Nanosci. Nanotechnol., 2018, 18, 1232–1236 CrossRef CAS PubMed.
- H. M. Aliha, A. A. Khodadadi and Y. Mortazavi, Sens. Actuators, B, 2013, 181, 637–643 CrossRef CAS.
|
| This journal is © The Royal Society of Chemistry 2022 |
Click here to see how this site uses Cookies. View our privacy policy here. 
 Open Access Article
 This Open Access Article is licensed under a Creative Commons Attribution-Non Commercial 3.0 Unported Licence
 ab and
Siliang
Wang
ab and
Siliang
Wang
 , where C (ppm) is the target gas concentration, ρ (g mL−1) is the density of the liquid, φ is the required gas volume fraction, V1 (μL) is the volume of liquid, V2 (L) is the volume of the chamber, and M (g mol−1) is the molecular weight of the liquid. The resistance change is displayed in real time through the software on the computer. The sensor sensitivity formula is defined as S (%) = (Ra − Rg)/Ra × 100, where Ra and Rg are the resistances in the air and in the test gas atmosphere, respectively. Gas response time and recovery time are defined as the time required for 90% of the total resistance change.