 Open Access Article
Creative Commons Attribution 3.0 Unported Licence
Anisotropy of thermal transport in phosphorene: a comparative first-principles study using different exchange–correlation functionals†
Fa
Zhang
 ab,
Xiong
Zheng
b,
Huimin
Wang
 c,
Liang
Ding
*a and
Guangzhao
Qin
 *b
*b
aState Key Laboratory of Robotics and System, Harbin Institute of Technology, Harbin, 150001, People's Republic of China. E-mail: liangding@hit.edu.cn
bState Key Laboratory of Advanced Design and Manufacturing for Vehicle Body, College of Mechanical and Vehicle Engineering, Hunan University, 410082, Changsha, P. R. China. E-mail: gzqin@hnu.edu.cn
cHunan Key Laboratory for Micro-Nano Energy Materials & Device and School of Physics and Optoelectronics, Xiangtan University, Xiangtan, 411105, Hunan, China
First published on 10th May 2022
Abstract
Phosphorene, as a new type of two-dimensional (2D) semiconductor material, possesses unique physical and chemical properties, and thus has attracted widespread attention in recent years. With its increasing applications in nano/optoelectronics and thermoelectrics, a comprehensive study of its thermal transport properties is necessary. It has been concluded from previous studies that there exist vast differences and uncertainties in the theoretically predicted thermal conductivity, which is generally attributed to the selection of an XC functional. However, there is no comprehensive investigation on this issue. In this study, based on first-principles calculations using 12 different exchange–correlation (XC) functionals, the phonon transport properties of phosphorene are systematically studied by solving the Boltzmann transport equation (BTE). The results show noticeable differences in the phonon transport properties of phosphorene under different XC functionals. For instance, the thermal conductivity of phosphorene along the zigzag direction ranges from 0.51 to 30.48 W m−1 K−1, and that along the armchair direction ranges from 0.15 to 5.24 W m−1 K−1. Moreover, the anisotropy of thermal conductivity is between 3.4 and 6.9, which fundamentally originates from the special hinge-like structure. This study conducts an in-depth analysis of phonon transport to reveal the effect and mechanism of different XC functionals in predicting the thermal transport properties, which would provide a reference for future research on phosphorene and other novel materials.
1. Introduction
Since the discovery of graphene in 2004, two-dimensional (2D) materials have come into view.1 The low-dimensional systems are making breakthroughs on the basis of the concept of graphene, which represents a new class of atomically thick materials.2 In recent years, 2D black phosphorene has attracted more and more attention with the development of science and technology.3 Black phosphorus is a layered material in which individual atomic layers are stacked together by van der Waals interactions, just like graphite.4 However, a single layer of black phosphorus (phosphorene) is a semiconductor with a direct bandgap, which is different from graphene with a Dirac cone.5,6 Each phosphorus atom is covalently bonded to three adjacent phosphorus atoms, forming a folded honeycomb structure.5–7 Furthermore, phosphorene has exceptionally high hole mobility (∼10![[thin space (1/6-em)]](https://www.rsc.org/images/entities/char_2009.gif) 000 cm2 V−1 s−1) and unusual elastic properties, which make phosphorene a promising candidate for application in field-effect transistors.8 Besides, phosphorene is considered a potential thermoelectric material, which possesses high electrical conductivity and low thermal conductivity.9 And it was found that the anisotropies of phosphorene's electrical and thermal transport are orthogonal to each other, largely benefiting the thermoelectric performance.10,11 Generally speaking, the thermoelectric performance and efficiency can be characterized by ZT = S2σT/κ.12 The maximum electrical conductivity (σ) and the minimum thermal conductivity (κ) can be obtained simultaneously, thereby obtaining the maximum ZT value.13–20 Considering the potential value of phosphorene in the applications of nanoelectronics and thermoelectrics, comprehensive studies on its thermal transport properties, especially the characteristics of anisotropy, are in demand.
000 cm2 V−1 s−1) and unusual elastic properties, which make phosphorene a promising candidate for application in field-effect transistors.8 Besides, phosphorene is considered a potential thermoelectric material, which possesses high electrical conductivity and low thermal conductivity.9 And it was found that the anisotropies of phosphorene's electrical and thermal transport are orthogonal to each other, largely benefiting the thermoelectric performance.10,11 Generally speaking, the thermoelectric performance and efficiency can be characterized by ZT = S2σT/κ.12 The maximum electrical conductivity (σ) and the minimum thermal conductivity (κ) can be obtained simultaneously, thereby obtaining the maximum ZT value.13–20 Considering the potential value of phosphorene in the applications of nanoelectronics and thermoelectrics, comprehensive studies on its thermal transport properties, especially the characteristics of anisotropy, are in demand.
The thermal transport properties play a vital role in lots of applications as mentioned above. Although the thermal conductivity of phosphorene and bulk phosphorus has been experimentally characterized well, the thickness of the phosphorene samples for measuring thermal conductivity is too large to reach the ideal state due to the limitation of synthesis technology.21,22 Thus, in addition to experimental measurements, researchers tend towards the theoretical prediction of the thermal conductivity of phosphorene and the exploration of phonon transport properties.23–26 The thermal conductivity of phosphorene is still ambiguous even if there are a number of studies in the literature. There are a few possible reasons for this ambiguity. First, different empirical potentials or force fields are fitted following different procedures and are used to describe the interatomic interaction in classical molecular dynamics (MD) simulations, which have a significant effect on the results. Second, lots of pseudopotentials and exchange–correlation (XC) functionals are employed in the first-principles calculations, which are constructed in different frames, such as the local density approximation (LDA) and the generalized gradient approximation (GGA). The different pseudopotentials and XC functionals have a significant effect on the evaluation of thermal conductivity. For instance, XC functional groups affect the optimization of the crystal structure and the lattice constant, which have a decisive influence on the lattice vibration and heat transfer performance.27 In previous studies, researchers have found a vast difference in the thermal conductivity of single-layer phosphorene. Specifically, the thermal conductivity of phosphorene along the zigzag direction is between 15.33 and 152.7 W m−1 K−1, and the thermal conductivity in the armchair direction is between 4.59 and 63.9 W m−1 K−1.28,29 Previous studies attributed the large uncertainty of thermal conductivity of phosphorene to the selection of XC functionals. Even though the selection of functional groups in the first-principles calculations is particularly essential for accurately predicting the thermal conductivity of phosphorene, there is no comprehensive investigation on this issue. It is well known that black phosphorene is entirely different from planar graphene and the flexural silicene crystal structure.27,30–32 2D phosphorene has a hinge-like structure and is folded along the armchair direction. The hinge-like structure leads to different atomic arrangement periods and different degrees of density in different directions, which results in the fantastic anisotropy in the thermal transport properties of phosphorene. Thus, the goal of this study is to systematically investigate the effects of different XC functionals on the thermal conductivity of phosphorene.
In this study, the thermal transport properties of phosphorene are quantitatively studied by solving the phonon Boltzmann transport equation (BTE) based on first-principles calculations using different exchange–correlation (XC) functionals. The results show that the anisotropy in the thermal transport process of phosphorene exhibits significant differences with different XC functionals. Moreover, the thermal conductivity in the zigzag direction ranges from 0.51 to 30.48 W m−1 K−1 and the thermal conductivity in the armchair direction is between 0.15 and 5.24 W m−1 K−1. An in-depth study on phonon behavior is conducted to analyze the mechanism underlying the anisotropy of thermal transport in phosphorene. The results achieved in this study provide a valuable reference for the accurate quantitative calculation of the thermal conductivity of phosphorene and future research on other novel materials, which is of considerable significance to nano-engineering applications.
2. Computational details
All the first-principles calculations are performed based on density functional theory (DFT) using the Vienna ab initio simulation software package (VASP).33 For the structure optimization and following DFT calculations of phosphorene, different poeudopotentials34,35 and XC functionals in the LDA and GGA are employed: LDA,36 Perdew–Burke–Ernzerhof (PBE),37 revised PBE (rPBE),38 PBE revised for solids (PBEsol),39 Perdew–Wang 91 (PW91),40 ultrasoft pseudopotential GGA (USPP_GGA), ultrasoft pseudopotential LDA (USPP_LDA),41 the “opt” functionals (optB88, optB86b, and optPBE),42,43 the vdW_DF2 and the vdW_DF22.44Based on the full convergence test, the cut-off values of the kinetic energy of the wave function are set to 700 and 450 eV for PAW and ultrasoft (USPP_GGA and USPP_LDA) pseudopotentials, respectively. A Monkhorst–Pack k-mesh of 15 × 11 × 1 is used to sample the Brillouin Zone (BZ), and the energy convergence threshold is set to 10−8 eV. In order to prevent the interaction caused by periodic boundary conditions, a vacuum layer of 20 Å is used along the out-of-plane direction. To completely optimize the shape and volume of the unit cell, all the atoms have been relaxed until the maximum Hellmann–Feynman force acting on each atom is not higher than 10−8 eV Å−1.
Before calculating the second-order and third-order interatomic force constants, the unit cell needs to be expanded to predict the dynamics of the lattice accurately. By judging the convergence of phonon dispersion, the supercell size of phosphorene is chosen as 6 × 6 × 1. For the calculation of all IFCs in phosphorene, space group symmetry is used to reduce the calculation cost and the numerical noise of IFCs.45 The cut-off distance (rcutoff) is thoroughly tested in the anharmonic IFC calculations, and the specific results can be obtained from the analysis and discussion. A detailed discussion on convergence will be presented later based on Fig. 2 and the ESI.† The use of the Lagrangian multiplier method46,47 strengthens the translation and rotation invariance of IFCs. Based on the density functional perturbation theory (DFPT), the dielectric constant (given in Table 1) is obtained. κ is obtained by using an iterative process to solve the linearized phonon BTE based on force constants, which is implemented in the ShengBTE package.27,46
| XC | Direction | Lattice constant | κ | Dielectric constant | MFP | Grüneisen parameter | Heat capacity (105 J m−3 K−1) | Phase space (10−3 a.u.) | A1 = A2 | A3 | B1 = B2 |
|---|---|---|---|---|---|---|---|---|---|---|---|
| (Å) | (W m−1 K−1) | (nm) | (Å) | ||||||||
| LDA | Zigzag | 3.267 | 4.93 | 4.373 | 2.943 | 1.281 | 18.094 | 3.299 | 2.199 | 2.225 | 3.324 |
| Armchair | 4.367 | 1.02 | 8.864 | 1.756 | |||||||
| PBE | Zigzag | 3.298 | 14.89 | 3.971 | 11.538 | 0.716 | 17.044 | 3.642 | 2.220 | 2.259 | 3.545 |
| Armchair | 4.625 | 2.42 | 5.261 | 4.419 | |||||||
| rPBE | Zigzag | 3.313 | 11.81 | 3.834 | 7.976 | 0.391 | 16.569 | 3.763 | 2.228 | 2.273 | 3.66 |
| Armchair | 4.753 | 2.31 | 4.652 | 3.955 | |||||||
| PBEsol | Zigzag | 3.282 | 5.91 | 4.267 | 4.104 | 1.603 | 17.769 | 3.369 | 2.228 | 2.272 | 3.66 |
| Armchair | 4.436 | 1.06 | 7.025 | 2.035 | |||||||
| PW91 | Zigzag | 3.304 | 7.22 | 3.965 | 4.585 | 0.502 | 17.039 | 3.668 | 2.234 | 2.262 | 3.545 |
| Armchair | 4.625 | 1.62 | 5.223 | 2.448 | |||||||
| USPP_GGA | Zigzag | 3.301 | 0.51 | 3.951 | 0.298 | 2.251 | 17.084 | 3.677 | 2.220 | 2.260 | 3.548 |
| Armchair | 4.626 | 0.15 | 5.249 | 0.192 | |||||||
| USPP_LDA | Zigzag | 3.264 | 5.81 | 4.346 | 3.541 | 0.209 | 18.123 | 3.338 | 2.196 | 2.224 | 3.329 |
| Armchair | 4.371 | 1.59 | 8.828 | 2.274 | |||||||
| optB88 | Zigzag | 3.322 | 30.48 | 3.961 | 21.611 | 0.332 | 17.185 | 3.612 | 2.235 | 2.275 | 3.503 |
| Armchair | 4.580 | 5.11 | 5.440 | 8.276 | |||||||
| optB86b | Zigzag | 3.304 | 15.93 | 4.077 | 10.717 | 0.179 | 17.476 | 3.458 | 2.263 | 2.259 | 3.438 |
| Armchair | 4.506 | 3.26 | 6.063 | 3.314 | |||||||
| optPBE | Zigzag | 3.323 | 23.19 | 3.904 | 17.968 | 0.938 | 17.017 | 3.722 | 2.236 | 2.278 | 3.545 |
| Armchair | 4.627 | 5.24 | 5.164 | 7.409 | |||||||
| vdW_DF2 | Zigzag | 3.378 | 14.56 | 3.771 | 10.328 | 0.074 | 16.443 | 4.156 | 2.263 | 2.321 | 3.685 |
| Armchair | 4.782 | 2.41 | 4.589 | 4.104 | |||||||
| vdW_DF22 | Zigzag | 3.378 | 13.67 | 3.771 | 9.246 | 0.868 | 16.445 | 4.189 | 2.263 | 2.321 | 3.685 |
| Armchair | 4.782 | 1.98 | 4.589 | 3.673 | |||||||
3. Results and discussion
Based on the optimized structure, the phonon dispersion map is calculated using Phonopy as shown in Fig. 1, where the results calculated using different XC functionals are collected together for comparison. There is no imaginary frequency in all the optimized structures, which means the structures are dynamically stable. Therefore, in the following discussions, we will compare and discuss the thermal transport properties of phosphorene calculated using 12 different kinds of XC functionals. Because only the Raman scattering curve of bulk black phosphorus can be obtained from previous experiments, we only present the comparison of the optical phonon branches at the Γ point in Fig. 1. It can be clearly seen that the FA phonon branch calculated using the LDA functional based on the super-soft pseudopotential shows an apparent softening phenomenon. The rest of the XC functionals are consistent for the acoustic phonon modes. However, the main difference occurs in the optical phonon modes, which can be compared based on the frequency of the A1g, A2g, and B2g phonon branches at the BZ center (Γ point). According to the experimental measurement, the frequency is between 359.51 and 368.21 cm−1 for A1g, 439. 61 and 443.03 cm−1 for A2g, and 465.85 and 473.43 cm−1 for B2g. The corresponding points are marked in Fig. 1. All the calculations agree very well with the experiments except the optical mode of vdW_DF2/vdW_DF22, which is significantly lower than the experimental values.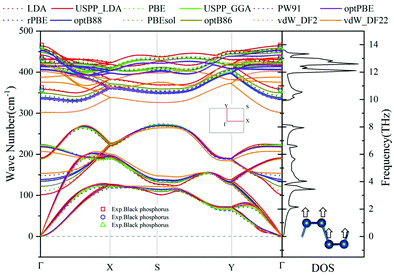 | ||
| Fig. 1 Comparison of the phonon dispersions of 2D black phosphorene calculated using different XC functionals. The experimentally measured data of bulk black phosphorus26,27,48 are also plotted. The drawn phonon density of states (DOS) is calculated using the optB86b functional. Inset: the IBZ and the side view of phosphorene where arrows mark the vibration mode of the FA phonon branch. | ||
According to phonon spectrum analysis from Fig. 1, the phonon modes below the band gap play a decisive role in the thermal transport. Moreover, these modes dominate the anisotropy of heat transfer. Readers can see the detailed discussion presented in Fig. 3.
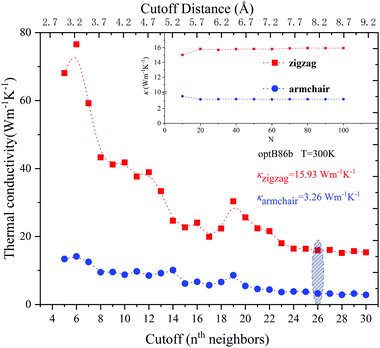
In the past few years, first-principles calculations combined with BTE methods have been recognized as good methods to predict the heat transport properties of materials. However, there are still some factors that can affect the final calculation results. One of the important factors is the cut-off radius of the third-order force constant and the convergence of the Q-mesh division; in order to obtain accurate thermal conductivity prediction results, they should be carefully judged. As shown in Fig. 2 and Fig. S1 (ESI†), under the condition that the phonon–phonon scattering caused by anharmonicity is fully respected, we have performed the close truncation and Q-grid convergence tests on all 12 XC functionals.
The results show that for all XC functionals, the thermal conductivity of black phosphorene has a good convergence. According to the judgment of convergence, the cut-off radius for different XC functionals is as follows: USPP_LDA (7.3 Å), optB86/LDA (7.7 Å), USPP_GGA/optPBE (8.0 Å), and other XC functionals (8.2 Å). Besides, for the convenience of comparison, all XC functional Q grids are selected as 100 × 100 × 1.
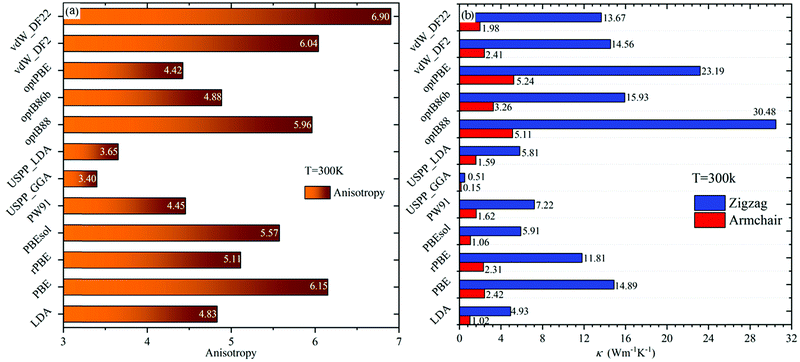
It can be seen from Fig. 3(a and b) that there are differences in the predicted values of thermal conductivity using different functionals. However, common conclusions on the properties of thermal transport in phosphorene can be achieved. For instance, the thermal conductivity of single-layer phosphorene is lower in both the zigzag direction and the armchair direction, both of which are two orders of magnitude lower than the thermal conductivity of graphene (3000–5000 W m−1 K−1).33,47,48 The reason lies in the fact that the FA phonon mode contributes less to the two thermal conductivities in black phosphorene. Thus, the scattering rate of the FA phonon branch in phosphorene is very high, resulting in a small contribution of FA to the thermal conductivity.
From Fig. 3(a), it can be seen that the transport of phosphorene has a strong anisotropy. Previous results showed that the thermal conductivity of phosphorene along the zigzag direction is larger than that along the armchair direction, and the ratio ranges from 2.2 to 5.5.27 The anisotropy ratio calculated using vdW_DF2, vdW_DF22, optB88 (considering the vdW interaction), and PBE (without considering the vdW interaction) is higher than the value interval previously reported. It can be seen that although the prediction of thermal conductivity is larger when considering the vdW interactions, it has little effect on anisotropy.
In addition to the anisotropy, Fig. 3(b) shows that the thermal conductivity calculated using the “opt” functionals (optB88, optB86b, and optPBE) and the “vdW” functionals (vdW_DF2 and vdW_DF22) is higher. The reason may lie in the inclusion of van der Waals (vdW) interactions in the XC functionals. Due to the special hinge structure of the monolayer phosphorene, lots of adjacent P atoms do not form bonds, but there are still some interactions. These effects can be captured using the XC functionals including vdW interactions, which have a significant impact on the properties of bulk BP and phosphorene. Thus, the vdW interaction will disrupt the formation of resonance bonds by changing the lattice constant, especially the distance between the non-covalent bond P atoms, leading to long-range interactions. With the above discussions, it is understood that the thermal conductivity calculated from the “opt” functionals and “vdW” functionals is higher under the same cut-off radius.
The anisotropy of thermal conductivity is attributed to the anisotropy of phonon group velocity determined by phonon dispersion.23,49,50 As shown in Fig. 1, the thermal conductivity along the armchair direction of black phosphorene is mainly contributed by the LA phonon mode. For the thermal conductivity along the zigzag direction, TA/FA participates in addition to the contribution of the LA phonon modes, and the contribution of FA is more significant than that along the armchair direction. The reason is that the unique hinge structure of phosphorene causes the “uneven” effect in the armchair direction, which leads to the difference in the phonon mode in the two directions, and finally causes the thermal conductivity anisotropy.
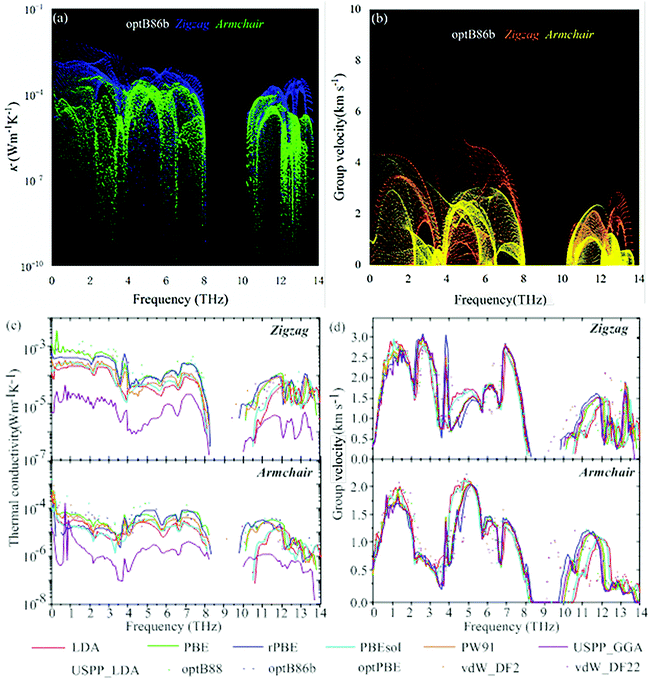
To observe the anisotropy in the heat transport process of phosphorene more intuitively, the modal contribution is further examined as shown in Fig. 4(a and b). The XC functional used here is the representative optB86b. Fig. 4(a) clearly shows that the acoustic phonon branch is the main contributor to the thermal conductivity of phosphorene. Fig. 4(b) shows that the phonon group velocity in the zigzag direction in the acoustic phonon branch is significantly higher than in the armchair direction. In the ESI,† we have given the relationship among the phonon frequency of the other 11 functionals, the thermal conductivity, and group velocity.
Fig. 4(c and d) show the influence of different XC functionals on thermal conductivity and group velocity. In Fig. 4(c), the thermal conductivity of USPP_GGA in both zigzag and armchair directions is abnormally low. This is consistent with the result reflected in Fig. 3(a). It is worth noting that although Fig. 1 shows that the phonon spectrum using USPP_GGA has no imaginary frequency indicating the thermodynamic stability, this does not mean that USPP_GGA can accurately predict the thermal conductivity of the materials. The reason may be that the features of USPP and GGA are not compatible. Therefore, we suggest that the use of USPP_GGA functional groups should be avoided when calculating the thermal transport properties of black phosphorene. From the group velocities shown in Fig. 4(d), it can be observed that the group velocities of the acoustic phonon branches of vdW_DF2 and vdW_DF22 in the armchair direction are smaller than those of all other functionals, and the zigzag direction is more significant compared to that in other functionals. This makes the thermal conductivity calculated from vdW_DF2 and vdW_DF22 in the armchair direction small, and the thermal conductivity in the zigzag direction is relatively large. Therefore, the thermal conductivity anisotropy ratio of these two XC functionals is higher than those of all other functionals.
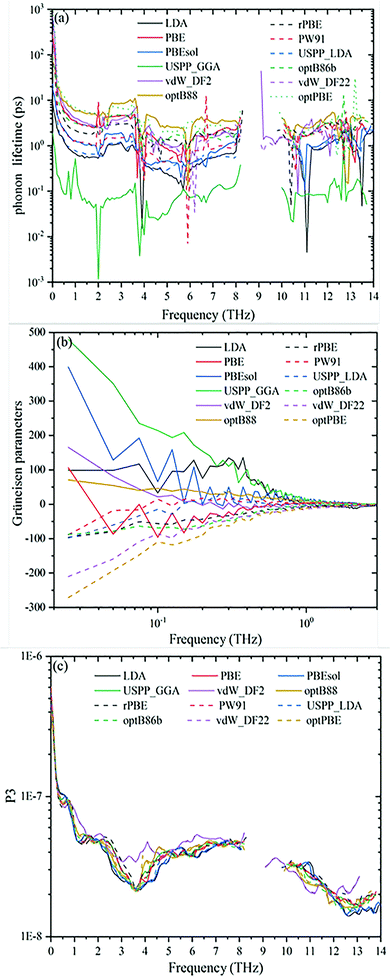
The understanding of thermal conductivity can be deepened through the analysis of phonon lifetime. The phonon lifetime predicted by optPBE and optB88 is higher than those predicted using the rest of the XC functionals. This is the reason for the high thermal conductivity obtained using optPBE and optB88. As we all know, the thermal conductivity of micro–nano materials is affected by three factors, which are specific heat capacity (Cv), group velocity (v), and phonon lifetime (t).51 Among them, the specific heat capacity and group velocity are wholly affected by the harmonic characteristics, while the phonon lifetime is affected by the scattering phase space and scattering intensity. In Table 1 and Fig. 5(c), we can see that the scattering phase space is similar. Now it is imperative to consider the scattering intensity, that is, the phonon anharmonicity quantified by the Grüneisen parameter.
Fig. 5(b) shows the comparison of Grüneisen parameters after using different XC functionals. As can be seen in Fig. 5(b), the Grüneisen parameters from optB88 are relatively small at 300 K, which results in the thermal conductivity of black phosphorene from optB88 being significantly higher than those from other functionals. LDA, PBEsol, and USPP_GGA have larger parameter values, which cause a smaller thermal conductivity using these XC functionals. One thing that should be noted is that the thermal conductivity is derived from the coupling of three factors, that is to say, the smaller the Grüneisen parameter, the longer the phonon lifetime obtained using different functionals in phosphorene, but it has not necessarily resulted in higher thermal conductivity. Table 1 shows that the total Grüneisen parameter of optB86b is the smallest, but the thermal conductivity obtained at 300 K is not the largest.
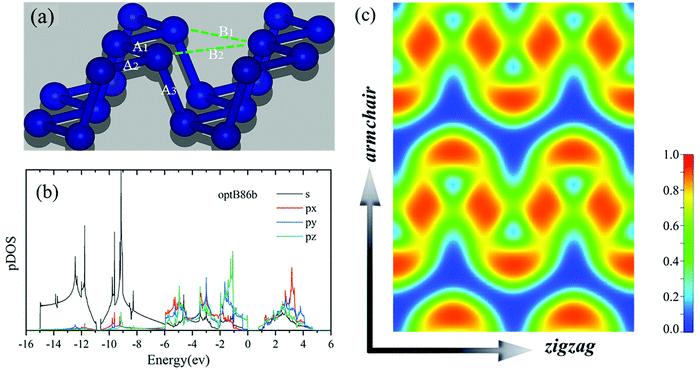
Phosphorene has a hinge-like structure, as shown in Fig. 6(a), and its wrinkled structure can actually be seen as a deformation of a two-dimensional planar structure.27 Each P atom has five bonds formed. However, since the sp-hybridization in phosphorene is weak,53 only three p electrons can be used for bonding, which leads to unsaturated covalent bonding in phosphorene. Therefore, the true bond state in phosphorene is the hybridization or resonance between the different electronic configurations where the electrons occupy the p orbital. In fact, compared with the resonance bonding of the conventional rock salt structure, the resonance bonding in phosphorene exists in a weakened form.54 This is due to the structural deformation of the perfect rock salt structure of the phosphorene hinge-like structure. However, the weakened resonance bond still has a non-negligible effect on the phonon transport properties of phosphorene. The stronger the resonance bond is, the lower the thermal conductivity is.53 As shown in Fig. 6(a), due to the deformation, the first nearest neighbor distances in phosphorene are A1 and A2, and the second nearest neighbor distance is A3. As shown in Table 1, the optimized structure of USPP_LDA has the smallest first and second nearest neighbor distance (A1 = A2 = 2.196 Å, and A3 = 2.224 Å). Therefore, the resonant bonding is further enhanced in USPP_LDA. This structural deformation further enhances long-distance interaction, which makes the thermal conductivity calculated by the USPP_LDA XC functional become lower.
The armchair and zigzag directions show significantly different bonding characteristics. This is another explanation for the anisotropy of thermal conductivity. The electron (s, px, py, and pz) orbital projection density of states (pDOS) is shown in Fig. 6(b). From the calculated results, it can be seen that the bonding state near the VBM is mainly controlled by the pz orbitals hybridized with the px and py orbitals. The s orbital is mainly restricted to around 9 eV below the VBM, showing a weak hybridization relationship with the px, py and pz orbitals.
Fig. 6(c) shows the in-plane electron density of phosphorene. Anisotropic behavior can also be understood from the basic point of view of atomic bonds. In order to depict the probability of occurrence of an electron pair, we plot the ELF of phosphorene in Fig. 6(c).10,52 The ELF shows the position and size of the bond and lone pair electrons. The ELF ranges from 0 to 1, where 0 means no electrons, and 1 means the position with the greatest degree of electronic localization. The ELF of phosphorene along the zigzag direction is greater than 0.5, which means that the electrons are localized. For the armchair direction, the ELF is less than 0.5, which means that the electrons are delocalized. The ELFs along the two directions show great differences for phosphorene, which is the physical reason for the anisotropy of a series of elements with a hinge-like structure.
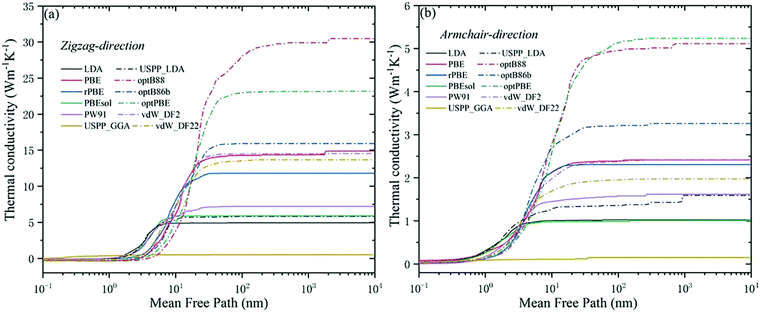 | ||
| Fig. 7 The cumulative thermal conductivity of phosphorene along (a) zigzag and (b) armchair directions with respect to the phonon MFP for different XC functionals at 300 K. | ||
The size of the nanostructure is smaller than the feature size, which can effectively control the thermal conductivity. So, the measurement of the MFP is an essential consideration in the thermal design of the nanostructure. Fig. 7 plots the cumulative thermal conductivity (k) of the phonon free path in the zigzag direction and armchair direction at 300 K. Comparing Fig. 7(a and b), when the size is 1 × 10⁴ nm, all the phosphorene κ values calculated using the XC functionals converged. On the whole, due to the anisotropy of black phosphorene, the MFP in the zigzag direction is more substantial, which causes the zigzag direction κ to increase more drastically with the MFP. In order to understand ballistics and phonon transport better, Table 1 lists the MFP when k is 50%. For most XC functionals, the MFP in the zigzag direction is between 2 and 10 nm, and the MFP in the armchair direction is between 2 and 4 nm. After comparison, the MFP calculated using optPBE, optB88 and PBE is higher than the average value. The MFP obtained by LDA functional calculation is much smaller than the average value.
4. Conclusions
In summary, 12 different XC functionals combined with super soft potentials or PAW pseudopotentials were used to study the thermal transport properties of black phosphorene based on first-principles calculations. The thermal transport properties of phosphorene show distinct differences with different XC functionals. The results show that with different XC functional groups, the thermal conductivity of phosphorene in the zigzag direction is between 0.51 and 30.48 W m−1 K−1, and the thermal conductivity in the armchair direction is between 0.15 and 5.24 W m−1 K−1. Specifically, the XC functionals considering the interaction of vdW can achieve higher thermal conductivity. The difference lies in the lifetime of the low-frequency phonon mode near the center of BZ. Moreover, for different XC functionals, the ratio of anisotropy of thermal conductivity is between 3.40 and 6.90. Among them, vdW_DF2, vdW_DF22, and PBE predict higher anisotropy. This shows that the vdW interaction is not the main factor directly affecting the anisotropy. Just like the thermal conductivity calculated using the USPP_LDA functional, the strengthening of the resonance bond will cause the thermal conductivity to decrease. In this work, a comprehensive study of the thermal transport properties of black phosphorene with different XC functional groups is carried out, which provides a reference for future research on phosphorene and other new materials.Conflicts of interest
The authors declared that there is no conflict of interest.Acknowledgements
G. Q. is supported by the National Natural Science Foundation of China (Grant No. 52006057), the Fundamental Research Funds for the Central Universities (Grant No. 531119200237 and 541109010001), and the State Key Laboratory of Advanced Design and Manufacturing for Vehicle Body at Hunan University (Grant No. 52175013). H. W. is supported by the National Natural Science Foundation of China (Grant No. 51906097). X. Z. is supported by the Fundamental Research Funds for the Central Universities (Grant No. 531118010490) and the National Natural Science Foundation of China (Grant No. 52006059). The numerical calculations in this paper have been done on the supercomputing system at the National Supercomputing Center in Changsha.References
- A. K. Geim and K. S. Novoselov, The rise of graphene, Nat. Mater., 2007, 6(3), 183–191 CrossRef CAS PubMed.
- C. Lee, X. Wei and J. W. Kysar, et al., Measurement of the elastic properties and intrinsic strength of monolayer graphene, Science, 2008, 321(5887), 385–388 CrossRef CAS PubMed.
- L. Li, Y. Yu and G. J. Ye, et al., Black phosphorus field-effect transistors, Nat. Nanotechnol., 2014, 9(5), 372–377 CrossRef CAS PubMed.
- K. S. Novoselov, et al., Electric field effect in atomically thin carbon films, Science, 2004, 306, 666–669 CrossRef CAS PubMed.
- A. Brown and S. Rundqvist, Refinement of the crystal structure of black phosphorus, Acta Crystallogr., 1965, 19, 684–685 CrossRef CAS.
- J. C. Slater, G. F. Koster and J. H. Wood, Symmetry and free electron properties of the gallium energy bands, Phys. Rev., 1962, 126, 1307–1317 CrossRef CAS.
- L. Cartz, S. R. Srinivasa, R. J. Riedner, J. D. Jorgensen and T. G. Worlton, Effect of pressure on bonding in black phosphorus, J. Chem. Phys., 1979, 71, 1718–1721 CrossRef CAS.
- J. Qiao, X. Kong and Z. Hu, et al., High-mobility transport anisotropy and linear dichroism in few-layer black phosphorus, Nat. Commun., 2014, 5(1), 4475 CrossRef CAS PubMed.
- A. S. Rodin, A. Carvalho and A. H.-C. Neto, Strain-induced gap modification in black phosphorus, Phys. Rev. Lett., 2014, 112, 17 CrossRef PubMed.
- G. Qin, Z. Qin and W. Z. Fang, et al., Diverse anisotropy of phonon transport in two-dimensional IV-VI compounds: A first-principles study, Nanoscale, 2016, 8, 11306 RSC.
- L. C. Zhang, G. Qin and W. Z. Fang, et al., Tinselenidene: a Two-dimensional Auxetic Material with Ultralow Lattice Thermal Conductivity and Ultrahigh Hole Mobility, Sci. Rep., 2016, 6(1), 19830 CrossRef CAS PubMed.
- T. Low, M. Engel and M. Steiner, et al., Origin of photoresponse in black phosphorus phototransistors, Phys. Rev., 2014, 90(8), 081408 CrossRef CAS.
- R. Fei, A. Faghaninia and R. Soklaski, et al., Enhanced Thermoelectric Efficiency via Orthogonal Electrical and Thermal Conductances in Phosphorene, Nano Lett., 2014, 14(11), 6393 CrossRef CAS PubMed.
- H. Y. Lv, W. J. Lu and D. F. Shao, et al., Enhanced thermoelectric performance of phosphorene by strain-induced band convergence, Phys. Rev. B: Condens. Matter Mater. Phys., 2014, 90(8), 085433 CrossRef CAS.
- D. Akinwande, N. Petrone and J. Hone, Two-dimensional flexible nanoelectronics, Nat. Commun., 2014, 5, 5678 CrossRef CAS PubMed.
- K. Shirai, Electronic structures and mechanical properties of boron and boron-rich crystals (Part I), J. Superhard Mater., 2010, 32(3), 205–225 CrossRef.
- G. Kresse and J. Furthmüller, Efficient iterative schemes for ab initio total-energy calculations using a plane-wave basis set, Phys. Rev. B: Condens. Matter Mater. Phys., 1996, 54(16), 11169–11186 CrossRef CAS PubMed.
- J. P. Perdew, K. Burke and M. Ernzerhof, Generalized Gradient Approximation Made Simple, Phys. Rev. Lett., 1997, 78(7), 1396 CrossRef CAS.
- X. Zhang, H. Xie and M. Hu, et al., Thermal conductivity of silicene calculated using an optimized Stillinger-Weber potential, Phys. Rev. B: Condens. Matter Mater. Phys., 2014, 89(5), 054310 CrossRef.
- R. Fei and L. Yang, Strain-engineering the anisotropic electrical conductance of few-layer black phosphorus, Nano Lett., 2014, 14(5), 2884–2889 CrossRef CAS PubMed.
- Z. Luo, J. Maassen and Y. Deng, et al., Anisotropic in-plane thermal conductivity observed in few-layer black phosphorus, Nat. Commun., 2015, 6, 8572 CrossRef CAS PubMed.
- L. Zheng, S. Cardaci and L. Jerby, et al., Fumarate induces redox-dependent senescence by modifying glutathione metabolism, Nat. Commun., 2015, 6, 6001 CrossRef CAS PubMed.
- J. Zhu, H. Park and J. Y. Chen, et al., Black Phosphorus: Revealing the Origins of 3D Anisotropic Thermal Conductivities of Black Phosphorus, Adv. Electron. Mater., 2016, 2, 5 Search PubMed.
- L. Zheng, S. Cardaci and L. Jerby, et al., Fumarate induces redox-dependent senescence by modifying glutathione metabolism, Nat. Commun., 2015, 6, 6001 CrossRef CAS PubMed.
- B. Smith, B. Vermeersch and J. Carrete, et al., Temperature and Thickness Dependences of the Anisotropic In-Plane Thermal Conductivity of Black Phosphorus, Adv. Mater., 2017, 29(5), 1603756 CrossRef PubMed.
- B. Sun, X. Gu and Q. Zeng, et al., Temperature Dependence of Anisotropic Thermal-Conductivity Tensor of Bulk Black Phosphorus, Adv. Mater., 2017, 29(3), 1603297 CrossRef PubMed.
- G. Qin and M. Hu, Thermal Transport in Phosphorene, Small, 2018, e1702465 CrossRef PubMed.
- Y. Hong, J. Zhang and X. Huang, et al., Thermal conductivity of a two-dimensional phosphorene sheet: a comparative study with graphene, Nanoscale, 2015, 7, 18716–18724 RSC.
- Z. Ying-Yan, P. Qing-Xiang and J. Jin-Wu, et al., Thermal conductivities of single- and multi-layer phosphorene: a molecular dynamics study, Nanoscale, 2015, 8(1) 10.1039/C5NR05451F.
- L. Lindsay, R. A. Broido and R. Mingo, Flexural phonons and thermal transport in graphene, Phys. Rev. B: Condens. Matter Mater. Phys., 2010, 82(11), 1321–1330 CrossRef.
- A. H.-C. Neto, F. Guinea and N. M.-R. Peres, et al., The electronic properties of graphene, Rev. Mod. Phys., 2009, 81, 5934 Search PubMed.
- H. Xie, M. Hu and H. Bao, Thermal conductivity of silicene from first-principles, Appl. Phys. Lett., 2014, 104(13), 666 CrossRef.
- G. Kresse and J. Furthmüller, Efficient iterative schemes for ab initio total-energy calculations using a plane-wave basis set, Phys. Rev. B: Condens. Matter Mater. Phys., 1996, 54(16), 11169–11186 CrossRef CAS PubMed.
- K. Laasonen, R. Car and C. Lee, et al., Implementation of ultrasoft pseudopotentials in ab initio molecular dynamics, Phys. Rev. B: Condens. Matter Mater. Phys., 1991, 43(8), 6796 CrossRef CAS PubMed.
- G. Kresse and D. Joubert, From ultrasoft pseudopotentials to the projector augmented-wave method, Phys. Rev. B: Condens. Matter Mater. Phys., 1999, 59(3), 1758–1775 CrossRef CAS.
- J. P. Perdew and A. Zunger, Self-Interaction Correction to Density-Functional Approximations for Many-Body Systems, Phys. Rev. B: Condens. Matter Mater. Phys., 1981, 23(10), 5048–5079 CrossRef CAS.
- J. P. Perdew, K. Burke and M. Ernzerhof, Generalized Gradient Approximation Made Simple, Phys. Rev. Lett., 1996, 77(18), 3865–3868 CrossRef CAS PubMed.
- B. Hammer, L. B. Hansen and J. K. N?Rskov, Improved adsorption energetics within density-functional theory using revised Perdew-Burke-Ernzerhof functionals, Phys. Rev. B: Condens. Matter Mater. Phys., 1999, 59(11), 7413–7421 CrossRef.
- J. P. Perdew, A. Ruzsinszky, G. I. Csonka, O. A. Vydrov, G. E. Scuseria, L. A. Constantin, X. Zhou and K. Burke, Restoring the density-gradient expansion for exchange in solids and surfaces, Phys. Rev. Lett., 2008, 100, 136406 CrossRef PubMed.
- J. P. Perdew and Y. Wang, Pair-distribution function and its coupling-constant average for the spin-polarized electron gas, Phys. Rev. B: Condens. Matter Mater. Phys., 1992, 46, 12947–12954 CrossRef PubMed.
- D. Vanderbilt, Soft self-consistent pseudopotentials in a generalized eigenvalue formalism, Phys. Rev. B: Condens. Matter Mater. Phys., 1990, 41, 7892–7895 CrossRef PubMed.
- J. C.-V. Klime, D. R. Bowler and A. Michaelides, van der Waals density functionals applied to solids, Phys. Rev. B: Condens. Matter Mater. Phys., 2011, 83, 195131 CrossRef.
- J. Klimeš, D. R. Bowler and A. Michaelides, Chemical accuracy for the van der Waals density functional, Phys. Rev. B: Condens. Matter Mater. Phys., 2010, 22(2), 022201 CrossRef PubMed.
- K. Lee, E. D. Murray, L. Kong, B. I. Lundqvist and D. C. Langreth, Higher-accuracy van der Waals density functional, Phys. Rev. B: Condens. Matter Mater. Phys., 2010, 82, 081101 CrossRef.
- G. Qin, Z. Qin and H. Wang, et al., On the diversity in the thermal transport properties of graphene: A first-principles-benchmark study testing different exchange-correlation functionals, Comput. Mater. Sci., 2018, 151, 153–159 CrossRef CAS.
- K. Esfarjani and H. T. Stokes, Method to extract anharmonic force constants from first principles calculations[J]., Phys. Rev. B: Condens. Matter Mater. Phys., 2012, 86, 1 CrossRef.
- W. Li, L. Lindsay and D. A. Broido, et al., Thermal conductivity of bulk and nanowire Mg_2Si_xSn_(1-x) alloys from first principles, Phys. Rev., 2012, 86(17), 174307 CrossRef.
- H. Liu, A. T. Neal and Z. Zhu, et al., Phosphorene: An Unexplored 2D Semiconductor with a High Hole Mobility, ACS Nano, 2014, 8(4), 4033–4041 CrossRef CAS PubMed.
- V. Tran, R. Soklaski and Y. Liang, et al., Layer-controlled band gap and anisotropic excitons in few-layer black phosphorus, Phys. Rev. B: Condens. Matter Mater. Phys., 2014, 89(23), 817–824 CrossRef.
- A. Jain and A. J.-H. Mcgaughey, Strongly anisotropic in-plane thermal transport in single-layer black phosphorene, Sci. Rep., 2015, 5, 8501 CrossRef CAS PubMed.
- X. Gu, Y. Wei and X. Yin, et al., Phononic thermal properties of two-dimensional materials, Rev. Mod. Phys., 2017, 90, 4 Search PubMed.
- A. Savin, R. Nesper and S. Wengert, et al., ELF: The Electron Localization Function (p 1808-1832), Angew. Chem., Int. Ed. Engl., 1997, 36(17), 1808–1832 CrossRef CAS.
- G. Qin, X. Zhang and S. Y. Yue, et al., Resonant bonding driven giant phonon anharmonicity and low thermal conductivity of phosphorene, Phys. Rev. B: Condens. Matter Mater. Phys., 2016, 94(16), 165445 CrossRef.
- Z. X. Hu, X. Kong and J. Qiao, et al.,Interlayer electronic hybridization leads to exceptional thickness-dependent vibrational properties in few-layer black phosphorus, Nanoscale, 2016, 8(5), 2740–2750 RSC.
Footnote |
| † Electronic supplementary information (ESI) available. See DOI: https://doi.org/10.1039/d2ma00407k |
| This journal is © The Royal Society of Chemistry 2022 |

