 Open Access Article
Creative Commons Attribution 3.0 Unported Licence
Interdigitated cathode–electrolyte architectural design for fast-charging lithium metal battery with lithium oxyhalide solid-state electrolyte†
Abu Md
Numan-Al-Mobin
 *a,
Ben
Schmidt
b,
Armand
Lannerd
a,
Mark
Viste
c,
Quinn
Qiao
 d and
Alevtina
Smirnova
*a
aSouth Dakota School of Mines and Technology, USA. E-mail: abumd.numan-al-mobin@sdsmt.edu; alevtina.smirnova@sdsmt.edu
bPhysical Electronics Inc, USA
cMedtronic Inc, USA
dSyracuse University, USA
First published on 9th September 2022
Abstract
The all-solid-state battery is a promising alternative to conventional lithium-ion batteries that have reached the limit of their technological capabilities. The next-generation lithium-ion batteries are expected to be eco-friendly, long-lasting, and safe while demonstrating high energy density and providing ultrafast charging. These much-needed properties require significant efforts to uncover and utilize the chemical, morphological, and electrochemical properties of solid-state electrolytes and cathode nanocomposites. Here we report solid-state electrochemical cells based on lithium oxyhalide electrolyte that is produced by melt-casting. This method results in enhanced cathode/electrolyte interfaces that allow exceptionally high charging rates (>4000C) while maintaining the electrochemical stability of solid-state electrolyte in the presence of lithium metal anode and lithium iron phosphate-based cathode. The cells exhibit long cycle life (>1800 cycles at 100 °C) and offer a promising route to the next-generation all-solid-state battery technology.
1. Introduction
The ever-growing demand for high power and energy density batteries,1 particularly for EVs,2 electric power grid,3 5G communications,4,5 portable electronics, and IoT6,7 coupled with safety, long-term cyclability, and fast charging is the driving force for technological advancements in solid-state energy storage. In recent years, many different types of electrolytes8–10 and electrode materials11–14 have been developed. However, conventional lithium-ion batteries are unsafe due to flammable and corrosive liquid electrolytes15 that promote lithium dendrite formation.16,17 Decomposed organic solvents decrease the battery lifetime2,18 by forming solid electrolyte interfaces that limit mass transport and lithium-ion conductivity, especially at elevated temperatures and in long-term operations.19 Therefore, replacing the liquid with solid-state electrolytes improves battery safety, reliability, and economic feasibility.Many solid-state electrolytes are known that exist in the form of ceramic, glass-ceramic, or glass phases.20–22 Among them are sulfide-based23,24 electrolytes, such as Li10SnP2S12 (LSPS),25 75Li2S·25P2S5 (LPS),26,27 and Li10GeP2S12 (LGPS),28–30 garnet-based oxides,31 superionic phosphate-based32,33 (LAGP34 and LATP35), and antiperovskites. Stabilization of a solid-state electrolyte in a particular phase depends on synthesis conditions, such as temperature gradients during cooling processes36 or the presence of moisture37 that define mechanical, electrochemical, and ion-transport properties. Compared to ceramic electrolytes, glasses38 typically possess compositional flexibility, high ionic transference numbers, and the absence of dendrites that grow along grain boundaries. Further modification of glasses provides partial crystallization and higher ionic conductivities20 due to the formation of metastable superionic glass-ceramics.39 These phase transformations change lithium-ion transport mechanisms, which are isotropic in glasses. Contrary to glasses, ion transport in glass-ceramics occurs through lithium interstitial or vacancy mechanisms that depend on the valence of cations and lithium-ion deficiency.20
In comparison to other solid-state electrolytes, antiperovskites demonstrate a number of collective advantages40,41 for electrolytes and cathodes42,43 and the formation of a glassy phase that eliminates lithium dendrite growth known for garnets.44,45 Furthermore, antiperovskites can be synthesized in various forms, such as glass,46,47 or glass-ceramics.48 Depending on temperature and doping, rhombohedral or cubic phases have been reported,49 thus providing a broad range of ionic conductivities. Contrary to sulfides,50 the high stability of Li2OHCl in the presence of melted lithium was confirmed by testing Li/Li2OHCl/Li symmetric cells cycled at 195 °C for 160 cycles. In these tests, the reaction between the Li2OHCl and molten lithium produced LiCl (s), LiO2 (s) and H2 (g). The LiCl (s) and LiO2 (s) worked as a solid electrolyte protective layer for the crystalline Li2OHCl. The study shows that the LiCl remained near the crystalline Li2OHCl and Li2O layer stayed close to the melted lithium to protect Li2OHCl from further degradation.36 Furthermore, the broad electrochemical stability window of antiperovskites was explained by slow kinetics of decomposition reactions resulting in high overpotential51 and high thermodynamic decomposition voltages, e.g. in lithium halide hydrates52 or lithium oxyhalides.41 These observations are further confirmed considering that the electrochemical stability window of solid-state electrolytes narrows with decreased voltage range while moving down the halogen or chalcogen groups.51 Therefore, it is obvious that high voltages and broad electrochemical stability windows are expected for the elements with lower atomic numbers, such as chlorine and oxygen in lithium oxyhalides.
Despite many publications, the concept of “OH-free” Li3OCl lithium oxyhalides53 remains controversial. It is mainly based on the disclosed formation of complex substituted compounds, such as Li3OHCl2, Li5(OH)2Cl3, Li2OHCl, Li5(OH)3Cl2, or Li3(OH)2Cl36 that could explain a broad conductivity range and phase transformations in conjunction with chemical composition, crystal lattice, and purity of the reported oxyhalides.46,49,53 In the case of Li2OHBr and Li2HOCl,54 phase transformations from Pmc21 orthorhombic to Pm3m (Oh) cubic phase were reported36,49 at temperatures below 50 °C.49 In other cases, Li3OCl chemical composition was affected by water as a by-product formed during its synthesis in vacuum-sealed glass tubes. As a result, the formation of various phases led to different mechanisms of ionic transport reflected in the corresponding values of ionic conductivities. In some cases, conductivities of Li3OCl and Li3−x(OHx)Cl polymorphs53 were very low in the range of 10−6–10−7 S cm−1.41,47,49 However, higher values of 2.5 × 10⁻⁴ and 2.0 × 10⁻⁴ S cm−1 at room temperature were obtained for glassy state55 and thin films,56 respectively.
Besides solid-state electrolyte properties, another critical factor for solid-state battery performance is mechanical and chemical compatibility at interfaces between different phases in nanocomposite cathodes. Capacity fade was reported for solid-state electrochemical cells caused by the formation of electrochemically inactive interfaces, poor particle wettability,22 and microcracking due to volume changes during cycling.57,58 However, significant improvements in cell performance were reported after heat-treatment of garnet-containing cathodes.59 To the best of our knowledge, the correlation between the interfacial properties of oxyhalide-based cathodes and electrochemical cell performance has not been addressed. This study continues our effort,60 where the lithium oxyhalide in contact with lithium metal demonstrated low activation energy (0.31–0.23 eV) at room temperature up to 100 °C.
2. Experimental
2.1. Synthesis of the solid-state electrolyte
Solid-state lithium oxyhalide electrolyte, Li3OCl, was synthesized in an argon glove box at ≤0.5 ppm H2O, from inorganic precursors, specifically lithium chloride (m.p. 605 °C, STREM Chemicals Inc., >99%) and lithium hydroxide (m.p. 462 °C, Sigma Aldrich, ≥98%) following three different moisture-control and cooling rate protocols. The precursors, lithium hydroxide (LiOH) and lithium chloride (LiCl), were initially mixed and ground using mortar and pestle. A hotplate heated to 550 °C was used for electrolyte melting and fast water evaporation. Nickel foil (l = 0.025 mm, Alfa Aesar, 99.5% metal basis) was used to melt the ground precursors. The mixture was melted on the nickel foil at 550 °C. The Li3OCl synthesis was completed in two scenarios: (1) slow-cool using temperature gradient on a hotplate, and (2) fast-cool by transferring to the stainless-steel base of the MBraun glovebox.2.2. Fabrication of electrodes and solid-state lithium-ion electrochemical cells
Cathode nanocomposites were produced from carbon-coated lithium iron phosphate (LiFePO4 or LFP) from MTI Corp. The LFP particles, with bimodal size distribution between 0.1 and 20.0 μm and two peaks at 1.0 and 6.0 μm, along with 90% volume occupied by <15 μm particles, were used for the synthesis of cathode nanostructures. The lithium iron phosphate (LFP) powder and pre-mixed carbon (1.45 ± 0.2 wt%) had a surface area of 11.0 ± 2.0 m2 g−1. The LFP powder was then melded with the melted Li3OCl electrolyte. After blending, one mixed cathode–electrolyte layer and another electrolyte layer were formed. The layers were compressed to form interdigitated interfaces of the cathode–electrolyte nanocomposites. Carbon-coated aluminum foil (Al/C) with ∼0.107 mg cm−2 graphite loading from MTI Corp. and lithium foil (t = 0.75 mm) from Sigma Aldrich was used as the cathode current collector and anode, respectively.The melt-casting produced electrochemical cells, different from the melt infiltration method reported earlier.61 It was performed in an argon glovebox by melting the inorganic precursors on Ni foil at 550 °C, mixing the LFP-based cathode powder with the melted electrolyte, cooling, compression, and removing the nickel foil from the solidified electrolyte surface (Fig. 1(a)). The applied procedure resulted in the Li3OCl electrolyte layer contacting the nickel foil surface. After the nickel foil removal, cathode–electrolyte interdigitated layers approximately 500 μm thick were formed with a total LFP powder loading of 17 μg. The configuration of the electrochemical cell Al/C|[LFP(98.5%)/C(1.5%)] + xLi3OCl|Li3OCl with thin cathodes (∼10 μm) circumvented mass-transport limitations (Fig. 1(b)), and charged at high C-rates as evident from the results.
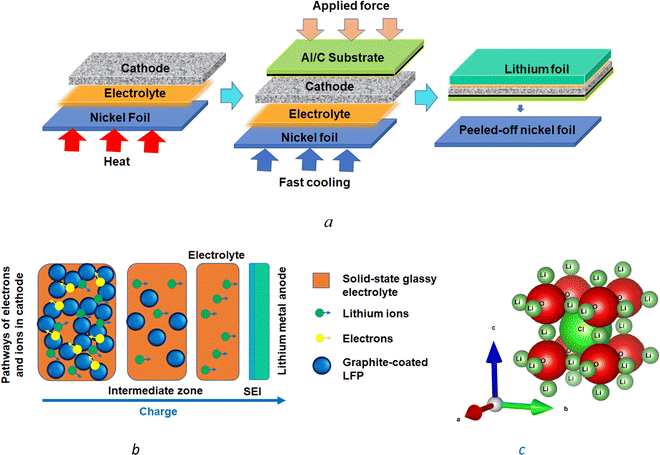 | ||
| Fig. 1 The melt-casting method (a) provides a gradient distribution of cathode particles within a thin cathode layer interdigitated with a solid-state electrolyte and offers a percolation network for lithium-ion and electron transport in the absence of mass-transport limitations within the cathode (b). The Li3OCl solid-state electrolyte has an antiperovskite crystal structure (c) generated by VESTA 3.62 | ||
The CR2032 electrochemical cells were assembled using lithium metal disks (14.5 mm in diameter). Defined by the area of lithium metal disks, the active surface area of the lithium-metal electrochemical cells was ∼165 mm2. A stainless-steel spacer (0.5 mm) and a wave-spring were placed on top of the lithium disk before crimping the cell at 1000 psi for 1 min using an MSK-110 Hydraulic Crimping Machine from MTI Corp. The crimping procedure was performed inside an MBraun argon glovebox with ≤1 ppm H2O and ≤1 ppm O2.
2.3. Materials characterization
A third generation XRD spectrometer EMPYREAN from Malvern Panalitical with the capability of small and ultra-small angle X-ray scattering has been used in this study. An X-ray of Co Kα2 radiation (λ = 1.78899 Å) was used to scan the powder samples with a scan rate of 0.02626° per 12.24 s within the range of 20–90° 2θ. Kapton film (l = 25 μm) was used to protect antiperovskite samples from moisture. The spectrum of Kapton film was subtracted from all XRD spectra. The XRD spectra simulation was performed by using VESTA 3 software.62The scanning electron microscope (SEM) imaging was performed using a Supra 40VP (Zeiss) field emission scanning microscope with a nitrogen atmosphere. The secondary electron collector (SE2) was used as a detector with a working distance of 8.0 mm. The electron beam was held at 10 kV. SEM images were taken at 0.5 K, 1 K, 5 K, and 10 K magnification. Energy-dispersive X-ray spectroscopy (EDS) was performed using the EDS detector from Oxford Instruments X-Max 80 mm2 silicon drift detector (SDD) along with the microanalysis software system from AZtecEnergy (Oxford Instruments). The X-ray photoelectron spectroscopy (XPS) analysis was performed using VersaProbe III from Physical Electronics. The samples were mounted to the holder with nonconductive adhesive tape in argon and moved to the XPS system in a sealed transfer vessel for minimized air exposure. A 100 W monochromatic Al Kα X-ray beam was rastered over a 1300 × 100 μm area. At 224 eV pass energy, the survey scans were collected for ∼5 minutes. The C 1s C–C peak was positioned at 284.8 eV to calibrate the binding energy scale. The C 1s peaks were then adjusted for each sample to ensure the correct interpretation of the recorded spectra.
2.4. Electrochemical cell characterization
The AC impedance measurements of the CR2032 electrochemical cells were conducted using a 1260 frequency response analyzer from Solartron. The Z′ and Z′′ data were sampled with 85 points taken over a frequency range of 32 MHz–10 mHz using logarithmic point spacing at an AC amplitude of 10.00 mV. The EIS measurement was performed in a sand bath where the temperature was controlled within 100 ± 6 °C. This temperature variation could affect the EIS measurements. The rate capability and cyclability tests were conducted using the Arbin test station. The tests at elevated temperatures were performed using the environmental chambers with temperature controllers to maintain the specific temperature required for each experiment. C-rates were calculated based on the LFP weight in cathode layers and their further tuning after a few initial cycles. For the rate capability and cyclability performance evaluation, the CR2032 cells were also tested in two voltage ranges of 2.6–3.5 V and 2.0–4.2 V.3. Results and discussion
3.1. Synthesis of solid-state lithium oxyhalide
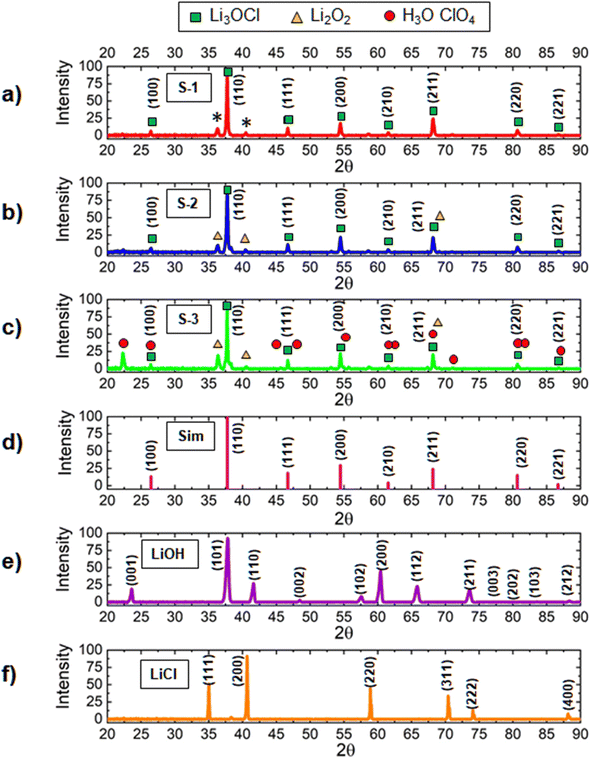
The chemical composition of lithium oxyhalide is defined by several factors including the amount of moisture present in the inorganic precursors, cooling rate, amount of water produced in the reaction, and the contact time with the atmosphere during solidification. To avoid undesirable moisture interaction with lithium oxyhalide41,54 and allow fast water evaporation during its synthesis, the reaction was performed at a temperature of 550 °C, which is significantly higher than the melting point of Li3ClO (282 °C). In this case, the water released during the reaction LiCl + 2LiOH → Li3OCl + H2O was evaporated fast without causing unwanted chemical transformations in solid-state electrolytes.Using high-resolution X-ray diffraction spectroscopy, we analyzed the synthesis of three different solid-state electrolyte scenarios (Fig. 2). The first sample (S-1) was synthesized at a fast-cooling rate (100 °C s−1), but lithium hydroxide, known for its ability to absorb moisture, was dehydrated before mixing it with lithium chloride. The second sample (S-2) was produced from as-received precursors and at a fast-cooling rate (100 °C s−1). The third sample (S-3) was synthesized from as-received lithium hydroxide and lithium chloride precursors at a slow cooling rate (2 °C s−1). The XRD spectra for the S1–S3 samples (Fig. 2) are presented in comparison to the simulated XRD spectrum of Li3OCl (Fig. 2(d)) and the XRD reference patterns for as-received lithium hydroxide and lithium chloride precursors (Fig. 2(e) and (f)). For quantitative analysis, MDI JADE software was used to calculate the weight fractions of individual phases (Fig. 3).
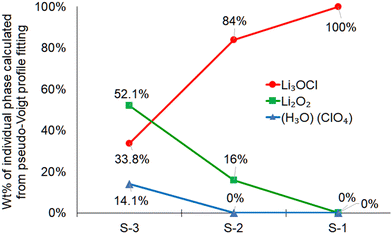 | ||
| Fig. 3 Calculated weight percent of the individual phases using the MDI JADE software. The pattern fitting was performed using the pseudo-Voigt fitting approach. | ||
In MDI JADE analysis, all parameters, for example, selection of elements, Δd ± 0%, Δ2θ ± 0.12, and pseudo-Voigt shape function, were kept identical for each of the three samples. The lowest purity was detected for the S-3 sample (Fig. 3). It contains only 34 wt% of the main Li3OCl phase and a high concentration of impurities, such as Li2O2 (52 wt%) and H2O·ClO4 (14 wt%). An assumption was made that slow cooling did not allow water to escape from the sample fast enough during crystallization. This assumption was justified by sample S-2 (Fig. 2(b)), which was solidified at a much higher cooling rate (up to 100 °C s−1). The sample S-2 demonstrated a much higher (84 wt%) Li3OCl yield. The observed high concentration of Li2O2 impurity (16 wt%) was explained by moisture present in the lithium hydroxide precursor (Fig. 2(b)). Based on JADE-calculated weight fractions, the S-1 sample (Fig. 3) produced from the dehydrated lithium hydroxide at a high cooling rate demonstrated the highest purity of lithium oxyhalide. The software omitted two small peaks labeled with asterisks (Fig. 2(a)). Therefore, the S-1 sample results in 100% Li3OCl purity. A small amount of moisture contamination could explain the origin of these peaks during the sample transfer.
In terms of 2θ angles, the S-3 spectrum produced at a slow cooling rate demonstrated low-intensity peaks at 45.63°, 54.87°, 67.35°, 71.08°, and 82.06°. These peaks do not match the simulated XRD data (Fig. 2(d)) and are assigned to H3O·ClO4 hydronium perchlorate by-product. The formation of this solid-state impurity63 can be explained by the interaction between protonated water cations, oxygen, and chloride anions, similar to the mechanism described for sulfur-containing hydronium-based compounds.64,65 On the contrary, the XRD spectra of the S-1 and S-2 samples (Fig. 2(a) and (b)) match the simulated XRD data (Fig. 2(d)). Specifically, lithium oxyhalide peaks in S-1 and S-2 samples are identified at 26.43°, 37.73°, 46.68°, 54.46°, 61.55°, 68.19°, 80.67°, and 86.68° 2θ.
These results demonstrate that the yield of lithium oxyhalide and its purity largely depends on both the hydration levels of inorganic precursors and the contact time of the sample with water produced in the reaction. It is evident that the samples solidified during fast cooling contain less (S-2, ∼16%) or no impurities (S-1, 0%). The concentration of impurities in the S-3 sample produced at a slow cooling rate is much higher (∼66%). This study confirms that fast cooling and fast moisture removal at higher temperatures (550 °C) is vital for synthesizing pure lithium oxyhalide.
3.2. Interdigitated assembly of cathode and lithium oxyhalide electrolyte
Following the XRD data, the cathode–electrolyte interdigitated layers were produced by fast cooling.66 In addition, the interdigitation of the cathode and the electrolyte layers was achieved at the sub-micron level. In this process, the lithium iron phosphate (LFP) particles were embedded in the lithium oxyhalide (Li3OCl) electrolyte. SEM images in Fig. 4 show that the LFP cathode layer thickness is approximately 12 μm. In addition, Fig. 5 provides the distribution of the cathode and electrolyte material within the cathode layer, where the particle size of the LFP is mostly between 1–2 μm. Therefore, the interdigitated LFP electrode and the solid-state layers have a depth of 12 μm. The cross-sectional SEM/EDS images of the cathode–electrolyte interface (Fig. 4) demonstrate the photoelastic fringes in the electrolyte layer. These fringes are usually observed in glasses.20,67,68 This observation could indicate lithium oxyhalide being produced in glass rather than crystalline phase following the nucleation mechanism36 reported earlier for its Li2OHCl derivative.69 | ||
| Fig. 4 SEM images at the cross-section of LFP/C (cathode) and Li3OCl (electrolyte) interface. The color profiles show the elemental distribution of carbon, oxygen, chlorine, phosphorous, and iron. | ||
 | ||
| Fig. 5 SEM images showing the elemental distribution of carbon, oxygen, chlorine, phosphorous, and iron within the intermingled LFP/C cathode and lithium oxyhalide electrolyte layers. | ||
The glass-forming ability of lithium oxyhalide can be explained using a kinetic concept. The glassy phase forms by melt quenching at critical cooling rates when crystallization does not occur.70 In correlation with the properties of sulfur-based Li2S–Ga2Se3–GeSe2 glasses,20,38 the elemental distribution of carbon, oxygen, chlorine, phosphorous, and iron in the LFP/C-Li3OCl cathode layer (Fig. 5) reveals numerous conduction pathways through the lithium oxyhalide glass network. We hypothesize that through rapid hopping in Li3OCl, randomly distributed lithium ions are responsible for lithium-ion transport leading to superior conductivities compared to their crystalline counterparts.20
3.3. Electrochemical performance of lithium oxyhalide-based electrochemical cells
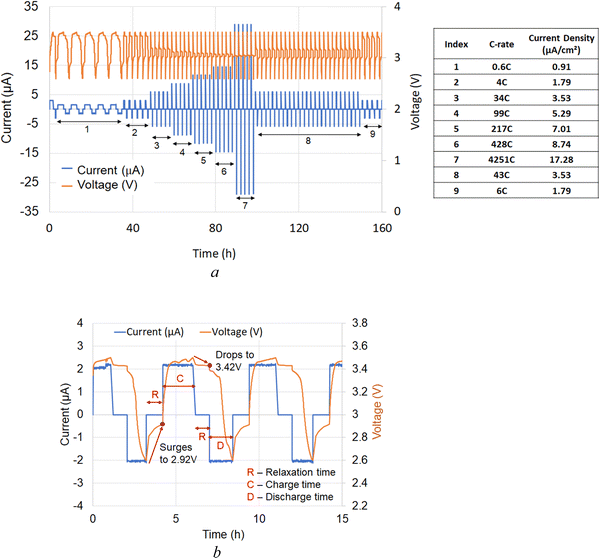
The electrochemical performance of the solid-state cells was evaluated using impedance spectroscopy, C-rate tests, and their capacity measurements. Note that the charge and discharge currents of the all-solid-state cell are much smaller due to the higher charge transfer resistance (∼106 Ω) at room temperature. The resistance of the cell decreases to three orders of magnitude (∼103 Ω) at higher temperatures (100 °C). Also, the amount of active material used in the experiment is smaller (17 μg). From EIS measurement, the electrolyte conductivity is calculated ∼4.34 × 10⁻⁵ S cm−1 at 100 °C.Following the schedule in Fig. 6(a), the first 500 cycles were executed in a voltage range of 2.60–3.50 V, typical for lithium iron phosphate cathodes with a theoretical specific capacity of 170 mA h g−1 at 3.45 V.71 A wider voltage window of 2.0–4.2 V was used to track the electrochemical performance during deep discharge and over-lithiation. Each cycle (Fig. 6(a) and (b)) was completed in three consecutive steps: (1) charging – C, (2) 1 h relaxation time between any charge and discharge cycle – R, and (3) discharge cycle – D. The role of relaxation time between charge and discharge cycles was to stabilize the cell voltage. It was observed (Fig. 6(b)) that the cell voltages were shifting during relaxation time. Specifically, they were decreased to 3.42 V and increased to 2.92 V between the charge and discharge cycles, respectively. The corresponding capacity measurements and the measured C-rates (Fig. S1, ESI†) show that the difference between discharge and charge C-rates increases with increasing C-rate. This observation indicates that at higher C-rates and higher currents, there is a significant difference in intercalation vs. deintercalation of lithium ions into the host LFP structure. It also defines the kinetics of lithium-ion transport when lithium ions can move out from the host cathode network faster during discharge. Furthermore, this analysis implies that at the same positive charge and negative discharge rates, the intercalation of lithium ions into the host LFP cathode matrix is slower.
The results in Fig. 6(a) demonstrate that the solid-state cells based on lithium oxyhalide can be charged much faster without mass-transport limitations in a relatively thin cathode. Furthermore, the average charge and discharge capacity at the beginning and the end were approximately the same (Fig. S1, steps 2 and 9, ESI†), indicating reproducible cell performance. The charge and discharge capacity plots and the differential capacity plot (Fig. S2 and S3, ESI† respectively) suggest no significant chemical structure change during charge and discharge. It is widely known that the differential capacity plot provides information on the structural transformation of the active materials during the charge/discharge process. The solid-state electrochemical cell we present does not show any significant differential capacity peaks indicating almost no degradation in the cell performance.
To represent the discharge capacity better and account for the effect of current, temperature, and voltage on the all-solid-state cell, the discharge capacity is normalized to 1C (Fig. 7). The first C-rate cycle demonstrated a close-to-theoretical discharge capacity of 186 mA h g−1. After five C-rate schedules (200 cycles) depicted in Fig. 6(a), the normalized discharge capacity decreased to 81 mA h g−1 while the capacity retention was 86%. The charge and discharge cycles (500 cycles) of the cell were continued at 3C and 0.5C in the voltage range of 2.6–3.5 V, respectively. In these 500 cycles, there were no changes in the discharge capacity. Further cycling at 3C charge and 1.5C discharge resulted in a decreased discharge capacity (70 mA h g−1), which was relatively stable until the cell disassembly. In the last 500 cycles, the cell capacity was steady even after the cell's exposure to overcharged (4.2 V) and deep discharge (2.0 V) conditions (Fig. 7).
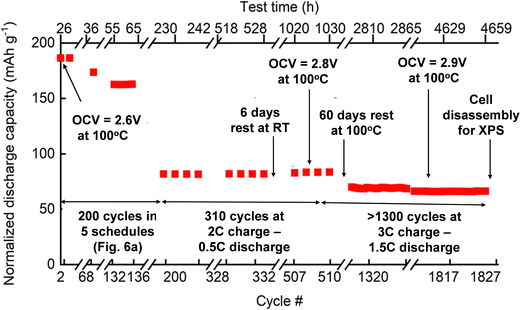 | ||
| Fig. 7 Performance of a solid-state cell Al/C|[LFP(98.5%)/C(1.5%)] + xLi3OCl|Li3OCl|Li exposed to different operating conditions: (a) 0–200 cycles charge/discharge schedules as depicted in Fig. 6; (b) 200–510 cycles at 2C charge and 0.5C discharge; (c) 510–1827 cycles at 3C charge and 1.5C discharge, and (d) a view of a disassembled electrochemical cell after 1827 cycles for the XPS study. | ||
During the C-rate test, the cell's open-circuit voltage (OCV) at 100 °C was constantly improved from 2.6 V to 2.9 V (Fig. 7). This increase in OCV is most likely due to the formation of additional charge-transfer channels within the electrolyte–cathode interdigitated architecture. The assumption of creating extra conduction pathways for lithium-ion transport was confirmed when the cell was exposed to room temperature for six days. The open-circuit voltage of the all-solid-state cell initially dropped to near zero volts indicating the suppression of the ion conduction channel. Later, the cell regained its OCV and performance at 100 °C within a few days (Fig. 7), showing the reversible nature of ionic conduction channel creation. The drop in discharge capacity after the first 200 cycles can be explained by the interfacial dissociation caused by accelerated C-rate tests at high-temperature (100 °C). After the drop in initial discharge capacity, cell performance was stable for additional 1600 cycles at 100 °C. It confirmed that the cell degradation did not occur due to deep discharge or over-lithiation.
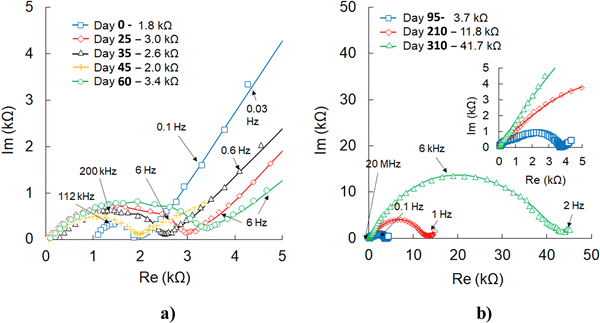
The electrochemical impedance spectroscopy (EIS) (Fig. 8) performed at different stages of cell operation provides additional information regarding the effects of higher C-rates, temperature, and deep discharge or overcharging. During the first two months of testing, the initial charge-transfer resistance (1.8 kΩ) slightly increased but then continued to fluctuate within 2–3 kΩ and did not change even after the cell exposure to high C-rates. After a few months of continuous cycling at variable C-rates and 100 °C, the cell impedance increased. As emphasized in the following section, most likely, this change is not related to lithium oxyhalide or cathode degradation. However, based on the evidence of stainless steel or copper oxidation by lithium metal at higher temperatures,72–74 this corrosion mechanism could be one of the plausible causes for increased cell impedance after long-term testing at 100 °C.
3.4. Electrochemical stability evaluation of electrolyte and cathode by XPS
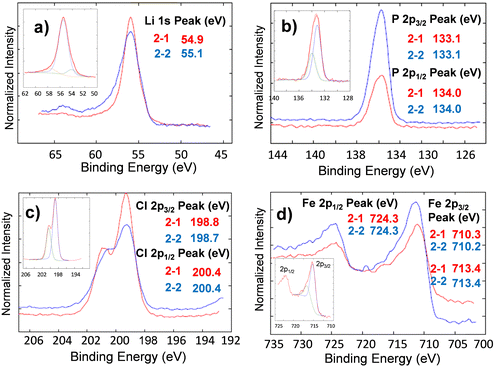
The chemical composition of lithium oxyhalide electrolyte in contact with the lithium-metal anode and the LFP-based cathode before and after 1800 cycles was studied by X-ray photoelectron spectroscopy (Fig. 9 and 10, respectively). The XPS spectrum of the Li3OCl layer was collected from the disassembled cell before (sample 1–2) and after (sample 1–3) cell testing and compared with pristine Li3OCl powder (sample 1–1) to evaluate the electrolyte stability in the presence of lithium metal. In all three samples, the corresponding high-resolution XPS spectra of lithium, chlorine, and oxygen show similar peaks and the absence of other peaks in the deconvolution procedure (Fig. 9). Specifically, the Li 1s peak (Fig. 9(a)) was detected in a narrow range of 55.1 ± 0.2 eV, while the chlorine 2p3/2 peak was recorded at 198.7 ± 0.2 eV (Fig. 9(b)), which is consistent with the values of binding energies for lithium. The oxygen 1s peak observed at 531.5 eV (Fig. 9(c)) demonstrated a slight increase in binding energy from samples 1–1 to 1–2 and 1–3, but a minimal deviation (±0.2 eV) in the case of lithium and chlorine. Weak carbon 1s peaks at 288.6 eV and 289.9 eV (not shown) were attributed to carbonates considering that lithium hydroxide precursor could be contaminated by carbon dioxide before the Li3OCl synthesis.Analysis of the deconvoluted spectra of chlorine atoms in Li3OCl (not shown) demonstrated no change in binding energies of p3/2 and p1/2 electrons. Specifically, 2p3/2 binding energies for chlorine atoms before and after cell testing are very close, e.g. BE(Cl2p3/2) = 198.8 eV and BE(Cl2p1/2) = 198.7 eV. The binding energies for chlorine 2p1/2 electrons before (BECl2p1/2 = 200.3 eV) and after cell testing (BECl2p1/2 = 200.4 eV) were similar. The observed 0.1 eV separation of 2p3/2 and 2p1/2 peaks between the fitted curves was in good correlation with the expected spin-orbit splitting effect within the p-orbital of chlorine atoms in lithium oxyhalide. These results show the high electrochemical stability of the solid-state Li3OCl electrolyte in contact with lithium-metal anode after five consecutive schedules with variable C-rate ranging from 0.6C to >4000C at 100 °C (Fig. 6(a)).
Similar to the XPS study of solid-state electrolytes, the electrochemical stability and potential phase transformation of Li3OCl electrolytes in the presence of carbon-coated LiFePO4 have been evaluated before (sample 2–1) and after (sample 2–2) cell testing (Fig. 10). No changes have been observed for electrolyte or LFP active cathode material regarding binding energies or the number of peaks after deconvolution. The deconvoluted high-resolution spectra of lithium atoms in the cathode nanocomposite (Fig. 10 inset) reveal three Li 1s peaks at 54.12 eV, 55.48 eV, and 57.51 eV. These peaks correspond to different electronic states of lithium within lithium oxyhalide and the crystal structure of lithium iron phosphate. The observed higher intensity of the Li 1s peak at 55.48 eV indicates that the electrolyte within the cathode composite was significantly higher than the corresponding amount of LFP.
The demonstrated XPS analysis of Li3OCl within the cathode nanocomposite before and after long-term cell testing confirms the electrochemical stability of Li3OCl in contact with lithium metals and at interfaces with LiFePO4-based cathode during their exposure to accelerated C-rate tests at 100 °C. Furthermore, this study does not provide any evidence of irreversible reaction of chlorine with electrodes and/or electrolyte decomposition during charge–discharge cycles, as proposed earlier.47 However, similar experiments need to be performed at a higher current in the future.
4. Conclusions
The demonstrated performance of solid-state electrochemical cells based on the high purity solid-state lithium oxyhalide electrolyte produced by melt-casting highlights the importance of processing conditions, such as cooling rates, temperature, and fast moisture removal, as well as the purity of inorganic precursors. The proposed melt-casting method allows the formation of interdigitated solid–electrolyte/cathode interfaces that tolerate more rapid battery charging while maintaining electrochemical stability of the solid-state electrolyte in the presence of lithium-metal anode and LFP-based cathode. Confirmed by XPS studies, the stability of the lithium oxyhalide solid-state electrolyte after its exposure to various C-rates at 100 °C offers a promising route to the next generation of lithium-ion solid-state battery technology. The proposed strategy paves the way for fast-charging batteries with higher cathode loadings and thinner electrolytes operating at high current densities in ambient conditions.Conflicts of interest
There are no conflicts to declare.Acknowledgements
The authors gratefully acknowledge financial support from the DOD Navy SBIR Phase II project Contract N68335-18-C-0021 and the NSF IUCRC program for supporting the “Center for solid-state electric power storage” (#2052631) and the South Dakota “Governor's Research Center for electrochemical energy storage”. The authors would like to thank Dr. Jeffrey Elam from the Argonne National Laboratory for reviewing this article and for his valuable comments and suggestions.References
- S. P. Forrester, A. Zaman, J. L. Mathieu and J. X. Johnson, Electr. J., 2017, 30, 50–56 CrossRef.
- J. Henschel, F. Horsthemke, Y. P. Stenzel, M. Evertz, S. Girod, C. Lürenbaum, K. Kösters, S. Wiemers-Meyer, M. Winter and S. Nowak, J. Power Sources, 2020, 447, 227370 CrossRef CAS.
- X. Fan, B. Liu, J. Liu, J. Ding, X. Han, Y. Deng, X. Lv, Y. Xie, B. Chen and W. Hu, Trans. Tianjin Univ., 2020, 1–12 Search PubMed.
- H. Zhu, H. Li, G. Liu, Y. Ge, J. Shi, H. Li and N. Zhang, CSEE J. Power Energy Syst., 2020, 1–9, DOI:10.17775/CSEEJPES.2020.00090.
- C. Mejia and Y. Kajikawa, Appl. Energy, 2020, 263, 114625 CrossRef.
- A. Suzuki, S. Sasaki and T. Jimbo, J. Phys.: Conf. Ser., 2019, 1407, 012037 CrossRef CAS.
- K. Jiang and Q. Weng, ChemSusChem, 2020, 13, 1420–1446 CrossRef CAS PubMed.
- W. Zhou, M. Zhang, X. Kong, W. Huang and Q. Zhang, Adv. Sci., 2021, 8, 2004490 CrossRef CAS PubMed.
- A. Benayad, D. Diddens, A. Heuer, A. N. Krishnamoorthy, M. Maiti, F. L. Cras, M. Legallais, F. Rahmanian, Y. Shin and H. Stein, Adv. Energy Mater., 2022, 12, 2102678 CrossRef CAS.
- E. Lizundia and D. Kundu, Adv. Funct. Mater., 2021, 31, 2005646 CrossRef CAS.
- C.-J. Yao, Z. Wu, J. Xie, F. Yu, W. Guo, Z. J. Xu, D.-S. Li, S. Zhang and Q. Zhang, ChemSusChem, 2020, 13, 2457–2463 CrossRef CAS PubMed.
- Y. S. Zhang, N. E. Courtier, Z. Zhang, K. Liu, J. J. Bailey, A. M. Boyce, G. Richardson, P. R. Shearing, E. Kendrick and D. J. Brett, Adv. Energy Mater., 2022, 12, 2102233 CrossRef CAS.
- I. A. Moses, R. P. Joshi, B. Ozdemir, N. Kumar, J. Eickholt and V. Barone, ACS Appl. Mater. Interfaces, 2021, 13, 53355–53362 CrossRef CAS PubMed.
- B. Esser, F. Dolhem, M. Becuwe, P. Poizot, A. Vlad and D. Brandell, J. Power Sources, 2021, 482, 228814 CrossRef CAS.
- H. Yang, G. V. Zhuang and P. N. Ross, J. Power Sources, 2006, 161, 573–579 CrossRef CAS.
- N. Schweikert, A. Hofmann, M. Schulz, M. Scheuermann, S. T. Boles, T. Hanemann, H. Hahn and S. Indris, J. Power Sources, 2013, 228, 237–243 CrossRef CAS.
- T. Famprikis, P. Canepa, J. A. Dawson, M. S. Islam and C. Masquelier, Nat. Mater., 2019, 1–14 Search PubMed.
- Y. Qian, P. Niehoff, M. Börner, M. Grützke, X. Mönnighoff, P. Behrends, S. Nowak, M. Winter and F. M. Schappacher, J. Power Sources, 2016, 329, 31–40 CrossRef CAS.
- P. Ganesh, P. Kent and D.-e Jiang, J. Phys. Chem. C, 2012, 116, 24476–24481 CrossRef CAS.
- J. Lau, R. H. DeBlock, D. M. Butts, D. S. Ashby, C. S. Choi and B. S. Dunn, Adv. Energy Mater., 2018, 8, 1800933 CrossRef.
- G. G. Eshetu, X. Judez, C. Li, M. Martinez-Ibañez, E. Sánchez-Diez, L. M. Rodriguez-Martinez, H. Zhang and M. Armand, Future Lithium-ion Batteries, Royal Society of Chemistry, 2019, pp. 72–101 Search PubMed.
- D. H. Tan, A. Banerjee, Z. Chen and Y. S. Meng, Nat. Nanotechnol., 2020, 1–11 Search PubMed.
- C. Yu, Y. Li, M. Willans, Y. Zhao, K. R. Adair, F. Zhao, W. Li, S. Deng, J. Liang and M. N. Banis, Nano Energy, 2020, 69, 104396 CrossRef CAS.
- Y. Harada, T. Ishigaki, H. Kawai and J. Kuwano, Solid State Ionics, 1998, 108, 407–413 CrossRef CAS.
- Y. Li, S. Daikuhara, S. Hori, X. Sun, K. Suzuki, M. Hirayama and R. Kanno, Chem. Mater., 2020, 32, 8860–8867 CrossRef CAS.
- H. Jiang, Y. Han, H. Wang, Q. Guo, Y. Zhu, W. Xie, C. Zheng and K. Xie, Ionics, 2019, 1–8 Search PubMed.
- C. S. Jiang, N. Dunlap, Y. Li, H. Guthrey, P. Liu, S. H. Lee and M. M. Al-Jassim, Adv. Energy Mater., 2020, 10, 2000219 CrossRef CAS.
- Z. Zeng, D. Gao, G. Yang, Q. Wu, X. Ren, P. Zhang and Y. Li, Nanotechnology, 2020, 31, 454001 CrossRef CAS PubMed.
- Y. Ge, Y. Hong, Z. Chenzi, Z. Gaolong, X. Lei, H. Lipeng, C. Xinbing, H. Chuanxin, N. Haoxiong and L. Quanbin, Energy Storage Sci. Technol., 2020, 9, 339 Search PubMed.
- G. Oh, M. Hirayama, O. Kwon, K. Suzuki and R. Kanno, Chem. Mater., 2016, 28, 2634–2640 CrossRef CAS.
- C. Wang, K. Fu, S. P. Kammampata, D. W. McOwen, A. J. Samson, L. Zhang, G. T. Hitz, A. M. Nolan, E. D. Wachsman and Y. Mo, Chem. Rev., 2020, 120, 4257–4300 CrossRef CAS PubMed.
- Q. Zhou, B. Xu, P. H. Chien, Y. Li, B. Huang, N. Wu, H. Xu, N. S. Grundish, Y. Y. Hu and J. B. Goodenough, Small Methods, 2020, 2000764 CrossRef CAS.
- Z. Deng, G. Sai Gautam, S. K. Kolli, J.-N. l Chotard, A. K. Cheetham, C. Masquelier and P. Canepa, Chem. Mater., 2020, 32, 7908–7920 CrossRef CAS.
- E. Zhao, Y. Guo, Y. Xin and G. Xu, Solid State Ionics, 2020, 356, 115454 CrossRef CAS.
- Z. Yang, H. Yuan, C. Zhou, Y. Wu, W. Tang, S. Sang and H. Liu, Chem. Eng. J., 2020, 392, 123650 CrossRef CAS.
- Z. D. Hood, H. Wang, A. Samuthira Pandian, J. K. Keum and C. Liang, J. Am. Chem. Soc., 2016, 138, 1768–1771 CrossRef CAS PubMed.
- D. Campanella, D. Belanger and A. Paolella, J. Power Sources, 2021, 482, 228949 CrossRef CAS.
- M. A. Marple, B. G. Aitken, S. Kim and S. Sen, Chem. Mater., 2017, 29, 8704–8710 CrossRef CAS.
- M. Tatsumisago, F. Mizuno and A. Hayashi, J. Power Sources, 2006, 159, 193–199 CrossRef CAS.
- J. Zhang, J. Han, J. Zhu, Z. Lin, M. H. Braga, L. L. Daemen, L. Wang and Y. Zhao, Inorg. Chem. Commun., 2014, 48, 140–143 CrossRef CAS.
- Y. Zhao and L. L. Daemen, J. Am. Chem. Soc., 2012, 134, 15042–15047 CrossRef CAS PubMed.
- K. T. Lai, I. Antonyshyn, Y. Prots and M. Valldor, J. Am. Chem. Soc., 2017, 139, 9645–9649 CrossRef CAS PubMed.
- Y. Yu, Z. Wang and G. Shao, J. Mater. Chem. A, 2019, 7, 10483–10493 RSC.
- F. Aguesse, W. Manalastas, L. Buannic, J. M. Lopez del Amo, G. Singh, A. Llordés and J. Kilner, ACS Appl. Mater. Interfaces, 2017, 9, 3808–3816 CrossRef CAS PubMed.
- S. Stegmaier, J. Voss, K. Reuter and A. C. Luntz, Chem. Mater., 2017, 29, 4330–4340 CrossRef CAS.
- M. Braga, J. A. Ferreira, V. Stockhausen, J. Oliveira and A. El-Azab, J. Mater. Chem. A, 2014, 2, 5470–5480 RSC.
- H. H. Heenen, J. Voss, C. Scheurer, K. Reuter and A. C. Luntz, J. Phys. Chem. Lett., 2019, 10, 2264–2269 CrossRef CAS PubMed.
- M. H. Braga, N. S. Grundish, A. J. Murchison and J. B. Goodenough, Energy Environ. Sci., 2017, 10, 331–336 RSC.
- A. Koedtruad, M. A. Patino, N. Ichikawa, D. Kan and Y. Shimakawa, J. Solid State Chem., 2020, 286, 121263 CrossRef CAS.
- Y. Kato, S. Hori, T. Saito, K. Suzuki, M. Hirayama, A. Mitsui, M. Yonemura, H. Iba and R. Kanno, Nat. Energy, 2016, 1, 1–7 Search PubMed.
- Y. Zhu, X. He and Y. Mo, ACS Appl. Mater. Interfaces, 2015, 7, 23685–23693 CrossRef CAS PubMed.
- G. Schwering, A. Hönnerscheid, L. van Wüllen and M. Jansen, ChemPhysChem, 2003, 4, 343–348 CrossRef CAS PubMed.
- I. Hanghofer, G. n J. Redhammer, S. Rohde, I. Hanzu, A. Senyshyn, H. M. R. Wilkening and D. Rettenwander, Chem. Mater., 2018, 30, 8134–8144 CrossRef CAS.
- A. Y. Song, Y. Xiao, K. Turcheniuk, P. Upadhya, A. Ramanujapuram, J. Benson, A. Magasinski, M. Olguin, L. Meda and O. Borodin, Adv. Energy Mater., 2018, 8, 1700971 CrossRef.
- J. A. Dawson, T. Famprikis and K. E. Johnston, J. Mater. Chem. A, 2021, 9, 18746–18772 RSC.
- X. Lü, J. W. Howard, A. Chen, J. Zhu, S. Li, G. Wu, P. Dowden, H. Xu, Y. Zhao and Q. Jia, Adv. Sci., 2016, 3, 1500359 CrossRef PubMed.
- D. Wang, Q. Sun, J. Luo, J. Liang, Y. Sun, R. Li, K. Adair, L. Zhang, R. Yang and S. Lu, ACS Appl. Mater. Interfaces, 2019, 11, 4954–4961 CrossRef CAS PubMed.
- T. Liu, Y. Zhang, X. Zhang, L. Wang, S.-X. Zhao, Y.-H. Lin, Y. Shen, J. Luo, L. Li and C.-W. Nan, J. Mater. Chem. A, 2018, 6, 4649–4657 RSC.
- E. Yi, H. Shen, S. Heywood, J. Alvarado, D. Y. Parkinson, G. Chen, S. W. Sofie and M. M. Doeff, ACS Appl. Energy Mater., 2020, 3, 170–175 CrossRef CAS.
- M. Dondelinger, J. Swanson, G. Nasymov, C. Jahnke, Q. Qiao, J. Wu, C. Widener, A. M. Numan-Al-Mobin and A. Smirnova, Electrochim. Acta, 2019, 306, 498–505 CrossRef CAS.
- Y. Xiao, K. Turcheniuk, A. Narla, A.-Y. Song, X. Ren, A. Magasinski, A. Jain, S. Huang, H. Lee and G. Yushin, Nat. Mater., 2021, 1–7 Search PubMed.
- K. Momma and F. Izumi, J. Appl. Crystallogr., 2011, 44, 1272–1276 CrossRef CAS.
- F. S. Lee and G. B. Carpenter, J. Phys. Chem., 1959, 63, 279–283 CrossRef CAS.
- G.-Q. Zhang, Z.-Y. Yao, J. Zhang, H.-B. Luo, Y.-R. Kong, Y. Zou, Z.-F. Tian and X.-M. Ren, J. Phys. Chem. C, 2021, 125, 7034–7043 CrossRef CAS.
- Y.-H. Li, Y. Liu, Y.-K. Guo, Y. Sun, M. Ji, Z.-L. You and Y.-L. An, Inorg. Chem., 2019, 58, 14289–14293 CrossRef CAS PubMed.
- A. Smirnova, M. Dondelinger and J. Swanson, US Pat., US 11276880 B2, 2021 Search PubMed.
- A. Ajovalasit, G. Petrucci and M. Scafidi, Exp. Mech., 2012, 52, 1057–1066 CrossRef.
- A. Ajovalasit, G. Petrucci and M. Scafidi, Exp. Tech., 2015, 39, 11–18 CrossRef.
- Z. Liu, Y. Tang, Y. Wang and F. Huang, J. Power Sources, 2014, 260, 264–267 CrossRef CAS.
- J. E. Schawe and J. F. Löffler, Nat. Commun., 2019, 10, 1–10 CrossRef CAS.
- L.-X. Yuan, Z.-H. Wang, W.-X. Zhang, X.-L. Hu, J.-T. Chen, Y.-H. Huang and J. B. Goodenough, Energy Environ. Sci., 2011, 4, 269–284 RSC.
- P. Tortorelli, J. DeVan and J. Selle, Corrosion in lithium-stainless steel thermal-convection systems, Oak Ridge National Lab., United States, 1980 Search PubMed.
- B. Mishra and D. L. Olson, Miner. Process. Extr. Metall. Rev., 2001, 22, 369–388 CrossRef CAS.
- X. Meng, M. Huang, C. Li, W. Xu, Z. Sun, Y. Qian, L. Li, X. Yuan, J. Huang and X. Gao, Nucl. Mater. Energy, 2020, 25, 100823 CrossRef.
Footnote |
| † Electronic supplementary information (ESI) available. See DOI: https://doi.org/10.1039/d2ma00512c |
| This journal is © The Royal Society of Chemistry 2022 |

