 Open Access Article
Preparation of artificial graphite coated with sodium alginate as a negative electrode material for lithium-ion battery study and its lithium storage properties†
Xianfa
Rao
acd,
Lixia
Zhang‡
b,
Baobao
Li‡
b,
Xinxiong
Zeng
b,
Wenlong
Xiao
b,
Yitao
Lou
b,
Huanmeng
Xie
b,
Huchen
Yan
b,
Zixuan
Yi
b and
Shengwen
Zhong
 *bd
*bd
aCollege of Resources and Environmental Engineering, Jiangxi University of Science and Technology, Ganzhou 341000, China
bDepartment of Materials Metallurgy Chemistry, Jiangxi University of Science and Technology, Ganzhou 341000, China. E-mail: zhongsw@jxust.edu.cn; Tel: +13979707564
cCollaborative Innovation Center of Rare and Rare Earth Resources Development and Utilization, Ministry of Education, Jiangxi University of Science and Technology, Ganzhou 341000, China
dJiangxi Key Laboratory of Power Battery and Materials, Jiangxi University of Science and Technology, Ganzhou 341000, China
First published on 4th October 2022
Abstract
In this paper, artificial graphite is used as a raw material for the first time because of problems such as low coulomb efficiency, erosion by electrolysis solution in the long cycle process, lamellar structure instability, powder and collapse caused by long-term embedment and release of lithium ions when it is used as a cathode material. The strategy of modifying a graphite anode with a sodium alginate (SA) coating was proposed and a 5.0% SA-1000 composite anode material was obtained. As a result of using sodium alginate (SA) to coat graphite particles, the SEI film formed was stable and compatible with electrolytes. One benefit of the coating is that it limits the amount of irreversible lithium consumed during film formation. Compared with artificial graphite, the first specific capacities of the initial charge and discharge (412.809 mA h g−1 and 472.067 mA h g−1) of the 5.0% SA-1000 composite anode material are significantly increased. Furthermore, the organic coating reduces the interface impedance between the electrolyte and the negative electrode. After 600 cycles, the reversible capacity of the composite remains at 48.298 mA h g−1, significantly improving the cyclic stability of graphite. On the other hand, the introduction of sodium alginate improved the migration of lithium ions inside and outside of the graphite, and the reversible capacity of the 5.0% SA-1000 composite sample is 461.197 mA h g−1, 444.457 mA h g−1, 386.633 mA h g−1, 304.794 mA h g−1, 140.846 mA h g−1 and 72.196 mA h g−1 at 100 mA g−1, 200 mA g−1, 300 mA g−1, 500 mA g−1, 1000 mA g−1 and 2000 mA g−1, respectively. When compared with graphite samples at the same magnification, 5.0% SA-1000 significantly improved its reversible capacity and stability, especially at 300 mA g−1 and 500 mA g−1. Its reversible capacities were increased by 196.911 mA h g−1 and 184.818 mA h g−1. Therefore, 5.0% SA-1000 composites make it possible to improve the lithium storage capacity of lithium-ion batteries.
1. Introduction
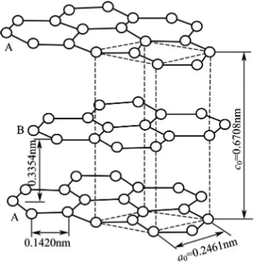
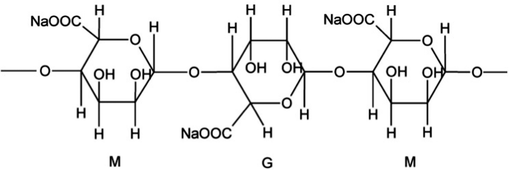
Recently, the production and storage of energy has become the most important issue in the world.1,2 In the field of energy storage, lithium-ion batteries are developing rapidly as a new type of energy conversion device.3–5 The electrode material is one of the most important factors in determining the performance of lithium-ion batteries;6–8 to meet the requirement of rapid charge and discharge of power batteries,9,10 the electrode material should have a good rate performance.11,12 The anode material plays a crucial role in the battery's performance due to its specific capacity and working voltage.13,14 The hexagonal arrangement of graphite sheets and the two-dimensional extension of graphite provide the cathode material with layers (Fig. 1). The special structure of carbon atoms in the crystal layer is hexagonal by covalent combination and there are van der Waals forces between the layers so that lithium ions can reversibly enter into the layers of graphite crystal. The reversible process makes graphite material also reversible so graphite occupies a dominant position among anode materials.15–17 At present, the preparation process of commercial graphite is mainly improved through spheroidization,18 coating19 and doping.20 Although the spheroidization process is relatively advanced, it is difficult to significantly improve graphite's rate properties. The doping process is difficult to control because of its elements and amounts. Therefore, spheroidization and doping have to be explored extensively in commercial production, causing difficulties for industrial applications. However, the coating process has been developed and it can improve commercial graphite's rate performance and cycle stability.21Sodium alginate (SA for short), which is made up of β-D-mannuronic acid and α-l-guluronic acid linked by a (1 → 4) bond (Fig. 2), has good chemical stability and antioxidant performance. Sodium alginate has been widely used in the fields of national defense, civil industry and medicine and it is used as a high-quality raw material for the production of high power and ultra-high power graphite electrodes, special graphite, lithium anode materials and high-end carbon products.22,23 The cyclic stability and rate properties of sodium alginate (SA) can be improved by coating with a modified anode material. However, SA has rarely been reported to have been used as an anode modification material.24
This study used commercial graphite as the raw material and sodium alginate was used as a coating material. To disperse the samples, magnetic stirring was used to stir them in the liquid phase under heat and then they were synthesized by firing them in a tubular furnace in a nitrogen environment.25 The composition and structure of the materials was analyzed by Brunauer–Emmett–Teller (BET) measurements, X-ray diffraction (XRD), Raman spectroscopy, scanning electron microscopy (SEM) and transmission electron microscopy (TEM) characterization. A constant current charge–discharge test, CV test, and EIS test were performed to study the effect of a sodium alginate coating on commercial graphite's performance.
2. Experimental section
2.1 Preparation of the sodium alginate coated graphite composite SA/G-C
• An electronic balance (BS224S, Xiamen Jing yi Xing ye Technology Co., Ltd) was used to accurately weigh 0.50 g of sodium alginate powder (Analytical Reagent, Shanghai Zhan yun Chemical Co., Ltd, molecular weight (198.11)n, CAS No. 9005-38-3). Then 9.50 g graphite powder (Analytical Reagent, Shenzhen Beitrui New Energy Materials Co., Ltd) was added to 100 mL deionized water (Analytical Reagent, made by lithium Laboratory of Jiangxi University of Science and Technology), which was placed on a magnetic stirrer (85-2 digital display constant temperature magnetic stirrer, Changzhou Yue xin Instrument Manufacturing Co., Ltd) and stirred mechanically under heat until the graphite was completely dispersed. It was then dried at room temperature to obtain the precursor powder and then the precursor was placed in a high-purity nitrogen atmosphere. The initial temperature was 25 °C and the heating rate was increased to 300 °C at 10 °C min−1 and then to 1000 °C at 30 °C min−1. The sample was kept at 1000 °C for 2 hours, cooled to room temperature naturally, then sieved to obtain the SA/G-C composite anode material samples. This process is illustrated in Fig. 3.3. Results and discussion
3.1 Structure and morphology analysis of the 5.0% SA-1000 composite and graphite samples
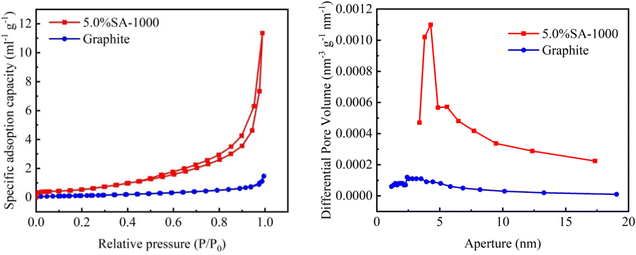
Through surface adsorption experiments of different electrode materials, a series of physical properties such as specific surface area (Fig. 4), total pore volume and average pore diameter of the composite material 5.0% SA-1000 and graphite samples were tested (Table 1).| Sample | Surface area (m2 g−1) | Pore volume (cm3 g−1) | Pore diameter Dv (d) (nm) |
|---|---|---|---|
| 5.0% SA-1000 | 3.686 | 0.018 | 3.068 |
| Graphite | 0.50 | 0.0023 | 18.54 |
The 5.0% SA-1000 sample has a porous structure, resulting in a total pore volume of 0.018 cm3 g−1, which is much larger than the total pore volume of traditional commercial graphite samples of 0.0023 cm3 g−1. Its smaller average pore diameter (3.068 nm) is the key to forming a fluffy structure, which results in a larger specific surface area and more exposed active sites. The specific surface area of the 5.0% SA-1000 sample is 3.686 m2 g−1, while that of the traditional commercial graphite sample is only 0.50 m2 g−1. The 5.0% SA-1000 composite sample with a larger surface volume will be more favorable for improving the lithium storage performance of lithium-ion batteries.
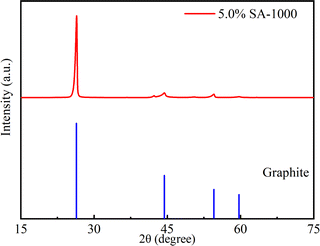
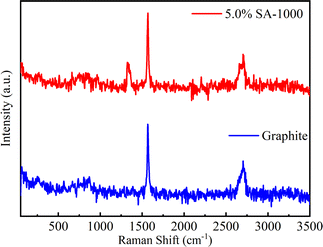
We further confirmed this result by examining the XRD diffraction patterns of the 5.0% SA-1000 composite and commercial graphite samples. The XRD results (Fig. 5) show that the crystalline structure of 5% SA-1000 is obviously weaker than the graphite and the Raman results (Fig. 6) also show the weakening of the crystalline structure and the increase in disorder. In contrast, the (002) crystal plane diffraction peaks of the 5.0% SA-1000 composite are very sharp, indicating that the preparation of the composite anode material has a high graphitization degree so that it will have a high initial charge–discharge capacity.
Raman spectroscopy analysis of the order degree of the 5.0% SA-1000 composite material and graphite sample was conducted to further explore the existing forms of various elements after SA-coated graphite and to analyze the modification mechanism (Fig. 6). For the graphite samples, a typical G-band at 1568.63 cm−1 and a 2D band at 2703.66 cm−1, a typical G-band was observed, corresponding to the sp2 hybrid structure of ordered graphite, which further indicated that the graphite is composed of layered ordered materials. However, for the 5.0% SA-1000 composite sample, the two typical D-band peaks at 1325.41 cm−1 correspond to the sp3 hybridization of the disordered state and the G-band peak at 1568.63 cm−1 corresponds to the sp2 hybridization of ordered graphite structure. There is a 1.13 intensity ratio between the D-band peak and the G-band peak and the area ratio is 2.25, indicating that 5.0% SA-1000 contains disordered sp3 hybrid carbon and graphite-like sp2 hybrid carbon, in which the disordered amorphous state is dominant. Consequently, the hybrid structure of the 5.0% SA-1000 composite material is more effective at accelerating faster diffusion and improving the rate performance of the lithium-ion battery.
SEM characterization was conducted to investigate further the structural difference between the 5.0% SA-1000 composite and graphite sample (Fig. 7). As shown in (Fig. 7a–c), the graphite samples are regular spherical particles with smooth surfaces and no adhesion between each other. Fig. 7(d–f) shows that the surface of the 5.0% SA-1000 composite sample is relatively fluffy and the grains are closer together, which is caused by the viscous sodium alginate wrapped around the graphite surface. We speculate that this is also the primary reason why the specific surface area of the 5.0% SA-1000 composite sample increased slightly after coating.
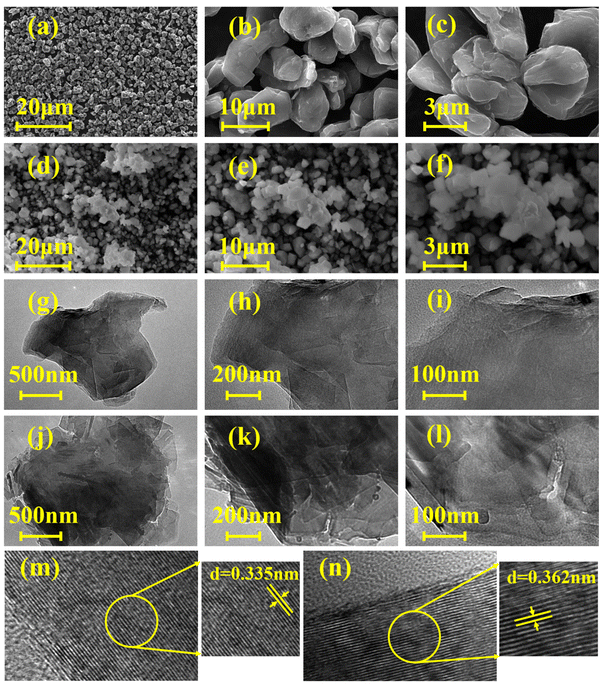 | ||
| Fig. 7 Electron microscopy images of the 5.0% SA-1000 composite and graphite samples (a–f) SEM and (g–n) TEM. | ||
Further exploration of the material's crystal structure was performed with transmission electron microscopy (TEM) of the samples with a concentration of 5.0% SA-1000 and raw graphite (Fig. 7g–n). A TEM image of graphite specimens reveals a high degree of crystallinity and an orderly and regular lamellar structure, as shown in (Fig. 7g–i), showing regular lattice stripes of 0.335 nm. However, for the 5.0% SA-1000 sample, it was observed that the fringes are curved and disordered, as shown in Fig. 7j–l, indicating that they are stacked together and disordered. A material with an isotropic microstructure is more conducive to the rapid transport of lithium ions since it can facilitate the smooth embedding and expulsion of lithium ions. In addition, Fig. 7m and n shows that the layer spacing of the 5.0% SA-1000 sample is 0.362 nm, which is larger than the layer spacing of graphite (0.335 nm), indicating that the 5.0% SA-1000 electrode is more conducive to the rapid insertion and removal of lithium ions, so it will have better rapid charging and discharging performance than the graphite electrode.
3.2 Electrochemical performance analysis of the 5.0% SA-1000 composite material and graphite sample
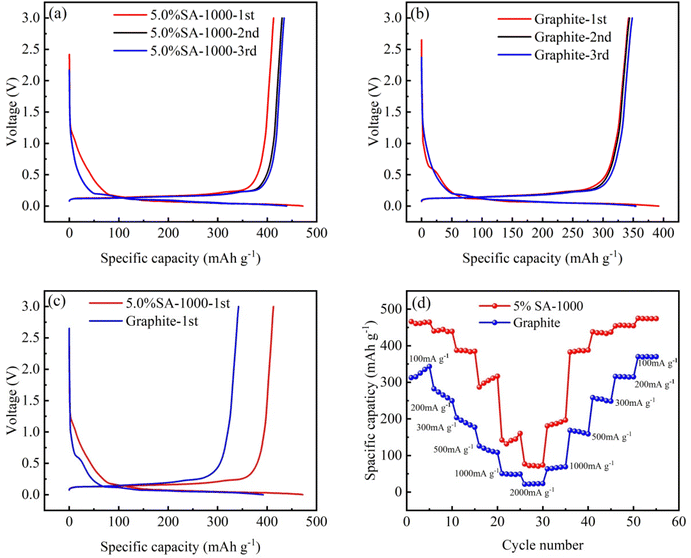
Using the charge–discharge specific capacity of the 5.0% SA-1000 composite sample and graphite (Table 2) and the charge–discharge curve distribution (Fig. 8a and b), the charge–discharge curve of the first circle (Fig. 8c) is further compared. After coating, the initial discharge specific capacity of 5.0% SA-1000 increases from 392.159 mA h g−1 to 472.067 mA h g−1 and the specific capacity of 5.0% SA-1000 increases from 342.306 mA h g−1 to 412.809 mA h g−1. The first Coulomb efficiency increased by 0.16% (87.287% → 87.447%). Similar to the SA-1000 composite material, 5.0% SA-1000 has a greater capacity and Coulomb efficiency in subsequent cycles of 2–3 curves. Additionally, the 5.0% SA-1000 composite material has improved electrochemical activity because of its low impedance.26,27 Due to its specific capacity and Coulomb efficiency, sodium alginate effectively improves the graphite electrodes.| Sample | First specific charge capacity (mA h g−1) | First specific discharge capacity (mA h g−1) | Charge–discharge efficiency (%) |
|---|---|---|---|
| 5% SA-1000 | 412.809 | 472.067 | 87.447 |
| Graphite | 342.306 | 392.159 | 87.287 |
Subsequently, we tested the rate performance of the composite sample 5.0% SA-1000 and graphite sample under different current densities (Fig. 8d). It can be seen from the curve that the reversible capacity of the 5.0% SA-1000 composite sample is 461.197 mA h g−1, 444.457 mA h g−1, 386.633 mA h g−1, 304.794 mA h g−1, 140.846 mA h g−1 and 72.196 mA h g−1 at 100 mA g−1, 200 mA g−1, 300 mA g−1, 500 mA g−1, 1000 mA g−1 and 2000 mA g−1. Compared with the graphite sample at the same magnification, its stability was significantly improved, especially at 300 mA g−1 and 500 mA g−1 magnification. The reversible capacities were increased by 196.911 mA h g−1 and 184.818 mA h g−1. The increased rate performance is attributed to the graphite coating with sodium alginate reducing the electrochemical impedance of the composite.28 Additionally, the Li+ rapid inlay is made possible by combining the SA-1000 composite material with electrolyte at 5.0% SA.29,30 Therefore, the 5.0% SA-1000 composite material has better magnification performance at higher magnification.
In order to study the cyclic stability of the 5.0% SA-1000 composite samples, we tested the cyclic performance curves (Fig. 9) at a low magnification of 500 mA g−1 (Table 3) and a high magnification of 4000 mA g−1 (Table 4). The results show that the initial specific capacity of the 5.0% SA-1000 composite sample is 575.439 mA h g−1. The capacity retention rate is as high as 97.90% after 100 cycles at a low rate of 50 mA g−1, which is much higher than the initial specific capacity of 276.561 mA h g−1 and capacity retention rate of 54.14% of graphite. Especially at the high rate of 4000 mA g−1 current density, the initial specific capacity of graphite is very low, only 35.362 mA h g−1, and its function basically fails. However, the initial specific capacity of the 5.0% SA-1000 composite samples at 4000 mA g−1 was still maintained at 45.552 mA h g−1. Even after 600 cycles, the initial specific capacity remained at 48.298 mA h g−1. It can be concluded that the 5.0% SA-1000 composite sample can show better cyclic stability and a higher capacity retention rate, mainly because the coating layer of the composite sample contributes to the stable SEI film formed in the process of lithium embedding for the first time,31,32 which keeps the structure stable and improves the cyclic stability.33,34 Therefore, 5.0% SA-1000 has a significant advantage in the long cycle as the anode material of lithium-ion batteries.
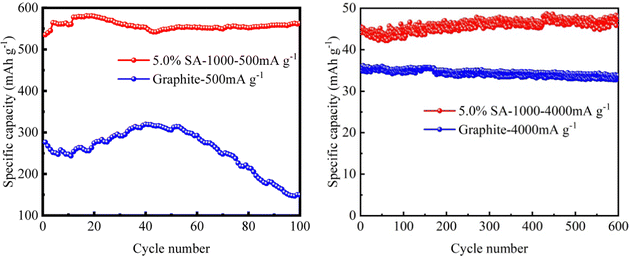 | ||
| Fig. 9 The cyclic properties of the 5.0% SA-1000 composite and graphite samples (a) 500 mA g−1 and (b) 4000 mA g−1. | ||
| Sample | First specific charge capacity (mA h g−1) | 100th specific charge capacity (mA h g−1) | Capacity retention (%) |
|---|---|---|---|
| 5% SA-1000 | 575.439 | 563.359 | 97.90 |
| Graphite | 276.561 | 149.731 | 54.14 |
| Sample | First specific charge capacity (mA h g−1) | 600th specific charge capacity (mA h g−1) | Capacity retention (%) |
|---|---|---|---|
| 5% SA-1000 | 45.552 | 48.298 | 106.03 |
| Graphite | 35.362 | 32.891 | 90.49 |
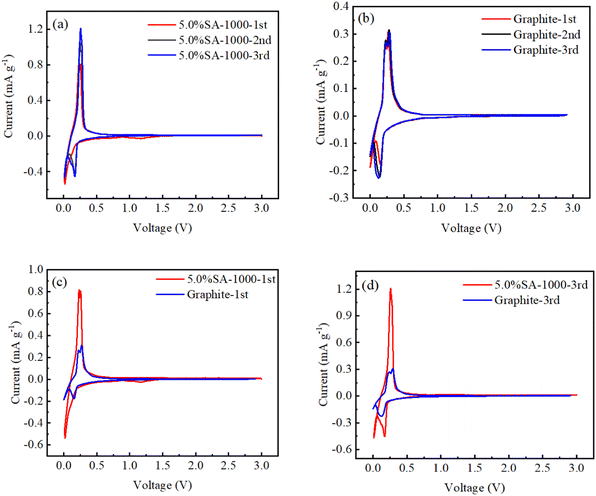
The cyclic voltammetry curves of graphite and 5.0% SA-1000 samples were compared before and after coating to study the modification mechanism (Fig. 10). For the 5.0% SA-1000 composite samples, the reduction peaks at 0.01, 0.07 and 0.18 V correspond to Li+ embedding in the graphite layer. In comparison, the SEI of the 5.0% SA-1000 composite sample formed a lower electrical potential than that of the graphite sample (Fig. 10a), indicating that the CV curve was consistent with the microstructure of the material, which was confirmed by the XRD emission pattern and Raman spectroscopy confirmed that the 5.0% SA-1000 composite sample is composed of an internal ordered lamellar structure and an external amorphous structure. In contrast, the graphite sample has two sharp redox peaks at 0.26 V and 0.11 V, representing the insertion and extraction of the ordered graphite lamellar structure, respectively (Fig. 10b). Additionally, it is apparent from the CV curves of the front and rear circles (Fig. 10c and d) that the cyclic voltammetry curves of the 5.0% SA-1000 composite samples are larger than those of the graphite samples, indicating that the 5.0% SA-1000 composite samples will generate a larger battery capacity.
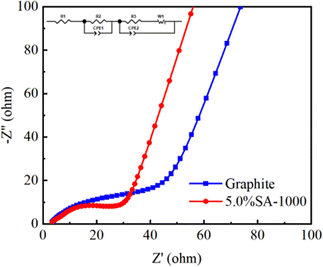
An EIS graph test was conducted to determine whether coating modification reduced the composite's electrochemical impedance (Fig. 11). The graphite sample and composite sample with 5.0% SA-1000 exhibit a similar shape composed of two semicircles.35 At the 50% charged state, the charge transfer impedance36 and diffusion transfer impedance37 are both lower than those of the graphite samples as determined by the fitting calculation, indicating that the coating process reduces the charge transfer resistance of materials38 and promotes the migration and diffusion of lithium ions.39 Therefore, the 5.0% SA-1000 composite sample has a better rate performance than the graphite sample.
4. Conclusions
This paper reports the preparation of a 5.0% SA-1000 composite material by magnetic stirring, heating and mixing with deionized water, air drying and sintering at 1000 °C. After magnetic stirring and heating, drying to get a dispersed powder, and sintering under a nitrogen environment at 1000 °C to remove the crystal water in the composite, the 5.0% SA-1000 composite material was obtained. From the analysis of the whole paper, the following conclusions can be drawn:(1) Compared with SA-800 and SA-1100, SA-1000 has a higher specific charge and discharge capacity. After 200 cycles, the capacity retention rate of SA-1000 is 84.73%.
(2) The reversibility of 2.5% SA-1000 and 7.5% SA-1000 during the first charge and discharge process is poor and below 80%, while 5.0% SA-1000 and 10% SA-1000 are above 87% when sodium alginate is coating the graphite in different proportions. In the process of converting chemical energy into electrical energy, the conversion rate is better.
(3) Compared with graphite, 5.0% SA-1000 has a larger specific surface area and is more favorable for the lithium storage performance of lithium-ion batteries. From the perspective of multiplier performance, at 300 mA g−1 and 500 mA g−1, the reversible capacities were increased by 196.911 mA h g−1 and 184.818 mA h g−1, 5.0% SA-1000 has advantages over graphite, which can be used in high-rate fast charging battery systems.
(4) In addition, 5.0% SA-1000 has more advantages in initial capacity and cycle performance, and the specific capacity of the first discharge is increased by 79.908 mA h g−1 after 600 cycles. The capacity remains 48.298 mA h g−1. From the perspective of battery life, it has more application value.
In the later stage of this study, further research will be conducted to explore more advanced production technology for industrial applications to serve society and to obtain broad application prospects in the field of batteries.
Author contributions
Xianfa Rao: Conceptualization, resources, methodology, project administration. Lixia Zhang: validation, form analysis, writing-original draft, writing-review & editing. Baobao Li: data curation, curation, investigation, validation. Xinxiong Zeng: form analysis, data curation. Wenlong Xiao: curation, visualization. YitaoLou: investigation, supervision. Huanmeng Xie: software, visualization. Huchen Yan: resources, visualization. Zixuan Yi: validation, supervision. Shengwen Zhong: conceptualization, funding acquisition.Conflicts of interest
The authors declare that they have no known competing financial interests or personal relationships that could have appeared to influence the work reported in this paper.Acknowledgements
The authors acknowledge the support from National Natural Science Foundation of China, No. 21762019; Science and Technology Project of Education, Department of Jiangxi Province, No. GJJ190427; Project of Ganzhou Innovative Leading Talents Program (GanKefa [2020] No. 60); Doctoral Research Start-Up Fund of Jiangxi University of Science and Technology, Jiangxi University of Science and Technology; and 2022 Postgraduate Innovation and Entrepreneurship Quality Improvement Project (2022YCTSOO5).References
- L. Li, X. Lin and Y. Zhang, et al., Characteristics of the mesophase and needle coke derived from the blended coal tar and biomass tar pitch, J. Anal. Appl. Pyrolysis, 2020, 150, 104889 CrossRef CAS.
- J. Cheng, Z. Lu and X. Zhao, et al., Green needle coke-derived porous carbon for high-performance symmetric supercapacitor, J. Power Sources, 2021, 494, 229770 CrossRef CAS.
- Z. Zhang, B. Lou and N. Zhao, et al., Co-carbonization behavior of the blended heavy oil and low temperature coal tar for the preparation of needle coke, Fuel, 2021, 302, 121139 CrossRef CAS.
- L. I. U. Jie, X. Shi and L. Cui, et al., Effect of raw material composition on the structure of needle coke, J. Fuel Chem. Technol., 2021, 49(4), 546–553 CrossRef.
- S. Yang, C. Zhang and J. Jiang, et al., Review on state-of-health of lithium-ion batteries: Characterizations, estimations and applications, J. Cleaner Prod., 2021, 314, 128015 CrossRef CAS.
- Y. Wang and G. Cao, Developments in nanostructured cathode materials for high-performance lithium-ion batteries, Adv. Mater., 2008, 20(12), 2251–2269 CrossRef CAS.
- W. Xie, X. Liu and R. He, et al., Challenges and opportunities toward fast-charging of lithium-ion batteries, J. Energy Storage, 2020, 32, 101837 CrossRef.
- X. Y. Guo, Y. J. Mao and C. H. Yu, et al., Polythiopene/copper bismuthate nanosheet nanocomposites modified glassy carbon electrode for electrochemical detection of benzoic acid, Int. J. Electrochem. Sci., 2020, 15, 10463–10475 CrossRef.
- J. L. Tirado, Inorganic materials for the negative electrode of lithium-ion batteries: state-of-the-art and future prospects, Mater. Sci. Eng., R, 2003, 40(3), 103–136 CrossRef.
- R. Boppana, G. K. Mohan and U. Nayak, et al., Novel pH-sensitive IPNs of polyacrylamide-g-gum ghatti and sodium alginate for gastro-protective drug delivery, Int. J. Biol. Macromol., 2015, 75, 133–143 CrossRef CAS PubMed.
- S. Yang, H. Song and X. Chen, Nanosized tin and tin oxides loaded expanded mesocarbon microbeads as negative electrode material for lithium-ion batteries, J. Power Sources, 2007, 173(1), 487–494 CrossRef CAS.
- T. Abe, H. Fukuda and Y. Iriyama, et al., Solvated Li-ion transfer at interface between graphite and electrolyte, J. Electrochem. Soc., 2004, 151(8), A1120 CrossRef CAS.
- M. Shi, C. Song and Z. Tai, et al., Coal-derived synthetic graphite with high specific capacity and excellent cyclic stability as anode material for lithium-ion batteries, Fuel, 2021, 292, 120250 CrossRef CAS.
- J. Wang, M. Chen and C. Wang, et al., Amphiphilic carbonaceous material modified graphite as anode material for lithium-ion batteries, Mater. Lett., 2010, 64(21), 2281–2283 CrossRef CAS.
- L. Xia, H. Huang and Z. Fan, et al., Hierarchical macro-/meso-/microporous oxygen-doped carbon derived from sodium alginate: a cost-effective biomass material for binder-free supercapacitors, Mater. Des., 2019, 182, 108048 CrossRef CAS.
- P. U. Nzereogu, A. D. Omah and F. I. Ezema, et al., Anode materials for lithium-ion batteries: a review, Appl. Surf. Sci. Adv., 2022, 9, 100233 CrossRef.
- S. F. Souza, E. R. Silva and W. A. Alves, Nanostructured antigen-responsive hydrogels based on peptides for leishmaniasis detection, J. Braz. Chem. Soc., 2017, 28, 1619–1629 CAS.
- X. Ma, Z. Lei and C. Wang, et al., Fabrication of P-doped Co9S8/g-C3N4 heterojunction for excellent photocatalytic hydrogen evolution, Int. J. Hydrogen Energy, 2021, 46(74), 36781–36791 CrossRef CAS.
- S. F. Souza, E. R. Silva and W. A. Alves, Nanostructured antigen-responsive hydrogels based on peptides for leishmaniasis detection, J. Braz. Chem. Soc., 2017, 28, 1619–1629 CAS.
- S. Dai, Y. Chu and D. Liu, et al., Intrinsically ionic conductive cellulose nanopapers applied as all solid dielectrics for low voltage organic transistors, Nat. Commun., 2018, 9(1), 1–10 CrossRef CAS PubMed.
- C. M. Boutry, L. Beker and Y. Kaizawa, et al., Biodegradable and flexible arterial-pulse sensor for the wireless monitoring of blood flow, Nat. Biomed. Eng., 2019, 3(1), 47–57 CrossRef CAS PubMed.
- Z. Z. Li, Z. Y. Yan and J. Q. Xu, et al., Flexible and degradable resistive switching memory fabricated with sodium alginate, Chin. Phys. B, 2021, 30(4), 047302 CrossRef CAS.
- Y. Lin, H. Y. Xu and Z. Q. Wang, et al., Transferable and flexible resistive switching memory devices based on PMMA films with embedded Fe3O4 nanoparticles, Appl. Phys. Lett., 2017, 110(19), 193503 CrossRef.
- Z. Z. Li, Z. Y. Yan and J. Q. Xu, et al., Flexible and degradable resistive switching memory fabricated with sodium alginate, Chin. Phys. B, 2021, 30(4), 047302 CrossRef CAS.
- K. X. Shi, H. Y. Xu and Z. Q. Wang, et al., Improved performance of Ta2O5−x resistive switching memory by Gd-doping: Ultralow power operation, good data retention, and multilevel storage, Appl. Phys. Lett., 2017, 111(22), 223505 CrossRef.
- H. Wang, B. Zhu and X. Ma, et al., Physically transient resistive switching memory based on silk protein, Small, 2016, 12(20), 2715–2719 CrossRef CAS PubMed.
- X. He, J. Zhang and W. Wang, et al., Transient resistive switching devices made from egg albumen dielectrics and dissolvable electrodes, ACS Appl. Mater. Interfaces, 2016, 8(17), 10954–10960 CrossRef CAS PubMed.
- Y. Guo, W. Hu and F. Zeng, et al., Ultrafast degradable resistive switching memory based on α-lactose thin films, Org. Electron., 2020, 83, 105750 CrossRef CAS.
- J. Xu, X. Zhao and Z. Wang, et al., Biodegradable natural pectin-based flexible multilevel resistive switching memory for transient electronics, Small, 2019, 15(4), 1803970 CrossRef PubMed.
- W. Hu, J. Jiang and D. Xie, et al., Transient security transistors self-supported on biodegradable natural-polymer membranes for brain-inspired neuromorphic applications, Nanoscale, 2018, 10(31), 14893–14901 RSC.
- M. K. Kim and J. S. Lee, Short-term plasticity and long-term potentiation in artificial biosynapses with diffusive dynamics, ACS Nano, 2018, 12(2), 1680–1687 CrossRef CAS PubMed.
- F. N. Jumaah, N. N. Mobarak and A. Ahmad, et al., Derivative of iota-carrageenan as solid polymer electrolyte, Ionics, 2015, 21(5), 1311–1320 CrossRef CAS.
- X. Ma, Z. Lei and C. Wang, et al., Fabrication of P-doped Co9S8/g-C3N4 heterojunction for excellent photocatalytic hydrogen evolution, Int. J. Hydrogen Energy, 2021, 46(74), 36781–36791 CrossRef CAS.
- Y. Lin, H. Y. Xu and Z. Q. Wang, et al., Transferable and flexible resistive switching memory devices based on PMMA films with embedded Fe3O4 nanoparticles, Appl. Phys. Lett., 2017, 110(19), 193503 CrossRef.
- K. Kataoka, Y. Suzuki and M. Kitada, et al., Alginate, a bioresorbable material derived from brown seaweed, enhances elongation of amputated axons of spinal cord in infant rats, J. Biomed. Mater. Res., 2001, 54(3), 373–384 CrossRef CAS PubMed.
- T. Klekiel, A. Mackiewicz and A. Kaczmarek-Pawelska, et al., Novel design of sodium alginate based absorbable stent for the use in urethral stricture disease, J. Mater. Res. Technol., 2020, 9(4), 9004–9015 CrossRef CAS.
- Z. Z. Li, Z. Y. Yan and J. Q. Xu, et al., Flexible and degradable resistive switching memory fabricated with sodium alginate, Chin. Phys. B, 2021, 30(4), 047302 CrossRef CAS.
- M. K. Kim and J. S. Lee, Short-term plasticity and long-term potentiation in artificial biosynapses with diffusive dynamics, ACS Nano, 2018, 12(2), 1680–1687 CrossRef CAS PubMed.
- F. N. Jumaah, N. N. Mobarak and A. Ahmad, et al., Derivative of iota-carrageenan as solid polymer electrolyte, Ionics, 2015, 21(5), 1311–1320 CrossRef CAS.
Footnotes |
| † Electronic supplementary information (ESI) available. See DOI: https://doi.org/10.1039/d2ma00820c |
| ‡ These authors contributed equally to this work. |
| This journal is © The Royal Society of Chemistry 2022 |

