 Open Access Article
Design of an experimental study of high through-plane thermal conductivity hybrid epoxy composite insulation with superior dielectric strength†
Hiep Hoang
Nguyen
 ab,
Antigoni
Konstantinou
b,
Yifei
Wang
 b,
JoAnne
Ronzello
b,
Kerry
Davis
b,
JoAnne
Ronzello
b,
Kerry
Davis
 b and
Yang
Cao
 *ab
*ab
aElectrical and Computer Engineering, University of Connecticut, 371 Fairfield Way, Storrs, CT 06269, USA. E-mail: yang.cao@uconn.edu
bElectrical Insulation Research Center, Institute of Materials Science, University of Connecticut, 97 North Eagleville Road, Storrs, CT 06269, USA
First published on 26th July 2022
Abstract
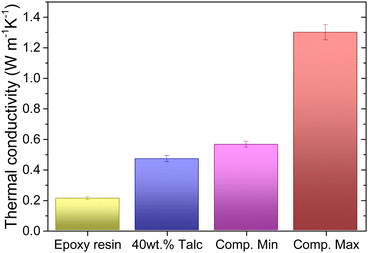
Thermally conductive polymers are highly desired as electrical insulation materials in power-electronic and electrical machines toward high power density and payload efficiencies. This paper investigates the thermal conductivity of hybrid epoxy composites containing talc nanoclay, boron nitride (BN) clusters, and zinc oxide (ZnO) particles using the Design of Experiment (DoE) approach. A statistical model of the composite thermal conductivity based on the compositions of the components has been established with an R-squared of 98.17%. The effects of shapes, sizes, filler thermal conductivity, and the structured network of the fillers are discussed. The structured edge-connecting BN nanosheets endowed in nanostructured BN-clusters play a critical role in composite thermal conductivity enhancement. The thermal conductivity with the optimized formulation could reach 1.3 W m−1 K−1, which is 6× higher than that of neat epoxy resin, while maintaining superior dielectric properties. The results of DoE analysis can be widely applied to the design of polymer composites with optimal formulations.
1. Introduction
Epoxy resin is widely used in electrical and electronic industries, in electrical apparatus and devices, electronic packaging, batteries, etc., due to its excellent electrical insulation characteristics, light weight, excellent thermal-, mechanical-, and chemical-resistance, good adhesion, and easy processing.1–4 In addition to serving as electrical insulation which electrically isolates the current-carrying conductors to grounded parts, epoxy resin is also a medium for heat dissipation from the conductors which are the main heat source in the devices. However, epoxy resin is limited by its low thermal conductivity of only ∼0.2 W m−1 K−1.Effective heat dissipation is critical to the power handling capacity, reliability, and life expectancy of the devices. It has been demonstrated that by enhancing the thermal conductivity of the groundwall insulation material of rotating machines from 0.2 W m−1 K−1 to 0.7 W m−1 K−1, the maximum temperature of the copper conductors drops by 40 °C and a significant 26% increase in power density can be achieved.5,6 Additionally, the operating temperature seriously impacts the device lifetime. When the operating temperature decreases by 10 °C, the life expectancy of the insulation systems can be 2× longer.7
To achieve high thermal conductivity, developing advanced composites by introducing thermally conductive fillers into an epoxy matrix is an effective way. High thermally conductive fillers include metals (aluminum, silver, iron, copper, and gold/palladium),8,9 ceramics (silicon carbide, magnesium oxide, alumina, zinc oxide, boron nitride, nanoclays, and aluminum nitride),10–14 and carbon-based materials (graphite, carbon nanotubes, and carbon black).15–17 Unlike metallic particles and carbon based materials which could lead to a high electrical conductivity of the nanocomposites, ceramic materials possessing excellent electrical insulation properties become good candidates for electrical insulation applications.18–20 In recent years, two-dimensional (2D) nanoclay is widely used in dielectric applications, offering enhanced discharge resistance, dielectric properties, mechanical properties, low cost, and commercial availability.20,21 BN is also a platelet-like material, commonly used in various critical industrial applications owing to its high thermal conductivity, low dielectric loss, and high lubriciousness. However, nanoclays and BN platelets suffered from anisotropic thermal conductivity. For example, while the in-plane thermal conductivity of hexagonal BN (hBN) was estimated to be 300–550 W m−1 K−1,22 or 751 W m−1 K−1 for one-atom-thin hexagonal BN,23 the through-plane thermal conductivity is only 2–3 W m−1 K−1.17 Therefore, the composite thermal conductivity will largely depend on the orientation of the platelets. To take the advantage of high in-plane thermal conductivity and improve the isotropic thermal conductivity of hBN, structured spherical BN clusters were developed by bonding multiple hBN platelets at their edges in random directions to increase the effective conduction path in all directions.24–26
It shall be noted that structure/composition engineering plays a crucial role, as the combination of various fillers may lead to synergistic, antagonistic, or insignificant effects on the effective thermal conductivity of the composite. Also, in various applications, it is of great importance to acquire a range of filler contents that offer a targeted composite thermal conductivity value so that other properties can be tuned and achieved accordingly. Using a mixture Design of Experiment (DoE) for systematically seeking the relationships between multiple variables and output responses has been demonstrated to be an effective and adequate method with minimum time, labor, and resources.27–32
In this paper, the thermal conductivity of hybrid epoxy composites designed for high torque density propulsion motors that compose 2D nanoclays, spherical BN cluster particles, and hexagonal prism ZnO particles is studied. Through the mixture DoE, the effects of content, the shape, size, the thermal conductivity of each filler, and the possible interactions between two components on the composite thermal conductivity are statistically investigated. Moreover, to elucidate the effectiveness of the structured thermally conductive paths endowed in edge-connecting BN clusters, an epoxy composite with homogeneously dispersed BN platelets is studied as a reference. The heat transport mechanism in the two cases is studied using the theoretical Agari–Uno model. Finally, the dielectric breakdown strength, dielectric constant, and dissipation factor of the designed composites are evaluated to examine their dielectric performances.
2. Materials and methodology
2.1 Materials
For the preparation of composites, epoxy resin (Bisphenol A-Epichlorohydrin/Phenol – Formaldehyde, provided by VonRoll USA) was used as the base polymer. This is a high-performance one-part epoxy resin, specifically designed for groundwall insulation of large motors and generators. Ultrafine nanoclay with a 2D layered crystalline structure was provided by IMERY. ZnO particles were purchased from G.H. Chemicals. Specially treated BN cluster particles, designed to significantly increase the thermal conductivity of the composite, were provided by Momentive. The BN platelet powders with a dimension of 800 nm were purchased from US Research Nanomaterials, Inc. The properties of epoxy resin and fillers are listed in Table 1.| Components | Average particle size (μm) | Theoretical density (g cm−3) | Thermal conductivity (W m−1 K−1) |
|---|---|---|---|
| Epoxy resin | N/A | 1.2 | ∼0.2 |
| Talc nanoclay | 2 | 2.76 | 10.69 (λ||) |
| 1.76 (λ⊥) | |||
| BN cluster | 60 | 2.1 | 300–550 (λ||) |
| BN platelet | 0.8 | 2–3 (λ⊥) | |
| ZnO | 0.3–1 | 5.61 | 50 |
2.2 Sample preparation and experimental procedure
Prior to processing, all fillers were pre-dried at 140 °C for 12 hours to remove residual moisture. The fillers were mixed in the epoxy matrix by a high shear planetary centrifugal Thinky® mixer. The degassing of the mixture was carried out at the same time under a vacuum of 30 kPa. After mixing, the homogeneous, bubble-free mixture was cast in circular molds with a diameter of 5 cm by the natural flowing method, which was then cured in a convection oven. In the curing process, the temperature was incrementally increased up to 160 °C with an average ramping rate of 1 °C min−1, then kept isothermally at 160 °C for 12 hours, followed by natural cooling down to room temperature. The solid-state samples obtained after curing were then machined down to a thickness of 5 mm for thermal conductivity measurements and a thinner thickness for electrical testing.2.3 Scanning electron microscopy
The morphologies of the fillers and the distribution of the fillers in the epoxy composite were characterized with Teneo LV Scanning Electron Microscopy (SEM). To reveal the elemental composition, Energy Dispersive X-Ray spectroscopy (EDX) coupled with SEM was implemented. To avoid the charge accumulation which affects the SEM image quality, a thin layer of Au/Pd (thickness of ∼3 nm) was sputter-coated on the sample, which was grounded by a copper tape.2.4 Thermal conductivity measurement
The thermal conductivity measurement was conducted using the TA DTC-300 according to the ASTM E1530 standard. The measurement principle is based on the guarded hot plate method. The sample is placed between two polished metal surfaces, each controlled at a different temperature. While the temperature of one metal surface is set lower than the sample temperature by 15 °C, that of the other is higher by 15 °C. The thermal conductivity is determined by dividing the temperature difference across the sample along with the output from the heat flux transducer by the sample thickness.33To minimize the thermal contact resistance between the measured sample and measuring surfaces, a thin layer of thermally conductive compound is applied on both sides of the sample, which is under a pneumatic compressive load of 20 psi.
2.5 Mixture design of the experiment
To systematically investigate the relationship and establish a statistical model between the concentration of the components in wt% as input variables and the composite thermal conductivity as an output response, mixture DoE was implemented using a Minitab software tool package.The mixture contains epoxy resin as the polymer matrix and three functional fillers, including 2D nanoclay, BN cluster particles, and ZnO particles. From the screening experimentations, the constraints are set on each component to ensure all desired properties be met. Therefore, an extreme vertices mixture,34 in which the designed points cover only an appropriate sub-portion of interest, was implemented with a degree of 2. In the mixture, the amount of epoxy resin – X1 (wt%), talc – X2 (wt%), BN cluster particles – X3 (wt%), and ZnO – X4 (wt%) was determined as follows:
| 60 ≤ X1 ≤ 75 | (1) |
| 20 ≤ X2 ≤30 | (2) |
| 5 ≤ X3 ≤ 20 | (3) |
| 0 ≤ X4 ≤ 15 | (4) |
| 25 ≤ X2 + X3 + X4 ≤ 40 | (5) |
In the mixture design, the sum of X1 + X2 + X3 + X4 is always 1 (or 100 wt%). The lower constraint of the total percentage of the fillers in eqn (5) was set at 25 wt% to maximize the advantage of functional fillers on the epoxy composite properties. The upper limit is 40 wt% to ensure satisfactory sample processing quality and reproductivity. A higher concentration of the fillers could increase the viscosity of the mixture, which aggravates the mixing process and leads possibly to the formation of cracks after curing.
The design space, generated by Minitab, contains 22 formulations. Specimens of each formulation were fabricated according to the procedure presented in the previous section. After mixing and curing, the thermal conductivity of each formulation was measured in accordance with the ASTM E1530 standard. The experimental results of the thermal conductivity measurements were then fed into the DoE analysis, in which a mathematical relationship between the thermal conductivity and the weight percentage of the fillers can be statistically established by the use of multiple regressions and analysis of variances (ANOVA).
3. Results and discussion
3.1 Morphology of fillers and dispersion of fillers in the epoxy matrix
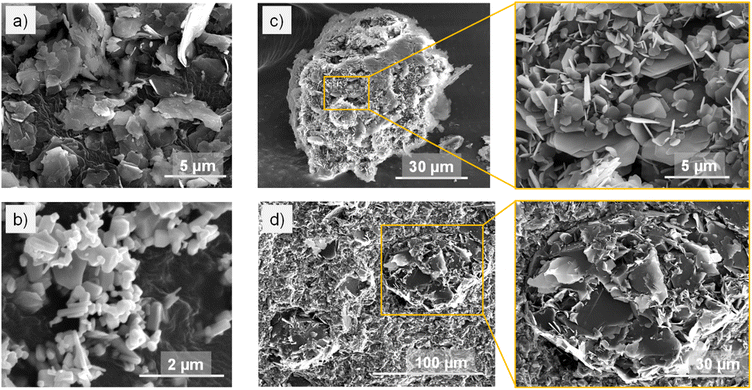
Apart from the thermal conductivity of the fillers, their shape, size, and distribution in the polymer matrix also affect the effective thermal conductivity of the obtained composite. The morphology of the as-received fillers is shown in the SEM images (Fig. 1). Talc nanoclay are platelet particles with a diameter median of 2 μm. A talc particle might be an aggregation of several layers, bonding to each other by weak van der Waals forces. ZnO particles are in hexagonal prism shape with sizes varying in the range of hundreds of nanometers.The morphology of spherical BN cluster particles can be seen in Fig. 1(c) with an average diameter of 60 μm. The BN cluster particle consists of multiple platelet-like hexagonal BN crystals which are held together at the edges in random orientations.
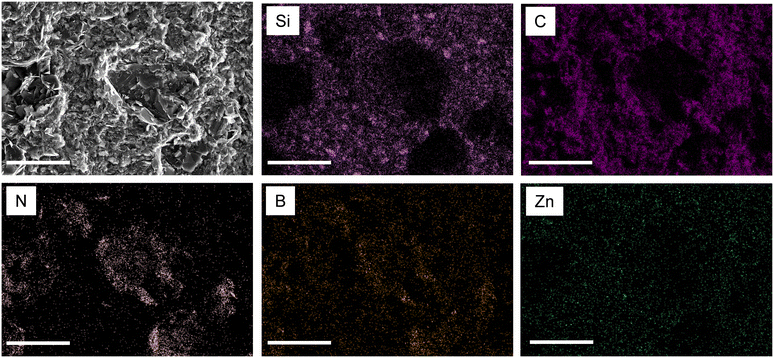
The distribution of the fillers in the epoxy matrix of a representative nanocomposite composed of X1 = 60 wt%, X2 = 20 wt%, X3 = 12.5 wt%, and X4 = 7.5 wt% is shown in an SEM image of a cross-section fracture (Fig. 1(d)). The EDX elemental mapping (Fig. 2) shows the distribution of C (which represents epoxy), Si (talc nanoclay), B and N (BN), and Zn (ZnO). It can be observed that the BN cluster particles preserve their original structure in the final composites, unlike how they were reported to be broken down into platelets during the processing elsewhere.35 Talc and ZnO are observed to be homogeneously distributed between the BN particles. Overall, the functional fillers are well dispersed in the epoxy matrix. Thus, the heat flow in the composite can be ensured to be uniform.36,37
3.2 Design of experiments
Various statistical data were used to analyze the mixture design. The p-value is an essential parameter to assess the null hypothesis, which states that there is no association between the term in the model and the output response. A good value of significance level (α) to compare the p-value to is 0.05, which indicates that there is only a risk of 5% that there is an association between the term and the response. If the p-value ≤0.05, the term can be considered statistically significant. Otherwise, the term might not be significant and can be eliminated from the model.
In the backward elimination method, all the predictor terms (including linear and quadratic terms) are included at the beginning of the regression process. In each step, the least statistically significant term with a p-value ≥0.1 will be removed. The regression repeats until all remaining terms in the model have a p-value ≤0.05. After multiple regression steps, the model of the thermal conductivity of the epoxy composite depending on the percentile of the components in the experimental constraints has been established as shown in eqn (6). The coefficients of the quadratic model of the composite thermal conductivity, their standard error, and p-value are given in Table 2.
| λ = 0.003527X1 + 0.008663X2 + 0.161606X3 + 0.000726X4 − 0.001493X1·X3 − 0.001391X2·X3 | (6) |
The predicted response, shown in eqn (6) matches well with the experimental data with an R-squared of 98.17%. As a rule of thumb, the closer the R-squared to 100%, the better the model fits the experimental data. This high value of R-squared indicates the adequacy of the developed model. The ANOVA results are summarized in Table 3. The p-value for the regression of the composite thermal conductivity model is p = 0.000, in which the p-value of linear terms is 0.000 and the p-value of quadratic terms is 0.006, which is much less than 0.05. This states that all terms in the regression model have significant associations with the output response. Among the interaction terms in the model shown in eqn (6), only X1·X3 (epoxy and BN cluster particles) and X2·X3 (talc and BN cluster particles) show statistical significance with p-values of 0.014 and 0.012, respectively. All other interaction terms show statistical insignificance and thus are eliminated throughout the regression steps. Nevertheless, both X1·X3 and X2·X3 interaction terms have negative coefficients, demonstrating antagonistic effects between the two components.
| Source | DFa | Seq SSb | Adj SSc | Adj MSd | F-Valuee | p-Value |
|---|---|---|---|---|---|---|
| a Degree of freedom. b Sequential sum of squares. c Adjusted sum of squares. d Adjusted mean of squares. e F test. | ||||||
| Regression | 5 | 0.636132 | 0.636132 | 0.127226 | 171.68 | 0.000 |
| Linear | 3 | 0.625355 | 0.042060 | 0.014020 | 18.92 | 0.000 |
| Quadratic | 2 | 0.010777 | 0.010777 | 0.005389 | 7.27 | 0.006 |
| X 1·X3 | 1 | 0.004815 | 0.005646 | 0.005646 | 7.62 | 0.014 |
| X 2·X3 | 1 | 0.005963 | 0.005963 | 0.005963 | 8.05 | 0.012 |
| Residual error | 16 | 0.011857 | 0.011857 | 0.000741 | ||
| Total | 21 | 0.647989 | ||||
 | ||
| Fig. 4 Contour plots of composite thermal conductivity in three cases with the total content of fillers: (a) 30 wt%; (b) 35 wt%; (c) 40 wt%. | ||
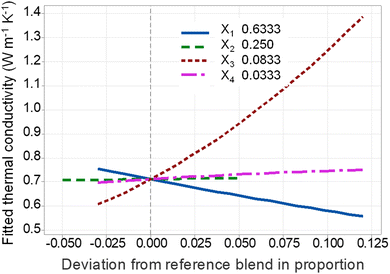 | ||
| Fig. 5 Cox response trace plot showing the change of composite thermal conductivity referenced to centroid point of design space. | ||
Fig. 5 displays the effects of all components in a single Cox response trace plot, showing how the output response changes compared to the reference blending when a mixture component content moves through the centroid point of the design space to the vertices while the remaining components are held in a constant ratio.38 In the design space, the reference blend consists of X1 = 63.3 wt%, X2 = 25 wt%, X3 = 8.3 wt% of BN, and X4 = 3.33 wt%, with the composite thermal conductivity of 0.715 W m−1 K−1.
The coefficients of talc and ZnO in the model, shown in eqn (6) are relatively small. Also, as seen in Fig. 5, compared to the reference blend, ZnO and talc nanoclay has almost linear response traces with a relatively flat slope, indicating that an increase in the amount of these fillers has little influence on the composite thermal conductivity enhancement. Even though ZnO is reported to have a much higher thermal conductivity of 50 W m−1 K−1![[thin space (1/6-em)]](https://www.rsc.org/images/entities/char_2009.gif) 39 compared to talc (through-plane thermal conductivity of talc is 1.76 W m−1 K−1
39 compared to talc (through-plane thermal conductivity of talc is 1.76 W m−1 K−1![[thin space (1/6-em)]](https://www.rsc.org/images/entities/char_2009.gif) 40), the slope of ZnO response trace is higher than that of talc nanoclay by only an incremental amount. This can be explained by the high density of ZnO, seen in Table 1, so that ZnO particles take only a small volume fraction. Moreover, the small size of ZnO particles is associated with high interfacial thermal resistance between the fillers and polymer matrix, which in turn hinders the thermal enhancement effects of ZnO particles.38,41 On the other hand, compared to ZnO particles, talc with a 2D platelet structure provides a large contact area and the possibility of forming face-contact of the 2D platelet network, which promotes the composite thermal conductivity.18,42
40), the slope of ZnO response trace is higher than that of talc nanoclay by only an incremental amount. This can be explained by the high density of ZnO, seen in Table 1, so that ZnO particles take only a small volume fraction. Moreover, the small size of ZnO particles is associated with high interfacial thermal resistance between the fillers and polymer matrix, which in turn hinders the thermal enhancement effects of ZnO particles.38,41 On the other hand, compared to ZnO particles, talc with a 2D platelet structure provides a large contact area and the possibility of forming face-contact of the 2D platelet network, which promotes the composite thermal conductivity.18,42
3.3 Effects of BN cluster particles on the composite thermal conductivity enhancement
In the spherical BN cluster particles, BN nanosheets are randomly orientated and edge-connected, which is believed to be the key to the enhanced thermal conductivity of the composite. To demonstrate and elucidate the critical role of structured heat conducting paths endowed in BN clusters, the composites with BN clusters are compared to that with homogeneously dispersed BN platelets. Theoretical prediction models of filled composites are implemented to estimate the effective thermal conductivity of BN clusters and BN platelets based on the obtained experimental data.Various models have been proposed to predict the thermal conductivity of filled composites (λ). The essential parameters taken into the models are thermal conductivity of polymer matrix λm and fillers λf, and volume content of fillers φ. According to the Agari–Uno model,47,48 the thermal conductivity of a composite can be calculated as shown in eqn (7).
ln(λ) = φC2![[thin space (1/6-em)]](https://www.rsc.org/images/entities/char_2009.gif) ln(λm) + (1 − φ)ln(C1λf) ln(λm) + (1 − φ)ln(C1λf) | (7) |
The experimental data and fitted curves applying the Agari–Uno model in both cases of epoxy/spherical BN clusters and epoxy/BN platelets composite are shown in Fig. 6. It can be seen that the thermal conductivity of epoxy/BN platelets is much lower than that of the BN cluster at the same filler content. For instance, at a filler content of 13 vol%, the thermal conductivity of epoxy/BN platelets is only ∼0.5 W m−1 K−1, while that of the epoxy/BN cluster is 1.3 W m−1 K−1. Applying C1 = 1.4 and C2 = 1.32, given in ref. 44 to eqn (7), good agreements between the experimental and fitted values are achieved with effective thermal conductivity of spherical BN clusters λf_BN![[thin space (1/6-em)]](https://www.rsc.org/images/entities/char_2009.gif) cluster = 100 W m−1 K−1, which is one order of magnitude higher than that of dispersed BN platelets being λf_BN
cluster = 100 W m−1 K−1, which is one order of magnitude higher than that of dispersed BN platelets being λf_BN![[thin space (1/6-em)]](https://www.rsc.org/images/entities/char_2009.gif) platelet = 7 W m−1 K−1.
platelet = 7 W m−1 K−1.
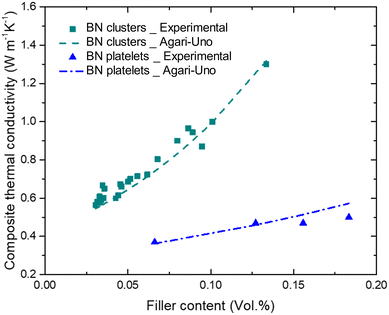 | ||
| Fig. 6 Thermal conductivity of epoxy/BN clusters and epoxy/BN platelets composite and fits for the Agari–Uno model. | ||
As shown from the above analytical results, given the same volume content, the structure of the BN fillers has a significant effect on the composite thermal conductivity. The discrepancy in thermal conductive paths of the two structures of BN nanosheets is illustrated in Fig. 7. BN nanosheets are known to possess strongly anisotropic thermal conductivity (see Table 1). In a well-manufactured epoxy/BN platelets composite, most BN nanosheets are intercalated by epoxy resin. The heat transfer through the composite is accomplished via multiple successive modules: epoxy- interface-BN nanosheet-interface, demonstrated in Fig. 7(a). Because BN nanosheets are more likely to align with a preferred orientation parallel to the sample surface, the through-thickness thermal conductivity is relatively low. Moreover, the interface between epoxy matrix and BN nanosheets causes considerable interfacial thermal resistance. The estimated effective thermal conductivity of dispersed BN platelets is higher than the through-plane value due to, probably, local face-contact between BN nanosheets,18,42 which creates a network with higher thermal conductivity.
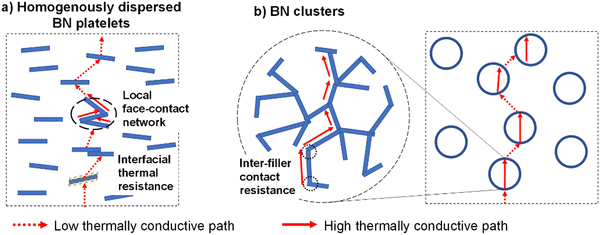 | ||
| Fig. 7 Schematic diagrams of thermally conductive paths of the epoxy composite in two cases: (a) with homogeneously dispersed BN platelets; (b) with spherical BN cluster particles. | ||
On the other hand, in spherical BN clusters, the BN nanosheets are held together by the edges to form a network, depicted in Fig. 7(b). Therefore, effective thermal conduction paths are created throughout the cluster. Moreover, the size of BN clusters is much larger than the individual platelets. This reduces not only the interfacial thermal resistance, but also the number of interfaces between epoxy and filler, compared to the epoxy/BN platelets composite with the same filler volume content. Thanks to the random orientation of the BN nanosheets, the spherical BN clusters obtain more isotropic thermal conductivity, which means that the thermal conductive pathway will be independent of the particle orientation.
However, the estimated effective thermal conductivity of BN clusters is less than the in-plane thermal conductivity of BN. This might be due to contact thermal resistance between the BN nanosheets, as illustrated in Fig. 7(b), which reduces the effective thermal conductivity of the BN cluster.
3.4 Dielectric properties
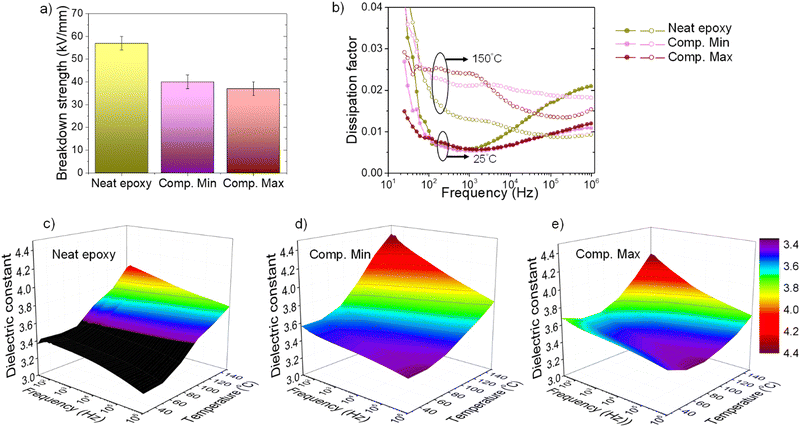
Incorporating inorganic fillers into polymer matrices could lead to undesirably degraded dielectric properties,49,50 which are not suitable for electrical insulation, especially in high voltage applications. Potential lowering of the breakdown strength and upsurging dissipation factor (loss) could lead to excessive wasted heat generation and a rising dielectric constant which distorts electrical field distribution. We demonstrate that the dielectric properties of the developed thermally conductive composites are well qualified for high-performance electrical applications. Fig. 8 summarizes the dielectric properties of representatives – Comp. Min and Comp. Max, benchmarking the neat epoxy resin.The dielectric breakdown strengths of Comp. Min and Comp. Max are maintained at 40 kV mm−1, as seen in Fig. 8(a). This high breakdown strength is well suited for rotating machine industries and higher than that of the micaceous (mica, epoxy, glass–fabric composite) insulation. The dissipation factors at 25 °C of the composites are comparable to the neat epoxy resin as presented in Fig. 8(b). At 150 °C, the dissipation factors of the composites remain less than 3% in a wide frequency range of 30–106 Hz. The dielectric constants of the composites are slightly higher than the neat epoxy and are as low as 4.4 over the entire studied temperature and frequency ranges. Both the dielectric dissipation and dielectric constants of these composites are lower than the state-of-the-art micaceous insulation for rotating machines.5,51
4. Conclusion
In this paper, the effects of a hybrid filler system with different size, shape, and thermal conductivity on the effective thermal conductivity of the epoxy composite have been investigated using the statistical model of the Minitab software package. A thermal conductivity model of the epoxy composite with an R-squared of 98.17% has been established based on the concentration of epoxy resin, talc, BN cluster, and ZnO.In the studied constraint, increasing the content of fillers leads to an increase in the thermal conductivity of the composites. However, depending on the filler properties, the effects that each filler contribute to the thermal conductivity enhancement of the epoxy composite are different. ZnO particles, with the content ranging from 0 to 15 wt%, possessing a high thermal conductivity of 50 W m−1 K−1, yet with small sizes and high density, show limited effects on increasing the thermal conductivity of the composites. Similarly, the response trace of 2D talc nanoclay has a relatively flat slope in the composite thermal conductivity in the range of 20–30 wt%.
The spherical BN cluster particles, possessing the highest thermal conductivity and largest size, demonstrate the most effective thermal conductivity enhancement. In the range of 5–20 wt%, BN clusters could lead to an exponential increase in the effective thermal conductivity.
The prevailing enhancement in the composite thermal conductivity of spherical BN clusters is attributed to the effective thermal conductive path, created by structured edge-connecting nanosheets, in which heat is transferred in the high thermally conductive in-plane BN nanosheets. BN clusters showed one order of magnitude higher effective thermal conductivity compared to homogeneously dispersed BN platelets at the same filler contents.
The cooperation of hybrid fillers into an epoxy matrix results in 6× enhancement in thermal conductivity compared to the neat epoxy resin. Additionally, the designed epoxy composites possess a high dielectric breakdown strength of >40 kV mm−1, low dielectric constant, and low dissipation factor, which are favorable for a wide range of industrial applications.
Conflicts of interest
There are no conflicts to declare.Acknowledgements
The authors acknowledge the kind support from the U.S. Office of Naval Research under Grant N00014-15-1-2413 and Grant N00014-19-1-2306.Notes and references
- B. Ellis, Chemistry and Technology of Epoxy Resins, Springer, Netherlands, Dordrecht, 1993 Search PubMed.
- S. Rimdusit and H. Ishida, Polymer, 2000, 41, 7941–7949 CrossRef CAS.
- Y. He, B. E. Moreira, A. Overson, S. H. Nakamura, C. Bider and J. F. Briscoe, Thermochim. Acta, 2000, 357–358, 1–8 CrossRef CAS.
- M. Uno, K. Ogawa, Y. Takeda, Y. Sone, K. Tanaka, M. Mita and H. Saito, J. Power Sources, 2011, 196, 8755–8763 CrossRef CAS.
- H. H. Nguyen, A. Y. Mirza, W. Chen, Y. Liu, J. Ronzello, J. Chapman, A. M. Bazzi and Y. Cao, IEEE Access, 2021, 9, 2274–2282 Search PubMed.
- H. Nguyen, Y. Liu, W. Chen, M. Ghassemi, J. Chapman, A. Bazzi and Y. Cao, IEEE Electric Ship Technologies Symposium, ESTS, 2017, pp. 274–279 Search PubMed.
- G. Stone, E. A. Boutler, I. Gilbert and H. Dhirani, Electrical Insulation for Rotating Machines, Wiley/IEEE press, 2004 Search PubMed.
- I. H. Tavman, Powder Technol., 1997, 91, 63–67 CrossRef CAS.
- N. M. Sofian, M. Rusu, R. Neagu and E. Neagu, J. Thermoplast. Compos. Mater., 2001, 14, 20–33 CrossRef CAS.
- W. Kowbel, C. Bruce, K. Tsou, K. Patel, J. Withers and G. Youngblood, J. Nucl. Mater., 2000, 283–287, 570–573 CrossRef CAS.
- S. Yoshihara, M. Tokita, T. Ezaki, M. Nakamura, M. Sakaguchi, K. Matsumoto and J. Watanabe, J. Appl. Polym. Sci., 2014, 131(6) DOI:10.1002/app.39896.
- B. Maira, K. Takeuchi, P. Chammingkwan, M. Terano and T. Taniike, Compos. Sci. Technol., 2018, 165, 259–265 CrossRef CAS.
- B. Lee and G. Dai, J. Mater. Sci., 2009, 44, 4848–4855 CrossRef.
- C. P. Wong and R. S. Bollampally, J. Appl. Polym. Sci., 1999, 74, 3396–3403 CrossRef CAS.
- M. E. Meibodi, M. Vafaie-Sefti, A. M. Rashidi, A. Amrollahi, M. Tabasi and H. S. Kalal, Int. Commun. Heat Mass Transf., 2010, 37, 319–323 CrossRef CAS.
- J. Nanda, C. Maranville, S. C. Bollin, D. Sawall, H. Ohtani, J. T. Remillard and J. M. Ginder, J. Phys. Chem. C, 2008, 112, 654–658 CrossRef CAS.
- S. Ganguli, A. K. Roy and D. P. Anderson, Carbon N. Y., 2008, 46, 806–817 CrossRef CAS.
- C. Huang, X. Qian and R. Yang, Mater. Sci. Eng., R, 2018, 132, 1–22 CrossRef.
- B. L. Zhu, J. Wang, H. Zheng, J. Ma, J. Wu, Z. H. Gan and J. Liu, J. Alloys Compd., 2017, 701, 499–507 CrossRef CAS.
- B. L. Zhu, J. Wang, H. Zheng, J. Ma, J. Wu and R. Wu, Composites, Part B, 2015, 69, 496–506 CrossRef CAS.
- Y. Cao, P. C. Irwin and K. Younsi, IEEE Trans. Dielectr. Electr. Insul., 2004, 11, 797–807 CrossRef.
- P. Jiang, X. Qian, R. Yang and L. Lindsay, Phys. Rev. Mater., 2018, 2, 1–8 Search PubMed.
- Q. Cai, D. Scullion, W. Gan, A. Falin, S. Zhang, K. Watanabe, T. Taniguchi, Y. Chen, E. J. G. Santos and L. H. Li, Sci. Adv., 2019, 5, 1–9 Search PubMed.
- S. N. Paisner, P. J. Hans and P. Meneghetti, US Pat., US7524560B2, 2009.
- A. Gowda, S. N. Paisner, S. Tonapi, P. Meneghetti, P. Hans, G. Strosaker, A. Acharya, K. Nagarkar and K. Srihari, Proc. 7th Electron. Packag. Technol. Conf. EPTC 2005, 2005, 2, 683–690.
- H. Chen, V. V. Ginzburg, J. Yang, Y. Yang, W. Liu, Y. Huang, L. Du and B. Chen, Prog. Polym. Sci., 2016, 59, 41–85 CrossRef CAS.
- M. J. Anderson and P. J. Whitcomb, Rubber Plast. News, 2002, 16–17 Search PubMed.
- R. P. Niedz and T. J. Evens, In Vitro Cell. Dev. Biol.: Plant, 2011, 47, 682–694 CrossRef CAS.
- L. Ayed, S. Achour and A. Bakhrouf, Water SA, 2011, 37, 21–26 CrossRef CAS.
- S. Damiri, H. R. Pouretedal and O. Bakhshi, Chem. Eng. Res. Des., 2016, 112, 155–162 CrossRef CAS.
- Z. Jeirani, B. Mohamed Jan, B. Si Ali, I. Mohd. Noor, S. Chun Hwa and W. Saphanuchart, Chemom. Intell. Lab. Syst., 2012, 112, 1–7 CrossRef CAS.
- P. M. Murray, F. Bellany, L. Benhamou, D.-K. Bučar, A. B. Tabor and T. D. Sheppard, Org. Biomol. Chem., 2016, 14, 2373–2384 RSC.
- TA Instruments-DTC 300-Thermal conductivity meter - Getting started guide, 2013.
- R. A. McLean and V. L. Anderson, Technometrics, 1966, 8, 447–454 CrossRef.
- S. N. Leung, M. O. Khan, E. Chan, H. E. Naguib, F. Dawson, V. Adinkrah and L. Lakatos-Hayward, J. Appl. Polym. Sci., 2013, 127, 3293–3301 CrossRef CAS.
- Y. S. Song and J. R. Youn, Carbon N. Y., 2005, 43, 1378–1385 CrossRef CAS.
- A. Tessema, D. Zhao, J. Moll, S. Xu, R. Yang, C. Li, S. K. Kumar and A. Kidane, Polym. Test., 2017, 57, 101–106 CrossRef CAS.
- D. R. Cox, Biometrika, 1971, 58, 155–159 CrossRef.
- X. Wu, J. Lee, V. Varshney, J. L. Wohlwend, A. K. Roy and T. Luo, Sci. Rep., 2016, 6, 1–10 CrossRef PubMed.
- C. Clauser and E. Huenges, Thermal Conductivity of Rocks and Minerals, in Rock Physics & Phase Relations: A Handbook of Physical Constants, ed. T. J. Ahrens, American Geophysical Union, Washington DC, 2013, pp. 105–126 DOI:10.1029/RF003p0105.
- S. Yu, S. Yang and M. Cho, J. Appl. Phys., 2013, 114, 213503 CrossRef.
- J. Tielke, M. Maas, M. Castillo, K. Rezwan and M. Avila, Proc. R. Soc. A Math. Phys. Eng. Sci., 2021, 477(2250) DOI:10.1098/rspa.2021.0222.
- Z. Li, D. Ju, L. Han and L. Dong, Thermochim. Acta, 2017, 652, 9–16 CrossRef CAS.
- K. Gaska, A. Rybak, C. Kapusta, R. Sekula and A. Siwek, Polym. Adv. Technol., 2015, 26, 26–31 CrossRef CAS.
- C. P. Wong and R. S. Bollampally, IEEE Trans. Adv. Packag., 1999, 22, 54–59 CrossRef CAS.
- L. E. Nielsen, Ind. Eng. Chem. Fundam., 1974, 13, 17–20 CrossRef CAS.
- Y. Agari and T. Uno, J. Appl. Polym. Sci., 1986, 32, 5705–5712 CrossRef CAS.
- Y. Agari, A. Ueda and S. Nagai, J. Appl. Polym. Sci., 1991, 42, 1665–1669 CrossRef CAS.
- Z. Cai, X. Wang, B. Luo, W. Hong, L. Wu and L. Li, Compos. Sci. Technol., 2017, 145, 105–113 CrossRef CAS.
- R. Wang, C. Xie, S. Luo, B. Gou, H. Xu and L. Zeng, RSC Adv., 2019, 9, 19648–19656 RSC.
- H. Nguyen, Y. Wang, J. Ronzello, J. Chapman and Y. Cao, 2019 IEEE Electric Ship Technologies Symposium (ESTS), IEEE, 2019, pp. 189–194 Search PubMed.
Footnote |
| † Electronic supplementary information (ESI) available. See DOI: https://doi.org/10.1039/d2ma00592a |
| This journal is © The Royal Society of Chemistry 2022 |

