 Open Access Article
Dependence of charge carrier transport on molecular relaxations in glassy poly(3-hexylthiophene-2,5-diyl) (P3HT)†
Zhaojing
Gao
,
Manuel
Reali
,
Arthur
Yelon
* and
Clara
Santato
 *
*
Polytechnique Montreal, Engineering Physics Department, Montréal, Quebec, H3C 3A7, Canada. E-mail: arthur.yelon@polymtl.ca; clara.santato@polymtl.ca
First published on 2nd August 2022
Abstract
A positive effect of molecular relaxations and the movement of the molecular backbone and of chain segments on charge carrier transport processes in organic semiconductors, has not previously been reported. In this work, charge carrier transport mechanisms in amorphous glassy poly(3-hexylthiophene-2,5-diyl) (P3HT) are determined unambiguously, both above and below the glass transition temperature, Tα. This is the result of measurements of temperature, electric field, and ac frequency dependence of charge carrier mobility and density in organic field effect transistors, based on regioregular P3HT of three different molecular weights. Relaxations play an important role in dc conductivity. At temperatures above Tα, under constant source-drain voltage, the hole-like polaronic carriers move with, and hop between, mobile polymer backbones. Below Tα, they hop between mobile chain segments of essentially immobile neighboring molecules. Under source-drain voltages at frequencies of 100 Hz and higher, charge carriers move on polymer backbones. This motion does not contribute to dc conductivity. These insights into the dependence of charge carrier transport properties upon the molecular properties should contribute to advances in stable organic photovoltaics, organic thermoelectrics, and thermally degradable electronics. The approach taken here should also be useful for clarifying conduction mechanisms in other polymeric semiconductors.
I. Introduction
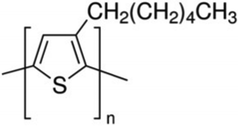
Organic semiconducting polymers and small molecules have been widely investigated, due to their solution processability (printability), compatibility with flexible substrates and optoelectronic properties, tunable with chemical synthesis.1,2 Unlike crystalline inorganic materials presently in use, organic semiconductors have high concentrations of defects that bring about structural and energetic disorder, difficult to eliminate due to their weak van der Waals interactions. Strong charge carrier-phonon coupling and disorder in organic semiconductors lead to charge carrier localization and to the formation of polarons.1 These consist of the charge carrier coupled to structural deformation, which results in effective mass much larger than that of free electrons, and further lowers the charge carrier mobility compared with that expected for charge carriers with effective mass close to the free electron (hole) mass. Although various transport models, including band-like transport,3 multiple trap and release,4 variable range hopping,5 and percolation have been proposed,6 the detailed mechanisms of charge carrier transport in organic materials are still not well understood. The dependence of electronic properties upon the molecular properties, e.g. molecular backbone relaxations, has rarely been explained unambiguously.Regio-regular poly(3-hexylthiophene-2,5-diyl) (RR P3HT), whose monomer is shown in Fig. 1, has been widely investigated for organic electronics, and the temperature dependence of charge carrier mobility has been shown to obey the Meyer–Neldel rule (MNR) (discussed in Section II).7,8 Over the past two decades, improvements in P3HT film preparation have resulted in increased chemical purity, control of the molar mass and prolonged interchain conjugation. As a result, the charge carrier mobility of RR P3HT has improved considerably, from 10−5 to 10−1 cm2 V−1 s−1.9–11
Most previous work on charge carrier transport in P3HT has focused on semi-crystalline material and did not report the effect of glass transitions in glassy materials on transport.12–16 It has been reported that molecular relaxations influence transport. In particular, Obrzut et al.17 found that relaxation of the hexyl side group (Fig. 1) (γ relaxation) causes scattering of the charge carriers moving on the molecular backbone. Such effects are indeed well established, and different from what we report here. Our work shows that the molecular relaxations (backbone and chain segments) are needed for hopping in glassy material with very small crystalline content. This is a major effect in glasses, while the effect of scattering is smaller. It is essential to understand both relaxation effects on charge carrier transport in organic semiconductors. Such understanding is expected to contribute to the design of stacking and orientation of polymer chains in material synthesis and device fabrication with potential impact on thermally stable organic photovoltaics, organic thermoelectrics, and thermally degradable electronics.
In this work, we have measured the temperature, electric field and ac frequency dependence of charge carrier mobility in organic field effect transistors based on RR P3HT of three different molecular weights (MW), ca. 20, 30–50, 80–90 kDa, exhibiting different glass transition temperatures, Tα. The results are obtained both above and below the glass transition temperature. We find that dc conductivity is controlled by polymer relaxations (local and extended polymer backbone movements) in the glassy component. As far as the ac frequency dependence (important for understanding of disordered material in which charge carrier percolation may take place18,19), we find that, at 100 Hz and above, the polaronic charge carriers appear to be confined to the molecular backbones, whereas they move through the sample under dc conditions.
II. Meyer–Neldel rule and charge carrier transport in organic semiconductors
The common factor among various charge carrier transport models in semiconductors is the activation energy. It has been well established that various physical processes, including charge carrier transport in semiconductors are temperature activated and follow the Arrhenius law:20| X = X0e−ΔE/kBT | (1) |
| X0 = X00eΔE/kBTiso. | (2) |
Applying the logarithm to both sides of eqn (2) leads to
ln![[thin space (1/6-em)]](https://www.rsc.org/images/entities/char_2009.gif) X0 = ln X0 = ln![[thin space (1/6-em)]](https://www.rsc.org/images/entities/char_2009.gif) X00 + ΔE/kBTiso X00 + ΔE/kBTiso | (3) |
ln![[thin space (1/6-em)]](https://www.rsc.org/images/entities/char_2009.gif) X0 = ln X0 = ln![[thin space (1/6-em)]](https://www.rsc.org/images/entities/char_2009.gif) X00 + ΔE/kBTiso − ΔE/kBT. X00 + ΔE/kBTiso − ΔE/kBT. | (4) |
Eqn (4) is known as the MNR, since it was reported by Meyer and Neldel in describing the experimentally observed conductivity of disordered materials; as the compensation law, because the exponential term eΔE/kBTiso in X0 compensates the decreasing exponential, e−ΔE/kBT, as ΔE is increased; and as the isokinetic law.21 The MNR has been observed in the dc conductivity of amorphous chalcogenides,34 amorphous and crystalline silicon,22–25 catalyzed chemical reactions,26 solid state diffusion in crystals,27 biological and geological substances.28,29 It was also found that the electron or hole mobility, μ, in many organic semiconductors,7,30–33 including pentacene,7 fullerene,30 polythiophene,31 and N-alkyl perylene diimides,32 follow the MNR.
The MNR was explained by a number of authors,21 including Linert35 and Yelon and Movaghar36 who called their version of the explanation the multi-excitation entropy (MEE) model. These explanations are based upon the key observation of the MEE model that, when the activation energy ΔE is much larger than both the energy of the available excitations and the thermal fluctuation energy, multiple excitations are necessary to overcome the activation barrier. Thus, a contribution from the entropy of the collected excitations must be taken into account. This is the microscopic origin of the MNR.37–41
In most studies of MN behavior, the activation energy is varied by preparing a number of samples in slightly different ways, e.g. changing the preparation conditions for samples with a specific composition, or by preparing closely related compositions.21,42 However, in studies of semiconductors, as is the case here, there is considerable advantage in preparing field effect transistors (FETs), using the material under investigation as the semiconducting film transistor channel. Varying the gate-source voltage, Vg, modifies the band bending at the semiconductor dielectric interface. This changes the energy distribution of charge carriers near the dielectric, compared with those farther away, thus changing the activation energy, ΔE.
In classic transistor technology, based upon small gap, crystalline, inorganic semiconductors, the number of thermally activated charge carriers is large at moderate values of T, as is the charge carrier mobility, μ. As expected for band transport, it is not thermally activated.43 These conditions are not expected to apply to organic semiconductors. The charge carrier density is not strongly dependent upon T. In contrast, the charge carrier mobility, μ, may be activated. In accumulation, except at the lowest voltages, the charge carriers induced by the gate-source voltage determine the source-drain current (in absence of charge carrier injection energy barriers). The activation energy ΔE is then controlled by Vg. Of course, the device must be functional over a wide enough temperature range for meaningful kinetics to be measured.
III. Results
III.1. Dependence of dc mobility, μ, on T under several Vg
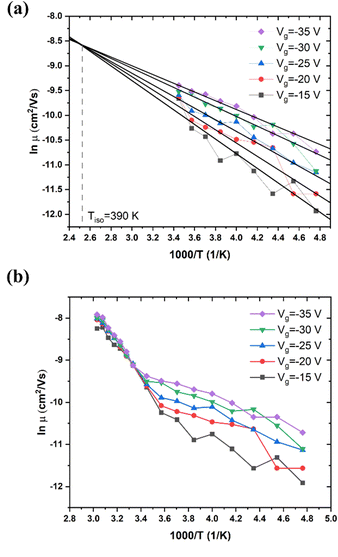
The dependence of μ upon Vg and T for high MW RR P3HT is shown in Fig. 2. Mobility increases with increasingly negative Vg. That is, the carriers are hole-like, as expected. At room temperature, its values range from 4 × 10⁻⁵ cm2 V−1 s−1 to 3 × 10⁻⁴ cm2 V−1 s−1, which is comparable with previous publications.44,45 As shown in Fig. 2(a), at T < 290 K, μ exhibits Arrhenius behavior for each Vg, and obeys the MNR with a Tisoca. 390 K. The activation energies are given in Table 1.| V g (V) | −15 V | −20 V | −25 V | −30 V | −35 V |
|---|---|---|---|---|---|
| E a (meV) T = 210–290 K | 128 | 118 | 97 | 95 | 87 |
In Fig. 2(b), we observe that the slope of μ vs. 1/T changes sharply at T = 290 K, with μ becoming independent of Vg. This is not due to an annealing effect, which might modify the structure. If the measurement is repeated, the result is essentially the same, It is due to the transition between two conduction mechanisms, one dominant below 260 K, the other dominant above 300 K (see also Section III.4). The abrupt change in slope shown in Fig. 2(b) is typical of the α relaxation of glassy polymers, which has been investigated intensively.46,47 The α relaxation signifies that the thermally activated movement of the polymer backbones increases rapidly. This process becomes observable at the glass transition temperature, Tα. For RR P3HT of 80–90 kDa, Tα is reported to be 295 K.47 We propose that the electric field acting on the charged sites causes the backbones to move, and that this process controls the mobility at T > Tα. We propose that at T < Tα, hopping of polaronic carriers is the controlling process.
T α is closely related to the MW, as indicated by the Flory–Fox equation, Tα = Tα,∞ − K/Mn, where Tα,∞ is the maximum glass transition temperature at infinite molecular weight, K is an empirical parameter, Mn is the number averaged MW.47,48
We also investigated RR P3HT, for low MW (ca. 20 kDa), with Tα near 275 K, and for medium MW = 30–50 kDa, with Tα near 290 K. The dependence of μ on T under several Vg in low MW P3HT is shown in Fig. 3. Behavior similar to that shown in Fig. 2 is observed for low MW P3HT. In the low T region, T < Tα, μ depends upon Vg, and ln![[thin space (1/6-em)]](https://www.rsc.org/images/entities/char_2009.gif) μ increases with T. In the high T region, T > Tα, μ is independent of Vg with the slope increasing discontinuously, and then decreasing gradually. In this region, we see more clearly than in Fig. 2(b), that μ does not obey eqn (1). The behavior of μ resembles that described in the empirical Williams–Landel–Ferry (WLF) equation,
μ increases with T. In the high T region, T > Tα, μ is independent of Vg with the slope increasing discontinuously, and then decreasing gradually. In this region, we see more clearly than in Fig. 2(b), that μ does not obey eqn (1). The behavior of μ resembles that described in the empirical Williams–Landel–Ferry (WLF) equation,  , where Tg is the glass transition temperature, η is the viscosity, ηg is the viscosity at Tg and A, B are constants, the signature of the α relaxation.46 In what follows, we have determined the slopes of the Arrhenius plots, which we call the apparent values of ΔE. As shown in Fig. 2(b), taking Vg = −15 V as an example, the apparent ΔE changes from 406 meV at 290 K to 200 meV at 325 K.
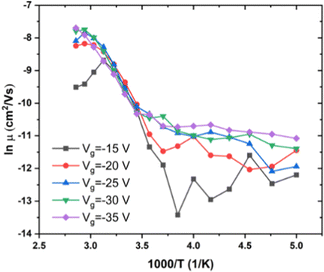 | ||
| Fig. 3 Dependence of μ on T under different Vg in low MW RR P3HT. MW < 20 kDa, Vd = −15 V, T = 200 to 350 K. | ||
Unfortunately, the relation of μ to polymer relaxation puts limits to our ability to perform reproducible experiments and to obtain reliable device performance, near to, and above, Tα. We have verified that this is indeed the case for medium MW RR P3HT, MW = 30–50 kDa. For this material, the behavior of a transistor was found to be quite different if high temperature measurements were performed immediately after low temperature measurements (Fig. S1, ESI†), or after 12 hours during which it was left at room temperature (Fig. S2, ESI†). With relaxation times comparable to the time allowed for the temperature to stabilize (30 min), it is extremely difficult, if not impossible, to obtain meaningful kinetic data.
III.2. Dependence of charge carrier density upon Vg
We determined the dependence of charge carrier density, n, on Vg at various T in high MW RR P3HT from eqn (8) and (9) (see Experimental). As indicated in Fig. 4, with the Vg going from −15 to −35 V, n changes by a factor of about 2 below Tα, and by twice that, above.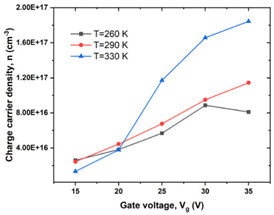 | ||
| Fig. 4 Dependence of n on Vg under different T in high MW RR P3HT, Vd = −20 V, T = 260, 290 and 330 K. | ||
III.3. Dependence of μ upon source–drain voltage, Vd
We have determined the variation of μ with T for a given value of Vg and several values of Vd, for low, medium, and high MW of P3HT (Fig. 5(a–c), respectively). This behavior is independent of Vd in the range of source–drain voltages studied, at least for the low and medium MWs, that is, the behavior of the organic semiconductor and of its contacts are ohmic. This appears to render the problem of reproducibility, due to relaxation, discussed in the previous section, unimportant for this measurement, at least for low and medium MW samples We also note, in Fig. 5(b and c), the decrease of the ΔE, characteristic of the α relaxation.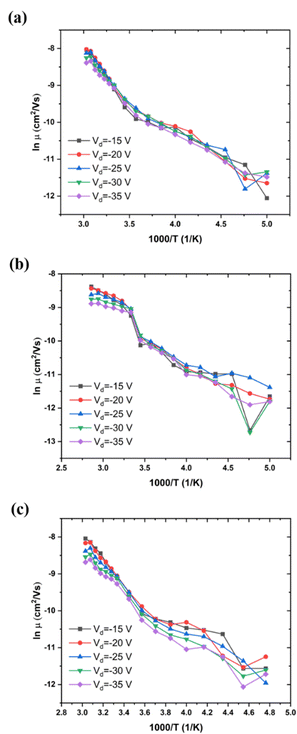 | ||
| Fig. 5 Mobility as a function of T between 200 and 350 K, (a) low MW, ca. 20 kDa, Vg = −25 V; (b) medium MW, 30–50 kDa, Vg = −20 V; (c) high MW, 80–90 kDa, Vg = −20 V. | ||
For all cases, the mobility is not free-electron like (band like), it is activated. For low MW P3HT (Fig. 5(a), and for other values of Vg, not shown here), the activation energy for various Vg is shown in Table 2. For comparison, values of activation energy as a function of Vd are presented in Table 3. We see that the in-plane activation energy at Vg = −25 V is comparable with, but higher than those obtained in Table 1. We assume that the difference is due to the approximations in eqn (6) and (7) (see Experimental), and that the mechanisms controlling mobility in both are the same: polaron hopping below Tα, and polymer backbone motion, above. As discussed in Section III.1, the high temperature, WLF region, values in Table 1 are apparent activation energies. This is also the case in Tables 2 and 3.
| V g = −15 V | V g = −20 V | V g = −25 V (Fig. 5a) | V g = −30 V | V g = −35 V | |
|---|---|---|---|---|---|
| E a (meV) T = 200–290 K | 126 | 123 | 114 | 114 | 103 |
| E a (meV) T = 290–330 K | 182 | 243 | 252 | 290 | 316 |
| V d = −15 V | V d = −20 V | V d = −25 V | V d = −30 V | V d = −35 V | |
|---|---|---|---|---|---|
| E a (meV) T = 210–290 K | 120 | 129 | 120 | 126 | 146 |
| E a (meV) T = 290–330 K | 329 | 282 | 238 | 219 | 209 |
III.4. AC conductivity in low MW P3HT
To shed light on inter-chain versus intra-chain hopping, we also explored transport under ac voltage on the same transistors upon which we performed dc measurements. The ac frequency provides another parameter for determining if the hopping occurs between chains or along chains. We expect that hopping between chains would occur only when the ac frequency is small enough and T is high enough. We measured ac conductivity, σac, of low MW P3HT over a range of T from 260 K to 350 K and frequency, f, from 100 Hz to 1 MHz. We were unable to obtain reliable measurements below 100 Hz. At frequencies from 10 Hz to 100 Hz the values obtained changed from one measurement to the next. The standard deviation is extremely large below 100 Hz in the temperature range investigated, such that we were not able to establish a value with confidence. We take this as indicating that relaxation under combined Vg and Vd is not negligible under these conditions. The relaxation frequency is comparable to the ac frequency applied. The electric field caused the chain relaxation. It acts on the charge carriers, which act on the polarized atoms to which they are coupled. This leads to the deformation of the molecules. The charge carriers, which can move along the molecular backbone, will hop when two molecules are close together, lowering the barrier. This process is too slow at high frequencies, and relatively efficient at dc and at low frequencies. At frequencies from 10 Hz to 100 Hz, relaxation produces uncertain positions of the carriers, resulting in a small, variable, conductivity.Results for Vg = −20 V are shown in Fig. 6, which also shows σdc for the same Vg, crossing the ac results. We see that σac increases with f, following the universal relation for disordered materials below optical frequencies18
| σac = Afs | (5) |
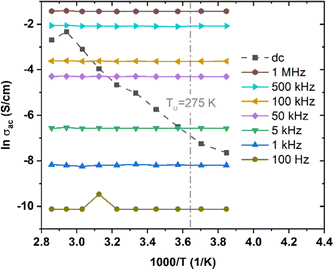 | ||
| Fig. 6 σ ac, at f between 100 Hz and 1 MHz, and σdc of low MW P3HT, at T from 260 K to 350 K, Vg = −20 V. | ||
The origin and implications of eqn (5) have been intensively studied. This relation is widely observed for disordered materials,18 as noted above, and is obtained from the theory of percolation on a disordered network.19 It may be understood qualitatively from the fact that the carriers move over smaller distances about their equilibrium positions as f increases, remaining in regions of smaller variation of potential energy.
It is found experimentally in a vast majority of disordered solids that s = 1 (σac linear with f) corresponds to the Arrhenius slope, σ′ = ∂σ/∂(1/T) = 0.19,49 Theoretical models show that this occur when the process responsible for σac makes a negligible contribution to σdc.19,50 As this contribution increases, s decreases and σ′ increases. The data of Fig. 6 correspond to s = 1 (best fit for s = 0.96), and are independent of T. In typical amorphous networks, for example, in chalcogenides,34,49–51s = 1 at low T, and decreases with increasing T, so that σac increases, joining the Arrhenius line for σdc.
IV. Discussion
In Section III.1, we proposed that the mechanism controlling mobility in low T region is polaron hopping, and charge carrier hopping with polymer backbone motion in high T region.We are now in a position to propose a mechanism for the ac conductivity, and to refine our model for the dc conductivity. In the ac measurements shown in Fig. 6, f is low enough, and T is high enough for the charge carriers to hop on the same molecular backbone, but not enough to hop to other polymer chains. It indicates that the process responsible for the dc conductivity must involve relaxation frequencies, lower, in their temperature ranges of applicability, than 100 Hz, the lowest frequency investigated. As indicated above, below 100 Hz, the relaxation frequency of the glassy P3HT is comparable to f. The relaxation time of the low MW sample must be on the order of 0.01 sec, or higher, and is higher still for the higher values of MW.
That σdc can be higher than σac also reinforces our proposal that, in the high T region, the carriers move with the polymer backbones, due to the α relaxation. They hop rapidly when two molecules approach each other. It is the backbone movements which limit the hopping rate.
In the low T regime, the carriers must also hop from molecule to molecule if they contribute to the dc conductivity. This happens less frequently than in the high T regime. That this process involves a relaxation implies that the hopping rate is controlled either by movement of small segments of the backbone, or by the approach of the side group on the monomer, (Fig. 1) to another polymer chain. These movements involve the so-called β or γ relaxations.46,52 CH2(CH2)4CH3 is insulating.53 Thus, carrier hopping from polymer backbone to polymer backbone must be due to the relaxation of backbone segments.
We are also able to explain the small changes in the charge carrier density with varying Vg. Contribution to σdc must require that carriers move into the band bending region. This must be difficult, but less so at high T than at low T. In contrast, the ac measurements are essentially independent of Vg. They represent the entire thickness of the semiconducting layer. This makes clear why the ac and dc results, which represent different populations in the sample, can cross over.
Our study drew a complete picture, shown in Fig. 7, of the charge carrier transport processes in the widely studied P3HT conjugated polymer in the glassy state. The impact of polymer properties, especially relaxation, upon electronic properties has rarely been explained for organic semiconductors. We believe that the approach taken here would be useful for clarifying charge transport mechanisms in other polymeric and molecular semiconductors, well beyond P3HT.
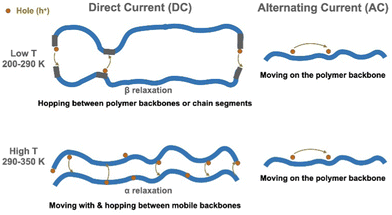 | ||
| Fig. 7 Charge carrier transport mechanisms in RR P3HT. In the low T region, the hopping is controlled by the β relaxation. In the high T region, α relaxation helps the hopping process. | ||
It is important to recognize that, in the literature, samples of P3HT have been prepared at varying degrees of order.12 These may not necessarily exhibit the same electronic properties. Noriega et al. have reported the results of a detailed study of semicrystalline P3HT thin film (40% ordered aggregates of the thin film, from their ESI†) that the ordered region is more conductive than the disordered region, and that carriers need to overcome a large energy barrier to move from the ordered to amorphous region.12 In the samples reported here, the ordered material constitutes a very small fraction (Fig. S3, ESI†), which is not sufficient for the charge carrier transport through the entire thin film. In the present case, the ordered material may make a significant contribution to the ac conduction. However, dc conduction requires percolation through the more resistive disordered region, which dominates the dc measurements.
There has been considerable work on the effect of relaxations on carrier behavior in semi-crystalline P3HT. In particular, it has been reported that relaxations scatter carriers on the molecular backbone, reducing mobility and ac conductivity.17 Our study yields a very different insight. It demonstrates that relaxations are needed for carrier transport in glassy P3HT, the motion of carriers with the mobile polymer backbone and carriers hopping between neighboring chain segments are necessary for dc conductivity. Similar processes occur in other glassy conducting polymers. The fact that intermolecular carrier hopping requires molecular vibrations was experimentally observed in a few earlier publications,53,54 but not considered in detail. It may explain the observation55 that increasing film crystallinity leads to lower mobility. This suggests that, under some circumstances, increased crystallinity could impede the approach of polymer chains and thus decrease charge carrier mobility.
Since charge carrier transport in the glassy material is closely related to polymer relaxation, detailed study of relaxation of different MW P3HT, investigation of morphology and crystallinity of the thin film after relaxation may improve our understanding on this polymer structures and the electronic properties. It would also be of interest to investigate the relaxation times or frequencies involved in the two dc conduction regimes. Given their likely values and the limitations to stability of the samples at elevated temperature, this is likely to be less difficult in the time domain than in the frequency domain. Thermally stimulated techniques might be appropriate.56 Such studies would also permit comparison of experiment with models of the hopping process, as s approaches zero, and the activation energy of ac conductivity approaches that of dc conductivity. This was particularly fruitful when predictions of the correlated barrier hopping (CBH) model were compared with experiments on amorphous chalcogenides.34,49–51 The polaronic conduction in chalcogenide glasses was successfully described through including the MNR in the activated form in the relaxation time.
V. Experimental
Bottom-contact, bottom-gate transistors were fabricated on silicon substrates, with a gate insulator of 200 nm of silicon dioxide (SiO2). The source and drain were made of 5 nm titanium and 40 nm gold using e-beam evaporation; the channel had a width (W) of 2.5 cm and length (L) of 10 μm.Thin films of RR P3HT, purchased from Solaris Chem Inc., were deposited by spin coating (1500 rpm, 100 sec) from a (freshly prepared) 10 mg mL−1 solution in chlorobenzene under N2 atmosphere, after the solution was stirred at 50 °C overnight. Each device was thermally treated on a hotplate at 110 °C for 10 min. The procedures were kept the same for all samples. The thickness of the thin film was measured using a Dektak 150 Profilometer. It was 51.7 ± 0.7 nm for low MW P3HT, 42.1 ± 4.0 nm for medium MW, and 65.0 ± 4.7 nm for high MW P3HT. The AFM images are shown in Fig. S4 (ESI†). Measurements of dc electrical properties were carried out using a semiconductor parameter analyzer, Keithley 4200-SCS. During the measurements, the source electrode was connected to ground. Samples were measured in a micromanipulator cryogenic probe station with the temperature ranging from 200 K to 350 K. We waited 30 minutes between measurements for the temperature to stabilize. Device performance was optimized by appropriate technical choices: high boiling point solvent to obtain a uniform film morphology; adjustment of solution concentration to maximize the charge carrier mobility; surface treatment of dielectric SiO2 with hexamethyldisilazane (HMDS) to decrease charge carrier trapping at the interface; choice of thermal treatment conditions to enlarge the device functional temperature range. X-Ray diffraction (XRD) spectra of the P3HT films were taken using a Bruker D8 diffractometer with a wavelength (CuKa) of 1.54 Å. Atomic force microscopy (AFM) images were taken in air at room temperature on a Digital Instruments Dimension 3100, in tapping mode, with Al-coated silicon cantilevers. Measurements of ac electrical properties were performed using a Hewlett Packard 4192A LF impedance analyzer 5 Hz–13 MHz. The ac measurement was performed on the same sample as the dc measurements. These are in open circuit voltage with oscillation amplitude of 10 mV in the frequency range between 10 Hz and 1 MHz.
In the linear regime of the thin film transistor, Vd ≪ Vg, μ is determined from
| Id = (WCi/L)μ(Vg − Vth − Vd/2)Vd | (6) |
| Id = ((WμCi)/2L)(Vg − Vth)2 | (7) |
The values reported were obtained using eqn (6). However, values, for the same Vg and the same T, obtained from eqn (7) differ from these by less than 10%.
The dc conductivity, σdc, is determined from
| σ = L/(RWd) | (8) |
| n = σ/(μe) | (9) |
VI. Conclusions
We report for the first time a positive effect of polymer molecular relaxation upon charge carrier transport processes in organic semiconductors. Through studying the charge carrier transport properties of RR P3HT under various temperatures and electric fields, we reveal the correlation between polymer molecular relaxations and transport mechanisms. We find that, in the range 200 to 290 K (low T), the charge carriers hop between molecules when chain segment movements (the β relaxation) permit. Between 290 K and 350 K (high T), charge carrier mobility increases more rapidly than it did at low T and is independent of Vg. We attribute this behavior to the α relaxation of the polymers, that is, to the movement of the carriers with the mobile backbones, hopping more easily than at low T. To shed light on inter-chain versus intra-chain hopping, we explored transport in ac conditions. The study of low MW P3HT shows that ac conductivity is independent of T and increases exponentially with the frequency. This indicates that carriers move freely on molecular chains in ac conditions, but that this does not contribute to dc conductivity.The transport mechanisms in glassy P3HT is explained unambiguously for the first time. This should contribute to advances in P3HT materials synthesis as well as technological developments for thermally stable organic photovoltaics, organic thermoelectrics, and thermally triggered degradable electronics. We believe that the dependence of charge carrier transport on molecular relaxations is unlikely to be limited to P3HT. The approach taken here is expected to pave the way to discover analogous molecular relaxation properties in other organic polymeric semiconductors.
Conflicts of interest
There are no conflicts to declare.Acknowledgements
Z. Gao acknowledges the China Scholarship Council (PhD scholarship) and C. Santato acknowledges NSERC (Discovery Grant and Strategic Green Electronics Network: Grant number: NETGP NETGP 508527-17) for financial support. The authors are grateful to H. Branz for helpful comments on the manuscript.References
- S. R. Forrest, Organic electronics: foundations to applications. Oxford University Press, USA, 2020 Search PubMed.
- F. Cicoira and C. Santato, Organic electronics: emerging concepts and technologies. John Wiley & Sons, 2013 Search PubMed.
- D. Ji, T. Li, J. Liu, S. Amirjalayer, M. Zhong, Z.-Y. Zhang, X. Huang, Z. Wei, H. Dong and W. Hu, Band-like transport in small-molecule thin films toward high mobility and ultrahigh detectivity phototransistor arrays, Nat. Commun., 2019, 10(1), 1–8 CrossRef.
- G. Horowitz and P. Delannoy, An analytical model for organic-based thin-film transistors, J. Appl. Phys., 1991, 70(1), 469–475 CrossRef CAS.
- N. Lu, L. Li, W. Banerjee, P. Sun, N. Gao and M. Liu, Charge carrier hopping transport based on Marcus theory and variable-range hopping theory in organic semiconductors, J. Appl. Phys., 2015, 118(4), 045701 CrossRef.
- N. Lu, L. Li and M. Liu, Universal carrier thermoelectric-transport model based on percolation theory in organic semiconductors, Phys. Rev. B: Condens. Matter Mater. Phys., 2015, 91(19), 195205 CrossRef.
- E. Meijer, M. Matters, P. Herwig, D. De Leeuw and T. Klapwijk, The Meyer–Neldel rule in organic thin-film transistors, Appl. Phys. Lett., 2000, 76(23), 3433–3435 CrossRef CAS.
- W. Meyer and H. Neldel, Relation between the energy constant and the quantity constant in the conductivity–temperature formula of oxide semiconductors. Z, Tech. Phys., 1937, 18(12), 588–593 CAS.
- N. M. B. Neto, M. D. Silva, P. T. Araujo and R. N. Sampaio, Photoinduced Self-Assembled Nanostructures and Permanent Polaron Formation in Regioregular Poly(3-hexylthiophene), Adv. Mater., 2018, 30(16), 1705052 CrossRef PubMed.
- Z. Chiguvare and J. Parisi, Current conduction in poly(3-hexylthiophene) and in poly(3-hexylthiophene) doped [6, 6]-phenyl c61-butyric acid methylester composite thin film devices, Z. Naturforsch., A: Phys. Sci., 2012, 67(10-11), 589–600 CrossRef CAS.
- A. Nawaz, A. Kumar and I. A. Hümmelgen, Ultra-high mobility in defect-free poly(3-hexylthiophene-2, 5-diyl) field-effect transistors through supra-molecular alignment, Org. Electron., 2017, 51, 94–102 CrossRef CAS.
- R. Noriega, J. Rivnay, K. Vandewal, F. P. Koch, N. Stingelin, P. Smith, M. F. Toney and A. Salleo, A general relationship between disorder, aggregation and charge transport in conjugated polymers, Nat. Mater., 2013, 12(11), 1038–1044 CrossRef CAS PubMed.
- Z. Bao, A. Dodabalapur and A. J. Lovinger, Soluble and processable regioregular poly(3-hexylthiophene) for thin film field-effect transistor applications with high mobility, Appl. Phys. Lett., 1996, 69(26), 4108–4110 CrossRef CAS.
- R. J. Kline, M. D. McGehee, E. N. Kadnikova, J. Liu, J. M. Fréchet and M. F. Toney, Dependence of regioregular poly(3-hexylthiophene) film morphology and field-effect mobility on molecular weight, Macromolecules, 2005, 38(8), 3312–3319 CrossRef CAS.
- A. Zen, M. Saphiannikova, D. Neher, J. Grenzer, S. Grigorian, U. Pietsch, U. Asawapirom, S. Janietz, U. Scherf and I. Lieberwirth, Effect of molecular weight on the structure and crystallinity of poly(3-hexylthiophene), Macromolecules, 2006, 39(6), 2162–2171 CrossRef CAS.
- M. Brinkmann and P. Rannou, Molecular weight dependence of chain packing and semicrystalline structure in oriented films of regioregular poly(3-hexylthiophene) revealed by high-resolution transmission electron microscopy, Macromolecules, 2009, 42(4), 1125–1130 CrossRef CAS.
- J. Obrzut and K. A. Page, Electrical conductivity and relaxation in poly(3-hexylthiophene), Phys. Rev. B: Condens. Matter Mater. Phys., 2009, 80(19), 195211 CrossRef.
- N. Mott and E. Davis, Electronic processes in non-crystalline materials, Clarendon, Oxford, 2nd edn, 1979 Search PubMed.
- J. C. Dyre and T. B. Schrøder, Universality of ac conduction in disordered solids, Rev. Mod. Phys., 2000, 72(3), 873 CrossRef.
- C. Kittel; P. McEuen and P. McEuen, Introduction to solid state physics. Wiley, New York, 1996, vol. 8 Search PubMed.
- A. Yelon, B. Movaghar and R. Crandall, Multi-excitation entropy: its role in thermodynamics and kinetics, Rep. Prog. Phys., 2006, 69(4), 1145 CrossRef CAS.
- Y. Lubianiker and I. Balberg, A comparative study of the Meyer–Neldel rule in porous silicon and hydrogenated amorphous silicon, J. Non-Cryst. Solids, 1998, 227, 180–184 CrossRef.
- H. Overhof and P. Thomas, Electronic Transport in Hydrogenated Amorphous Semiconductors, Springer-Verlag, Berlin, 1989 Search PubMed.
- M. Kondo, Y. Chida and A. Matsuda, Observation of Meyer-Neldel rule in extended energy regime using novel a-Si: H TFTs, J. Non-Cryst. Solids, 1996, 198, 178–181 CrossRef.
- S. K. Ram, S. Kumar, R. Vanderhaghen and P. R. iCabarocas, Investigations of the electron transport behavior in microcrystalline Si films, J. Non-Cryst. Solids, 2002, 299, 411–415 CrossRef.
- W. Linert and R. Jameson, The isokinetic relationship, Chem. Soc. Rev., 1989, 18, 477–505 RSC.
- R. W. Keyes, Volumes of activation for diffusion in solids, J. Chem. Phys., 1958, 29(3), 467–475 CrossRef CAS.
- B. Rosenberg, G. Kemeny, R. C. Switzer and T. C. Hamilton, Quantitative evidence for protein denaturation as the cause of thermal death, Nature, 1971, 232(5311), 471–473 CrossRef CAS PubMed.
- O. Jaoul and V. Sautter, A new approach to geospeedometry based on thecompensation law’, Phys. Earth Planet. Inter., 1999, 110(1-2), 95–114 CrossRef CAS.
- A. Pivrikas, M. Ullah, T. B. Singh, C. Simbrunner, G. Matt, H. Sitter and N. Sariciftci, Meyer–Neldel rule for charge carrier transport in fullerene devices: a comparative study, Org. Electron., 2011, 12(1), 161–168 CrossRef CAS.
- J. C. Palacios, M. G. Olayo, G. J. Cruz and J. Chávez-Carvayar, Meyer-Neldel rule in plasma polythiophene thin films, Open J. Polym. Chem., 2014, 2014 Search PubMed.
- R. J. Chesterfield, J. C. McKeen, C. R. Newman, P. C. Ewbank, D. A. da Silva Filho, J.-L. Brédas, L. L. Miller, K. R. Mann and C. D. Frisbie, Organic thin film transistors based on N-alkyl perylene diimides: charge transport kinetics as a function of gate voltage and temperature, J. Phys. Chem. B, 2004, 108(50), 19281–19292 CrossRef CAS.
- P. Borsenberger, L. Pautmeier and H. Bässler, Charge transport in disordered molecular solids, J. Chem. Phys., 1991, 94(8), 5447–5454 CrossRef CAS.
- S. Elliott, Ac conduction in amorphous chalcogenide and pnictide semiconductors, Adv. Phys., 1987, 36(2), 135–217 CrossRef CAS.
- W. Linert, A result of resonant energy exchange between reactants and their chemical surrounding: The isokinetic relationship, Collect. Czech. Chem. Commun., 1990, 55(1), 21–31 CrossRef CAS.
- A. Yelon and B. Movaghar, Microscopic explanation of the compensation (Meyer-Neldel) rule, Phys. Rev. Lett., 1990, 65(5), 618 CrossRef PubMed.
- A. Yelon, B. Movaghar and H. Branz, Origin and consequences of the compensation (Meyer-Neldel) law, Phys. Rev. B: Condens. Matter Mater. Phys., 1992, 46(19), 12244 CrossRef PubMed.
- K. Shimakawa and F. Abdel-Wahab, The Meyer–Neldel rule in chalcogenide glasses, Appl. Phys. Lett., 1997, 70(5), 652–654 CrossRef CAS.
- A. Yelon and B. Movaghar, The Meyer–Neldel conductivity prefactor for chalcogenide glasses, Appl. Phys. Lett., 1997, 71(24), 3549–3551 CrossRef CAS.
- S. Gelin, A. Champagne-Ruel and N. Mousseau, Enthalpy-entropy compensation of atomic diffusion originates from softening of low frequency phonons, Nat. Commun., 2020, 11(1), 1–7 CrossRef PubMed.
- A. Yelon, The fallacy of Meyer-Neldel temperature as a measure of disorder, Monatsh. Chem., 2013, 144(1), 91–95 CrossRef CAS.
- N. Mehta, Meyer–Neldel rule in chalcogenide glasses: Recent observations and their consequences, Curr. Opin. Solid State Mater. Sci., 2010, 14(5), 95–106 CrossRef CAS.
- J.-S. Lee, M. V. Kovalenko, J. Huang, D. S. Chung and D. V. Talapin, Band-like transport, high electron mobility and high photoconductivity in all-inorganic nanocrystal arrays, Nat. Nanotechnol., 2011, 6(6), 348–352 CrossRef CAS PubMed.
- F. P. V. Koch, J. Rivnay, S. Foster, C. Müller, J. M. Downing, E. Buchaca-Domingo, P. Westacott, L. Yu, M. Yuan and M. Baklar, The impact of molecular weight on microstructure and charge transport in semicrystalline polymer semiconductors–poly(3-hexylthiophene), a model study, Prog. Polym. Sci., 2013, 38(12), 1978–1989 CrossRef CAS.
- A. G. Dixon, R. Visvanathan, N. A. Clark, N. Stingelin, N. Kopidakis and S. E. Shaheen, Molecular weight dependence of carrier mobility and recombination rate in neat P3HT films, J. Polym. Sci., Part B: Polym. Phys., 2018, 56(1), 31–35 CrossRef CAS.
- N. G. McCrum; B. E. Read and G. Williams, Anelastic and dielectric effects in polymeric solids. 1967.
- R. Xie, Y. Lee, M. P. Aplan, N. J. Caggiano, C. Müller, R. H. Colby and E. D. Gomez, Glass transition temperature of conjugated polymers by oscillatory shear rheometry, Macromolecules, 2017, 50(13), 5146–5154 CrossRef CAS.
- T. G. Fox Jr and P. J. Flory, Second-order transition temperatures and related properties of polystyrene. I. Influence of molecular weight, J. Appl. Phys., 1950, 21(6), 581–591 CrossRef.
- F. Abdel-Wahab, Signature of the Meyer–Neldel rule on the correlated barrier-hopping model, J. Appl. Phys., 2002, 91(1), 265–270 CrossRef CAS.
- G. Pike, AC conductivity of scandium oxide and a new hopping model for conductivity, Phys. Rev. B: Solid State, 1972, 6(4), 1572 CrossRef CAS.
- F. Abdel-Wahab, A. Montaser and A. Yelon, Mechanism of ac and dc conduction in chalcogenide glasses, Monatsh. Chem., 2013, 144(1), 83–89 CrossRef CAS.
- J. P. Crine, A new analysis of the results of thermally stimulated measurements in polymers, J. Appl. Phys., 1989, 66(3), 1308–1313 CrossRef.
- X. Shen, V. V. Duzhko and T. P. Russell, A Study on the Correlation Between Structure and Hole Transport in Semi-Crystalline Regioregular P3HT, Adv. Energy Mater., 2013, 3(2), 263–270 CrossRef CAS.
- H. Sirringhaus, P. Brown, R. Friend, M. M. Nielsen, K. Bechgaard, B. Langeveld-Voss, A. Spiering, R. A. Janssen, E. Meijer and P. Herwig, Two-dimensional charge transport in self-organized, high-mobility conjugated polymers, Nature, 1999, 401(6754), 685–688 CrossRef CAS.
- K. Gu, Y. Wang, R. Li, E. Tsai, J. W. Onorato, C. K. Luscombe, R. D. Priestley and Y.-L. Loo, Role of Postdeposition Thermal Annealing on Intracrystallite and Intercrystallite Structuring and Charge Transport in Poly(3-hexylthiophene), ACS Appl. Mater. Interfaces, 2020, 13(1), 999–1007 CrossRef PubMed.
- J. Van Turnhout, Thermally stimulated discharge of polymer electrets, Polym. J., 1971, 2(2), 173–191 CrossRef CAS.
- Z. Bao, Materials and fabrication needs for low-cost organic transistor circuits, Adv. Mater., 2000, 12(3), 227–230 CrossRef CAS.
- C. D. Dimitrakopoulos and D. J. Mascaro, Organic thin-film transistors: A review of recent advances, IBM J. Res. Dev., 2001, 45(1), 11–27 CAS.
Footnote |
| † Electronic supplementary information (ESI) available. See DOI: https://doi.org/10.1039/d2ma00657j |
| This journal is © The Royal Society of Chemistry 2022 |

