 Open Access Article
Liquid phase high shear exfoliated few-layered graphene for highly sensitive ascorbic acid electrochemical sensors†
Ramu
Banavath
 ab,
Anand
Abhinav
 a,
Siva Sankar
Nemala
 a,
Rohit
Srivastava
 *b and
Parag
Bhargava
*a
aParticulate Materials Laboratory, Department of Metallurgical Engineering and Materials Science, IIT Bombay, 400076, India. E-mail: banavathramu1289@gmail.com; pbhargava@iitb.ac.in
bNanobios Laboratory, Department of Biosciences and Bioengineering, IIT Bombay, 400076, India. E-mail: rsrivasta@iitb.ac.in
First published on 14th October 2022
Abstract
Electrochemical sensors based on graphene have gained importance owing to their high selectivity and sensitivity arising from the high surface area and electrocatalytic activity of graphene based nanomaterials. While significant amount of work has been carried out on graphene synthesis, lesser attention has been paid to synthesis of graphene suited for electrochemical sensing applications. This work demonstrates the synthesis of graphene by using a liquid phase high shear exfoliation (LP-HSE) method. Use of appropriate dispersing and antifoaming agents helped in obtaining a high-quality graphene colloidal suspension in water. Later, the dispersing and antifoaming agents were washed away to get exfoliated graphene suited for electrochemical sensing as confirmed by electrocatalytic activity measurements. The potential usage of exfoliated graphene in electrochemical sensors was confirmed by evaluating the performance of exfoliated graphene for ascorbic acid sensing. Linear sweep voltammetry (LSV) and amperometry techniques were used for ascorbic acid sensing. The sensor based on exfoliated graphene was highly selective and sensitive toward ascorbic acid (AA) oxidation, and the limit of detection (LOD) of fabricated sensors was 1.8 μM. The interference study confirmed that the fabricated sensors are highly selective. The precise determination of AA in vitamin C supplements revealed the potential usage of exfoliated graphene in the real-time determination of AA.
Introduction
Electrochemical sensing is a promising approach to develop highly sensitive, accurate, simple, and cost-effective sensing devices to detect and quantify a wide variety of analytes. The electrochemical sensing ability of these sensors strongly depends on material aspects such as chemical and physical properties and changes in the sensing material characteristics on applying voltage.1,2 Research on developing potential electrode materials for electrochemical sensing applications has immensely increased in recent years.3–8 Initially, carbon-based materials were largely explored as electrode materials in electrochemical sensing applications due to their low cost, chemical inertness, and abundant availability.9,10 Graphene-based nanomaterials have outperformed other carbon-based materials because they are less prone to surface fouling, stable in a wide potential window, have better electron transferability, and are highly selective towards a wide range of analytes.10,11Graphene, a 2-D form of carbon, is known to have excellent electrocatalytic activity towards different analytes, leading to development of electrochemical sensors for the detection of H2O2, uric acid, ascorbic acid, glucose, cholesterol, and dopamine.12–15 A scalable, low-cost, and environmentally friendly graphene synthesis method is required to fabricate graphene-based electrochemical sensors at a large scale. Graphene is produced from graphite by different exfoliation techniques such as chemical reduction methods,13 micromechanical exfoliation,16 electrochemical exfoliation,17 ultrasonication,18 high shear ball milling,19 and liquid-phase exfoliation (LPE).20–22 Graphene prepared by chemical reduction methods was examined for fabrication of electrochemical sensors13 but it was not favored owing to the presence of uncontrolled defects in the material arising from synthesis.23 It is believed that liquid-phase graphene exfoliation methods are more promising due to their simple, cost-effective, environmentally friendly, and scalable nature.24–27 Solvent selection plays a crucial role in deciding the compatibility of graphene produced by liquid-phase exfoliation techniques for electrochemical sensing applications. The energy required for exfoliation should be balanced by solvent–graphene interaction, and the used solvent should be easily removed from the graphene surface.28 Different organic solvents like NMP, DMF, benzyl benzoate, and γ-butyrolactone have been used in the process of liquid-phase graphene exfoliation.24,29–31 The surface tension of most of these organic solvents (γ = 40 mJ m−2) helps to get highly stable graphene dispersion after exfoliation of graphite.20 Even then, the use of above solvents is not desirable as it is difficult to remove these solvents from synthesized graphene which limits the performance of the sensors in terms of electrocatalytic activity and selectivity. Thus, in this study we report water (γ = 70 mJ m−2) as a solvent with suitable dispersing agents for liquid phase exfoliation (LPE) of graphene by using a high-shear exfoliation method. The potential usage of high-shear exfoliated few layered graphene (FLG) in electrochemical sensors was studied by standard electrochemical characterization and electrochemical sensing of AA.
1. Experimental
1.1 Preparation of high-shear exfoliated few layered graphene (HSE-FLG)
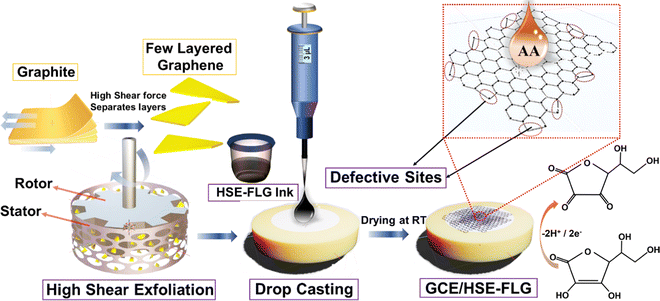
High shear exfoliation of FLG was done by a three-stage liquid-phase exfoliation (LPE) method (Scheme 1). This method involves graphite dispersion in solvent (water), exfoliation and separation. In the typical synthesis process, 1 l natural graphite (10 μm) suspension was prepared by adding 50 mg ml−1 natural graphite in water and 1 wt% surfactant (formulations are based on a patent).32 The prepared graphite suspension was sonicated for 30 minutes for the proper dispersion of graphite in water. The dispersed graphite suspension was subjected to high shear mixing using a Ross-Mixer at 8000 rpm for 10 hours. The temperature rise during the high shear exfoliation process was maintained using an ice bath. The exfoliated graphite suspension was subjected to ultrasonication to separate the exfoliated graphite from graphene. Next, the exfoliated graphene suspension was centrifuged at 10000 rpm for 10 minutes to separate the graphene nanoplatelets (GNPs) from the few layered graphene (FLG) solution. The FLG suspension was heated at 60 °C to remove the solvent (water), and the FLG residue was washed with the acetone and ethanol mixture several times. The collected FLG powder was dried in a vacuum oven at 60 °C for 24 hours, and as-prepared FLG was used for electrochemical characterization.1.2 Preparation of the HSE-FLG-based modified glassy carbon electrode (GCE)
The GCEs were coated with HSE-FLG based ink for electrochemical characterization and sensing studies (Scheme 1). In the typical ink preparation process, 7 mg of HSE-FLG was added to 1 ml of water and ethanol mixture (1![[thin space (1/6-em)]](https://www.rsc.org/images/entities/char_2009.gif) :
:![[thin space (1/6-em)]](https://www.rsc.org/images/entities/char_2009.gif) 1). Then, 20 μl of Nafion (serves as a binder) solution was added to the prepared mixture. The prepared HSE-FLG suspension was sonicated for 60 minutes to get a homogeneously dispersed ink. The GCEs were polished with alumina powders of different grades (1, 0.1, and 0.05 μm) and washed in ethanol by sonicating them for 5 minutes. The washed GCEs were dried by purging nitrogen gas. The dried GCEs were coated with 3 μl of prepared HSE-FLG based ink by drop-casting. The HSE-FLG coated GCEs were dried at room temperature for 60 minutes. The modified GCEs were used for further electrochemical characterization and sensing studies.
1). Then, 20 μl of Nafion (serves as a binder) solution was added to the prepared mixture. The prepared HSE-FLG suspension was sonicated for 60 minutes to get a homogeneously dispersed ink. The GCEs were polished with alumina powders of different grades (1, 0.1, and 0.05 μm) and washed in ethanol by sonicating them for 5 minutes. The washed GCEs were dried by purging nitrogen gas. The dried GCEs were coated with 3 μl of prepared HSE-FLG based ink by drop-casting. The HSE-FLG coated GCEs were dried at room temperature for 60 minutes. The modified GCEs were used for further electrochemical characterization and sensing studies.
2. Material and electrochemical characterization of prepared HSE-FLG
The crystalline structure of exfoliated FLG was investigated by X-ray diffractometry (PANalytical-MRDTM with a Cu Kα radiation source of λ = 1.5406 Å). The phonon vibrational modes corresponding to exfoliated FLG were studied with a HORIBA HR800 Raman spectrometer using an argon laser, with an excitation wavelength of 514.5 nm. The study of functional groups formed in exfoliated FLG was carried out by using an X-ray photoelectron spectrometer (XPS, ULVAC-PHI 5000 VersaProbell). The morphology, number of layers, and the structure of prepared HSE-FLG were investigated using FEG-SEM (Hitachi, S-3400N) and FEG-TEM (Thermo Scientific, Themis 300 G3). All electrochemical characterization was carried out on a potentiostat (302N), where a GCE was used as the working electrode (WE), platinum wire was used as the counter electrode (CE), and a Ag/AgCl electrode was used as the reference electrode (RE). The standard electrochemical characterization techniques like cyclic voltammetry (CV), electrochemical impedance spectroscopy (EIS), and Tafel analysis were carried out in 0.01 M ferricyanide containing 0.1 M KCl as the supporting electrolyte. All electrochemical sensing studies were carried out in a 0.01 M PBS solution of pH 7.4.3. Results and discussion
3.1 HSE-FLG's crystal structure, morphology, high-resolution microstructure, vibrational modes, and surface analysis
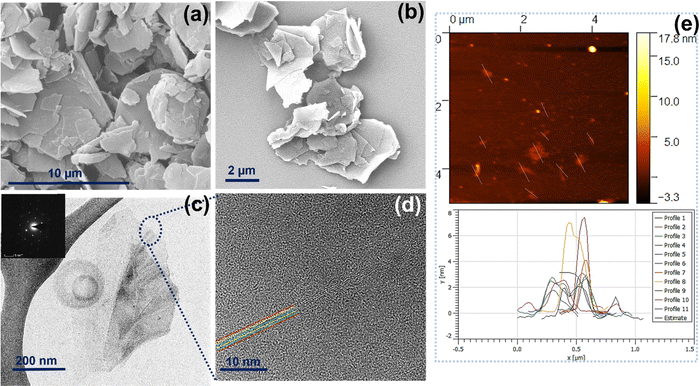
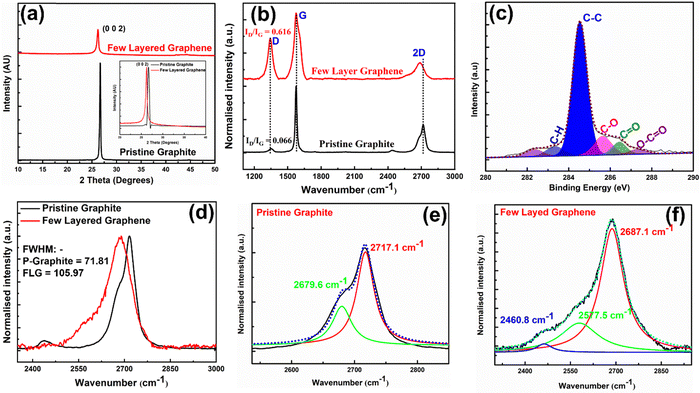
Morphological and high-resolution microstructural analyses of HSE-FLG were carried out by FEG-SEM and FEG-TEM. Both FEG-SEM and FEG-TEM images are shown in Fig. 1. The exfoliation of bulk graphite into small graphene flakes can be observed in the FEG-SEM images of pristine graphite and HSE-FLG. Comparison of the FEG-SEM images of HSE-FLG and pristine graphite confirms the decrease in flake size from 10 μm to <500 nm. FEG-TEM images of HSE-FLG show thin graphene flakes with a lateral size of less than 3 μm. The HR-TEM image of HSE-FLG shows a clear indication of graphene flakes with less than six layers. The flake size distribution and thickness of exfoliated FLG were analyzed from AFM imaging. Fig. 1(e) shows the AFM image of HSE-FLG. Graphene sheets with a lateral size of 100–2000 nm were observed. The thickness of HSE-FLG of less than 3 nm indicates the presence of less than six layers in the exfoliated graphene.X-ray diffraction spectra of exfoliated HSE-FLG and pristine graphite are shown in Fig. 2(a). The XRD pattern of HSE-FLG showed a strong characteristic graphite peak of the basal plane (0 0 2), indicating the highly organized crystalline nature of hexagonal graphite. The decreased intensity and increased broadness along with peak shift to lower two theta values (inset of Fig. 2(a)) of HSE-FLG's basal plane peak as compared to the pristine graphite peak indicate the decrease in the number of layers of pristine graphite and confirm the exfoliation of graphite. The quality of exfoliated FLG was studied by Raman spectroscopy. Fig. 2(g) shows the Raman Spectra of HSE-FLG and pristine graphite. The G band at 1575.8 cm−1 is assigned to the sp2-hybridization of carbon, and the D band at 1343.7 cm−1 is used to study the defective nature of graphene. The relative intensity ratio of the D to G band indicates the defect density of graphene.33 The increased relative ratio of the D to G band from 0.066 (pristine graphite) to 0.616 (FLG) confirms the presence of a considerable amount of defective sites in HSE-FLG. The 2D band gives information about the number of layers in graphene. The comparison of HSE-FLG's 2D band with pristine graphite showed an increase in broadness and a shift in the 2D peak to lower wavelengths confirming the decreased number of layers in the exfoliated graphene (Fig. 1(d)). The Lorentzian fit of the 2D peak usually gives detailed information about the number of layers in the exfoliated graphene (Fig. 2(e) and (f)). The shift of deconvoluted peaks in the 2D band to lower wavelengths (2687.1, 2577.5, 2460.8) and the presence of an extra peak as compared to pristine graphite indicate that the possible layers in HSE-FLG could be lower than 6.34,35
The XPS analysis of HSE-FLG confirmed the defective site type and nature. Fig. 2(c) shows the deconvoluted XPS spectra of exfoliated FLG. The XPS peak at a binding energy of 284.5 eV represents the graphitic carbon (C–C) in HSE-FLG. The extra peaks at higher binding energies represent the oxygen functional groups confirming the presence of defective sites in HSE-FLG.36,37 The high shear forces during exfoliation break the graphene flakes resulting in the formation of defective sites. The defects formed during exfoliation are usually saturated by oxygen functional groups. The relative intensity of oxygen functional groups to graphitic carbon indicates low concentrations of defective sites in HSE-FLG.
3.2 Electrochemical characterization of HSE-FLG in the standard ferricyanide electrolyte
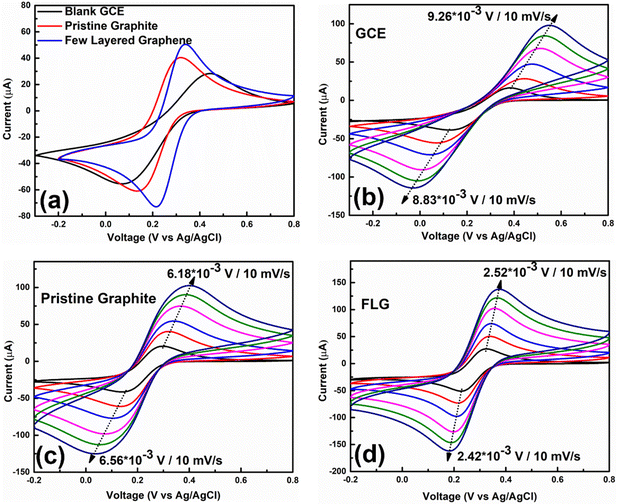
The potential application of HSE-FLG in electrochemical sensors needs to be checked by different electrochemical characterization techniques like cyclic voltammetry (CV), electrochemical impedance spectroscopy (EIS), and Tafel analysis. The prepared modified GCEs were used for all electrochemical characterization. 0.01 M potassium ferricyanide solution was used as the standard electrolyte with 0.1 M KCl as the supporting electrolyte in all electrochemical studies. Fig. 3(a) shows the CV of HSE-FLG, where reversible oxidation and reduction peaks of ferricyanide can be observed. All the CV parameters are shown in Table 1. The CV comparison of HSE-FLG with blank GCE and pristine graphene indicates a higher output current and lower peak-to-peak potential (ΔV) for exfoliated graphene. The peak-to-peak potential (ΔV) in the case of HSE-FLG is 110 mV, nearly close to the ideal ΔV (59 mV) of the standard electrochemical system. CV with increasing scan rate was done to understand electron transfer kinetics at the surface of the prepared electrodes. Fig. 3(b)–(d) shows the CV of GCE, pristine graphite, and HSE-FLG with increasing scan rate. The peak shift with increasing scan rate in the case of HSE-FLG is extremely low compared to blank GCE and pristine graphite, indicating that the electrochemical reaction is ultimately adsorption controlled (decreased kinematic limitations). The increase in output current with increasing scan rate according to the linearity of the square root of scan rate vs. output current calibration plot indicates that the system is highly reversible and has no involvement of diffusional limitations (Fig. S2, ESI†). The higher slope of the square root of scan rate vs. output current calibration plot for HSE-FLG indicates the increased electrocatalytic activity of exfoliated graphene. The increased electrocatalytic activity and electron transfer capability of HSE-FLG are due to the existing oxygen functional groups (defective sites) and the higher specific surface area of HSE-FLG (Table 1). As a result, the ion adsorption capability of the electrode also increases. So, the effective electroactive surface area (Aeff) and ion adsorption quantity (Ψ) of the prepared electrodes were calculated with the help of the Randles–Sevcik theory.38 | (1) |
 | (2) |
![[thin space (1/6-em)]](https://www.rsc.org/images/entities/char_2009.gif) 485 coulombs mol−1) is the Faraday constant, R (8.314 J mol−1 K−1) is the gas constant, T is the absolute temperature, Aeff is the effective electroactive surface area, and Ψ is the adsorption quantity of electroactive ions.
485 coulombs mol−1) is the Faraday constant, R (8.314 J mol−1 K−1) is the gas constant, T is the absolute temperature, Aeff is the effective electroactive surface area, and Ψ is the adsorption quantity of electroactive ions.
| Sample | I ox (μA) | I red (μA) | Oxn potential (mV) | Red potential (mV) | ΔV (mV) | A eff (cm2) | SSA (m2 g−1) | Ψ (mol cm−2) |
|---|---|---|---|---|---|---|---|---|
| GCE | 28.335 | 55.502 | 445 | 63 | 382 | 0.978 | 12.32 × 10⁻¹⁰ | |
| Pristine graphite | 40.392 | 60.991 | 334 | 134 | 200 | 1.013 | 12.18 | 17.27 × 10⁻¹⁰ |
| FLG | 50.729 | 73.048 | 336 | 222 | 114 | 1.357 | 133.45 | 22.02 × 10⁻¹⁰ |
The calculated Aeff of all three samples is shown in Table 1. The comparison of calculated Aeff indicates the significant increase in the effective electroactive area of HSE-FLG based electrodes. As a result, the absorbed ion quantity was increased for HSE-FLG based electrodes, which led to the superior electrochemical properties of HSE-FLG. So, from all CV results, we can conclude that HSE-FLG has significantly improved electrocatalytic activity due to its increased effective electroactive sites (oxygen functional groups) and enhanced adsorption capability. The increased specific surface area (SSA) of exfoliated graphene confirms the enhanced electroactive sites and absorption capability of exfoliated graphene.
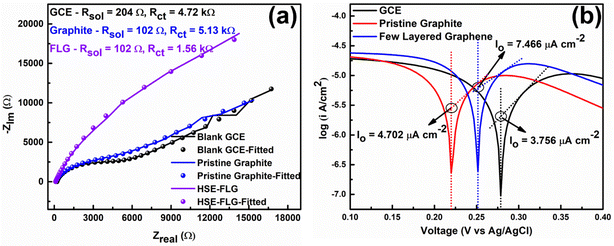
The electron transfer capability of HSE-FLG was further confirmed by using electrochemical impedance spectroscopy (EIS) and Tafel analysis. Fig. 4 shows the EIS and Tafel plots of GCE, pristine graphite, and HSE-FLG. The charge transfer resistance (Rct) directly represents the electron transfer capability of electrode materials. The Rct value of all three electrodes was calculated by fitting the EIS plot using NOVA 1.11 software. The equivalent circuits for fitted EIS plots are shown in Fig. S3 (ESI†). The simulated Rct values can be found in Table 2. The significant decrease in the Rct value of HSE-FLG compared to GCE and pristine graphite indicates a substantial improvement in electron transfer capability. This charge transfer ability of HSE-FLG is further explained by Tafel analysis. The calculated exchange current density (Jo) values of all three samples are shown in Table 2. The higher Jo for HSE-FLG confirms the better electron transfer capability of exfoliated graphene, and it supports the simulated Rct value of HSE-FLG by eqn (4):8,39
 | (3) |
 | (4) |
| Samples | J o (A cm−2) | K o (cm s−1) | R ct (k Ohm) |
|---|---|---|---|
| GCE | 3.756 × 10⁻⁶ | 3.890 × 10⁻⁹ | 4.91 |
| Pristine graphite | 4.402 × 10⁻⁶ | 4.874 × 10⁻⁹ | 5.12 |
| FLG | 7.466 × 10⁻⁶ | 7.738 × 10⁻⁹ | 1.56 |
The reaction rate constant (Ko) is another essential property of electrode materials that reveals the ideal characteristics of electrochemical sensor electrode materials. The Ko is calculated using the EIS and Tafel analysis (Table 2) following eqn (3). The significant increase in the Ko value of HSE-FLG indicates that the exfoliated graphene has high electrocatalytic activity and is approaching the ideal electrochemical sensor electrode behavior. All electrochemical characterization of HSE-FLG confirmed the superior electrochemical properties of HSE-FLG. Hence, the prepared HSE-FLG can be used as an electrode material to develop different electrochemical sensors.
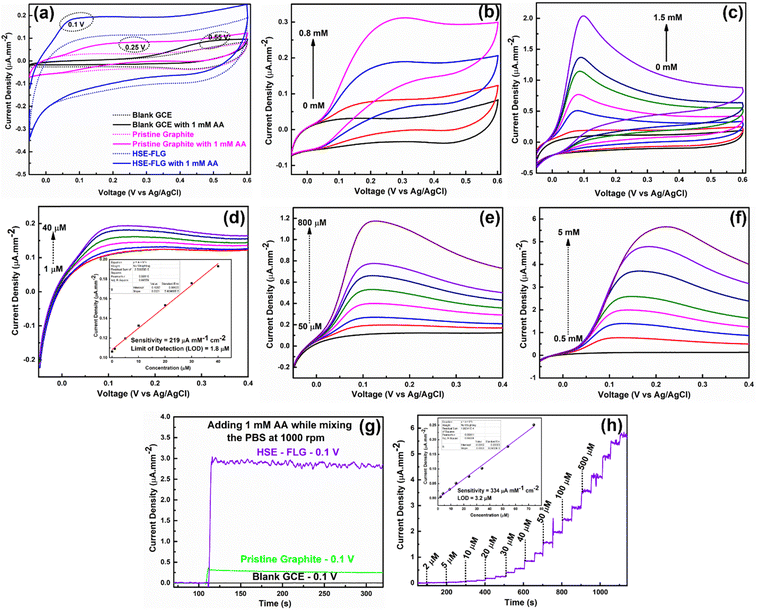
The electrochemical sensing capability of HSE-FLG was studied by using the ascorbic acid (AA) analyte. Electrochemical oxidation is the sensing mechanism of exfoliated graphene for electrochemical sensing of AA, which can be seen in Scheme 1. Fig. 5(a) shows the CV of blank GCE, pristine graphite, and HSE-FLG in the presence of 0.1 mM AA. The CV comparison of all three samples showed a significant increase in output oxidation current density for HSE-FLG in the presence of AA, indicating the effective oxidation of AA at 0.1 V by HSE-FLG. The reversibility in the oxidation of AA adsorbed on the electrode surface is due to fast disproportionation of semihydroascorbic acid to ascorbic acid and dehydroascorbic acid. The increase in the current density of HSE-FLG is mainly correlated to the concentration of electroactive sites of HSE-FLG. The AA oxidation peak position in the case of HSE-FLG is shifted from 0.55 V to 0.1 V due to the selective oxidation of AA with the defective sites present in the exfoliated FLG. The shift of the AA oxidation peak to lower voltages is also an advantage in the case of HSE-FLG to avoid many interference problems. Fig. 5(b) and (c) shows the CV of pristine graphite and HSE-FLG with continuously increasing AA concentration. It can be seen that the rate of increase in the current density of HSE-FLG is much higher than that of pristine graphite. The AA oxidation peak shift with increasing AA concentration for pristine graphite is much higher than that for HSE-FLG, indicating the improved kinematic limitations of HSE-FLG based electrodes for AA detection. The CV plot of HSE-FLG with an increase in AA concentration following the linearity with respect to peak current indicates the effectiveness of detecting AA. All the improved electrochemical properties of HSE-FLG are mainly due to the increased electroactive area and enhanced electron transferability. Hence, HSE-FLG can be used to develop electrochemical AA sensors.
Linear sweep voltammetry (LSV) and hydrodynamic amperometric characterization were used to measure AA. The LSV of HSE-FLG with a continuous increase in AA concentration was carried out to determine the sensitivity and LOD of HSE-FLG based AA sensors. Fig. 5(d)–(f) shows the LSV of HSE-FLG based AA sensors. The current density of exfoliated graphene's LSV increases from 1 μM AA. There was no considerable increase in output current density for lower AA concentrations (<1 μM), indicating that the maximum detectable quantity of AA by HSE-FLG is 1 μM. The inset of Fig. 5(d) shows the calibration plot for the LSV of HSE-FLG. The sensitivity and LOD of HSE-FLG based AA sensors were calculated by regression analysis. The calculated sensitivity of fabricated AA sensors was 219 μA mM−1 cm−1, and the LOD of the sensor was 1.8 μM. The LSV of HSE-FLG for higher concentrations of AA also shows a continuous increment in output current density (Fig. 5(e) and (f)). The calibration plots of LSV at higher concentrations of AA also follow perfect linearity indicating accurate detection of AA even at more than 5 mM concentration of AA (Fig. S4(a) and (b), ESI†).
Hydrodynamic amperometric characterization of HSE-FLG based AA sensors was done to determine the maximum possible sensitivity and detection time of AA sensors. Fig. 5(g) shows an amperometry comparison of blank GCE, pristine graphite, and HSE-FLG by adding 1 mM AA while continuously mixing the electrolyte at 1000 rpm at an applied voltage of 0.1 V. The higher output current density in the case of HSE-FLG indicates the superior electrocatalytic activity of HSE-FLG towards the oxidation of AA. Fig. 5(h) shows the hydrodynamic amperometry of HSE-FLG by adding different concentrations of AA at a 50 s time interval while mixing the electrolyte at 1000 rpm. The continuous increment in output current density following the linearity can be observed from the inset of Fig. 5(h). The maximum possible sensitivity of HSE-FLG based AA sensors was 334 μA mM−1 cm−1, and the detection time was less than 5 seconds. The comparison of the HSE-FLG based AA sensor with other graphene exfoliation technique-based AA sensors indicating the significant improvement confirms the potential usage of the HSE method for graphene synthesis in electrochemical sensors (Table 3).
| Electrode type | Method for graphene synthesis | Sensitivity (μA mM−1 cm−2) | LOD (μM) | Linear range (μM) | Ref. |
|---|---|---|---|---|---|
| N-rGO | Chemical | — | 9.6 | 100–4000 | 12 |
| GS-PTCA | Chemical | — | 5.60 | 20–420 | 40 |
| rGO | Chemical | — | 4.7 | — | 41 |
| Gr ink | — | — | 17.8 | 5–1000 | 42 |
| N-rGO | Chemical | — | 16.7 | 50–4000 | 43 |
| CeO2/rGO | Chemical | — | 10 | 50–150 | 44 |
| T-GO | Chemical | — | 47 | 500–5000 | 45 |
| N-3D Gr | Chemical | — | 24.33 | 100–7000 | 46 |
| Poly-L-Cys/GPE | CVD | 91.11 | 0.231 | 1–260 | 47 |
| GR/CVD | CVD | — | 1.58 | 5–1500 | 48 |
| Gr nanosheets | Ultrasonication | 260.56 | 120 | 400–6000 | 49 |
| Pristine graphene | Ultrasonication | 65.62 | 6.45 | 9–2314 | 50 |
| rGO | Thermal | 2.5 μA mM−1 | — | 50–30![[thin space (1/6-em)]](https://www.rsc.org/images/entities/char_2009.gif) 000 000 |
51 |
| HSE-FLG-LSV | Liquid phase | 219 | 1.8 | 1–5000 | This Work |
| HSE-FLG-Ampero | Liquid phase | 314 | 3.2 | 2–1600 | This Work |
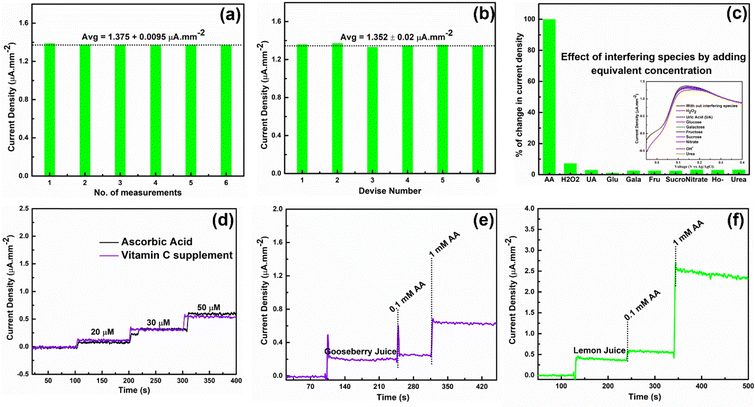
Repeatability and reproducibility of fabricated AA sensors were studied by LSV in the presence of 1 mM AA. Fig. 6(a) and (b) shows the repeatability and reproducibility studies of fabricated HSE-FLG based AA sensors. There was a minor change in the output oxidation peak current density for different measurements of the same device and the same measurement for different devices, indicating that the fabricated sensors are accurate in detecting AA (can be seen in the LSV plots of Fig. S5(a) and (b), ESI†). Interference study of fabricated sensors was done by LSV in the presence of equivalent concentrations of different interfering species (Fig. 6(c)). There was no considerable effect on AA oxidation peak current density in the presence of different interfering species, which can be seen in the LSV plots of HSE-FLG in the presence of different interfering species (inset of Fig. 6(c)). So, from the interference study of fabricated sensors, it can be concluded that HSE-FLG is highly selective towards the oxidation of AA. Hence, the fabricated sensors can be used to detect AA in real samples.
Real sample analysis of fabricated sensors was done by hydrodynamic amperometry in 0.01 M PBS solution of pH 7.4 while continuously mixing the electrolyte at 1000 rpm. Vitamin C supplements and natural citrus fruits (gooseberry, lemon) juice were chosen for recovery and real sample analysis. As per the AA content in the vitamin C supplement, the stock solution was prepared in PBS solution by maintaining a 0.01 M concentration of electrolyte. The same stock solution was used for the recovery analysis. Fig. 6(d) shows the hydrodynamic amperometry comparison of vitamin C supplements and AA. The output current density response for the same concentrations of pure AA and AA in vitamin C supplements shows approximately same current density, indicating that the fabricated HSE-FLG-based AA sensors accurately measure AA in commercial samples. The recovery analysis data for vitamin C supplements suggest that the recovery is approximately equal to 100%, with a deviation not exceeding more than 10 (Table S1, ESI†). AA determination in citrus fruit (gooseberry, lemon) juice was done by adding 1/10th volume of citrus juice in PBS solution by maintaining 0.01 M concentration. Fig. 6(e) and (f) shows the hydrodynamic amperometry of HSE-FLG based AA sensors towards citrus juice. The significant increase in current density with no change in noise after adding citrus juice indicates that the fabricated sensors are compatible with measuring AA in natural samples. The addition of pure AA after adding citrus juice also shows an increment for different concentrations of AA, indicating that the fabricated sensors can accurately measure the AA in real samples. So, all these real sample analysis results indicate the potential usage of fabricated HSE-FLG based AA sensors in the real-time detection of AA.
The stability of fabricated HSE-FLG based AA sensors was studied by the hydrodynamic amperometric technique in 1 mM AA. The fabricated electrode was stored in 0.01 M PBS solution of pH 7.4 and the response towards 1 mM AA over a period of 18 days was measured. Fig. 7 shows the hydrodynamic amperometric plots for the stability study. The HSE-FLG modified electrode showed consistent output amperometric current density for 18 days of AA measurements indicating that the HSE-FLG based AA sensors are highly stable.
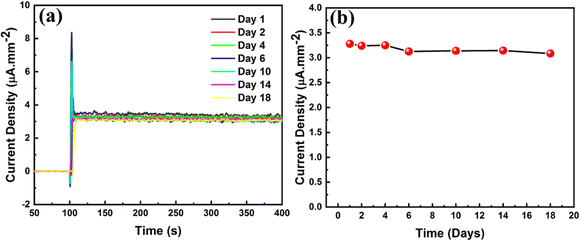 | ||
| Fig. 7 (a) Amperometric plots of HSE-FLG modified GCE towards 1 mM AA on different days and (b) stability study of the HSE-FLG based AA sensor. | ||
Conclusion
This study demonstrates the use of graphene synthesized by the liquid-phase exfoliation technique in electrochemical sensing applications. The challenges posed by the use of organic solvents were addressed with the use of water as a solvent for graphene exfoliation resulting in graphene which was found to be compatible for electrochemical sensing. The defect sites in graphene that developed during high shear graphene exfoliation helped in enhancing the electrochemical activity of exfoliated FLG. The defect sites in the exfoliated FLG helped to develop a highly sensitive AA sensor with a sensitivity of 334 μA mM−1 cm−1 and a detection limit of 1.8 μM. The interference and real sample analysis of fabricated AA sensors revealed the potential usage of HSE-FLG based AA sensors for real-time determination of AA. In summary, it can be concluded that the liquid phase high shear exfoliation of graphene by using water as a solvent is a possible solution for the large-scale production of FLG for electrochemical sensing applications. The exfoliated graphene with high electrocatalytic activity can be used to make inks suited for screen printed electrodes for electrochemical sensing applications. The material can thus be a potential candidate for the point-of-care diagnosis of AA.Conflicts of interest
There are no conflicts of interest, either financial or otherwise.Acknowledgements
The authors would like to thank the BSBE Department, IIT Bombay for providing the required chemicals, SAIF at IIT Bombay for characterization facilities, the Central Surface Analytical Facility (ESCA) of IIT Bombay for XPS measurements, and Dr Sateesh Prathapani for the help in the synthesis of graphene.References
- D. W. Kimmel, G. LeBlanc, M. E. Meschievitz and D. E. Cliffel, Electrochemical sensors and biosensors, Anal. Chem., 2012, 84, 685–707, DOI:10.1021/ac202878q.
- J. M. Pingarrón, R. Villalonga and P. Yáñez-Sedeño, Nanoparticle-modified electrodes for sensing, 2014 DOI:10.4032/9789814364911.
- L. Qian, S. Durairaj, S. Prins and A. Chen, Nanomaterial-based electrochemical sensors and biosensors for the detection of pharmaceutical compounds, Biosens. Bioelectron., 2021, 175, 112836, DOI:10.1016/j.bios.2020.112836.
- K. Murtada and V. Moreno, Nanomaterials-based electrochemical sensors for the detection of aroma compounds - towards analytical approach, J. Electroanal. Chem., 2020, 861, 113988, DOI:10.1016/j.jelechem.2020.113988.
- R. Banavath, R. Srivastava and P. Bhargava, Nanoporous cobalt hexacyanoferrate nanospheres for screen-printed H2O2 sensors, ACS Appl. Nano Mater., 2021, 4, 5564–5576, DOI:10.1021/acsanm.1c01068.
- R. Banavath, R. Srivastava and P. Bhargava, EDTA derived graphene supported porous cobalt hexacyanoferrate nanospheres as a highly electroactive nanocomposite for hydrogen peroxide sensing, Catal. Sci. Technol., 2022, 2369–2383, 10.1039/d2cy00003b.
- C. Zhang and X. Du, Electrochemical sensors based on carbon nanomaterial used in diagnosing metabolic disease, Front. Chem., 2020, 8, 1–8, DOI:10.3389/fchem.2020.00651.
- R. Banavath, R. Srivastava and P. Bhargava, Improved non-enzymatic H2O2 sensors using highly electroactive cobalt hexacyanoferrate nanostructures prepared through EDTA chelation route, Mater. Chem. Phys., 2021, 267, 124593, DOI:10.1016/j.matchemphys.2021.124593.
- A. C. Power, B. Gorey, S. Chandra and J. Chapman, Carbon nanomaterials and their application to electrochemical sensors: A review, Nanotechnol. Rev., 2018, 7, 19–41, DOI:10.1515/ntrev-2017-0160.
- E. M. Kirchner and T. Hirsch, Recent developments in carbon-based two-dimensional materials: Synthesis and modification aspects for electrochemical sensors, Microchim. Acta, 2020, 187 DOI:10.1007/s00604-020-04415-3.
- Y. Shao, J. Wang, H. Wu, J. Liu, I. A. Aksay and Y. Lin, Graphene based electrochemical sensors and biosensors: A review, Electroanalysis, 2010, 22, 1027–1036, DOI:10.1002/elan.200900571.
- H. Zhang and S. Liu, Electrochemical sensors based on nitrogen-doped reduced graphene oxide for the simultaneous detection of ascorbic acid, dopamine and uric acid, J. Alloys Compd., 2020, 842, 155873, DOI:10.1016/j.jallcom.2020.155873.
- H. Shamkhalichenar and J.-W. Choi, Review—non-enzymatic hydrogen peroxide electrochemical sensors based on reduced graphene oxide, J. Electrochem. Soc., 2020, 167, 037531, DOI:10.1149/1945-7111/ab644a.
- M. A. Deshmukh, B. C. Kang and T. J. Ha, Non-enzymatic electrochemical glucose sensors based on polyaniline/reduced-graphene-oxide nanocomposites functionalized with silver nanoparticles, J. Mater. Chem. C, 2020, 8, 5112–5123, 10.1039/c9tc06836h.
- Z. Li, C. Xie, J. Wang, A. Meng and F. Zhang, Direct electrochemistry of cholesterol oxidase immobilized on chitosan-graphene and cholesterol sensing, Sens. Actuators, B, 2015, 208, 505–511, DOI:10.1016/j.snb.2014.11.054.
- R. C. Sinclair, J. L. Suter and P. V. Coveney, Micromechanical exfoliation of graphene on the atomistic scale, Phys. Chem. Chem. Phys., 2019, 21, 5716–5722, 10.1039/c8cp07796g.
- K. Parvez, R. Li, S. R. Puniredd, Y. Hernandez, F. Hinkel, S. Wang, X. Feng and K. Müllen, Electrochemically exfoliated graphene as solution-processable, highly conductive electrodes for organic electronics, ACS Nano, 2013, 7, 3598–3606, DOI:10.1021/nn400576v.
- S. M. Notley, Highly concentrated aqueous suspensions of graphene through ultrasonic exfoliation with continuous surfactant addition, Langmuir, 2012, 28, 14110–14113, DOI:10.1021/la302750e.
- V. León, M. Quintana, M. A. Herrero, J. L. G. Fierro, A. D. La Hoz, M. Prato and E. Vázquez, Few-layer graphenes from ball-milling of graphite with melamine, Chem. Commun., 2011, 47, 10936–10938, 10.1039/c1cc14595a.
- A. Amiri, M. Naraghi, G. Ahmadi, M. Soleymaniha and M. Shanbedi, A review on liquid-phase exfoliation for scalable production of pure graphene, wrinkled, crumpled and functionalized graphene and challenges, FlatChem, 2018, 8, 40–71, DOI:10.1016/j.flatc.2018.03.004.
- R. Banavath, S. S. Nemala, R. Srivastava and P. Bhargava, Non-enzymatic H2O2 sensor using liquid phase high-pressure exfoliated graphene, J. Electrochem. Soc., 2021, 168, 086508, DOI:10.1149/1945-7111/ac1eb6.
- R. Banavath, A. Abhinav, R. Srivastava and P. Bhargava, Highly sensitive ascorbic acid sensors from EDTA chelation derived nickel hexacyanoferrate/graphene nanocomposites, Electrochim. Acta, 2022, 419, 140335, DOI:10.1016/j.electacta.2022.140335.
- S. Roy, N. Soin, R. Bajpai, D. S. Misra, J. A. McLaughlin and S. S. Roy, Graphene oxide for electrochemical sensing applications, J. Mater. Chem., 2011, 21, 14725–14731, 10.1039/c1jm12028j.
- Y. Xu, H. Cao, Y. Xue, B. Li and W. Cai, Liquid-phase exfoliation of graphene: An overview on exfoliation media, techniques, and challenges, Nanomaterials, 2018, 8 DOI:10.3390/nano8110942.
- Y. Hernandez, V. Nicolosi, M. Lotya, F. M. Blighe, Z. Sun, S. De, I. T. McGovern, B. Holland, M. Byrne, Y. K. Gun’ko, J. J. Boland, P. Niraj, G. Duesberg, S. Krishnamurthy, R. Goodhue, J. Hutchison, V. Scardaci, A. C. Ferrari and J. N. Coleman, High-yield production of graphene by liquid-phase exfoliation of graphite, Nat. Nanotechnol., 2008, 3, 563–568, DOI:10.1038/nnano.2008.215.
- Z. Li, R. J. Young, C. Backes, W. Zhao, X. Zhang, A. A. Zhukov, E. Tillotson, A. P. Conlan, F. Ding, S. J. Haigh, K. S. Novoselov and J. N. Coleman, Mechanisms of liquid-phase exfoliation for the production of graphene, ACS Nano, 2020, 14, 10976–10985, DOI:10.1021/acsnano.0c03916.
- R. Banavath, S. S. Nemala, S. H. Kim, S. Bohm, M. Z. Ansari, D. Mohapatra and P. Bhargava, Industrially scalable exfoliated graphene nanoplatelets by high-pressure airless spray technique for high-performance supercapacitors, FlatChem, 2022, 33, 100373, DOI:10.1016/j.flatc.2022.100373.
- S. Haar, M. El Gemayel, Y. Shin, G. Melinte, M. A. Squillaci, O. Ersen, C. Casiraghi, A. Ciesielski and P. Samorì, Enhancing the liquid-phase exfoliation of graphene in organic solvents upon addition of n-octylbenzene, Sci. Rep., 2015, 5, 1–9, DOI:10.1038/srep16684.
- X. An, T. Simmons, R. Shah, C. Wolfe, K. M. Lewis, M. Washington, S. K. Nayak, S. Talapatra and S. Kar, Stable aqueous dispersions of noncovalently functionalized graphene from graphite and their multifunctional high-performance applications, Nano Lett., 2010, 10, 4295–4301, DOI:10.1021/nl903557p.
- J. N. Coleman, Liquid-phase exfoliation of nanotubes and graphene, Adv. Funct. Mater., 2009, 19, 3680–3695, DOI:10.1002/adfm.200901640.
- D. Parviz, F. Irin, S. A. Shah, S. Das, C. B. Sweeney and M. J. Green, Challenges in liquid-phase exfoliation, processing, and assembly of pristine graphene, Adv. Mater., 2016, 28, 8796–8818, DOI:10.1002/adma.201601889.
- S. S. Nemala, S. Ravulapalli, P. Kartikay, R. Banavath, S. Mallick, P. Bhargava, M. Bhushan and D. Mohapatra, Natural solvent facilitated high-shear exfoliated graphene nanoplatelets enabled economically-efficient and stable DSSC, Mater. Lett., 2021, 287, 129263, DOI:10.1016/j.matlet.2020.129263.
- L. M. Malard, M. A. Pimenta, G. Dresselhaus and M. S. Dresselhaus, Raman spectroscopy in graphene, Phys. Rep., 2009, 473, 51–87, DOI:10.1016/j.physrep.2009.02.003.
- M. S. Dresselhaus, A. Jorio, M. Hofmann, G. Dresselhaus and R. Saito, Perspectives on carbon nanotubes and graphene Raman spectroscopy, Nano Lett., 2010, 10, 751–758, DOI:10.1021/nl904286r.
- L. Xu, J. W. McGraw, F. Gao, M. Grundy, Z. Ye, Z. Gu and J. L. Shepherd, Production of high-concentration graphene dispersions in low-boiling-point organic solvents by liquid-phase noncovalent exfoliation of graphite with a hyperbranched polyethylene and formation of graphene/ethylene copolymer composites, J. Phys. Chem. C, 2013, 117, 10730–10742, DOI:10.1021/jp4008009.
- B. Gupta, N. Kumar, K. Panda, V. Kanan, S. Joshi and I. Visoly-Fisher, Role of oxygen functional groups in reduced graphene oxide for lubrication, Sci. Rep., 2017, 7, 1–14, DOI:10.1038/srep45030.
- C. S. Lee, S. J. Shim and T. H. Kim, Scalable preparation of low-defect graphene by urea-assisted liquid-phase shear exfoliation of graphite and its application in doxorubicin analysis, Nanomaterials, 2020, 10 DOI:10.3390/nano10020267.
- N. Elgrishi, K. J. Rountree, B. D. McCarthy, E. S. Rountree, T. T. Eisenhart and J. L. Dempsey, A practical beginner's guide to cyclic voltammetry, J. Chem. Educ., 2018, 95, 197–206, DOI:10.1021/acs.jchemed.7b00361.
- S. S. Nemala, K. S. Aneja, P. Bhargava, H. L. M. Bohm, S. Mallick and S. Bohm, Novel high-pressure airless spray exfoliation method for graphene nanoplatelets as a stable counter electrode in DSSC, Electrochim. Acta, 2018, 285, 86–93, DOI:10.1016/j.electacta.2018.07.229.
- W. Zhang, Y. Chai, R. Yuan, S. Chen, J. Han and D. Yuan, Facile synthesis of graphene hybrid tube-like structure for simultaneous detection of ascorbic acid, dopamine, uric acid and tryptophan, Anal. Chim. Acta, 2012, 756, 7–12, DOI:10.1016/j.aca.2012.10.044.
- L. V. de Faria, T. P. Lisboa, D. M. de Farias, F. M. Araujo, M. M. Machado, R. A. de Sousa, M. A. C. Matos, R. A. A. Muñoz and R. C. Matos, Direct analysis of ascorbic acid in food beverage samples by flow injection analysis using reduced graphene oxide sensor, Food Chem., 2020, 319, 126509, DOI:10.1016/j.foodchem.2020.126509.
- L. Fu, A. Wang, G. Lai, W. Su, F. Malherbe, J. Yu, C. Te Lin and A. Yu, Defects regulating of graphene ink for electrochemical determination of ascorbic acid, dopamine and uric acid, Talanta, 2018, 180, 248–253, DOI:10.1016/j.talanta.2017.12.058.
- S. Feng, L. Yu, M. Yan, J. Ye, J. Huang and X. Yang, Holey nitrogen-doped graphene aerogel for simultaneously electrochemical determination of ascorbic acid, dopamine and uric acid, Talanta, 2021, 224, 121851, DOI:10.1016/j.talanta.2020.121851.
- A. Murali, Y. P. Lan, P. K. Sarswat and M. L. Free, Synthesis of CeO2/reduced graphene oxide nanocomposite for electrochemical determination of ascorbic acid and dopamine and for photocatalytic applications, Mater. Today Chem., 2019, 12, 222–232, DOI:10.1016/j.mtchem.2019.02.001.
- V. S. Sapner and B. R. Sathe, Metal-free graphene-based nanoelectrodes for the electrochemical determination of ascorbic acid (AA) andp-nitrophenol (p-NP): Implication towards biosensing and environmental monitoring, New J. Chem., 2021, 45, 4666–4674, 10.1039/d0nj05806h.
- J. Jiang, D. Ding, J. Wang, X. Lin and G. Diao, Three-dimensional nitrogen-doped graphene-based metal-free electrochemical sensors for simultaneous determination of ascorbic acid, dopamine, uric acid, and acetaminophen, Analyst, 2021, 146, 964–970, 10.1039/d0an01912g.
- D. He, S. Li, P. Zhang and H. Luo, CVD graphene incorporating polymerized L-cysteine as an electrochemical sensing platform for simultaneous determination of dopamine and ascorbic acid, Anal. Methods, 2017, 9, 6689–6697, 10.1039/c7ay02489d.
- X. Wang, D. Gao, M. Li, H. Li, C. Li, X. Wu and B. Yang, CVD graphene as an electrochemical sensing platform for simultaneous detection of biomolecules, Sci. Rep., 2017, 7, 1–9, DOI:10.1038/s41598-017-07646-2.
- G. P. Keeley, A. O’Neill, N. McEvoy, N. Peltekis, J. N. Coleman and G. S. Duesberg, Electrochemical ascorbic acid sensor based on DMF-exfoliated graphene, J. Mater. Chem., 2010, 20, 7864–7869, 10.1039/c0jm01527j.
- S. Qi, B. Zhao, H. Tang and X. Jiang, Determination of ascorbic acid, dopamine, and uric acid by a novel electrochemical sensor based on pristine graphene, Electrochim. Acta, 2015, 161, 395–402, DOI:10.1016/j.electacta.2015.02.116.
- K. P. Aryal and H. K. Jeong, Modification of B-cyclodextrin-carbon nanotube-thermally reduced graphite oxide by using ambient plasma for electrochemical sensing of ascorbic acid, Chem. Phys. Lett., 2019, 730, 306–311, DOI:10.1016/j.cplett.2019.06.032.
Footnote |
| † Electronic supplementary information (ESI) available. See DOI: https://doi.org/10.1039/d2ma00666a |
| This journal is © The Royal Society of Chemistry 2022 |

