 Open Access Article
Corrosion engineering towards a high-energy Mn doped Co3O4 nanoflake cathode for rechargeable Zn-based batteries†
Jianning
Zeng
a,
Xin
Shi
b,
Jinjun
He
b,
Zilong
Wang
 *a and
Xihong
Lu
 *cb
*cb
aCollege of Chemistry and Materials Science, Department of Physics, Jinan University, Guangzhou, 510632, P. R. China. E-mail: zilong@email.jnu.edu.cn
bSchool of Applied Physics and Materials, Wuyi University, Jiangmen 529020, P. R. China. E-mail: luxh6@mail.sysu.edu.cn
cMOE of the Key Laboratory of Bioinorganic and Synthetic Chemistry, The Key Lab of Low-Carbon Chem and Energy Conservation of Guangdong Province, School of Chemistry, Sun Yat-Sen University, Guangzhou 510275, P. R. China
First published on 7th July 2022
Abstract
Co3O4 for aqueous rechargeable Co–Zn batteries suffers from low capacity and poor cycling stability. Here, we propose a facile surface corrosion strategy to synthesize Mn-doped Co3O4 (MCO) nanoflakes. Due to the promoted charge and ion transfer ability and increased active sites, MCO shows enhanced capacity and cycling performance.
Due to the inherent virtues of zinc (Zn) anodes and incombustible aqueous electrolytes, aqueous Zn-based batteries are receiving ever-increasing attention as a safe and economic alternative to lithium ion batteries and aluminium batteries.1–4 The theoretical capacity of Zn is very high (∼819 mA h g−1) with a low redox potential (−0.76 and –1.26 V versus standard hydrogen electrode (SHE) at pH = 7 and 14), which ensures its relative stability in aqueous solution.5,6 Moreover, its reserves on earth are highly abundant and cheap for large-scale application.7 Currently, there are two major barriers for the commercialization of Zn-based batteries. The first one is their poor cycling life, which originates from unavoidable dendrite growth of the Zn anode and structural destruction of cathode materials during the charge–discharge process.8,9 Considerable attention has been paid to preparing dendrite-free Zn anodes via interface design and electrolyte optimization, and significant advances have been gained in recent years.10–13 The second one is that their energy density is still unsatisfactory since the capacity of cathode materials (100–450 mA h g−1) is much smaller than that of the Zn anode.14 The exploration and design of new materials with high capacity and excellent stability as a cathode are extremely attractive and urgent to further boost the energy density of Zn-based batteries.
Among various cathode materials, cobaltosic oxide (Co3O4) has attracted great interest and has been the most commonly used cathode material in Zn-based batteries in terms of its high capacity and redox potential.15,16 When coupled with a Zn anode in an alkaline electrolyte, the full battery could afford a remarkable output voltage of ∼1.7 V, substantially higher than other Zn-based batteries (∼0.8–1.4 V), yielding a larger energy density.17–19 To date, multifarious Co3O4-based cathodes have been reported and achieved good electrochemical properties. For instance, a kind of Co3O4 nanosheet cathode with a specific capacity of 162 mA h g−1 (1 A g−1) was obtained through an electrodeposition and annealing method.20 Xu and his co-workers reported phosphorus-doped Co3O4 with a multidimensional nanostructure via a three-step synthetic process including a hydrothermal process and annealing in air and a N2 atmosphere, which exhibited a high capacity of 119.4 mA h g−1 at 1 A g−1.21 A Co3O4 nanowire cathode prepared by a hydrothermal and calcination process, delivered a capacity of 173.6 mA h g−1 at 1 A g−1 and 34% capacity is retained at 7.5 A g−1.22 Other methods to synthesize high performance Co3O4 such as artificial interfacial layers have also been proposed.23 Although these successes have been made, the main challenge to utilize these Co3O4-based electrodes for extensive, practical use is their relatively complicated fabrication procedures. Additionally, the capacity of the current Co3O4-based electrodes is still not ideal, especially areal capacity. Therefore, searching facile and easily conducted approaches to massively yield high-areal-capacity cathodes is highly pursued.24
Herein, a high-energy Mn-doped Co3O4 (denoted as MCO) nanoflake cathode is synthesized via a facile surface corrosion method and following calcination process for high performance Co–Zn batteries. The introduction of Mn dopants is achieved by directly immersing Co foam into a potassium permanganate solution for a short time at room temperature without any additional energy consumption. Such a corrosion engineering strategy significantly simplifies the complicated processes of commonly used hydrothermal approaches for Mn doping and facilitates the preparation of MCO. Because of the increased redox active sites and improved charge and ion transfer ability after Mn doping, the MCO cathode possesses a decent areal capacity of 0.68 mA h cm−2 at 2 mA cm−2, considerably superior to the pristine Co3O4 (CO) nanoflakes on Co foam (0.02 mA h cm−2). Moreover, this MCO cathode exhibits good cycling performance with 78.9% capacity retention after 1000 cycles.
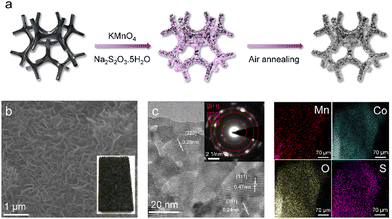
The MCO nanoflake cathode was prepared by a facile two-step approach including surface corrosion and subsequent air-annealing (Fig. 1a). Specifically, the commercial Co foam was directly immersed into a KMnO4 and Na2S2O3 solution at ambient temperature for 5 min. Upon this process, Co quickly reacts with MnO42− to form Co2+ and Mn4+ (3 Co + 2 MnO42− + 8 H2O → 3 Co2+ + 2 Mn4+ + 16 OH−) since the standard electrode potential of MnO42−/Mn4+ (0.62 vs. SHE) is much higher than that of Co2+/Co (−0.27 vs. SHE), and the Na2S2O3 affords a weak alkaline environment (OH−) via hydrolysis reaction. Then, the produced Co2+ and Mn4+ further react with OH− to generate Mn doped Co3O4 nanoflakes on the surface of Co foam. After annealing at 350 °C for 1 h, the colour of the Co foam finally becomes black, as shown in the inset of Fig. 1b. The scanning electron microscopy (SEM) image in Fig. 1b confirm that uniform MCO nanoflakes with a thickness of around 40 nm are successfully grown on the substrate surface. Fig. 1c is the representative transmission electron microscopy (TEM) image, revealing that abundant pores are distributed throughout the nanoflake, which is beneficial to mass transport during the electrochemical reaction. The interplanar distances of 0.24, 0.28 and 0.47 nm are well indexed to (311), (220) and (111) planes of cubic Co3O4 (JCPDS # 43-1003), indicating that these nanoflakes are well crystalline. The inset in Fig. 1c is the selected area electron diffraction (SAED) pattern. These bright spots arranged in rings further confirm the high crystalline nature of the nanoflake. Additionally, as revealed by energy dispersive spectroscopy (EDS) elemental mapping in Fig. 1d, Mn, O, Co and S are evenly distributed on the nanoflake. The corresponding EDS indicates that the Mn content is ∼16.02%. Pristine Co3O4 (CO) nanoflakes were also synthesized using the same method without the addition of KMnO4. These CO nanoflakes display a similar morphology with the MCO sample but only contain O, Co and S (Fig. S1 and S2, ESI†). The observations above prove that Mn elements are successfully introduced into Co3O4 nanoflakes.
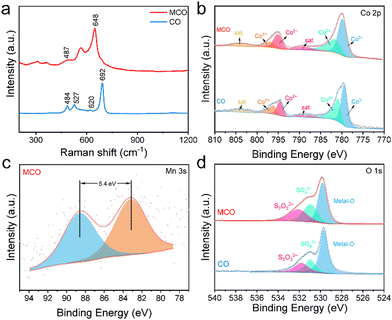
X-ray diffraction (XRD), Raman spectra, and X-ray photoelectron spectroscopy (XPS) measurements were performed to characterize the phase and chemical structures of CO and MCO. As shown in Fig. S3, (ESI†) only three peaks corresponding to the diffractions of Co (JCPDS # 05-0727) can be observed for both samples due to the strong fluorescence interference of Co foam that conceals the signal of Co3O4. The Raman spectra of two samples are presented in Fig. 2a. The two peaks at about 491 and 648 cm−1 correspond to Eg and A1g Raman-active modes of Co3O4. After Mn doping, a new peak corresponding to Mn–O vibration is detected at 527 cm−1. The comparison of the XPS spectra between the two samples is shown in Fig. 2b–d and Fig. S4 (ESI†). Two peaks located at 795.1 eV and 779.8 eV can be respectively attributed to Co 2p1/2 and Co 2p3/2 of Co3+ while the peaks at 797.1 eV and 781.7 eV are ascribed to Co 2p1/2 and Co 2p3/2 of Co2+. The ratio of Co3+/Co2+ for the CO sample is about 1.07, evidently lower than that of the MCO sample (1.25). The valence of Mn dopants can be deduced according to the distance between two peaks in the Mn 3s XPS spectra. Generally, the +3 and +4 valences of Mn correspond to the peak spacings of ∼5.4 eV and −4.7 eV, respectively. According to Fig. 2c, the valence of doped Mn is mainly +3 for MCO. The O 1s XPS spectrum can be deconvoluted to metal–O (529.8 eV), SO42− (530.9 eV) and S2O32− (532.1 eV), which is in good agreement with the S 2p XPS spectra, where only SO42− (169.7 eV) and S2O32− (168.5 eV) can be found (Fig. S4, ESI†). In brief, we have successfully prepared MCO via a facile two-step method, which holds great potential in the mass production of Co-based cathode materials.
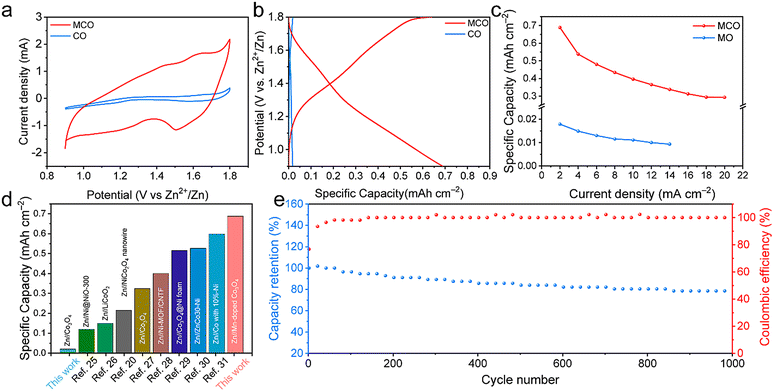
The electrochemical performance of two samples was studied by pairing MCO or CO cathodes with a Zn foil anode for the assembly of Zn//MCO or Zn//CO batteries. Fig. 3a shows the cyclic voltammetry (CV) curves, in which two pairs of obvious redox peaks can be observed for the MCO electrode. Specifically, the two oxidation peaks at 1.45 V and 1.64 V correspond to Co2+ to Co3+ and Co3+ to Co4+ while the two reduction peaks at 1.27 V and 1.50 V are attributed to the conversion of Co2+/Co3+ and Co3+/Co4+. In sharp contrast, the CV response of the CO counterpart is very weak, indicating its inferior active sites. The shape of the CV curves of the Zn//MCO batteries at different scan rates can be well maintained, indicative of its good reversibility (Fig. S5, ESI†). Galvanostatic charge/discharge (GCD) curves in Fig. 3b further prove the disparities of the energy storage performance between both samples. At the current density of 2 mA cm−2, Zn//MCO batteries possess a high areal capacity of 0.68 mA h cm−2, significantly larger than that of Zn//MO batteries (0.02 mA h cm−2). As the current density increases to 20 mA cm−2, the Zn//MCO batteries can still maintain a satisfying capacity retention of 43% while the capacity of Zn//MCO batteries can barely be detected at 14 mA cm−2 (Fig. S6, ESI†). The outstanding energy storage ability of Zn//MCO is highlighted by the comparison with recently reported Zn based alkaline batteries, in which Zn//MCO batteries show substantially superior performance.20,25–31 The energy density and power density of Zn//MCO batteries (based on the cathode area) is calculated to be 0.612 mWh cm−2 and 18 mW cm−2, which is obviously higher than that of recently reported cathode materials for alkaline batteries (Fig. S7, ESI†). More encouragingly, a good cycling stability with 78.9% capacity retention and 100% coulombic efficiency (CE) is also obtained for Zn//MCO batteries, signifying that Mn dopants can remarkably enhance the structure robustness during repeated charge/discharge processes.
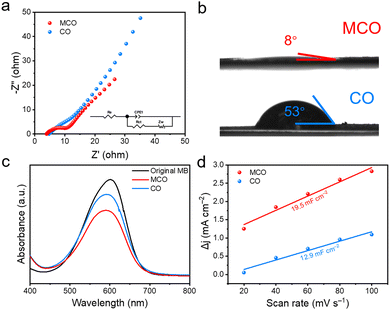
The underlying reasons for the improved electrochemical performance of Zn//MCO batteries were firstly investigated via electrochemical impedance spectra (EIS). The EIS data were fitted via the complex nonlinear least square (CNLS) fitting method based on Randles equivalent circuit (inset in Fig. 4a), in which Re, Rct, Zw, and CPE1 refer to equivalent series resistance, faradaic charge-transfer resistance, Warburg impedance, and constant phase element, respectively. It is known that the semicircle in the high frequency region is called charge transfer resistance (Rct) representing the charge transfer ability of the electrode while the Warburg resistance (Rw) determined by the slope of a straight line in the low frequency region can reflect the ion diffusion ability of the electrode. Encouragingly, the Rct (4.28) and Rw (9.38) of Zn//MCO batteries are both lower than that of Zn//MO batteries, indicating the enhanced charge and ion transfer ability of Zn//MCO batteries (Fig. 4a and Table S1, ESI†). Considering the same battery configuration of Zn//MCO and Zn//MO except for the cathode materials, the promoted electrochemical performance should be attributed to the significantly boosted mass transfer ability of the MCO electrode. The enhanced ion transfer ability can be further confirmed by the contact angle test. As illustrated in Fig. 4b, the contact angles between the electrode and electrolyte droplet are 53° and 8° for MCO and MO, indicating the better hydrophilia of the MCO electrode. Such improved wettability is beneficial to reduce the contact resistance between the electrode/electrolyte interface and promote the ion transfer ability. The dye-absorption method was adopted to investigate the surface area of CO and MCO. Both electrodes were respectively immersed into 0.5 mg L−1 methylene blue (MB) aqueous solution for 12 h in the dark. Afterwards, the UV-vis absorption spectra were applied to analyse these solutions. According to the UV-vis absorption spectra in Fig. 4c, the MCO sample can adsorb more MB dye molecules over the CO sample as the characteristic absorption peak intensity of MB at 665 nm becomes much lower after MCO treatment, confirming its enlarged ion accessible surface area. The electrochemically active surface area (ECSA) was calculated to determine the electroactive sites on the electrode surface (Fig. S8, ESI†). Fig. 4d shows the ECSA of the MO and CMO electrode according to their CV curves measured at different scan rates. Compared to the CO electrode (12.9 mF cm−2), the MCO electrode possesses a higher ECSA (19.5 mF cm−2), manifesting that extra electrochemically active sites are introduced to the material surface after Mn doping.
Conclusions
In summary, we have successfully synthesized Mn-doped Co3O4 with enhanced electrochemical performance, and mass-production ability via facile surface corrosion and air-annealing strategies. The surface corrosion engineering significantly simplifies the Mn doping process at room temperature and facilitates the synthesis of MCO. Benefited from the promoted charge and ion transfer ability and increased active sites, the MCO electrode delivers significantly boosted energy storage performance including areal capacity, rate capability and cycling stability. This work provides valuable information for designing high-performance Co3O4-based cathodes for advanced rechargeable Zn-based batteries.Author contributions
Jianning Zeng: investigation, data curation, writing – original draft; Xin Shi: investigation, data curation; Jinjun He: investigation, data curation; Zilong Wang: writing – review & editing; Xihong Lu: conceptualization, validation, writing – review & editing, funding acquisition.Conflicts of interest
There are no conflicts to declare.Acknowledgements
We acknowledge the financial support by the Natural Science Foundation of Guangdong Province (2021A1515010504), the Natural Science Foundation of Guangzhou (201904010049), and the Joint Science Foundation of Wuyi University and HK and Macao (2019WGALH14).Notes and references
- L. Ma, M. A. Schroeder, O. Borodin, T. P. Pollard, M. S. Ding, C. Wang and K. Xu, Nat. Energy, 2020, 5, 743–749 CrossRef CAS.
- F. Wang, O. Borodin, T. Gao, X. Fan, W. Sun, F. Han, A. Faraone, J. A. Dura, K. Xu and C. Wang, Nat. Mater., 2018, 17, 543–549 CrossRef CAS PubMed.
- H. Yan, X. Mu, Y. Song, Z. Qin, D. Guo, X. Sun and X. X. Liu, Chem. Commun., 2022, 58, 1693–1696 RSC.
- Z. Liang and Y. C. Lu, Batteries Supercaps, 2021, 4, 1588–1598 CrossRef CAS.
- M. Zhou, S. Guo, J. Li, X. Luo, Z. Liu, T. Zhang, X. Cao, M. Long, B. Lu, A. Pan, G. Fang, J. Zhou and S. Liang, Adv. Mater., 2021, 33, e2100187 CrossRef PubMed.
- L. Cao, D. Li, T. Pollard, T. Deng, B. Zhang, C. Yang, L. Chen, J. Vatamanu, E. Hu, M. J. Hourwitz, L. Ma, M. Ding, Q. Li, S. Hou, K. Gaskell, J. T. Fourkas, X. Q. Yang, K. Xu, O. Borodin and C. Wang, Nat. Nanotechnol., 2021, 16, 902–910 CrossRef CAS PubMed.
- L. Kang, M. Cui, Z. Zhang and F. Jiang, Batteries Supercaps, 2020, 3, 966–1005 CrossRef CAS.
- A. Naveed, T. Rasheed, B. Raza, J. Chen, J. Yang, N. Yanna and J. Wang, Energy Storage Mater., 2022, 44, 206–230 CrossRef.
- M. B. Lim, T. N. Lambert and B. R. Chalamala, Mater. Sci. Eng., R, 2021, 143, 100593 CrossRef.
- J. Lee, B. Hwang, M.-S. Park and K. Kim, Electrochim. Acta, 2016, 199, 164–171 CrossRef CAS.
- J. Wu, C. Yuan, T. Li, Z. Yuan, H. Zhang and X. Li, J. Am. Chem. Soc., 2021, 143, 13135–13144 CrossRef CAS PubMed.
- L. Ma, Q. Li, Y. Ying, F. Ma, S. Chen, Y. Li, H. Huang and C. Zhi, Adv. Mater., 2021, 33, e2007406 CrossRef PubMed.
- H. Yan, S. Li, Y. Nan, S. Yang and B. Li, Adv. Energy Mater., 2021, 11, 2100186 CrossRef CAS.
- M. Huang, M. Li, C. Niu, Q. Li and L. Mai, Adv. Funct. Mater., 2019, 29, 1807847 CrossRef.
- J. Xie, H. Zhang, F. Yang, X. Cao, X. Liu and X. Lu, Chem. Commun., 2022, 58, 3977 RSC.
- L. Ma, S. Chen, H. Li, Z. Ruan, Z. Tang, Z. Liu, Z. Wang, Y. Huang, Z. Pei, J. A. Zapien and C. Zhi, Energy Environ. Sci., 2018, 11, 2521–2530 RSC.
- J. Wu, X. Huang and X. Xia, J. Energy Chem., 2019, 35, 132–137 CrossRef.
- Y. Zhu, J. Li, X. Yun, G. Zhao, P. Ge, G. Zou, Y. Liu, H. Hou and X. Ji, Nano-Micro Lett., 2020, 12, 16 CrossRef CAS PubMed.
- Y. Huang, W. S. Ip, Y. Y. Lau, J. Sun, J. Zeng, N. S. S. Yeung, W. S. Ng, H. Li, Z. Pei, Q. Xue, Y. Wang, J. Yu, H. Hu and C. Zhi, ACS Nano, 2017, 11, 8953–8961 CrossRef CAS PubMed.
- X. Wang, F. Wang, L. Wang, M. Li, Y. Wang, B. Chen, Y. Zhu, L. Fu, L. Zha, L. Zhang, Y. Wu and W. Huang, Adv. Mater., 2016, 28, 4904–4911 CrossRef CAS PubMed.
- F. Yang, K. Zhang, Z. Cen and K. Xu, J. Alloys Compd., 2021, 879, 160439 CrossRef CAS.
- P. Tan, B. Chen, H. Xu, W. Cai, W. He and M. Ni, Appl. Catal., B, 2019, 241, 104–112 CrossRef CAS.
- S. Wang, S. Lai, P. Li, T. Gao, K. Sun, X. Ding, T. Xie, C. Wu, X. Li, Y. Kuang, W. Liu, W. Yang and X. Sun, J. Power Sources, 2019, 436, 226867 CrossRef CAS.
- A. Biswal, M. Minakshi and B. C. Tripathy, ChemElectroChem, 2016, 3, 976–985 CrossRef CAS.
- F. Wang, Y. Lu, S. Zeng, Y. Song, D. Zheng, W. Xu and X. Lu, ChemElectroChem, 2020, 7, 4572–4577 CrossRef CAS.
- Z. Yu, L. Cao, H. Liu and D.-W. Wang, Energy Storage Mater., 2021, 43, 158–164 CrossRef.
- W. Shang, W. Yu, P. Tan, B. Chen, H. Xu and M. Ni, J. Power Sources, 2019, 421, 6–13 CrossRef CAS.
- C. Li, Q. Zhang, T. Li, B. He, P. Man, Z. Zhu, Z. Zhou, L. Wei, K. Zhang, G. Hong and Y. Yao, J. Mater. Chem. A, 2020, 8, 3262–3269 RSC.
- W. Shang, W. Yu, X. Xiao, Y. Ma, C. Cheng, Y. Dai, P. Tan and M. Ni, Electrochim. Acta, 2020, 353, 136535 CrossRef CAS.
- Y. Pang, L. Li, Y. Wang, X. Zhu, J. Ge, H. Tang, Y. Zheng, F. Wang, S. Wu, Q. Wu, Z. Shen and H. Chen, Chem. Eng. J., 2022, 436, 135202 CrossRef CAS.
- W. Shang, W. Yu, X. Xiao, Y. Ma, P. Tan and M. Ni, J. Power Sources, 2021, 483, 229192 CrossRef CAS.
Footnote |
| † Electronic supplementary information (ESI) available. See DOI: https://doi.org/10.1039/d2ma00733a |
| This journal is © The Royal Society of Chemistry 2022 |


