 Open Access Article
Designing a novel heterostructure AgInS2@MIL-101(Cr) photocatalyst from PET plastic waste for tetracycline degradation
Xuan N.
Pham
a,
Van-Tai
Vu
a,
Hong Van T.
Nguyen
bc,
T.-Thanh-Bao
Nguyen
d and
Huan V.
Doan
 *ae
*ae
aDepartment of Chemical Engineering, Hanoi University of Mining and Geology, 18 Pho Vien, Duc Thang, Bac Tu Liem, Hanoi, Vietnam. E-mail: huan.doan@bristol.ac.uk
bInstitute of Chemistry, Vietnam Academy of Science and Technology, 18 Hoang Quoc Viet, Hanoi, Vietnam
cInstitute of Environment, Vietnam Maritime University, 484 Lach Tray, Le Chan, Haiphong, Vietnam
dInstitute of Physics, Vietnam Academy of Science and Technology, 18C Hoang Quoc Viet, Hanoi, Vietnam
eSchool of Chemistry, University of Bristol, Bristol BS8 1TS, UK
First published on 3rd August 2022
Abstract
Semiconductor-containing porous materials with a well-defined structure could be unique scaffolds for carrying out selective organic transformations driven by visible light. We herein introduce for the first time a heterostructure of silver indium sulfide (AgInS2) ternary chalcogenide and a highly porous MIL-101(Cr) metal–organic framework (MOF) synthesised from polyethylene terephthalate plastic waste. Our results demonstrate that AgInS2 nanoparticles were uniformly attached to each lattice plane of the octahedral MIL-101(Cr) structure, resulting in a nanocomposite with a high distribution of semiconductors in a porous media. We also demonstrate that the nanocomposite with up to 40% of AgInS2 doping exhibited excellent catalytic activity for tetracycline degradation under visible light irradiation (∼99% tetracycline degraded after 4 h) and predominantly maintained its performance after five cycles. These results could promote a new material circularity pathway to develop new semiconductors that can be used to protect water from further pollution.
Introduction
Pharmaceuticals and strong active compounds, such as non-steroidal, anti-inflammatory drugs, hormones and antibiotics, have been used widely owing to their effective treatment and low cost. Among them, tetracycline (TC) is one of the most common antibiotics to prevent infections caused by microorganisms in humans and animals.1,2 However, the overuse and high residue of this pharmacological agent, mainly found in wastewater, have become a new source of environmental micro-pollutants, which cause critical problems for long-term human health and the aquatic ecosystem.1,3 In particular, minute amounts of TC in wastewater residues can produce bacteria resistance, which causes allergies and mutations in the human body.4,5 Some methods have been proposed to remove this antibiotic in wastewater, including ozone treatment,6 adsorption7 and photocatalysis.8 Among them, photocatalysis is potentially the most sustainable decontamination technology due to the ability to degrade TC into less harmful compounds with the use of abundant solar energy.9,10 Recently, a number of new semiconductors have been introduced to maximise the generation and separation of charge carriers, thus improving the performance of TC photodegradation.Ternary chalcogenides of XYmZn (X = Cu, Ag, Zn, Cd; Y = Ga, In; Z = S, Se, Te; m, n = integers) have attracted much attention since they have been applied in many processes, including those in photovoltaics,11,12 optoelectronics and photocatalysis.13 Among them, silver indium sulfide (AgInS2) is a single semiconductor, non-toxic and highly promising material with an excellent solar light absorber for the degradation of organic pollutants.9 For example, Baojun Liu et al.14 demonstrated that AgInS2-doped TiO2 exhibited high photocatalytic activity in the decomposition of gaseous o-dichlorobenzene (with approximately 50% of gaseous o-dichlorobenzene removed after irradiation for 8 hours). E. Baeissa et al.15 also used AgInS2-doped NiO in thiophene photocatalytic oxidation, and reported that nearly 100% thiophene was converted under sunlight after 90 minutes.
Although possessing many unique features, AgInS2 has poor adsorption capacity owing to its small specific surface area and easy agglomeration during the reaction. In addition, its photocatalytic ability is still naturally restricted by the rapid recombination between photogenerated electrons and holes.16,17 To overcome these limitations, we herein proposed for the first time the combination of AgInS2 nanoparticles and a MIL-101(Cr) metal–organic framework (MOF) material, enriching the development of new semiconductors based on chalcogenides with a heterogeneous nanocomposite MOF-based structure. With flexible porous network architectures and controllable open channels/pores in many MOF materials, the integration can hybridise photosensitizers and semiconductors within one porous photocatalyst network.18 In some MOF families such as MIL (materials of institute lavoisier) and ZIF (zeolitic imidazolate framework), each metal cluster can act as an inorganic semiconductor quantum dot. Meanwhile, the linker can act as a light-harvesting antenna to perform a linker-to-cluster charge transition, thus preventing the recombination of the photoexcited electron–hole pairs and improving the photocatalytic performance.19–22 For example, Aiping Liu et al.23 reported the decoration of CuInS2 nanoparticles onto ZIF-8 MOF for the degradation of rhodamine B (RhB) under UV light irradiation. It was found that the nanocomposite exhibited better catalytic efficiency and durability than pure CuInS2 nanoparticles. In our novel architecture, MIL-101(Cr) nanocrystals can play an important role as an effective supporter via the uniform decoration of AgInS2 nanoparticles. MIL-101(Cr) has been known as a great substrate with multiple highlight characteristics; for example, high stability (no degradation in water for 14 days),24 good thermal stability (up to 350 °C),25 large pore volume (1.19 cm3 g−1) and high surface area (2338.31 m2 g−1).26 Inspired by our previous work on the synthesis of MIL-53(Fe),27 we also proposed the use of terephthalic acid produced from recycled plastic bottles as a cheaper source for the economical production of MIL-101(Cr). Herein, the synthesised AgInS2@MIL-101(Cr) nanocomposites were tested in the photodegradation of tetracycline and were compared with the pristine components. The formation of main free radicals and a possible mechanism for the improvement of photocatalytic performance were also discussed in detail.
Experimental details
Materials
Ethylene glycol (EG, 99%), sodium hydroxide (NaOH, 98%), sulfuric acid (H2SO4, 98%), chromium(III) nitrate nonahydrate (Cr(NO3)3·9H2O, 99%), hydrofluoric acid (HF, 40%), ethanol (C2H5OH, 99%), dimethylformamide (DMF, 99.8%), silver nitrate (AgNO3, 99.8%), thioacetamide (CH3CSNH2, 98%), indium(III) chloride (InCl3, 98%), hydrochloric acid (HCl, 37%), 1,4-benzoquinon (BQ), tert-butyl alcohol (TBA), and ammonium oxalate monohydrate (AOM) were supplied by Sigma-Aldrich.Synthesis of MIL-101(Cr)
Terephthalic acid (TPA) employed in this study was recycled from polyethylene terephthalate plastic bottles using the synthetic procedure reported previously.27 The recycling process is summarised in Scheme 1. The purity of recovered TPA, as reported previously,27 was 98% and was used for the preparation of MIL-53(Fe) without further purification.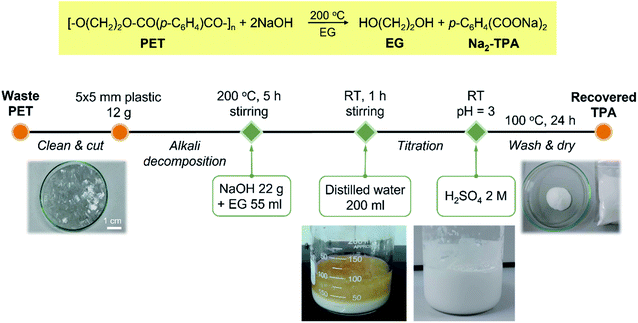 | ||
| Scheme 1 Alkali decomposition of polyethylene terephthalate with sodium hydroxide in ethylene glycol. | ||
In this study, MIL-101(Cr) was prepared by a solvothermal process, as reported by Kunyue Leng et al.28 Briefly, a mixture of 5.6 g of Cr(NO3)3·9H2O, 1.6 g of TPA, 0.3 mL of hydrofluoric acid (HF) and 45 mL of deionised water was simultaneously sonicated for 15 min and then heated at 220 °C for 8 h in a Teflon-lined stainless-steel autoclave. When cooled to room temperature, the resulting suspension was filtered and dried at 80 °C for 12 h. The obtained sample was washed several times with dimethylformamide (DMF) at 120 °C for 12 h and ethanol, and then dried at 80 °C for 12 h. The final product was MIL-101(Cr) MOF material.
Synthesis of AgInS2
The chalcogenide AgInS2 (AIS) nanoparticles were synthesised via a sonication-assisted deposition–precipitation technique. The synthesis was described as follows. Firstly, a transparent solution containing 0.221 g of indium chloride (InCl3) and 0.375 g of thioacetamide (TAA) was completely dissolved in 25 mL of ethylene glycol (EG) in a 100 mL beaker under constant electromagnetic stirring. Then, 23 mL of 0.1 M hydrochloric acid (HCl) and 0.17 g of silver nitrate (AgNO3) were added to this solution under the support of ultrasonication. The obtained mixture was heated to 70 °C and kept at this temperature for 15 min under continuous magnetic stirring to create a homogeneous solution. The solution was then transferred into a Teflon-lined stainless autoclave, and maintained at 180 °C for 24 h in an oven. After cooling naturally to room temperature, the resulting solid was centrifugated and subsequently washed with deionised water and ethanol, and finally dispersed in 25 mL ethanol for further use.Synthesis of AgInS2@MIL-101(Cr)
The AgInS2@MIL-101(Cr) samples were synthesised firstly by physical mixing between the MIL-101(Cr) (200 mg) dispersed in deionised H2O (135 mL) at 60 °C by a magnetic stirrer. A certain amount of AIS (20 wt%, 30 wt%, 40 wt%, and 50 wt% compared to the weight of MOF) was then added to the above solutions and ultrasonicated for an additional 10 min. The mixture was transferred to a Teflon-lined stainless-steel autoclave, maintained at 180 °C for 24 h. After the reaction, the resulting precipitate was separated via centrifugation and washed several times by deionised H2O. Finally, the obtained samples were dried at 80 °C in an oven for 24 h and labelled as 20% AIS@MIL-101(Cr), 30% AIS@MIL-101(Cr), 40% AIS@MIL-101(Cr) and 50% AIS@MIL-101(Cr).Characterisation
The crystal lattice characteristics of the synthesised photocatalysts were determined by powder X-ray diffraction (XRD) using a D8 Advance system (Cu Kα radiation, λ = 0.154 nm, and scanning rate of 3° min−1, Bruker, Germany). The shape, size, and surface morphology were observed via a scanning electron microscope (SEM-4800, Hitachi) and transmission electron microscope (TEM, JEM-2100F, JEOL, Japan). The Fourier transform infrared spectra (FT-IR) were measured using an FT-IR Affinity-1S (SHIMADZU). X-ray energy dispersion (EDX) and EDX mapping were carried out using a JED-2300 with a gold coating. The UV-vis diffuse reflectance (DRS-UV) and photoluminescence (PL) spectra of the reaction samples were recorded on the UV-2600 spectrophotometer (Shimadzu) and the Cary Eclipse fluorescence spectrophotometer (Varian), respectively. Furthermore, the Brunauer–Emmett–Teller (BET) specific surface area was determined at liquid-nitrogen temperature (77 K) using the N2 adsorption–desorption technique on a ChemBET-3030 system. X-ray photoelectron spectroscopy (XPS) was conducted using an ESCALab 250 spectrometer (Thermo VG, UK). Finally, Raman spectra (MacroRAM/Horiba model, laser at 785 nm) were recorded.Photocatalytic experiments
The photocatalytic performance was investigated and evaluated through the degradation of TC lighting on a 300 W Xenon lamp by using cut-off filters to remove the light range of λ < 420 nm and simulate visible light. For the sample, 50 mg of the synthesised photocatalyst was homogeneously dispersed into a 50 mL TC aqueous solution (70 mg L−1). Before irradiating light, the suspension was constantly stirred under dark condition for 30 min to attain an adsorption–desorption equilibrium state. After irradiating visible light, 4 mL of suspension was taken and centrifuged. The clear solution was analysed by the UV-vis spectrophotometer at the maximum absorption wavelength of 357 nm. The product structure was determined by the Agilent 6120 high-performance liquid chromatography-mass spectrometry (HPLC-MS) system equipped with a DAD detector with a range of 200–600 nm. A Hypersil GOLD-C18 column (150 mm × 2.1 mm × 5 μm) was used with acetonitrile (A) and water containing 0.1% formic acid (B) (A/B was 30/70, v/v) as the mobile phase at a flow rate of 0.25 mL min−1.Results and discussion
Characterisation of the AgInS2@MIL-101(Cr) photocatalyst
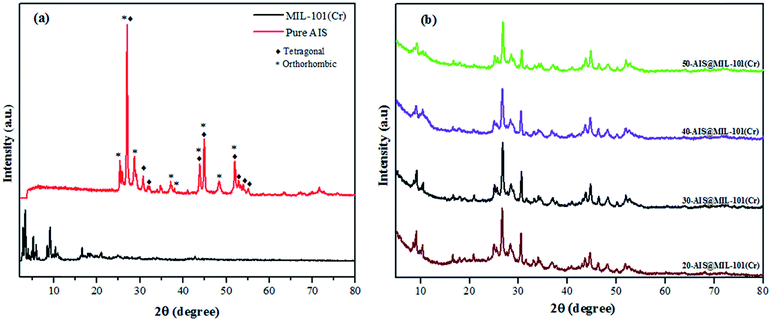
To explore the crystal structure of AIS, MIL-101(Cr), and AIS@MIL-101(Cr), X-ray diffraction (XRD) measurements were used (see Fig. 1a and b). For the pure AIS sample, the typical diffraction peaks were observed at (25.1°/25.2°), 26.8°, (28.3°/28.4°), (36.2°/37.1°), 43.5°, 44.8°, and (46.6°/47.2°) degrees 2θ, corresponding to the crystal planes of the orthorhombic phase in AIS (120/200), 002, (121/201), (122/202), 040, 320, and (123/320), respectively (JCPDS card no. 25-1328).29 The tetragonal structure was also found in this sample, which is evidenced by the PXRD peaks at 26.9, (30.8/31.1), 43.8, 44.8 and 51.9 of the (112), (200), (220), (204), and (312) planes, respectively (JCPDS card no. 25-1330).30 Similar results were also found in a previous report by Wang et al.31 The XRD patterns of MIL-101(Cr) were recorded at 2θ = 3.29°, 4.08°, 5.26°, 6.02°, 8.54°, and 9.18°, corresponding to the featured diffraction peaks of the calculated crystallographic planes of (311), (400), (511), (531), (822), and (911) in MIL-101(Cr), respectively.32 The low peaks at around 2θ = 25.2° and/or 27.9° further confirmed the successful removal of the excess TPA crystals into MIL-101(Cr) pores.33,34The XRD patterns of composite materials with different amounts of AIS (20–50 wt%) are shown in Fig. 1b. Prominent peaks of MIL-101(Cr) and AIS clearly remained, although their peak intensities tended to be weakened. This is due to the formation of the defects and the distinct reduction of the lattice structure after the AIS is loaded onto the surface and into the pore of the MIL-101(Cr) structure. The composition of the AIS@MOF-101(Cr) samples was investigated in detail by the following characterisations.
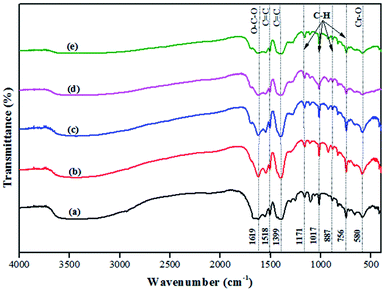
The FT-IR spectra of MIL-101(Cr) and 20–50% AIS@MIL-101(Cr) are shown in Fig. 2. The characteristic peak that appeared at 1619 cm−1 was assigned to the O–C–O stretching vibration. The extension peaks of the 1518 cm−1 and 1399 cm−1 bands corresponded to the C![[double bond, length as m-dash]](https://www.rsc.org/images/entities/char_e001.gif) C vibration. In addition, the vibrational modes in the range from 600 to 1600 cm−1, such as 1171, 1017, 887, and 750 cm−1, could be attributed to the bonds in its aromatic ring.35 Moreover, there was another sharp peak around 580 cm−1 that was assigned to the Cr–O stretching mode, and represented the successful connection between the metal ion (Cr3+) and (–COO)− groups of TPA.36Fig. 2b presents the spectra of AIS-doped MIL-101(Cr) with various amounts of AIS. The obtained results show that the AIS@MIL-101(Cr) composites did not have any remarkable change when compared with the typical peaks of the original MIL-101(Cr).
C vibration. In addition, the vibrational modes in the range from 600 to 1600 cm−1, such as 1171, 1017, 887, and 750 cm−1, could be attributed to the bonds in its aromatic ring.35 Moreover, there was another sharp peak around 580 cm−1 that was assigned to the Cr–O stretching mode, and represented the successful connection between the metal ion (Cr3+) and (–COO)− groups of TPA.36Fig. 2b presents the spectra of AIS-doped MIL-101(Cr) with various amounts of AIS. The obtained results show that the AIS@MIL-101(Cr) composites did not have any remarkable change when compared with the typical peaks of the original MIL-101(Cr).
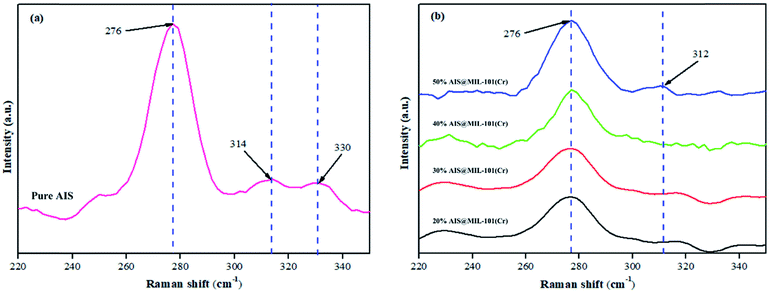
The structures of the pristine AIS and AIS@MIL-101(Cr) nanocomposites were also confirmed by Raman spectroscopy, as shown in Fig. 3. In the pure AIS, the co-existence of two different orthorhombic and tetragonal lattice phases was found at 276 cm−1 and (314 cm−1; 330 cm−1),37 which is in good agreement with the XRD pattern results shown previously. In these Raman spectra, a strong peak at 276 cm−1 was associated with the symmetry A1 vibrational mode, which was caused by the vibration of anions (S) in the linear plane with (Ag and In) cations of the original AIS structure.38 More importantly, with the various AIS contents loaded on MIL-101(Cr), the obtained peak intensities gradually decreased when compared with that of the original AIS. The reason is that the AIS was eclipsed by the MIL-101(Cr) interfacial edges, as further shown in the TEM results.
 | ||
| Fig. 3 Raman spectra of (a) AIS and (b–e) AIS@MIL-101(Cr) nanocomposites. Spectra b, c, d and e are for 20%, 30%, 40% and 50% AIS loaded, respectively. | ||
The valence electron states in the 40% AIS@MIL-101(Cr) nanocomposite were investigated by X-ray photoelectron spectroscopy (XPS) measurement. From the XPS peaks shown in Fig. 4a, we notice the existence of Ag, In, Cr, S, O and C in this sample. Specifically, those at 374.4 eV and 368.4 eV were for the binding energies of Ag 3d3/2 and Ag 3d5/2 (Fig. 4b), those at 452.9 eV and 445.5 eV were for the binding energies of In 3d3/2 and In 3d5/2 (Fig. 4c), those at 587.6 eV and 577.5 eV were for the binding energies of Cr 2p1/2 and Cr 2p3/2 (Fig. 4d), and those at 163.3 eV and 161.6 eV were for the binding energies of S 2p1/2 and S 2p3/2 (Fig. 4 and 9e).39 Notably, the peaks at 530.9, 531.8 and 532.7 eV in the O 1s XPS spectrum (Fig. 4f) were ascribed to the Cr–O–Cr, Cr–O–H and O–C![[double bond, length as m-dash]](https://www.rsc.org/images/entities/char_e001.gif) O bonds, respectively. Finally, the peaks at 284.8, 285.9 and 288.7 eV in the C 1s XPS spectrum (Fig. 4g) were attributed to the C–C, C
O bonds, respectively. Finally, the peaks at 284.8, 285.9 and 288.7 eV in the C 1s XPS spectrum (Fig. 4g) were attributed to the C–C, C![[double bond, length as m-dash]](https://www.rsc.org/images/entities/char_e001.gif) C, and O–C
C, and O–C![[double bond, length as m-dash]](https://www.rsc.org/images/entities/char_e001.gif) O of the phenyl and carboxyl groups in the nanocomposite, respectively.40
O of the phenyl and carboxyl groups in the nanocomposite, respectively.40
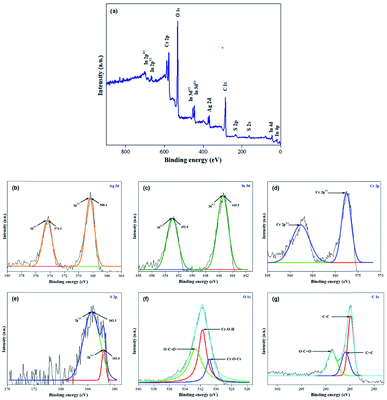 | ||
| Fig. 4 (a) XPS survey spectrum of 40% AIS@MIL-101(Cr), high-resolution XPS spectra of (b) Ag, (c) In, (d) Cr, (e) S, (f) O and (g) C. | ||
The specific surface area and porosity of the synthesised photocatalysts were calculated by N2 adsorption–desorption processes, as illustrated in Fig. 5a and b. Both MIL-101(Cr) and 40% AIS@MIL-101(Cr) possess type I isotherms with a steep step at low relative pressure, confirming microporous structures in these samples.41 In contrast, the isotherm of AIS exhibited the common type II, implying the nonporous or macroporous structure.15 The specific surface area and pore volume of the 40% AIS@MIL-101(Cr) nanocomposite are around 1121 m2 g−1 and 0.69 cm3 g−1, respectively, which are smaller than those of the pure MIL-101(Cr) sample (1964 m2 g−1 and 1.03 cm3 g−1). This is due to the distribution of the AIS nanoparticles with low surface area and nonporous property onto the surface of MIL-101(Cr) or into the pore of the MIL-101(Cr) structure, leading to the decrease in the access and exposure space of guest molecules onto MIL-101(Cr). Nonetheless, there was no significant change in terms of the pore volume and size (as shown in Table 1), demonstrating that the decoration with up to 40 wt% of AIS did not completely block the original pores of MIL-101(Cr).
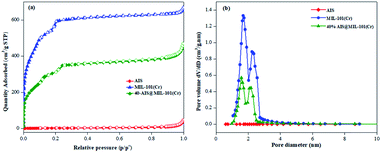 | ||
| Fig. 5 (a) Nitrogen adsorption/desorption isotherm and (b) pore size distribution of AIS, MIL-101(Cr), and 40% AIS@MIL-101(Cr). | ||
| Sample | S BET (m2 g−1) | Pore size (nm) | Pore volume (cm3 g−1) |
|---|---|---|---|
| AIS | 8 | — | — |
| MIL-101(Cr) | 1964 | 2.09 | 1.03 |
| 40% AIS@MIL-101(Cr) | 1121 | 2.45 | 0.69 |
The morphologies of MIL-101(Cr), AIS, and 40% AIS@MIL-101(Cr) were observed by scanning electron microscopy (SEM). As shown in Fig. 6a, MIL-101(Cr) is octahedral with a particle size ranging from 200 to 500 nm. After synthesis, the AIS nanoparticles identified in Fig. 6b were indeed observed in the 40% AIS@MIL-101(Cr) nanocomposite without a change of MOF morphology (Fig. 6c). We noticed some rod-like particles that appeared in the nanocomposite sample, which might be due to the faulty crystal growth process that was previously reported in MIL-101(Cr) MOF.27 To investigate how AIS were attached to the MOF, we performed transmission electron microscopy (TEM) analysis on the nanocomposite sample. According to Fig. 6d–f, the pristine AIS nanoparticles with 25 nm in diameter were uniformly dispersed and encapsulated on the MIL-101(Cr) surface.
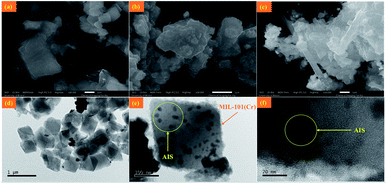 | ||
| Fig. 6 SEM of (a) MIL-101(Cr), (b) AIS, and (c) 40% AIS@MIL-101(Cr) nanocomposite. (d–f) TEM of 40% AIS@MIL-101(Cr) nanocomposite. | ||
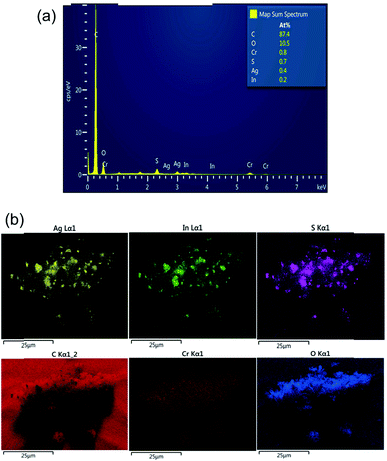
Energy-dispersive X-ray spectroscopy (EDS) elemental mapping was also carried out along with an SEM experiment to confirm the presence of Ag, In and Cr in the AIS@MIL-101(Cr) nanocomposite (Fig. 7). Indeed, AIS was successfully introduced onto the MOF surface with the atomic percentages of Ag, In and Cr being 0.4, 0.2 and 0.8%, respectively. In the EDS element mapping images, we can confirm the uniform decoration of AIS nanoparticles on the nanocomposite sample.
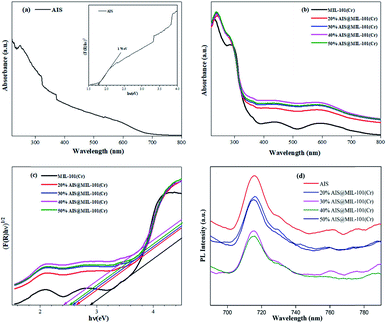
To examine the optical absorption behaviour, UV-vis diffuse reflectance spectroscopy (DRS) spectra were examined on the as-synthesised AIS nanoparticles and AIS@MIL-101(Cr) nanocomposites. In Fig. 8a and b, it could be seen that the AIS nanoparticles exhibited an enhanced visible light absorption with the edge extending up to 704 nm. The absorption bands of the 20–50% AIS@MIL-101(Cr) nanocomposites also extended in the visible light wavelength range from 400 nm to 700 nm. For the MIL-101(Cr) sample, in addition to the absorption edge near 420 nm, other absorption bands in the extended region to 700 nm were detected, representing the d–d transition band of Cr3+.42
The bandgap energy (Eg) values were estimated by Tauc's plots: (αhν) = A(hν − Eg)n/2, where α, h, ν, A, and Eg are the absorption coefficient, Planck's constant, light frequency, constant value, and bandgap energy, respectively. In this equation, n is from 1 to 4 for a direct- and indirect-band-gap semiconductor. The plot of (αhν)1/2 or (F(R)hν)1/2versus hν for AIS is in the inset of Fig. 8a, and those for MIL-101(Cr) and AIS@MIL-101(Cr) are shown in Fig. 8c. The Eg values were calculated by estimating the interception of the tangent and the plot to the band-gap axis.43 Herein, the band gaps of AIS and MIL-101(Cr) were estimated at 1.76 and 2.89 eV, respectively. Similarly, the bandgap energies of the 20, 30, 40 and 50% AIS@MIL-101(Cr) nanocomposites were calculated at approximately 2.60, 2.58, 2.40, and 2.57 eV, respectively (Table 2). This result indicates that with up to 40 wt%, the decoration of AIS particles could lower the bandgap energy. Meanwhile, with the AIS content at 50 wt% and above, the excess could cause the agglomeration between MIL-101(Cr) interfacial edges. The bandgap of MIL-101(Cr) was much lower than that for the AIS nanoparticles, and was gradually shorter than that for the AIS@MIL-101(Cr) nanocomposites. These results reveal that the combination of AIS and MIL-101(Cr) not only effectively restricted the rapid photogenerated electron and hole recombination, but also broadened the light absorbability, suggesting the enhancement in the photocatalytic activity.
| Sample | Bandgap energy (eV) |
|---|---|
| MIL-101(Cr) | 2.89 |
| AIS | 1.76 |
| 20% AIS@MIL-101(Cr) | 2.60 |
| 30% AIS@MIL-101(Cr) | 2.58 |
| 40% AIS@MIL-101(Cr) | 2.40 |
| 50% AIS@MIL-101(Cr) | 2.57 |
To clarify the recombination rate of the photogenerated electrons and holes, the PL measurements of the synthesised samples were investigated. As shown in Fig. 8d, the PL emission peak was recorded at 716 nm with the excitation wavelength at 450 nm at room temperature. More specifically, the 40% AIS@MIL-101(Cr) nanocomposites were remarkably weakened in emission peak intensity in comparison with those of the AIS@MIL-101(Cr) nanocomposite samples of 20, 30, and 50%. This result implies that the 40% AIS@MIL-101(Cr) posed the highest suppression of photogenerated electron–hole recombination rate.
Photocatalytic degradation performance
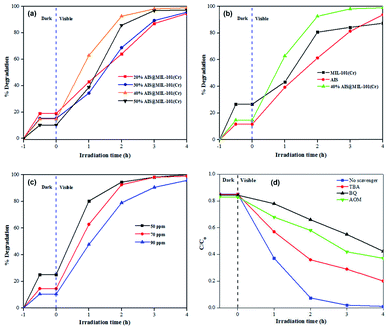
The photocatalytic degradation performances of the 20–50% AIS@MIL-101(Cr) nanocomposites with different AIS contents were investigated in detail. As depicted in Fig. 9a, the adsorption capacity of the 20–50% AIS@MIL-101(Cr) nanocomposites decreased with the increase in the content of the AIS nanoparticles. However, the degradation efficiency was enhanced. Furthermore, the effective separation of the electron–hole pairs in the AIS nanoparticles on the surface of MIL-101(Cr) was significantly improved. Indeed, an increase in the amount of AIS nanoparticles significantly influenced the photodegradation of TC, in which the activity of the 40% AIS@MIL-101(Cr) reached the highest value of approximately 99% under visible light irradiation for 4 h. Benefiting from the lowest bandgap energy and the lowest recombination rate between the photogenerated holes and electrons as proven by DRS and PL results, the 40% AIS@MIL-101(Cr) exhibited superior photodegradation of TC. With excess AIS content in MIL-101(Cr), it could limit the active sites for absorbing light rays of the visible light resource.The photodegradation of TC on the MIL-101(Cr), AIS and 40% AIS@MIL-101(Cr) is exhibited in Fig. 9b. It can be seen that the initial adsorption performance of TC on the MIL-101(Cr), AIS and 40% AIS@MIL-101(Cr) composites were about 26.6%, 11.6%, and 14.7%, respectively. As mentioned in the BET results, the decoration of AIS nanoparticles on the MIL-101(Cr) structure reduced the adsorbability of MIL-101(Cr), but enhanced the adsorbability of the AIS photocatalyst. After 4 h, the photocatalytic efficiency of the bare AIS nanoparticles was achieved at 94.4%. An enhanced photocatalytic degradation efficiency was recorded at the 40% AIS@MIL-101(Cr) nanocomposite (98.9%), compared to 87.4% in the MOF sample without AIS nanoparticles. This result demonstrates that the incorporation of MIL-101(Cr) increased the separation efficiency of photogenerated electrons and holes of AIS, and enhanced the adsorbability toward TC degradation.
The effect of the initial TC concentrations (50, 70, and 90 mg L−1) on the photocatalytic degradation of 40% AIS@MIL-101(Cr) was also investigated (Fig. 9c). At 50 mg L−1, the catalytic activity reached about 99.98% after 4 h of light irradiation. When the initial TC concentrations increased to 70 and 90 mg L−1, the photodegradation activity decreased to 98.9% and 95.8%, respectively. This is due to the limitations in the transmission ability and the pathway of the photons, leading to the reduction of the penetration rate of the visible light irradiation in the contaminant solution.44,45 In addition, with the high concentration of organic contamination, the number of intermediate compounds created in the photodegradation reaction increased, which competed with the TC molecules.46
The intermediate product of the TC photodegradation over 40% AIS@MIL-101(Cr) was analysed by HPLC-MS (Fig. 10), with the photodegradation pathway proposed as follows. First, the TC molecule was attacked by a superoxide anion radical (˙O2−), resulting in the detachment of the two hydroxyl groups, which is evidenced by the peak at m/z = 410 in the intermediate product. Then, the loss of the N-dimethyl group and ring-opening process generated the product with the peak at m/z = 365.47 Subsequently, the peaks at m/z = 337, 269, 154 and 98 correspond to the compound obtained by cleavage of the ring, along with hydroxylation and oxidation. This result demonstrated that the intermediate product was completely degraded to CO2 and H2O under visible light irradiation.
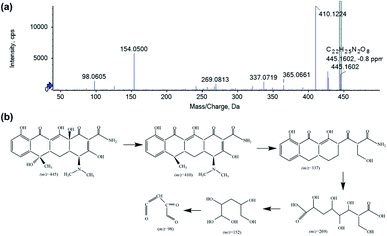 | ||
| Fig. 10 HPLC-MS analysis of the intermediate product (a) and the possible pathway (b) of the TC photodegradation over 40% AIS@MIL-101(Cr). | ||
Degradation mechanism of TC
To further investigate the photocatalytic degradation of the TC, the quenching experiments of active free radicals were explored in the photocatalytic reaction process (Fig. 9d). Here, TBA (0.5 mmol), BQ (0.5 mmol), AOM (0.5 mmol), and AgNO3 (0.5 mmol) were used to capture ˙OH−, ˙O2−, h+, e−, respectively. The results illustrated that the photocatalytic degradation performance TC was decreased by adding quenching radical agents, compared with the blank scavenger agent. Specifically, with the addition of BQ and AOM, the degradation efficiency significantly decreased, suggesting that the main active species in the photodegradation process were ˙O2− and h+.As such, the photodegradation mechanism of TC on the AIS@MIL-101(Cr) nanocomposites is proposed as follows:
| AIS@MIL-101(Cr) + hν → ē + h+ | (1) |
| ē + O2 → ˙O2− | (2) |
| h+ + H2O → H+ + 2 ˙OH | (3) |
| h+/˙OH + TC → photodegradation products | (4) |
| ˙O2 + TC → photodegradation products | (5) |
First, the photogenerated electron and hole separation were produced by absorbing visible light onto the semiconductor surface. Thus, the photogenerated electrons could interact with oxygen molecules on the photocatalyst surface to create superoxide radicals (˙O2−). Along with that, the photogenerated holes could combine with the surrounding water molecules to produce hydroxyl radicals (˙OH), thus decomposing TC into water, carbon dioxide, and other intermediate products. Moreover, the superoxide radicals could make contact with water to generate hydrogen peroxide (H2O2), and then reacted with superoxide to produce more (˙OH) radicals. As a result, a large number of hydroxyl radicals could be indirectly created to decompose TC into byproducts and completely produce the redox reaction products.
Recycling experiments
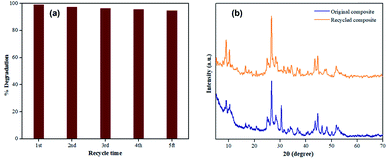
In this work, five cycles of TC photocatalytic degradation were conducted on the 40% AIS@MIL-(Cr) under visible light to examine the stability and recyclability of the synthesised photocatalyst. It should be noted in Fig. 11a that there is no significant loss in the catalytic performance within 5 recycle times with the photodegradation efficiency achieved between 95 and 97%, compared to the original value of 98.9%. The small decrease here could be due to the loss of the catalyst during the recycle process, as well as the agglomeration of AIS nanoparticles onto the MIL-101(Cr) surface, restricting the light absorption to perform the photodegradation of TC.The sample after the 5th recycle time was tested by PXRD and compared to the original 40% AIS@MIL-101(Cr) nanocomposite (Fig. 11b), showing that the crystallinity remained unchanged. This demonstrates the excellent recyclability of this catalyst during the photodegradation process.
Conclusions
In this study, a novel heterostructure AgInS2@MIL-101(Cr) photocatalyst has been successfully synthesised from recycled terephthalic acid via a simple hydrothermal process. It was confirmed that the decoration of AgInS2 on MIL-101(Cr) did not change the morphology of chalcogenide and MOF. As demonstrated by EDS ad TEM, AIS was uniformly dispersed on the MIL-101(Cr) framework. From the gas sorption results, AIS@MIL-101(Cr) retained the microporous structure of the pristine MOF despite a decreased surface area. We have demonstrated that AIS@MIL-101(Cr) exhibited the best photodegradation of tetracycline (approximately 99%) compared to the pristine AIS and MIL-101(Cr) under visible light after 4 hours of irradiation.According to DRS and PL analysis, the composite with 40% AIS doping has the highest photocatalytic activity because of the low bandgap energy and the highest restriction of a photogenerated hole and electron recombination rate. This was further confirmed in the photocatalytic degradation of TC when we compared it to the 20, 30 and 50% AIS@MIL-101(Cr) samples. This sample retained excellent photocatalytic activity after being recycled for a fifth time and maintained the crystal structure with no significant change observed in PXRD. Moreover, the quenching experiments indicated that h+ and ˙O2− are the active species playing an important role in the photocatalytic removal of TC.
Author contributions
X. N. P. and H. V. D. initiated and supervised the project. V. T. V. and H. V. T. N. performed the synthesis and structural characterisation experiments at HUMG. H. V. D. carried out the TEM and XPS at Bristol. T. T. B. N. assisted with the PL measurements of the nanocomposite samples. All authors contributed to the discussion of the results, analysis of the materials and manuscript preparation.Conflicts of interest
There are no conflicts to declare.Acknowledgements
The authors would like to acknowledge the financial support (No. B2021.MDA-03) from the Ministry of Education and Training of Vietnam. H. V. D. thanks the Royal Society of Chemistry for the Research Fund grant (R20-8172), and the UK Engineering and Physical Sciences Research Council for the Doctoral Prize Fellowship (EP/T517872/1) and the Impact Acceleration Account Funding (A109921-294). XPS experiments were performed at the Cardiff hub of the EPSRC National Facility for X-ray Photoelectron Spectroscopy (‘HarwellXPS’), operated by Cardiff University and UCL under contract no. PR16195. TEM studies were carried out in the Chemical Imaging Facility, at the University of Bristol with equipment funded by EPSRC under Grant “Atoms to Applications” (EP/K035746/1).Notes and references
- T. Deblonde, C. Cossu-Leguille and P. Hartemann, Int. J. Hyg. Environ. Health, 2017, 214(6), 442–448 CrossRef PubMed.
- Y. Zhang, S. Zuo, M. Zhou, L. Liang and G. Ren, Chem. Eng. J., 2018, 335, 685–692 CrossRef CAS.
- J. Lyu, Z. Hu, Z. Li and M. Ge, J. Phys. Chem. Solids, 2019, 129, 61–70 CrossRef CAS.
- Y. Zhao, L. Ye and X.-X. Zhang, Water Environ. Res., 2018, 90(10), 1994–2035 CrossRef PubMed.
- J. J. Rueda-Marquez, I. Levchuk, P. Fernández Ibañez and M. Sillanpää, J. Cleaner Prod., 2020, 258, 120694 CrossRef CAS.
- L. Blaney, Water Reclam. Sustainability, 2014, 265–316 CAS.
- A. Kubiak, Z. Bielan, M. Kubacka, E. Gabala, A. Z. Grzeskowiak, M. Janczarek, M. Zalas, A. Z. Jurek, K. S. Ciesielczyk and T. Jesionowski, Appl. Surf. Sci., 2020, 520, 146344 CrossRef CAS.
- H. Ma, L. Pan, J. Wang, L. Zhang and Z. Zhang, Chin. Chem. Lett., 2019, 30(1), 79–82 CrossRef CAS.
- F. Deng, F. Zhong, D. Lin, L. Zhao, Y. Liu, J. Huang, X. Luo, S. Luo and D. D. Dionysiou, Appl. Catal., B, 2017, 219, 163–172 CrossRef CAS.
- C. Huang, J. Wang, M. Li, X. Lei and Q. Wu, Solid State Sci., 2021, 117, 106611 CrossRef CAS.
- J. Yin and J. Jia, IOP Conf. Ser.: Mater. Sci. Eng., 2015, 87(1), 012114 Search PubMed.
- M. Buffiere, D. S. Dhawale and F. El-Mellouhi, Ener. Tech., 2019, 7(11), 1900819 CrossRef CAS.
- S. Li, X. Tang, Z. Zang, Y. Yao, Z. Yao, H. Zhong and B. Chen, Chin. J. Catal., 2018, 39(4), 590–605 CrossRef CAS.
- B. Liu, X. Li, Q. Zhao, J. Ke, M. Tadé and S. Liu, Appl. Catal., B, 2016, 185, 1–10 CrossRef CAS.
- E. Baeissa, J. Ind. Eng. Chem., 2014, 20(5), 3270–3275 CrossRef CAS.
- H. Tsai, J. Shaya, S. Tesana, V. B. Golovko, S. Wang, Y. Liao, C. Lu and C. Chen, Catalysts, 2020, 10(8), 857 CrossRef CAS.
- A. Malankowska, D. Kulesza, J. Sowik, O. Cavdar, T. Klimczuk, G. Trykowski and A. Z. Medynska, Catalysts, 2020, 10(4), 403 CrossRef CAS.
- H. Liu, J. Zhang and D. Ao, Appl. Catal., B, 2018, 221, 433–442 CrossRef CAS.
- A. S. Belousov and E. V. Suleimanov, Green Chem., 2021, 23, 6172–6204 RSC.
- A. S. Belousov, D. G. Fukina and A. V. Koryagin, J. Chem. Technol. Biotechnol., 2022 DOI:10.1002/jctb.7091.
- Y. Zhang, J. Xu, J. Zhou and L. Wang, Chin. J. Catal., 2022, 43(4), 971–1000 CrossRef.
- X. Zhao, J. Li, X. Li, P. Huo and W. Shi, Chin. J. Catal., 2021, 42(6), 872–903 CrossRef CAS.
- A. Liu, C. Yu, J. Lin, G. Sun, G. Xu, Y. Huang, Z. Liu and C. Tang, Mater. Res. Bull., 2019, 112, 147–153 CrossRef CAS.
- P. D. Du, H. T. M. Thanh, C. To, H. S. Thang, M. X. Tinh, T. N. Tuyen, T. T. Hoa and D. Q. Khieu, Eur. J. Nanomed., 2019, 2019, 1–15 Search PubMed.
- K. C. Chong, P. S. Ho, S. O. Lai, S. S. Lee, W. J. Lau, S. Y. Lu and B. S. Ooi, Sustain., 2022, 14(3), 1152 CrossRef CAS.
- X. Huang, Q. Hu, L. Gao, Q. Hao, P. Wang and D. Qin, RSC Adv., 2018, 8(49), 27623–27630 RSC.
- H. V. Doan, H. T. Nguyen, V. P. Ting, S. Guan, J. Eloi, S. R. Hall and X. N. Pham, Faraday Discuss., 2021, 231, 81–96 RSC.
- K. Leng, Y. Sun, X. Li, S. Sun and W. Xu, Cryst. Growth Des., 2016, 16(3), 1168–1171 CrossRef CAS.
- Z. Liu, K. Tang, D. Wang, L. Wang and Q. Hao, Nanoscale, 2013, 5(4), 1570 RSC.
- M. V. Beloš, N. D. Abazovic, J. K. Jakovljevic, I. Jankovic, S. P. Ahrenkiel, M. Mitric and M. I. Comor, J. Nano Res., 2013, 15, 1–11 Search PubMed.
- Y. Wang, Y. F. Shi, X. B. Li, D. W. Li, T. Zhang and Y. C. He, Der Chemica Sinica, 2017, 8(3), 333–341 CAS.
- X. Zhou, W. Huang, J. Shi, Z. Zhao, q. Xia, Y. Li, H. Wang and Z. Li, J. Mater. Chem. A, 2014, 2(13), 4722–4730 RSC.
- X. Liu, S.-Q. Gao, J.-H. Fan, X.-M. Li, H.-H. Qin, J.-X. Wang, S.-J. Ma, Z.-X. Liu and Y. Yu, New J. Chem., 2019, 43, 8179–8188 RSC.
- D. Yin, C. Li, H. Ren, O. Shekhah, J. Liu and C. Liang, RSC Adv., 2017, 7(3), 1626–1633 RSC.
- Q. Liu, L. Ning, S. Zheng, M. Tao, Y. Shi and Y. He, Sci. Rep., 2013, 3, 1–6 CAS.
- M. Sheikh Alivand, N. H. M. H. Tehrani, M. Shafiei-Alavijeh, A. Rashidi, M. Kooti, A. Pourreza and S. Fakhraie, J. Environ. Chem. Eng., 2019, 7(2), 102946 CrossRef CAS.
- S. P. Hong, H. K. Park, J. H. Oh, H. Yang and Y. R. Do, J. Mater. Chem. A, 2012, 22(36), 18939 RSC.
- F. W. Ohrendorf and H. Haeuseler, Cryst. Res. Technol., 1999, 34(3), 339–349 CrossRef CAS.
- X. Lv, H. Lan, J. Guo, M. Guo and Y. Yan, J. Mater. Sci.: Mater. Electron., 2020, 31, 22284–22296 CrossRef CAS.
- Q. Huo, X. Qi, J. Li, G. Liu, Y. Ning, X. Zhang, B. Zhang, Y. Fu and S. Liu, Appl. Catal., B, 2019, 255, 117751 CrossRef CAS.
- Y. Tang, X. Yin, M. Mu, Y. Jiang, X. Li, H. Zhang and T. Ouyang, Colloids Surf., A, 2020, 596, 124745 CrossRef CAS.
- J. He, Z. Yan, J. Wang, J. Xie, L. Jiang, Y. Shi, F. Yuan, F. Yu and Y. Sun, Chem. Commun., 2013, 49(60), 6761 RSC.
- P. Ganguly, S. Mathew, L. Clarizia, S. R. Kumar, A. Akande, S. J. Hinder, A. Breen and S. C. Pillai, ACS Omega, 2020, 5(1), 406–421 CrossRef CAS PubMed.
- B. Zhou, X. Zhao, H. Liu, J. Qu and C. P. Huang, Appl. Catal., B, 2010, 99(1–2), 214–221 CrossRef CAS.
- F. Su, P. Li, J. Huang, M. Gu, Z. Liu and Y. Xu, Sci. Rep., 2021, 11, 1–13 CrossRef PubMed.
- W. Shi, C. Liu, M. Li, X. Lin, F. Guo and J. Shi, J. Hazard. Mater., 2020, 389, 121907 CrossRef CAS PubMed.
- S. Wu, H. Hu, Y. Lin, J. Zhang and Y. H. Hu, Chem. Eng. J., 2020, 382, 122842 CrossRef CAS.
| This journal is © The Royal Society of Chemistry 2022 |

