 Open Access Article
A highly stable bimetallic organic framework for enhanced electrical performance of cellulose nanofiber-based triboelectric nanogenerators†
Tingting
Wang
ac,
Qiuxiao
Zhu
a,
Qi
Zhu
c,
Qifeng
Yang
c,
Shuangfei
Wang
 abc and
Lianxin
Luo
 *ab
*ab
aCollege of Light Industry and Food Engineering, Guangxi University, Nanning, 530004, PR China
bGuangxi Key Lab of Clean Pulp and Papermaking and Pollution Control, Guangxi University, Nanning, 530004, PR China
cGuangxi Bossco Environment Protecting Technology Co., Ltd, Nanning, 530007, PR China
First published on 29th August 2022
Abstract
Triboelectric nanogenerators (TENGs) have garnered considerable attention as an emerging energy harvesting technology. To improve the electrical properties of the triboelectric materials in TENGs, various micro- and nanomaterials with strong charge-trapping capabilities are introduced as filler materials. However, the fillers generally perform a single function and lack long-term operational durability. Hence, further research is required to achieve stable and efficient TENGs. In this study, NH2 metal–organic frameworks (NH2-MOFs) were combined with a cellulose nanofiber (CNF) to prepare a composite film. NH2-MOFs have an aminated bimetallic organic backbone with strong charge-induction and charge-trapping capabilities. Thus, their addition significantly improved the stability, positive triboelectric properties and charge-trapping performance of the composite film. The optimized composite film and a fluorinated ethylene propylene film were used as triboelectric pairs to assemble a TENG. The electrical performance of the TENG was approximately 230% greater than that of a TENG with a pure CNF film and remained very stable for at least 90 days. These results demonstrate that NH2-MOFs are promising fillers for improving the performance of TENGs and expanding the range of materials used in TENG construction.
Introduction
As the popularity of electronic devices grows, so does the demand for electricity. Electricity is typically generated via the combustion of fossil fuels. However, conventional fossil fuels are limited in supply and non-renewable. Therefore, in order to replace conventional fossil fuels, it is imperative that renewable energy is harvested.1–5In 2012, Fan et al.6 proposed the concept of a triboelectric nanogenerator (TENG) that converts mechanical energy from the environment into electrical energy through the coupling of contact and electrostatic induction.7 TENGs are low-cost, small, portable, and applicable to a variety of scenarios.8,9 Thus, they have been used to power wearable electronics,10,11 sensors,12,13 and other small electronic devices.14 However, the relatively low output power density of TENGs limits their wider application.
Researchers have made numerous attempts to enhance the electrical properties of TENGs by selecting suitable triboelectric materials,15–17 introducing functional groups,18,19 doping with materials with high dielectric constants,20,21 and designing micropatterned surfaces.22,23 Among these approaches, the selection of suitable electrode materials to increase the surface charge density is the most effective way of improving the fundamental performance of TENGs. Many synthetic polymers have advantageous properties applicable to enhancing TENG electrical performance, but their long-term use causes plastic pollution. In contrast, cellulose, which is the most abundant natural polymer on Earth, is widely available, biodegradable, and renewable.24,25 However, cellulose becomes positively charged due to triboelectric electrification. Hence, the direct use of cellulose as an electrode material does not fulfill practical requirements, necessitating its modification. Embedding nano- and microscale materials (“fillers”) into a cellulose matrix not only leads to desirable properties, but also improves the surface properties and enhances the output performance of TENGs.26–28
Existing fillers typically perform only a single function in capturing triboelectric charges, and there are few systematic studies on their charge-induction capabilities. Although amino groups are suitable electron-releasing groups that can improve the triboelectric properties of cellulose,29 it is still a challenge to perfectly introduce amino groups into the filler to prepare a composite with strong charge-induction and charge-trapping capabilities.30
Metal–organic frameworks (MOFs) are an emerging class of porous materials with multiple crystallinities formed by ligating metal ions or clusters with multifunctional organic ligands.31 Owing to the structural and functional versatility of MOFs, their utilization as functional fillers is promising for the development of high-performance TENG composites.32 Considering that iron is an environmentally friendly, abundant, inexpensive, and non-toxic metal, we explored the use of an iron-based MOF (MIL-101(Fe)) with a topological network structure of an MTN molecular sieve composed of Fe3+ and 1,4-phenylene terephthalic acid. However, the poor stability of MIL-101(Fe) (due to the inherent lack of unsaturated sites) hinders its efficient application and the stability of its long-term operation. Therefore, in order to develop high-performance stable TENG composites, we doped Cu2+ ions into MIL-101(Fe) to further improve its stability and increase the number of the unsaturated metal sites.
In this study, we prepared aminated bimetallic MOFs (NH2-MIL-101(Fe,Cu)) as a bifunctional filler. In addition to playing a charge-trapping role similar to that of conventional fillers, it enhanced charge induction by introducing –NH2 groups and increasing the surface roughness. In order to develop a high-performance and stable TENG, NH2-MIL-101(Fe, Cu) was combined with a cellulose nanofiber (CNF) to prepare a composite film for use as the triboelectric layer. The composite film was characterized by scanning electron microscopy (SEM), Fourier-transform infrared (FTIR) spectroscopy, X-ray diffraction (XRD), thermogravimetric (TG) analysis, and atomic force microscopy (AFM). The resultant TENG could charge and power external devices and exhibited potential for use in self-powered sensing systems. These results provide a factual basis for further expanding the application scope of triboelectric materials used in TENGs.
Experimental section
Materials
The CNF was obtained from Guangxi Guitang (Group) Co., Ltd (Guangxi, China). The following items were purchased from Aladdin Biochemical Technology Co. (Shanghai, China): terephthalic acid (TPA), 2-aminoterephthalic acid (NH2-TPA), iron chloride hexahydrate (FeCl3·6H2O), and copper nitrate trihydrate (Cu(NO3)2·3H2O). All chemicals used in this study were of analytical grade and used without further purification.Synthesis of MOF nanoparticles
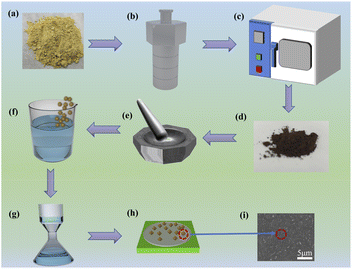
MIL-101(Fe), NH2-MIL-101(Fe), and NH2-MIL-101(Fe,Cu) MOFs (denoted as M1, M2, and M3, respectively) were synthesized by a previously reported one-step hydrothermal method33,34 with minor modifications. FeCl3·6H2O and Cu(NO3)2·3H2O were used as iron and copper sources, respectively. The process is depicted in Fig. 1(a)–(e). First, FeCl3·6H2O (1.08 g) was dissolved with TPA (0.66 g) or NH2-TPA (0.72 g) in 80 mL of dimethylformamide (DMF) and magnetically stirred for 3 h. The well-mixed solution was then transferred into a 100 mL polytetrafluoroethylene (PTFE)-lined autoclave, heated continuously at 110 °C for 20 h, and naturally cooled to room temperature. The resulting suspension was alternately washed with DMF, anhydrous ethanol, and deionized water three times. After centrifugation, the solids were dried in a vacuum oven at 60 °C for 6 h to obtain M1 and M2, respectively. The preparation and purification methods used for M3 were the same as those of M2, except that Cu(NO3)2·3H2O (0.19 g) was also added during the preparation of the mixed solution of FeCl3·6H2O (1.08 g) and NH2-TPA (0.72 g). The resulting solid fillers were ground, dried, and then transferred to a vacuum drying dish for storage.Preparation of CNF membranes and MOFs/CNF composite membranes
As shown in Fig. 1(f)–(h), CNF membranes and MOFs/CNF composite membranes with a thickness of approximately 50 μm were prepared via vacuum-assisted filtration. To prepare CNF membranes and MOFs/CNF composite films, different mass percentages of M1, M2, and M3 nanoparticles (0, 0.25, 0.5, 1, 3, and 5 wt%) were dispersed into anhydrous ethanol and stirred ultrasonically for 1 h. Then, each of these samples was added to 0.5 g of (absolutely dry) CNF, and deionized water was added to dilute the sample concentration to less than 0.2 wt%. Next, each sample was stirred at 25°Cfor 2 h. Subsequently, the uniformly dispersed suspension was poured into a G5 sand core funnel with a PTFE film and dried in an automatic forming dryer (ESTANITHAAGE BBS-2, Germany) at 60 °C for 20 min. Finally, the dried film was cured in an oven at 120 °C to obtain a CNF film and MOFs/CNF composite films. The composite films with M1, M2, and M3 nanoparticles are denoted as CM1, CM2, and CM3, respectively.Fabrication of TENGs
As shown in Fig. S1,† the TENGs were assembled according to the conventional vertical contact separation mode. TENGs were prepared from each type of MOFs/CNF composite film by using a transparent acrylic plate (7 × 7 cm) to support the device and by cutting a fluorinated ethylene propylene (FEP) film and the MOFs/CNF composite film into 4 × 4 cm pieces. The FEP film and MOFs/CNF composite film were used as the negative and positive triboelectric materials of the device, respectively. Both films were fixed onto the support plate using a double-sided conductive adhesive, and the positive and negative ends were connected. The same preparation and assembly methods were used to prepare a CNF film-based TENG (denoted as C-TENG), except that the positive material was a pure CNF film.Characterization
The crystallographic morphology of the samples was analyzed by high-resolution field-emission SEM (Hitachi SU8220, Japan). A small amount of the sample was placed on a sample holder using conductive tape and Au-coated by spraying for 150 s. Then, the sample morphology was analyzed at an accelerating voltage of 5 kV. The surface functional groups were characterized by FTIR spectroscopy (VERTES 70, Germany) in the 4000–400 cm−1 range using 32 scans and a resolution of 4 cm−1. The crystal structure of the samples was analyzed using XRD (Rigaku MiniFlex600, Japan) with Cu Kα radiation at 30 kV and 20 mA in the 2θ range of 5–80° at a scan speed of 10° per min. The thermal stability of the samples was tested by TG analysis (NETZSCH STA2500, Germany). The samples were heated from room temperature to 600 °C at a rate of 10 °C min−1 under atmospheric pressure. An AFM (HITACHI 5100N, Japan) was used to observe the roughness of the sample surface. To investigate the electrical performance, a shaker (JZK-10, China) and a linear motor measuring device (LINMOT H10-70 × 240/210, US) were used to periodically separate and join the TENG electrodes at a certain acceleration, and the generated electrical signals were collected with an electrostatic meter (Keithley 6514, US) and acquisition card (NI USB-6259, US).Results and discussion
Characterization of MOFs and composite films
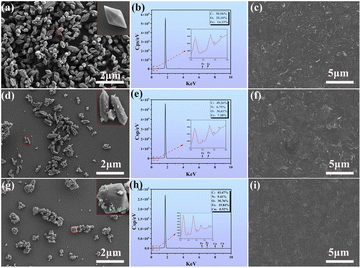
Fig. 2 shows the surface morphology and energy-dispersive X-ray spectroscopy (EDS) energy spectra of the MOFs and composite films. Fig. 2(a) shows that all the M1 particles had a uniform three-dimensional octahedral structure and smooth surface. The relative percentages of C, O, and Fe were 50.56%, 35.10%, and 14.33%, respectively (Fig. 2(b)). As shown in Fig. 2(d), the synthesized M2 particles had a hexagonal spindle-shaped body with a uniform particle distribution. The relative percentages of C, N, O, and Fe were 49.26%, 6.75%, 36.61%, and 7.38%, respectively (Fig. 2(e)). The presence of N proves that the –NH2 group was successfully grafted onto the MOFs in M2. As shown in Fig. 2(g), the doping of Cu also affected the morphology of the material, as M3 had a slightly rougher surface than M2. The relative percentages of C, N, O, Fe, and Cu in M3 were 43.47%, 9.41%, 30.76%, 15.84%, and 0.52%, respectively (Fig. 3(h)). The presence of N and Cu indicates that Cu2+ and –NH2 were successfully introduced into the MOFs in M3. As shown in Fig. 2(c), (f) and (i), the MOF nanoparticles were clearly visible in the CM1, CM2, and CM3 composite films, with uniform distributions in the CNF matrix. This should provide mechanical stability to the composite films.
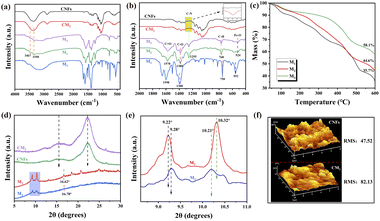
Fig. 3(a) and (b) show the FTIR spectra of the samples. The spectra of M2 and M3 contained two low-intensity absorption peaks at 3350 and 3467 cm−1, which originate from asymmetric and symmetric N–H stretching vibrations, respectively. In addition, they contained an absorption peak at 1255 cm−1, which originates from C–N stretching vibrations.35 These peaks indicate that –NH2 was successfully grafted onto the MOFs. The peaks corresponding to N–H and C–N stretching vibrations were also observed in the CM3 composite film, indicating that M3 was successfully compounded with the CNF. No new absorption bands or peak shifts were found in the CM3 spectrum, indicating that no chemical interactions occurred between the CNF and MOFs. The FTIR spectra of MOFs contained peaks at 1598 and 1578 cm−1, which originate from C![[double bond, length as m-dash]](https://www.rsc.org/images/entities/char_e001.gif) O stretching vibrations;36 at 1388 and 1380 cm−1 from C–O stretching vibrations and at 552 and 524 cm−1 from Fe–O stretching vibrations.37 All the M2 peaks had lower intensities compared to those of M3, which was attributed to electrostatic interactions between the copper ions and organic ligands in the benzene ring. The peaks of both M2 and M3 were shifted compared to those of M1, which was primarily due to the interaction between –NH2 and the MOFs.38
O stretching vibrations;36 at 1388 and 1380 cm−1 from C–O stretching vibrations and at 552 and 524 cm−1 from Fe–O stretching vibrations.37 All the M2 peaks had lower intensities compared to those of M3, which was attributed to electrostatic interactions between the copper ions and organic ligands in the benzene ring. The peaks of both M2 and M3 were shifted compared to those of M1, which was primarily due to the interaction between –NH2 and the MOFs.38
The stability of the MOFs was analyzed via TG analysis, as shown in Fig. 3(c). All the samples had two main stages of weight loss. The first stage occurred from 30 to 305 °C, with a mass loss of 10.1% to 24.2%. This is mainly due to the removal of guest water molecules. The second stage occurred from 305 to 600 °C, with a mass loss of 31.8% to 40.1%. This is mainly caused by the removal of hydroxyl groups from the skeleton and by structural collapse. The order of thermal stability was M3 > M2 > M1 (as determined by TG analysis), indicating that the introduction of –NH2 and Cu2+ improved the stability of the MOFs.
The crystal structures of the samples were determined via XRD. As shown in Fig. 3(d) and (e), the characteristic diffraction peaks of M2 and M3 were in agreement with those reported previously,33 indicating the successful synthesis of NH2-MOFs. The XRD peak intensities of the CM3 composite film differed somewhat from those of the CNF film. These changes were attributed to the interaction between the NH2-MOFs and CNF. However, the XRD spectrum of the CM3 composite film confirms that the crystallinity of the composite film remained unchanged. As shown in Fig. 3(f), the root-mean-square (RMS) roughness of the CNF film was increased from 47.52 to 82.13 nm after the addition of M3 nanoparticles, indicating an increase in the roughness of the CM3 composite film after the addition of MOF nanofillers.
Structure and the working mechanism of TENGs
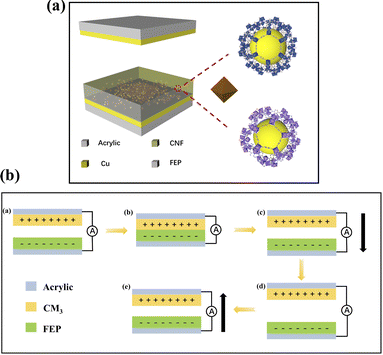
As shown in Fig. 4(a), the CM3-TENG consisted of a CM3 composite and FEP membranes as triboelectric pairs. NH2-MOFs have high porosities, high specific surface areas, and rigid MTN-type crystal structures. They also consist of two spherical cages: one with a large cage diameter of 3.4 nm and one with a small cage diameter of 2.9 nm.39 The coupling between contact and electrostatic induction in TENG devices is based on the CM3 composite films, and the working mechanism is shown in Fig. 4(b). No charge is generated in the initial stage. When an external force is applied, the upper and lower layers come into contact, and the surface charge is transferred due to electrostatic induction. It can be concluded from the electronegativity sequence that CM3 is more likely to lose electrons, and FEP is more likely to gain electrons; when electrons are transferred from the CM3 membrane to the FEP membrane, negative charges accumulate on the surface of the FEP membrane. When the two layers are separated as a result of the external force, a distance-dependent potential difference is generated, which reaches its maximum at the maximum distance. The point imbalance between the two layers causes electrons to flow in the external circuit until an equilibrium state is reached. When the direction of the external force changes, the two layers are pressed further together, and the potential difference begins to decrease. As a result, the electrons move in opposite directions during the pressurization process, and the electron flow is driven back and forth during the periodic contact and separation process, resulting in an output of AC voltage and current.NH2-MOF enhancement of TENG electrical performance
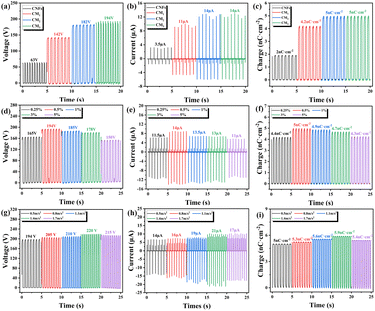
To investigate the effect of the MOFs on the contact initiation performance of the CNF film, the open-circuit voltage, short-circuit current, and charge density of C-TENG, CM1-TENG, CM2-TENG, and CM3-TENG were probed. A linear motor was used to oscillate two TENG electrodes into periodic contact and separation at an acceleration of 0.5 m s−2 with a friction area of 4 × 4 cm. As shown in Fig. 5(a)–(c), the open-circuit voltage of the C-TENG was 63 V, its short-circuit current was 3.5 μA, and its charge density was 2 nC cm−2. In comparison, the open-circuit voltage of the CM1-TENG increased from 63 to 142 V (a 125% improvement), the short-circuit current increased from 3.5 to 11 μA (a 214% improvement), and the charge density increased from 2 to 4.2 nC cm−2 (a 110% improvement). These improvements resulted from the MIL-101(Fe) nanoparticles, which have strong dielectric-trapping and dielectric-induction capabilities; thus, they enhanced the triboelectric properties of the composite and the electrical performance of the TENG. The open-circuit voltage, short-circuit current, and charge density of the CM2-TENG were 182 V, 14 μA, and 5 nC cm−2, respectively, corresponding to 189%, 300%, and 150% improvements over those of the C-TENG, respectively. These improvements resulted from the electron-giving function of the –NH2 groups, which further improved the triboelectric positive polarity of the CNF film and thus the electrical performance of the TENG. Finally, the CM3-TENG had an open-circuit voltage, short-circuit current, and charge density of 194 V (266% increase compared to that of the C-TENG), 14 μA (300% improvement), and 5 nC cm−2 (150% improvement), respectively.We also investigated the relationship between the mass ratio of M3 nanoparticles and the TENG electrical performance to optimize the mass loading of the active filler. As shown in Fig. 5(d)–(f), the output voltage and current initially increased as the M3 mass ratio increased. When the mass ratio was 0.5 wt%, the open-circuit voltage, short-circuit current, and charge density reached their maximum values of 194 V, 14 μA, and 5 nC cm−2, respectively. The positive correlation between the mass loading of CM3 and the electrical performance was due to the charge transfer caused by the –NH2 groups. However, as the mass ratio increased above 0.5 wt%, the electrical output decreased. At a mass ratio of 5 wt%, the open-circuit voltage, short-circuit current, and charge density of the TENG were 150 V, 11 μA, and 4.3 nC cm−2, respectively. This was attributed to the large-scale agglomeration of CM3 particles in the polymer matrix when the mass loading exceeded 0.5 wt%, which also led to the formation of voids between the CM3 particles and CNF matrix. Therefore, the optimal mass ratio of the CM3 nanoparticles in the CNF matrix was 0.5 wt%.
As shown in Fig. 5(g)–(i), when the acceleration increased from 0.5 to 1.4 m s−2, the open-circuit voltage increased from 194 to 220 V (a 13.4% increase), the short-circuit current increased from 14 to 21 μA (a 50% increase), and the charge density increased from 5 to 5.9 nC cm−2 (an 18% increase). This increase of electrical performance with acceleration was due to the increased charge transfer rate. However, when the acceleration was greater than 1.4 m s−2, the electrical performance decreased, which was primarily due to the insufficient contact area between the positive and negative materials. The latter was caused by the rapid motion of the TENG electrodes as they were driven by a linear motor, which decreased the rate at which the surface charge could be transferred.
Applications of the NH2-MOF-incorporated TENG
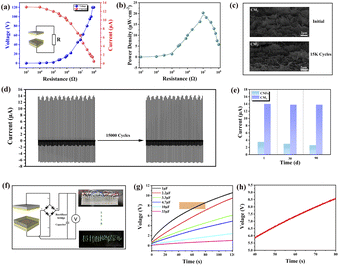
As shown in Fig. 6(a), we also used the CM3-TENG as a power source for LED lamps and capacitors to explore the potential for extending its range of applications. The CM3-TENG was connected to a resistor box, and the changes in the output voltage and current as well as the output power in the 103–108 Ω range were measured. The results show that the output voltage increased as the external resistance increased, while the current exhibited the opposite trend. As shown in Fig. 6(b), the output power density initially increased and then decreased; the maximum output power density was 20.3 μW cm−2 when the external resistance was 107 Ω. For practical applications, stability is one of the most important parameters of TENGs. Therefore, we conducted a stability test on the CM3-TENG, as shown in Fig. 6(d). The current remained essentially unchanged after 15![[thin space (1/6-em)]](https://www.rsc.org/images/entities/char_2009.gif) 000 contact–separation cycles at an acceleration of 0.5 m s−2, which proved that the CM3-TENG was durable. As shown in the SEM images in Fig. 6(c), the morphology of the CM3-TENG did not change significantly after the 90 day cycling test. Additionally, as shown in Fig. 6(e), we tested the stability of the C-TENG and CM3-TENG separately. The output current of the CM3-TENG remained essentially unchanged after 90 days, while that of the C-TENG decreased slightly, indicating that the CM3-TENG was more stable. More importantly, the CM3-TENG directly powered 84 LEDs simultaneously, as shown in Fig. 6(f). To simulate other practical applications, the CM3-TENG was connected to capacitors of six different sizes (1, 2.2, 3.3, 4.7, 10, and 33 μF) for charging, as shown in Fig. 6(g). This test demonstrated the real-time variation in the voltage of the charging process for the six capacitors over the course of 120 s, and as shown in Fig. 6(h), the voltage increased during each cycle. These practical results demonstrate that the design of the CM3-TENG has a promising future in the field of self-powered devices.
000 contact–separation cycles at an acceleration of 0.5 m s−2, which proved that the CM3-TENG was durable. As shown in the SEM images in Fig. 6(c), the morphology of the CM3-TENG did not change significantly after the 90 day cycling test. Additionally, as shown in Fig. 6(e), we tested the stability of the C-TENG and CM3-TENG separately. The output current of the CM3-TENG remained essentially unchanged after 90 days, while that of the C-TENG decreased slightly, indicating that the CM3-TENG was more stable. More importantly, the CM3-TENG directly powered 84 LEDs simultaneously, as shown in Fig. 6(f). To simulate other practical applications, the CM3-TENG was connected to capacitors of six different sizes (1, 2.2, 3.3, 4.7, 10, and 33 μF) for charging, as shown in Fig. 6(g). This test demonstrated the real-time variation in the voltage of the charging process for the six capacitors over the course of 120 s, and as shown in Fig. 6(h), the voltage increased during each cycle. These practical results demonstrate that the design of the CM3-TENG has a promising future in the field of self-powered devices.
Conclusions
In this study, to enhance the electrical properties of TENGs, aminated bimetallic MOFs (NH2-MIL-101(Fe,Cu)) were introduced as fillers. Unlike conventional fillers, the NH2-MOFs had bifunctionality owing to the –NH2 groups, which improved the charge-induction capability, and bimetals, which increased the number of charge-trapping sites. The mass ratio of NH2-MOFs in the CNF film was optimized. The output voltage and current reached 194 V and 14 μA, respectively, at a M3 mass fraction of 0.5 wt%, with a maximum output power density of 20.3 mW cm−2 at a load resistance of 107 Ω. In addition, the CM3-TENG exhibited superior stability and durability, could light 84 LEDs simultaneously, and could charge six different capacitors according to its self-powering characteristics. In summary, given the structural versatility and designability of MOFs, embedding NH2-MOF fillers into CNFs is a direct and effective way to improve the electrical performance of TENGs.Author contributions
Tingting Wang and Lianxin Luo conceived the idea and designed the experiment. Qiuxiao Zhu and Qi Zhu carried out the materials characterization. Tingting Wang and Qifeng Yang performed the electrical measurement. Tingting Wang and Lianxin Luo wrote the manuscript. All the authors discussed the results and commented on the manuscript.Conflicts of interest
There are no conflicts to declare.Acknowledgements
The authors gratefully acknowledge the financial support of the Guangxi Key R&D Program Gui Ke (grant number AB21196064) and the Guangxi Ba-Gui Scholars Program (grant number 2019A33). The authors would like to thank the Shiyanjia Lab (https://www.shiyanjia.com) for the SEM test.Notes and references
- C. Shan, W. Liu, Z. Wang, X. Pu, W. He, Q. Tang, S. Fu, G. Li, L. Long, H. Guo, J. Sun, A. Liu and C. Hu, Energy Environ. Sci., 2021, 14, 5395–5405 RSC.
- Y. Xi, H. Guo, Y. Zi, X. Li, J. Wang, J. Deng, S. Li, C. Hu, X. Cao and Z. L. Wang, Adv. Energy Mater., 2017, 7, 1602397 CrossRef.
- P. Chen, J. An, S. Shu, R. Cheng, J. Nie, T. Jiang and Z. L. Wang, Adv. Energy Mater., 2021, 11, 2003066 CrossRef CAS.
- Y. Feng, L. Zhang, Y. Zheng, D. Wang, F. Zhou and W. Liu, Nano Energy, 2019, 55, 260–268 CrossRef CAS.
- S. Wang, Y. Xie, S. Niu, L. Lin and Z. L. Wang, Adv. Mater., 2014, 26, 2818–2824 CrossRef CAS PubMed.
- F. R. Fan, Z. Q. Tian and Z. L. Wang, Nano Energy, 2012, 1, 328–334 CrossRef CAS.
- X. Xia, H. Wang, H. Guo, C. Xu and Y. Zi, Nano Energy, 2020, 78, 105343 CrossRef CAS.
- Q. Sun, L. Wang, X. Yue, L. Zhang, G. Ren, D. Li, H. Wang, Y. Han, L. Xiao, G. Lu, H.-D. Yu and W. Huang, Nano Energy, 2021, 89, 106329 CrossRef CAS.
- T. Huang, J. Zhang, B. Yu, H. Yu, H. Long, H. Wang, Q. Zhang and M. Zhu, Nano Energy, 2019, 58, 375–383 CrossRef CAS.
- J. Chen, H. Guo, Z. Wu, G. Xu, Y. Zi, C. Hu and Z. L. Wang, Nano Energy, 2019, 64, 103920 CrossRef CAS.
- I. Mehamud, P. Marklund, M. Björling and Y. Shi, Nano Energy, 2022, 98, 107292 CrossRef CAS.
- H. Yang, W. Liu, Y. Xi, M. Lai, H. Guo, G. Liu, M. Wang, T. Li, X. Ji and X. Li, Nano Energy, 2018, 47, 539–546 CrossRef CAS.
- Y. Du, Q. Tang, W. He, W. Liu, Z. Wang, H. Wu, G. Li, H. Guo, Z. Li, Y. Peng and C. Hu, Nano Energy, 2021, 90, 106543 CrossRef CAS.
- Z. L. Wang, Adv. Energy Mater., 2020, 10, 2000137 CrossRef CAS.
- C. Y. Liu and A. J. Bard, Nat. Mater., 2008, 7, 505 CrossRef CAS PubMed.
- J. Wang, Z. Wen, Y. Zi, P. Zhou, J. Lin, H. Guo, Y. Xu and Z. L. Wang, Adv. Funct. Mater., 2016, 26, 1070 CrossRef CAS.
- Y. Liu, J. Mo, Q. Fu, Y. Lu, N. Zhang, S. Wang and S. Nie, Adv. Funct. Mater., 2020, 30, 2004714 CrossRef CAS.
- S. Nie, Q. Fu, X. Lin, C. Zhang, Y. Lu and S. Wang, Chem. Eng. J., 2021, 404, 126512 CrossRef CAS.
- A. Isogai, T. Hänninen, S. Fujisawa and T. Saito, Prog. Polym. Sci., 2018, 86, 122 CrossRef CAS.
- T. Bhatta, P. Maharjan, H. Cho, C. Park, S. H. Yoon, S. Sharma, M. Salauddin, M. T. Rahman, S. M. S. Rana and J. Y. Park, Nano Energy, 2021, 81, 105670 CrossRef CAS.
- P.-Y. Feng, Z. Xia, B. Sun, X. Jing, H. Li, X. Tao, H.-Y. Mi and Y. Liu, ACS Appl. Mater. Interfaces, 2021, 13, 16916–16927 CrossRef CAS PubMed.
- I. Kim, H. Roh, W. Choi and D. Kim, Nanoscale, 2021, 13, 8837–8847 RSC.
- A. R. Mule, B. Dudem and J. S. Yu, Energy, 2018, 165, 677–684 CrossRef CAS.
- Z. Niu, W. Cheng, M. Cao, D. Wang, Q. Wang, J. Han, Y. Long and G. Han, Nano Energy, 2021, 87, 106175 CrossRef CAS.
- X. Lin, Z. Wu, C. Zhang, S. Liu and S. Nie, Ind. Crops Prod., 2018, 120, 16–24 CrossRef CAS.
- H. Liu, Y. Feng, J. Shao, Y. Chen, Z. L. Wang, H. Li, X. Chen and Z. Bian, Nano Energy, 2020, 70, 104499 CrossRef CAS.
- T. Wu, Y. Song, Z. Shi, D. Liu, S. Chen, C. Xiong and Q. Yang, Nano Energy, 2021, 80, 105541 CrossRef CAS.
- A. Rajabi-Abhari, J.-N. Kim, J. Lee, R. Tabassian, M. Mahato, H. J. Youn, H. Lee and I.-K. Oh, ACS Appl. Mater. Interfaces, 2021, 13, 219–232 CrossRef CAS PubMed.
- S. Wang, Y. Zi, Y. S. Zhou, S. Li, F. Fan, L. Lin and Z. L. Wang, J. Mater. Chem. A, 2016, 4, 3728–3734 RSC.
- S. Li, J. Nie, Y. Shi, X. Tao, F. Wang, J. Tian, S. Lin, X. Chen and Z. L. Wang, Adv. Mater., 2020, 32, 2001307 CrossRef CAS PubMed.
- H. Wang, L. Yu, Y. Lin, J. Peng, S. J. Teat, L. J. Williams and J. Li, Inorg. Chem., 2020, 59, 4167–4171 CrossRef CAS PubMed.
- X.-F. Zhang, Z. Wang, M. Ding, Y. Feng and J. Yao, J. Mater. Chem. A, 2021, 9, 23353–23363 RSC.
- P. Xiong, H. Zhang, G. Li, C. Liao and G. Jiang, Sci. Total Environ., 2021, 797, 149179 CrossRef CAS PubMed.
- D. Capková, M. Almáši, T. Kazda, O. Čech, N. Király, P. Čudek, A. S. Fedorková and V. Hornebecq, Electrochim. Acta, 2020, 354, 136640 CrossRef.
- H. Hu, H. Zhang, Y. Chen and H. Ou, Environ. Sci. Pollut. Res., 2019, 26, 24720–24732 CrossRef CAS PubMed.
- N. V. Maksimchuk, M. N. Timofeeva, M. S. Melgunov, A. N. Shmakov, Y. A. Chesalov, D. N. Dybtsev, V. P. Fedin and O. A. Kholdeeva, J. Catal., 2008, 257, 315–323 CrossRef CAS.
- Q. Wu, H. Yang, L. Kang, Z. Gao and F. Ren, Appl. Catal., B, 2020, 263, 118282 CrossRef CAS.
- P. Huang, L. Yao, Q. Chang, Y. Sha, G. Jiang, S. Zhang and Z. Li, Chemosphere, 2022, 291, 133026 CrossRef CAS PubMed.
- G. Férey, C. Mellot-Draznieks, C. Serre, F. Millange, J. Dutour, S. Surblé and I. Margiolaki, Science, 2005, 309, 2040–2042 CrossRef PubMed.
Footnote |
| † Electronic supplementary information (ESI) available. See https://doi.org/10.1039/d2na00379a |
| This journal is © The Royal Society of Chemistry 2022 |

