 Open Access Article
Creative Commons Attribution 3.0 Unported Licence
Pd single-atom-site stabilized by supported phosphomolybdic acid: design, characterizations and tandem Suzuki–Miyaura cross coupling/nitro hydrogenation reaction†
Jay R.
Patel
and
Anjali U.
Patel
 *
*
Polyoxometalates and Catalysis Laboratory, Department of Chemistry, Faculty of Science. The Maharaja Sayajirao University of Baroda, Vadodara, Gujarat, India. E-mail: anjali.patel-chem@msubaroda.ac.in
First published on 20th September 2022
Abstract
Herein, a single-metal (Pd) site with high surface energy was stabilized and dispersed on a support (zirconia) via a stabilizing agent (phosphomolybdic acid) using a wet chemistry method. HRTEM and HAADF-STEM showed a highly uniform dispersion of Pd SASc on PMA/ZrO2. The Pd SASc showed superior catalytic activity (>99% conversion) for the Suzuki–Miyaura cross-coupling reaction, which was further feasible for catalyzing mechanistically different nitro hydrogenation reactions in tandem fusion under mild reaction conditions. This catalyst showed outstanding activity (100% conversion and 99% selectivity) with a substrate/catalyst ratio of 927 and TON of 918 using a very low amount of Pd (0.94 × 10⁻³ mmol) for the tandem Suzuki–Miyaura cross-coupling/nitro hydrogenation reaction. It also exhibited superior stability and reusability for up to three cycles without any change in its activity.
Introduction
Single-atom site catalysts (SASc)1–4 refer to automatically dispersed single-metal atoms, isolated metal atoms or ions, molecular complexes, and even clusters located discretely on solid supports in the same way, which behave similarly in catalysis. SASc have attracted considerable attention in the frontier heterogeneous catalysis community because of their promising atom utilization efficiency and unique catalytic activity towards the targeted product selectivity, which play a vital role in industrial chemical synthesis.1–6 In addition, SASc have bridged the gap between homogeneous and heterogeneous catalysis by taking inherent advantage of both along with 100% atom utilization, high stability, easy separation from the reaction medium, and recyclability.6–8However, reducing the size of metal nanoparticles down to the single-atomic level enhances their surface energy with high mobility,1,3,9 which leads to agglomeration by particle coalescence or by Ostwald ripening.10,11 Thus, to prevent this, the support or host material must have specific anchoring sites, such as coordinatively unsaturated surface atoms (e.g., O2− and OH−), surface vacancies, and heteroatom dopants (e.g., N, P, S, and halogens),12–14 which can stabilise the catalytic metal centres as individual atoms via physical or chemical methods.6,15 However, to achieve this, physical methods such as mass-selected soft landing,6,16 defect engineering,17 iced-photochemistry,18 atomic layer deposition,19 galvanic replacement,20 high-temperature migration,21 and high-temperature pyrolysis22,23 are not feasible because of their low yield, and they require highly expensive and complex equipment.6 Alternatively, wet-chemistry techniques such as impregnation,24 ion-exchange,25 co-precipitation26 and adsorption methods are more practical to anchor metal atoms on the support via covalent interactions, ionic interactions, or geometric enclosure in small pores12 and avoid their aggregation during the post-treatment processes. In this direction, to date, there are several reports for the successful fabrication of SACs on various supports, such as metal hydroxide/oxides,27–30 graphene,31–34 porous nitrogen-doped carbon,35–40 metal–organic frameworks (MOFs),41–45 and zeolites.46
To this end, metal oxide clusters, particularly polyoxometalates (POMs) have attained considerable attraction in recent years.1,10–12 POMs are well-defined anionic inorganic complexes comprising molecular-level transition metal oxide clusters and synthesised by polymerizing mononuclear oxoanions (metal oxide) via dehydration at lower pH. Keggin-type POMs are a classic example of POMs, consisting of a highly stable 3D-cage-like structure (Fig. 1) with the anionic molecular formula of [XM12O40]n− (X = B, Si, and P; M = Mo and W). They contain PO4 as the central atom surrounded by 12 hexagonal MO6 geometrical units with 6 nonbonding terminal oxygen atoms, resulting in technologically important fascinating physical and chemical properties. Their robust oxoanionic nature, Brønsted acidity, reversible redox behaviour, high stability, and reducing and encapsulating ability make them ideal model systems to explore and learn how to stabilize metal oxide-anchored SASc.
 | ||
| Fig. 1 Different types of surface O atoms and possible anchoring sites for Pd atoms on Keggin-structured anion phosphomolybdic acid. | ||
Based on their structural and chemical diversity, Keggin POMs are mainly divided into two classes for stabilizing SASc.12 Class I-POM-SACs consist of a plenary structure of [(XM12O40)n−] units, which stabilise the single atom outside the shell and possess geometrically predefined positions for an oxo-coordination environment. Class II-POM-SACs are based on a lacunary [(XM12-mO40-m)n−] unit, in which a single atom is stabilised in the lacuna created by removing one or more than one metal-oxo unit from their plenary structure. The class I-stabilized POM-SACs (Fig. 1) contain a single corner site (terminal Ot), bridge site (b/w terminal Ot and bridged Obr), three-fold hollow sites (i.e., b/w three bridge-shared Obr and b/w two bridge-shared Obr and one terminal Ot), and four-fold hollow sites (i.e., b/w four bridge shared Obr and b/w two bridge-shared Obr and two terminal Ot), making these POMs ideal stabilizers for SACs.10,11 However, the most preferable site is expected to be the terminal sites, as reported by Yan's group.10,11
In this direction, for the first time, in 2016, Yan et al. reported the preparation of a phosphomolybdic acid-stabilised platinum1 single-atom catalyst supported on activated carbon with 0.98 wt% loading of Pt and its catalytic efficiency for the hydrogenation of nitrobenzene and cyclohexanone.10 Based on DFT calculations, they also confirmed that the four-fold coordination site is highly favourable for stabilizing Pt SACs. Three years later, in 2019, the same group reported the synthesis of a series of highly dispersed Pt single atoms stabilized by different polyoxometalates (PTA, PMA, STA, and SMA) supported on graphene for the hydrogenation of propene.11 They performed DFT calculations and found that the Pt adsorption energy difference between the different POMs followed the order of Pt1/PTA > Pt1/PMA > Pt1/STA > Pt1/SMA. In 2021, Li et al. reported the diboration of phenylacetylene via a Pt SASc catalyst stabilised by an MOF fabricated using phosphomolybdic acid.1 However, there is no report in the literature on the synthesis and detailed characterization of phosphomolybdic acid-stabilised Pd single-atom site catalysts (SASc). It was also observed from our literature survey that few reports are available on the synthesis of functionalized aminobiphenyl via the tandem Suzuki–Miyaura cross coupling-nitro hydrogenation reaction over Pd-based catalysts. In 2008, for the first time, Wang et al. reported that Pd(OAc)2 catalysed the Suzuki cross-coupling reaction with the simultaneous reduction of the nitro-to amino-group in the presence of K2CO3 and DABCO as the ligand in DMF/H2O solvent at 150 °C and atmospheric pressure.47 Later, in 2011, Sullivan et al. synthesized a mesoporous silicabis(ethylsulfanyl)propane palladium catalyst for hydrogenation and novel one-pot two-step Suzuki cross-coupling followed by hydrogenation at room temperature for 6 h under 10 bar hydrogen pressure.48 In 2014, Mukherjee et al. reported the synthesis of a hydroquinone-based [Pd(H2L)(Cl)2] complex as an efficient room-temperature catalyst for the reduction of nitroarenes in water as the solvent and as a tandem catalyst for Suzuki–Miyaura cross coupling in ethanol followed by the reduction of nitroarenes in one pot using NaBH4 for the hydrogen source at room temperature.49 In the following year (2015), Jain et al. reported the dual role of mannose as a Pd stabilizing ligand during the reaction and hydrogen source for nitro reduction in the tandem cross coupling-nitro reduction reaction under microwave irradiation using a DMF/water system at 130 °C for 60 min.50 In the next year (2016), Pitchumani et al. reported the synthesis of magnetically recyclable Pd cNP/C@Fe3O4 and its catalytic activity was utilised to conduct nitro reduction, Suzuki–Miyaura coupling and sequential reactions.51 For the nitro reduction and sequential reactions after completion of C–C coupling, N2H4·H2O was used as the hydrogen source at 70 °C for 1 h. In 2018, Gabor et al. reported the use of the Fe3O4@Pd/PDA catalyst for Suzuki cross-couplings and tandem Suzuki cross-coupling/catalytic transfer hydrogenation sequences using formic acid as the internal hydrogen source at 80 °C for 1 h.52 However, it is worth noting that these catalysts have several drawbacks, such as use of a high catalyst loading, organic solvents (DMF and IPA), reducing agent (NaBH4 and N2H4·H2O), tedious isolation, and deactivation of the catalyst after regeneration.
Considering the importance of SASc and the tandem Suzuki–Miyaura cross coupling-nitro hydrogenation reaction, herein, for the first time, we report the synthesis of a zirconia-supported phosphomolybdic acid-stabilised Pd-single atom site catalyst using a simple wet chemistry method (Pd-PMA/ZrO2). X-ray photoelectron spectroscopy (XPS) revealed that Pd-PMA/ZrO2 contained Pd(0). HRTEM and dark-field scanning transmission electron microscopy (HAADF-STEM) confirmed the presence of automatically dispersed Pd atoms. Subsequently, the efficiency of this catalyst was evaluated for the Suzuki–Miyaura cross coupling and tandem Suzuki–Miyaura cross coupling-nitro hydrogenation reactions under mild reaction conditions. Furthermore, the influence of various reaction parameters such as catalyst amount, reaction time, temperature, pressure and solvent was studied thoroughly. To validate the stability of the catalyst, it was regenerated and reused for up to three cycles. The regenerated catalyst was characterised using EDX, FT-IR, and XPS and a plausible reaction mechanism for the reactions was also proposed.
Experimental
Materials
All chemicals used were of A.R. grade. Phosphomolybdic acid, zirconium oxychloride, ammonia, palladium chloride, 1-iodo-2-nitrobenzene, phenylboronic acid, and dichloromethane were obtained from Merck and used as received without further purification.Synthesis of catalyst
The zirconia-supported phosphomolybdic acid-stabilized Pd SAC (Pd-PMA/ZrO2) was synthesized via a wet chemistry method in three steps, as shown in Scheme 1. In step 1, hydrous zirconia (ZrO2) was synthesized using the previously reported method by our group.53–55 In step 2, PMA was supported on ZrO2via the incipient wet impregnation method, as previously reported by us.56 In step 3, Pd-exchanged ZrO2-supported phosphomolybdic acid (Pd-PMA/ZrO2) was synthesized by exchanging the available protons of PMA with palladium.53–56 For the reduction of Pd(II) to Pd(0), the resulting wood-brown-colored material was charged in a Parr reactor under ambient conditions. The obtained grey-colored material was designated as Pd-PMA/ZrO2. Similarly using the wet-impregnation method, three other catalysts, i.e., Pd0.2-PMA/ZrO2, Pd0.45-PMA/ZrO2 and Pd1-PMA/ZrO2, were synthesised (where 0.2, 0.45 and 1 represent the wt% of Pd). To determine the role of PMA, one more catalyst, Pd/ZrO2, was also synthesised using the wet impregnation method (for details, refer to the ESI†).Characterization
The characterization of the catalyst was carried out employing EDX, ICP, TGA, FT-IR, 31P MAS NMR, XPS, BET, powder XRD, TEM, HRTEM and HAADF-STEM. The details of the instruments can be found in the ESI.†Catalytic activity
![[thin space (1/6-em)]](https://www.rsc.org/images/entities/char_2009.gif) :
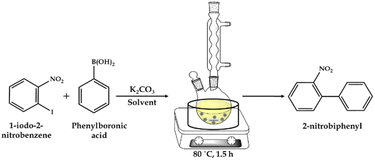
:![[thin space (1/6-em)]](https://www.rsc.org/images/entities/char_2009.gif) H2O as the solvent and catalyst. The reaction was carried out at the appropriate temperature and time with stirring in an oil bath (Scheme 2). After completion of the reaction, the reaction mass was cooled and the organic phase was extracted with dichloromethane. The organic phase was dried with anhydrous magnesium sulfate and analyzed by gas chromatography (Shimadzu-2014) using a capillary column (RTX-5). The products were confirmed by comparison with the standard samples.
H2O as the solvent and catalyst. The reaction was carried out at the appropriate temperature and time with stirring in an oil bath (Scheme 2). After completion of the reaction, the reaction mass was cooled and the organic phase was extracted with dichloromethane. The organic phase was dried with anhydrous magnesium sulfate and analyzed by gas chromatography (Shimadzu-2014) using a capillary column (RTX-5). The products were confirmed by comparison with the standard samples.
![[thin space (1/6-em)]](https://www.rsc.org/images/entities/char_2009.gif) :
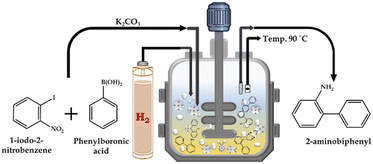
:![[thin space (1/6-em)]](https://www.rsc.org/images/entities/char_2009.gif) H2O as the solvent and catalyst for the SM cross-coupling reaction. After completion of the SM cross-coupling, for the hydrogenation reaction, the presence of air in the unfilled space of the reactor vessel was removed by flushing with H2 gas several times. Finally, an appropriate amount of H2 pressure was applied for the reaction, at the SM cross-coupling reaction temperature with a stirring rate of 500 rpm. The continuous reduction of pressure in the vessel was used to determine the progress of the reaction. After completion, the reaction mixture was cooled to room temperature, and then the H2 pressure was released from the vent valve. A schematic representation of the catalytic methodology is presented in Scheme 3. The organic layer was extracted using dichloromethane, while the catalyst was collected from the liquid phase junction, and finally recovered through centrifugation. The organic phase was dried with anhydrous magnesium sulfate and analyzed by gas chromatography (Shimadzu-2014) using a capillary column (RTX-5). The products were confirmed by comparison with the standard samples.
H2O as the solvent and catalyst for the SM cross-coupling reaction. After completion of the SM cross-coupling, for the hydrogenation reaction, the presence of air in the unfilled space of the reactor vessel was removed by flushing with H2 gas several times. Finally, an appropriate amount of H2 pressure was applied for the reaction, at the SM cross-coupling reaction temperature with a stirring rate of 500 rpm. The continuous reduction of pressure in the vessel was used to determine the progress of the reaction. After completion, the reaction mixture was cooled to room temperature, and then the H2 pressure was released from the vent valve. A schematic representation of the catalytic methodology is presented in Scheme 3. The organic layer was extracted using dichloromethane, while the catalyst was collected from the liquid phase junction, and finally recovered through centrifugation. The organic phase was dried with anhydrous magnesium sulfate and analyzed by gas chromatography (Shimadzu-2014) using a capillary column (RTX-5). The products were confirmed by comparison with the standard samples.
Results and discussion
Characterization
In the synthesized Pd-PMA/ZrO2, the amount of Pd (0.43 wt%) was determined by gravimetric analysis of the standard solution and filtrate.53–55 The EDX elemental mapping of Pd-PMA/ZrO2 (Fig. S1†) showed presence of all the expected elements, i.e., P, Pd, Mo, O, and Zr. The analytical values (Table 1) of Pd and Mo by EDX were found to be 0.45 wt% and 14.01 wt%, respectively, which are in good agreement with the calculated values of Pd (0.43 wt%) and Mo (14.05 wt%). The low % of Pd indicates that only the protons of PMA were exchanged. Table 1 also shows that the obtained EDX values of Pd and Mo in Pd0.2-PMA/ZrO2, Pd0.45-PMA/ZrO2 and Pd1-PMA/ZrO2 are consistent with the theoretical values. It is interesting to note that all the catalysts consist of <1% Pd, which is the first indication of the presence of a Pd single-atom site catalyst.10,11| Catalyst | EDX value (wt%) | Theoretical value (wt%) | ||
|---|---|---|---|---|
| Pd | Mo | Pd | Mo | |
| Pd-PMA/ZrO2 | 0.45 | 14.01 | 0.43 | 14.05 |
| Pd0.2-PMA/ZrO2 | 0.19 | 14.92 | 0.2 | 14.9 |
| Pd0.45-PMA/ZrO2 | 0.44 | 13.9 | 0.45 | 13.9 |
| Pd1-PMA/ZrO2 | 0.99 | 13.49 | 1 | 13.5 |
To support our observation, the SM cross-coupling reaction was carried out using all four synthesised catalysts and the obtained results are presented in Table 2. It can be observed from Table 2 that for all the catalysts (entries 1–4), the % conversion remained the same except for entry 1. This interesting unique observation prompted us to conduct another set of reactions (Table 2) with the same concentration of active Pd (entries 5–7) to achieve the maximum % conversion. The above study clearly indicated the presence of Pd as a single-atom site catalyst (SASc). It was also observed that the minimum amount of active species of 0.09 mg was required for the maximum conversion.
| Entry | Catalyst | Catalyst amount (mg) | Active amount of Pd, mg (mmol) | % Conversion |
|---|---|---|---|---|
a Reaction conditions: catalyst (20 mg, *40 mg, **45 mg and ***9 mg), 1-iodo-2-nitrobenzene (1.96 mmol), phenylboronic acid (2.94 mmol), K2CO3 (3.92 mmol), EtOH![[thin space (1/6-em)]](https://www.rsc.org/images/entities/char_2009.gif) : :![[thin space (1/6-em)]](https://www.rsc.org/images/entities/char_2009.gif) H2O (5 H2O (5![[thin space (1/6-em)]](https://www.rsc.org/images/entities/char_2009.gif) : :![[thin space (1/6-em)]](https://www.rsc.org/images/entities/char_2009.gif) 5 mL), time (2 h), and temp. (90 °C). 5 mL), time (2 h), and temp. (90 °C).
|
||||
| 1 | Pd0.2-PMA/ZrO2 | 20 | 0.04 (0.37 × 10⁻³) | 73 |
| 2 | Pd-PMA/ZrO2 | 20 | 0.09 (0.84 × 10⁻³) | >99 |
| 3 | Pd0.45-PMA/ZrO2 | 20 | 0.10 (0.94 × 10⁻³) | >99 |
| 4 | Pd1-PMA/ZrO2 | 20 | 0.20 (1.87 × 10⁻³) | >99 |
| 5 | *Pd0.2-PMA/ZrO2 | 40 | 0.08 (0.37 × 10⁻³) | 99 |
| 6 | **Pd0.2-PMA/ZrO2 | 45 | 0.08 (0.37 × 10⁻³) | >99 |
| 7 | ***Pd1-PMA/ZrO2 | 9 | 0.09 (0.84 × 10⁻³) | >99 |
It is interesting to note that the catalyst containing 0.45% Pd performed the best irrespective of the synthetic process (ion exchange by socking method or impregnation method). However, considering the reuse of the PdCl2 solution (filtrate), we selected the catalyst (Pd-PMA/ZrO2) synthesised by the ion-exchange method for further detailed characterization and catalytic study. ICP analysis of Pd-PMA/ZrO2 was carried out and the obtained values (0.46 wt% and 14.15 wt% for Pd and Mo, respectively), are in good agreement with that obtained theoretically and from the EDX analysis.
The thermal stability of PMA/ZrO2 and Pd-PMA/ZrO2 was determined using TGA (Fig. S2†). The TGA curve of PMA/ZrO2 shows (Fig. S2†) 5.3% weight loss up to 100 °C, which is attributed to the loss of adsorbed water. Further, it shows 6.4% weight loss up to 300 °C, which corresponds to the loss of crystalline water molecules present in PMA. Subsequently, the absence of further weight loss up to 500 °C indicates the stability of PMA/ZrO2. The TGA of Pd-PMA/ZrO2 showed 9.3% weight loss up to 200 °C, which should be attributed to the loss of adsorbed crystalline water molecules. Besides, no significant weight loss was observed up to 500 °C, indicating the high thermal stability of the catalyst.
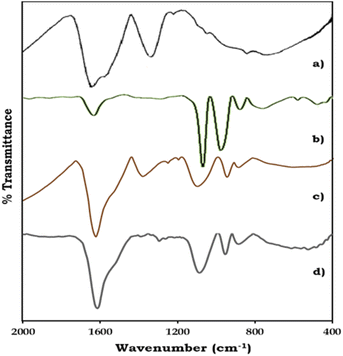
The FT-IR spectra of ZrO2, PMA, PMA/ZrO2, and Pd-PMA/ZrO2 are displayed in Fig. 2. As shown in Fig. 2a, ZrO2 shows bands in the region of 1600 and 1370 cm−1, corresponding to H–O–H and O–H–O bending, respectively, and a broad band at 600 cm−1, corresponding to Zr–O–H bending.53–56 PMA show (Fig. 2b) four characteristic bands of the Keggin unit at 1060, 965, 870 and 790 cm−1, corresponding to the central P–O, terminal Mo![[double bond, length as m-dash]](https://www.rsc.org/images/entities/char_e001.gif) O, and corner-shared and edge-shared Mo–O–Mo stretching, respectively.1,56,57 The FT-IR spectra of PMA/ZrO2 (Fig. 2c) shows all the characteristic bands of PMA at 1063, 965, 870 and 790 cm−1 and ZrO2 at 1605, 1381 and 600 cm−1, without significant change, which indicates the retention of the Keggin unit in the synthesized material.56 The FT-IR spectrum of Pd-PMA/ZrO2 (Fig. 2d) show all the bands corresponding to PMA/ZrO2 (1078, 956, 878, 1605, 1381 and 600 cm−1) with a slight shift, which is attributed to the replacement of the counter cation protons of PMA by Pd. Here, the band corresponding to the Pd–O band (654 cm−1) was not observed, which may be due to its superimposition with the broad band corresponding to Zr–O–H. The obtained spectra confirm that Pd was only exchanged with the proton of PMA. If Pd was in the lacuna, splitting in the P–O band would have been observed. However, since no splitting was observed, Pd did not enter the lacuna.
O, and corner-shared and edge-shared Mo–O–Mo stretching, respectively.1,56,57 The FT-IR spectra of PMA/ZrO2 (Fig. 2c) shows all the characteristic bands of PMA at 1063, 965, 870 and 790 cm−1 and ZrO2 at 1605, 1381 and 600 cm−1, without significant change, which indicates the retention of the Keggin unit in the synthesized material.56 The FT-IR spectrum of Pd-PMA/ZrO2 (Fig. 2d) show all the bands corresponding to PMA/ZrO2 (1078, 956, 878, 1605, 1381 and 600 cm−1) with a slight shift, which is attributed to the replacement of the counter cation protons of PMA by Pd. Here, the band corresponding to the Pd–O band (654 cm−1) was not observed, which may be due to its superimposition with the broad band corresponding to Zr–O–H. The obtained spectra confirm that Pd was only exchanged with the proton of PMA. If Pd was in the lacuna, splitting in the P–O band would have been observed. However, since no splitting was observed, Pd did not enter the lacuna.
31P MAS NMR of PMA, PMA/ZrO2 and Pd-PMA/ZrO2 was carried out to understand the chemical environment around the central phosphorus atom in PMA and the interaction of the anion with support. The 31P NMR spectrum of the pure PMA shows (Fig. 3a) a single intense peak at −3.8 ppm, which is in good agreement with the reported values.57–59 Moreover PMA/ZrO2 showed (Fig. 3b) a slight up-field shift in the peak at −3.8 to −4.1 ppm, which may be due to the strong chemical interaction between the terminal oxygen (Ot) of PMA and surface of ZrO2.56 Furthermore, Pd-PMA/ZrO2 also showed (Fig. 3c) a significant up-field shift in the peak at −4.1 to −5.61 ppm. This is due to the change in the electronic environment of PMA as Pd gets exchanged with the counter proton of PMA/ZrO2, which is good agreement with the reported value.10,11
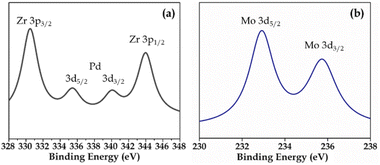
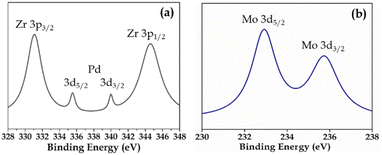
XPS (Fig. S3 and S4†) of Pd-PMA/ZrO2 was carried out to elucidate the oxidation states of Zr, Pd, O and Mo. As shown in Fig. S3,† the two higher binding energy peaks at 331 eV and 345 eV are attributed to Zr3p3/2 and Zr3p1/2, respectively, which confirms that Zr is present in the +4 oxidation state.53–56,60 It also shows (Fig. S3†) a highly intense peak at 532 eV, corresponding to the O 1s spin orbit for the oxygen present in PMA and ZrO2. Fig. 4a displays two peaks at 334.78 eV and 340.16 eV, corresponding to two distinct spin-orbits 3d5/2 and 3d3/2, which are attributed to metallic palladium (Pd0),8,53–55,61 confirming its presence in the synthesised catalyst. Fig. 4b shows two intense peaks at 233 eV and 235 eV, corresponding to the 3d5/2 and 3d3/2 spin-orbits of Mo, respectively,56,57 which confirm that Mo(VI) was reduced during the reduction of Pd(II) to Pd(0).
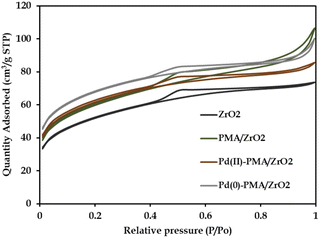
The N2 sorption isotherms of ZrO2, PMA/ZrO2, Pd-PMA/ZrO2 and Pd(0)-PMA/ZrO2 are shown in Fig. 5. The obtained unaltered nature of the N2 adsorption desorption isotherms for ZrO2 and the synthesized catalysts confirms that even after supporting PMA and the reduction of Pd on the surface of ZrO2, their basic structure was retained. The BET surface area of ZrO2 was found to be 170 m2 g−1.53–56 As expected, a significantly higher surface area was obtained in case of PMA/ZrO2 (204 m2 g−1) due to the strong interaction between PMA and ZrO2. However, the slight increase in surface area from 204 to 208 m2 g−1 in the case of Pd(II)-PMA/ZrO2 was due to the exchange of Pd with the available protons of PMA over PMA/ZrO2. Further, the drastic increase in the surface area of Pd(0)-PMA/ZrO2 (from 208 to 228 m2 g−1)53–55 is because of the formation of the palladium SASc.
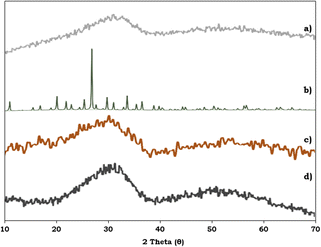
To study the surface morphology of the ZrO2 support, PMA, PMA/ZrO2 and the synthesised Pd-PMA/ZrO2 catalyst, powder XRD was performed and their patterns are shown in Fig. 6. Fig. 6a shows characteristic broad peaks between 25–35°, indicating the amorphous nature of the ZrO2 support.53–56 In contrast, PMA shows (Fig. 6b) characteristic peaks in the 2θ range of 20° to 35°.56,57 The powder XRD pattern of PMA/ZrO2 does not show (Fig. 6c) any characteristics diffraction peaks of PMA, which indicates that PMA is highly dispersed in a non-crystalline form on ZrO2.56 The XRD pattern of Pd-PMA/ZrO2 (Fig. 6d) does not show any corresponding characteristic planes of Pd and is similar to that of PMA/ZrO2. The obtained results suggest that the amount of Pd (0.45 wt%) is beyond the detection limit of powder XRD due to its high degree of dispersion,10,11,62 which was further confirmed by the HRTEM and HAADF-STEM images.
The transmission electron microscopy (TEM) images of Pd/ZrO2, PMA/ZrO2 and Pd-PMA/ZrO2 at different magnifications are shown in Fig. 7. As expected, PMA/ZrO2 shows (Fig. S4†) a high dispersion of PMA on ZrO2 without agglomeration. In contrast, the TEM images of Pd/ZrO2 show (Fig. S5†) metallic Pd(0) nanoparticles with agglomeration. In the case of Pd-PMA/ZrO2, neither Pd nanoparticles nor nanoclusters can be seen in its TEM images (Fig. 7a–c). According to the EDX and ICP results, it was shown that 0.45 wt% of Pd was loaded in the synthesised catalyst, which suggests that the size of the Pd particles is beyond the detection limit of TEM.10,11 The high-resolution transmission electron microscopy (HR-TEM) images of Pd in Pd-PMA/ZrO2 (Fig. 7d–f) show a distinct lattice fringe spacing of 0.226 nm, which matches the inter planar spacing (crystallographic plane) (111) generated from the fast Fourier transform pattern of the crystal lattices produced at the diffraction spots in the horizontal direction to the alignment of the fringes.61,63
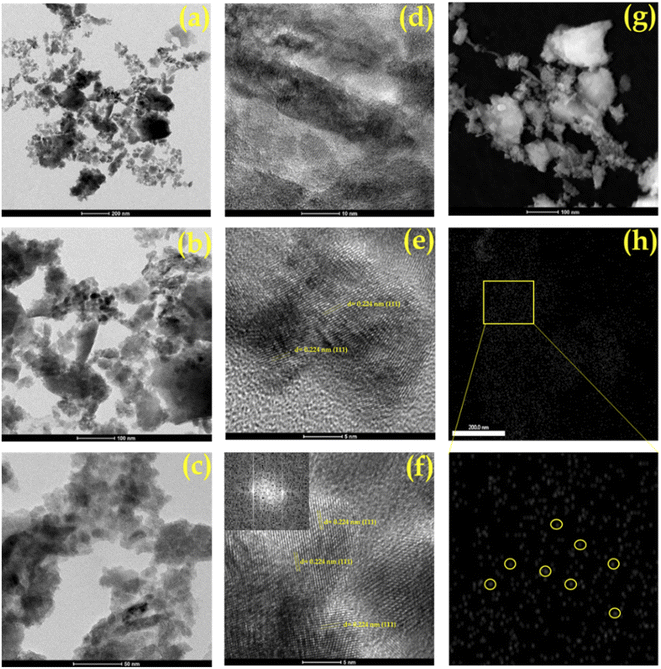 | ||
| Fig. 7 (a–c) TEM images, (d–f) HRTEM images and (g) HAADF STEM of Pd-PMA/ZrO2 and (h) elemental mapping of Pd. | ||
To verify the presence of atomically dispersed palladium single atoms, aberration-corrected high-angle annular dark-field scanning transmission electron microscopy (AC HAADF-STEM) with coupled EDX analysis measurements were performed (Fig. 7g, h and S6†). The HAADF-STEM images (Fig. 7g) show a homogeneous dispersion of Pd SACs on the surface of PMA/ZrO2.
Similarly, the EDX elemental mapping of Pd (Fig. 7h) clearly shows the presence of highly dispersed isolated Pd SACs without any aggregation to form nanoparticles or nano-clusters. Furthermore, the elemental overlapping images (Fig. S6†) indicate that the agglomeration of the high free surface energy Pd SACs was efficiently prevented by the electrostatic repulsive interactions derived from the PMA anions and their high surface area.
Catalytic activity
The catalyst amount was varied from 5 mg to 25 mg and the obtained results (Fig. 8) indicate that the % conversion increased with an increase in the catalyst amount up to 20 mg because the number of Pd active site increases with respect to the substrate concentration. On further increasing the catalyst amount up to 25 mg, the % conversion remained unaltered. We assumed that the synthesised catalyst is a single atom site, and thus to confirm this, we performed an experiment to achieve maximum conversion by keeping the amount of catalyst the same (5, 10 and 15 mg) and varying the reaction time. The obtained results are shown in Table 3. It can be seen that 99% conversion was achieved on increasing the time up to 5, 4, and 3 h against each catalyst amount (5, 10 and 15 mg), which previously gave 15%, 21% and 45% conversion, respectively. Based on the obtained results, 20 mg of catalyst was employed for further optimization studies.
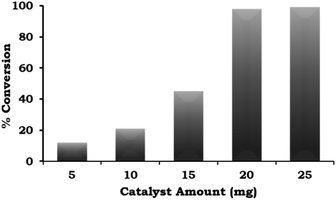 | ||
Fig. 8 Effect of catalyst amount. Reaction conditions: 1-iodo-2-nitrobenzene (1.96 mmol), phenylboronic acid (2.94 mmol), K2CO3 (3.92 mmol), EtOH![[thin space (1/6-em)]](https://www.rsc.org/images/entities/char_2009.gif) : :![[thin space (1/6-em)]](https://www.rsc.org/images/entities/char_2009.gif) H2O (5 H2O (5![[thin space (1/6-em)]](https://www.rsc.org/images/entities/char_2009.gif) : :![[thin space (1/6-em)]](https://www.rsc.org/images/entities/char_2009.gif) 5 mL), time (2 h), and temp. (90 °C). 5 mL), time (2 h), and temp. (90 °C). | ||
| Catalyst | Catalyst amount | Time | % Conversion |
|---|---|---|---|
a Reaction conditions: 1-iodo-2-nitrobenzene (1.96 mmol), phenylboronic acid (2.94 mmol), K2CO3 (3.92 mmol), EtOH![[thin space (1/6-em)]](https://www.rsc.org/images/entities/char_2009.gif) : :![[thin space (1/6-em)]](https://www.rsc.org/images/entities/char_2009.gif) H2O (5 H2O (5![[thin space (1/6-em)]](https://www.rsc.org/images/entities/char_2009.gif) : :![[thin space (1/6-em)]](https://www.rsc.org/images/entities/char_2009.gif) 5 mL), and temp. (90 °C). 5 mL), and temp. (90 °C).
|
|||
| Pd-PMA/ZrO2 | 5 | 5 | >99 |
| 10 | 4 | >99 | |
| 15 | 3 | >99 | |
It is well known that the solubility of the reactant plays a crucial role in the progression of a reaction, and hence different solvents were explored while keeping the other parameters constant. As shown in Table 4, neat organic solvents such as acetonitrile, toluene, DMF and H2O showed negligible conversion (15%, 6%, 1% and 15%, respectively) compared to EtOH (52%). Further, to observe the on-water effect64 on the % conversion, the reaction was carried out in biphasic solvent systems due to their advantages, as follows: (i) aqueous water basic phase consisting ionized phenyl boronic acid and (ii) aqueous-organic phase with a lower pH-containing organic component (1-iodo-2-nitrobenzene). The SM cross-coupling reaction does not occur at the water-organic interphase, neither in water nor in the organic phase. It can be observed from the table that the reactions carried out with toluene![[thin space (1/6-em)]](https://www.rsc.org/images/entities/char_2009.gif) :
:![[thin space (1/6-em)]](https://www.rsc.org/images/entities/char_2009.gif) H2O and DMF
H2O and DMF![[thin space (1/6-em)]](https://www.rsc.org/images/entities/char_2009.gif) :
:![[thin space (1/6-em)]](https://www.rsc.org/images/entities/char_2009.gif) H2O solvent systems gave a negligible increase in the % conversion (24% and 5%, respectively). However, when the reaction was carried out with the acetonitrile
H2O solvent systems gave a negligible increase in the % conversion (24% and 5%, respectively). However, when the reaction was carried out with the acetonitrile![[thin space (1/6-em)]](https://www.rsc.org/images/entities/char_2009.gif) :
:![[thin space (1/6-em)]](https://www.rsc.org/images/entities/char_2009.gif) H2O and EtOH
H2O and EtOH![[thin space (1/6-em)]](https://www.rsc.org/images/entities/char_2009.gif) :
:![[thin space (1/6-em)]](https://www.rsc.org/images/entities/char_2009.gif) H2O solvent systems, they gave 98% and 99% conversion, respectively. Thus, based on the obtained results, the environmentally green solvent system (EtOH
H2O solvent systems, they gave 98% and 99% conversion, respectively. Thus, based on the obtained results, the environmentally green solvent system (EtOH![[thin space (1/6-em)]](https://www.rsc.org/images/entities/char_2009.gif) :
:![[thin space (1/6-em)]](https://www.rsc.org/images/entities/char_2009.gif) H2O) was selected for further study.
H2O) was selected for further study.
| Solvent name | Solvent amount (mL) | % Conversion |
|---|---|---|
| a Reaction condition: 1-iodo-2-nitrobenzene (1.96 mmol), phenylboronic acid (2.94 mmol), catalyst amount (20 mg), K2CO3 (3.92 mmol), time (2 h) and temp. (90 °C). | ||
| Acetonitrile | 10 | 15 |
| Toluene | 10 | 6 |
| DMF | 10 | 1 |
| Ethanol | 10 | 58 |
| H2O | 10 | 15 |
Acetonitrile![[thin space (1/6-em)]](https://www.rsc.org/images/entities/char_2009.gif) : :![[thin space (1/6-em)]](https://www.rsc.org/images/entities/char_2009.gif) H2O H2O |
5![[thin space (1/6-em)]](https://www.rsc.org/images/entities/char_2009.gif) : :![[thin space (1/6-em)]](https://www.rsc.org/images/entities/char_2009.gif) 5 5 |
94 |
Toluene![[thin space (1/6-em)]](https://www.rsc.org/images/entities/char_2009.gif) : :![[thin space (1/6-em)]](https://www.rsc.org/images/entities/char_2009.gif) H2O H2O |
5![[thin space (1/6-em)]](https://www.rsc.org/images/entities/char_2009.gif) : :![[thin space (1/6-em)]](https://www.rsc.org/images/entities/char_2009.gif) 5 5 |
24 |
DMF![[thin space (1/6-em)]](https://www.rsc.org/images/entities/char_2009.gif) : :![[thin space (1/6-em)]](https://www.rsc.org/images/entities/char_2009.gif) H2O H2O |
5![[thin space (1/6-em)]](https://www.rsc.org/images/entities/char_2009.gif) : :![[thin space (1/6-em)]](https://www.rsc.org/images/entities/char_2009.gif) 5 5 |
5 |
EtOH![[thin space (1/6-em)]](https://www.rsc.org/images/entities/char_2009.gif) : :![[thin space (1/6-em)]](https://www.rsc.org/images/entities/char_2009.gif) H2O H2O |
5![[thin space (1/6-em)]](https://www.rsc.org/images/entities/char_2009.gif) : :![[thin space (1/6-em)]](https://www.rsc.org/images/entities/char_2009.gif) 5 5 |
>99 |
The effect of the EtOH![[thin space (1/6-em)]](https://www.rsc.org/images/entities/char_2009.gif) :
:![[thin space (1/6-em)]](https://www.rsc.org/images/entities/char_2009.gif) H2O ratio was also studied and the obtained results are presented in Fig. 9. According to the results, on changing the solvent system from neat ethanol to EtOH
H2O ratio was also studied and the obtained results are presented in Fig. 9. According to the results, on changing the solvent system from neat ethanol to EtOH![[thin space (1/6-em)]](https://www.rsc.org/images/entities/char_2009.gif) :
:![[thin space (1/6-em)]](https://www.rsc.org/images/entities/char_2009.gif) H2O in different ratios (7
H2O in different ratios (7![[thin space (1/6-em)]](https://www.rsc.org/images/entities/char_2009.gif) :
:![[thin space (1/6-em)]](https://www.rsc.org/images/entities/char_2009.gif) 3 mL and 5
3 mL and 5![[thin space (1/6-em)]](https://www.rsc.org/images/entities/char_2009.gif) :
:![[thin space (1/6-em)]](https://www.rsc.org/images/entities/char_2009.gif) 5 mL), there was an increase in the % conversion. This trend was observed because of the increased solubility of the base in water. However, on further changing the EtOH
5 mL), there was an increase in the % conversion. This trend was observed because of the increased solubility of the base in water. However, on further changing the EtOH![[thin space (1/6-em)]](https://www.rsc.org/images/entities/char_2009.gif) :
:![[thin space (1/6-em)]](https://www.rsc.org/images/entities/char_2009.gif) H2O ratio (3
H2O ratio (3![[thin space (1/6-em)]](https://www.rsc.org/images/entities/char_2009.gif) :
:![[thin space (1/6-em)]](https://www.rsc.org/images/entities/char_2009.gif) 7 mL), the % conversion decreased and very low conversion was observed in neat H2O because of the poor solubility of the organic substrates.
7 mL), the % conversion decreased and very low conversion was observed in neat H2O because of the poor solubility of the organic substrates.
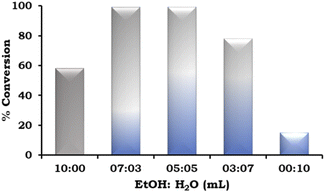 | ||
Fig. 9 Effect of EtOH![[thin space (1/6-em)]](https://www.rsc.org/images/entities/char_2009.gif) : :![[thin space (1/6-em)]](https://www.rsc.org/images/entities/char_2009.gif) H2O. Reaction condition: 1-iodo-2-nitrobenzene (1.96 mmol), phenylboronic acid (2.94 mmol), catalyst amount (20 mg), K2CO3 (3.92 mmol), time (2 h) and temp. (90 °C). H2O. Reaction condition: 1-iodo-2-nitrobenzene (1.96 mmol), phenylboronic acid (2.94 mmol), catalyst amount (20 mg), K2CO3 (3.92 mmol), time (2 h) and temp. (90 °C). | ||
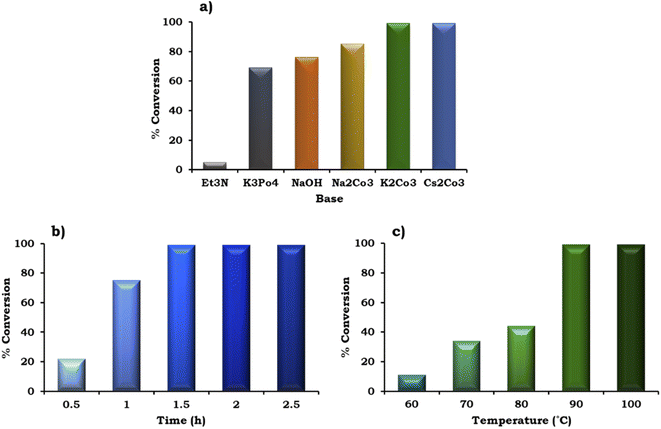
The effect of various organic–inorganic bases on the reaction rate was also studied and the obtained results are shown in Fig. 10a. This study indicated that the organic base triethyl amine (Et3N) gave negligible conversion (5%) compared to the inorganic bases. With the use of different inorganic bases, the % conversation was found to follow the order of K3PO4 (69%) < NaOH (76%) < Na2CO3 (85%) < K2CO3 ≈ Cs2CO3 (99%). The highest conversion (99%) was obtained with K2CO3 and Cs2CO3, but for further studies we have selected K2CO3 because it is environmentally benign compared to Cs2CO3.
To achieve the highest conversion, the influence of the reaction time was also monitored and the obtained results are shown in Fig. 10b. It can be seen that with an increase in time from 0.5 h to 1.5 h, at an interval of 30 min, the % conversion increased gradually, which is in good agreement with the well-known fact that with an increase in time, there is an increase in the formation of reactive intermediates from the reactants, which results in the formation of the product. Further, on prolonging the time up to 2 h, no significant change was observed in the % conversion. Therefore, 1.5 h was considered optimal with 98% conversion for the further optimization of temperature.
The effect of temperature on the formation of the C–C bond between 1-iodo-2-nitrobenzene and phenylboronic acid was also investigated for the best catalytic performance at an interval of 10 °C in the range of 90–60 °C. As shown in Fig. 10c, on increasing the temperature, % conversion increased gradually up to 90 °C. Based on this, 90 °C temperature was considered optimal to achieve 99% conversion.
Based on this study, the optimized conditions for 99% conversion with a TON of 2294 and TOF of 1529 are as follows: 1-iodo-2-nitrobenzene (1.96 mmol), phenylboronic acid (2.94 mmol), catalyst (20 mg, active amount of Pd: 0.09 mg), EtOH![[thin space (1/6-em)]](https://www.rsc.org/images/entities/char_2009.gif) :
:![[thin space (1/6-em)]](https://www.rsc.org/images/entities/char_2009.gif) H2O (5
H2O (5![[thin space (1/6-em)]](https://www.rsc.org/images/entities/char_2009.gif) :
:![[thin space (1/6-em)]](https://www.rsc.org/images/entities/char_2009.gif) 5 mL), K2CO3 (3.92 mmol), 1.5 h, 90 °C with substrate ratio/catalyst of 2317/1.
5 mL), K2CO3 (3.92 mmol), 1.5 h, 90 °C with substrate ratio/catalyst of 2317/1.
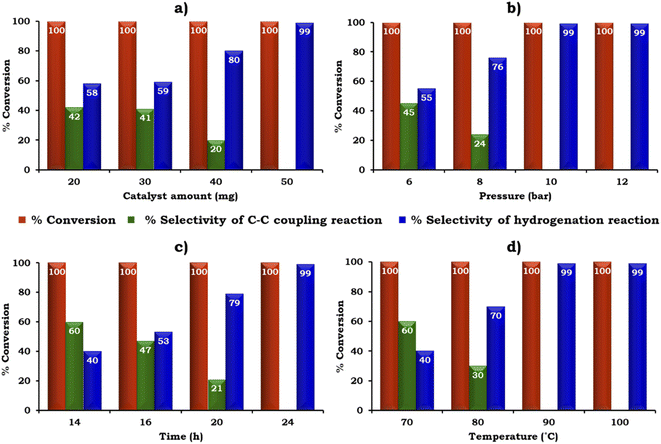
The catalyst amount was screened from 20 to 50 mg to achieve the maximum conversion and selectivity for the hydrogenated product, 2-aminobiphenyl, as shown in Fig. 11a. The obtained results showed that 100% conversion was achieved with 20 mg but the selectivity for 2-aminobiphenyl was only 58%. The low selectivity for 2-aminobiphenyl obtained may be due to the difficulty in approaching the NO2 group of 2-nitrobiphenyl by Pd or due to the conformation of two phenyl rings. Further, on increasing the amount of catalyst to 50 mg, 100% conversion was obtained and the selectivity for 2-aminobiphenyl gradually increased because a higher amount of Pd was available to react with the reactant species. Therefore, 50 mg of catalyst was considered optimal for further studies.
The influence of H2 pressure plays an important role in the catalytic transfer hydrogenation reaction. Therefore, the effect of H2 pressure was also studied and the obtained results are shown in Fig. 11b. It can be seen that the selectivity for the hydrogenated product increased gradually on increasing the pressure from 6 to 10 bar. Based on the results, 10 bar pressure was optimal to achieve 100% conversion with 99% selectivity for 2-aminobiphenyl.
Similarly, the effect of time and temperature on the reaction rate was also investigated to achieve the maximum conversion with selectivity for 2-aminobiphenyl and the obtained data is shown in Fig. 11c and d. Based on this study, the optimized conditions for 100% conversion with 99% selectivity for 2-aminobiphenyl are as follows: iodobenzene (1.96 mmol), phenylboronic acid (2.94 mmol), catalyst (50 mg, active amount of Pd: 0.225 mg), K2CO3 (2.96 mmol), EtOH![[thin space (1/6-em)]](https://www.rsc.org/images/entities/char_2009.gif) :
:![[thin space (1/6-em)]](https://www.rsc.org/images/entities/char_2009.gif) H2O (5
H2O (5![[thin space (1/6-em)]](https://www.rsc.org/images/entities/char_2009.gif) :
:![[thin space (1/6-em)]](https://www.rsc.org/images/entities/char_2009.gif) 5 mL), pressure (10 bar), time (24 h) and temp (90 °C) with TON (918), TOF (38) and substrate ratio/catalyst (927).
5 mL), pressure (10 bar), time (24 h) and temp (90 °C) with TON (918), TOF (38) and substrate ratio/catalyst (927).
Control experiment
To understand the role of each component in the synthesised material, control experiments were carried out with ZrO2, PMA, PMA/ZrO2, PdCl2, Pd/ZrO2 and Pd-PMA/ZrO2 under the optimized conditions for the SM cross-coupling and tandem Suzuki–Miyaura cross-coupling/nitro hydrogenation reactions. As shown in Table 5, ZrO2, PMA and PMA/ZrO2 are inactive towards both reactions, further confirming that PMA acts as a stabilizing agent for Pd, as we already mentioned in the introduction. However, we obtained almost same the % conversion and selectivity for both reactions when they were carried out with PdCl2 and Pd/ZrO2 having same active amount of Pd. Thus, the obtained results confirm that Pd is the only active reactive species for the progress of the reaction.| Catalyst | % Conversiona | % Conversionb | % Selectivity | |
|---|---|---|---|---|
| C–C coupling | NO2 hydrogenation | |||
a For SM cross-coupling reaction: 1-iodo-2-nitrobenzene (1.96 mmol), phenylboronic acid (2.94 mmol), catalyst (ZrO2; 15.38 mg, PMA; 4.62 mg, PMA/ZO2; 19.1 mg), EtOH![[thin space (1/6-em)]](https://www.rsc.org/images/entities/char_2009.gif) : :![[thin space (1/6-em)]](https://www.rsc.org/images/entities/char_2009.gif) H2O (5 H2O (5![[thin space (1/6-em)]](https://www.rsc.org/images/entities/char_2009.gif) : :![[thin space (1/6-em)]](https://www.rsc.org/images/entities/char_2009.gif) 5 mL), K2CO3 (3.96 mmol), time (1.5 h) and temp. (90 °C).
b For Tandem reaction: 1-iodo-2-nitrobenzene (1.96 mmol), phenylboronic acid (2.94 mmol), catalyst (ZrO2; 38.45 mg, PMA; 11.5 mg, PMA/ZO2; 47.75 mg), EtOH 5 mL), K2CO3 (3.96 mmol), time (1.5 h) and temp. (90 °C).
b For Tandem reaction: 1-iodo-2-nitrobenzene (1.96 mmol), phenylboronic acid (2.94 mmol), catalyst (ZrO2; 38.45 mg, PMA; 11.5 mg, PMA/ZO2; 47.75 mg), EtOH![[thin space (1/6-em)]](https://www.rsc.org/images/entities/char_2009.gif) : :![[thin space (1/6-em)]](https://www.rsc.org/images/entities/char_2009.gif) H2O (5 H2O (5![[thin space (1/6-em)]](https://www.rsc.org/images/entities/char_2009.gif) : :![[thin space (1/6-em)]](https://www.rsc.org/images/entities/char_2009.gif) 5 mL), K2CO3 (3.96 mmol), pressure (10 bar), time (24 h) and temp. (90 °C). 5 mL), K2CO3 (3.96 mmol), pressure (10 bar), time (24 h) and temp. (90 °C).
|
||||
| ZrO2 | NA | NA | NA | NA |
| PMA | NA | NA | NA | NA |
| PMA/ZrO2 | NA | NA | NA | NA |
| PdCl2 | 92 | 100 | 4 | 96 |
| Pd/ZrO2 | 96 | 100 | 7 | 93 |
| Pd-PMA/ZrO2 | >99 | 100 | NA | 99 |
Hot filtration and heterogeneity test
In heterogeneous catalysis, one of the basic requirements is that the catalyst should retain its heterogeneity for several cycles with its active sites remaining intact. Thus, to check the leaching of Pd from Pd-PMA/ZrO2 and Pd/ZrO2 in both reactions, a hot filtration test was carried out. In the case of the SM cross-coupling reaction, initially, the reaction was performed for up to 45 min with Pd-PMA/ZrO2 and Pd/ZrO2, and afterward both catalysts were removed from the hot reaction mass and the reaction was left to further proceed for 45 min (total 90 min). Similarly, the tandem Suzuki–Miyaura cross-coupling/nitro hydrogenation reaction was carried out using both catalysts for up to 16 h. Subsequently, both catalysts were removed and the reaction was continued for up to 24 h (another 8 h). After completion of the reactions, the organic layer was extracted using dichloromethane and analysed by gas chromatography.In the case of Pd/ZrO2, the obtained results (Table 6) show an increase in conversion by 8% in the SM cross-coupling reaction after removal of the catalyst. In contrast, in the one-pot reaction, no change in % conversion was observed, but a 6% increase in selectivity for NO2 hydrogenation after removal of catalyst was observed. The obtained results from both the reactions indicate that Pd leached from the support during the reaction. However, Pd-PMA/ZrO2 showed no change in % conversion after the removal of the catalyst in both reactions, which confirms that the Pd single atom does not leach during the reaction. Further the heterogeneity of Pd-PMA/ZrO2 was confirmed by EDX analysis of the regenerated catalyst. The retention of the Pd content (0.45 wt%) indicated that the Pd SACs was stabilized by PMA over the surface of ZrO2. Thus, the obtained results confirm the true heterogeneous nature of the catalyst, which was also reflected in the recycling study.
| Catalyst | % Conversiona | % Conversionb | % Selectivity | |
|---|---|---|---|---|
| C–C coupling | NO2 hydrogenation | |||
a For the SM cross-coupling reaction: 1-iodo-2-nitrobenzene (1.96 mmol), phenylboronic acid (2.94 mmol), catalyst (20 mg), EtOH![[thin space (1/6-em)]](https://www.rsc.org/images/entities/char_2009.gif) : :![[thin space (1/6-em)]](https://www.rsc.org/images/entities/char_2009.gif) H2O (5 H2O (5![[thin space (1/6-em)]](https://www.rsc.org/images/entities/char_2009.gif) : :![[thin space (1/6-em)]](https://www.rsc.org/images/entities/char_2009.gif) 5 mL), K2CO3 (3.96 mmol), time (1.5 h) and temp. (90 °C).
b For tandem reaction: 1-iodo-2-nitrobenzene (1.96 mmol), phenylboronic acid (2.94 mmol), catalyst (50 mg), K2CO3 (3.96 mmol), EtOH 5 mL), K2CO3 (3.96 mmol), time (1.5 h) and temp. (90 °C).
b For tandem reaction: 1-iodo-2-nitrobenzene (1.96 mmol), phenylboronic acid (2.94 mmol), catalyst (50 mg), K2CO3 (3.96 mmol), EtOH![[thin space (1/6-em)]](https://www.rsc.org/images/entities/char_2009.gif) : :![[thin space (1/6-em)]](https://www.rsc.org/images/entities/char_2009.gif) H2O (5 H2O (5![[thin space (1/6-em)]](https://www.rsc.org/images/entities/char_2009.gif) : :![[thin space (1/6-em)]](https://www.rsc.org/images/entities/char_2009.gif) 5 mL), pressure (10 bar), time (24 h) and temp. (90 °C). 5 mL), pressure (10 bar), time (24 h) and temp. (90 °C).
|
||||
| Pd/ZrO2 | 43 (after 1 h) | 100 (after 16 h) | 41 | 59 |
| 51 (after 2 h) | 100 (after 24 h) | 36 | 64 | |
| Pd-PMA/ZrO2 | 51 (after 1 h) | 100 (after 16 h) | 46 | 56 |
| 52 (after 2 h) | 100 (after 24 h) | 46 | 56 | |
Catalyst reusability
For any chemical process, the sustainability of the catalyst up to several cycles is one of the key issues. Thus, after completion of the reaction, Pd-PMA/ZrO2 was regenerated for both reactions through centrifugation and washed with dichloromethane followed by water, and finally air dried for its reuse for the next catalytic run. As shown in Table 7, consistent catalytic activity occurred for up to three cycles for both reactions and the catalyst could be reused for further cycles, which depends on the choice of the chemist. This clearly shows that the synthesised catalyst is truly heterogeneous in nature.| Catalyst | % Conversiona | % Conversionb | % Selectivity | |
|---|---|---|---|---|
| C–C coupling | NO2 hydrogenation | |||
a For SM cross-coupling reaction: 1-iodo-2-nitrobenzene (1.96 mmol), phenylboronic acid (2.94 mmol), catalyst (20 mg), K2CO3 (3.96 mmol), EtOH![[thin space (1/6-em)]](https://www.rsc.org/images/entities/char_2009.gif) : :![[thin space (1/6-em)]](https://www.rsc.org/images/entities/char_2009.gif) H2O (5 H2O (5![[thin space (1/6-em)]](https://www.rsc.org/images/entities/char_2009.gif) : :![[thin space (1/6-em)]](https://www.rsc.org/images/entities/char_2009.gif) 5 mL), time (1.5 h) and temp. (90 °C).
b For tandem reaction: 1-iodo-2-nitrobenzene (1.96 mmol), phenylboronic acid (2.94 mmol), catalyst (50 mg), K2CO3 (3.96 mmol), EtOH 5 mL), time (1.5 h) and temp. (90 °C).
b For tandem reaction: 1-iodo-2-nitrobenzene (1.96 mmol), phenylboronic acid (2.94 mmol), catalyst (50 mg), K2CO3 (3.96 mmol), EtOH![[thin space (1/6-em)]](https://www.rsc.org/images/entities/char_2009.gif) : :![[thin space (1/6-em)]](https://www.rsc.org/images/entities/char_2009.gif) H2O (5 H2O (5![[thin space (1/6-em)]](https://www.rsc.org/images/entities/char_2009.gif) : :![[thin space (1/6-em)]](https://www.rsc.org/images/entities/char_2009.gif) 5 mL), pressure (10 bar), time (24 h) and temp. (90 °C). 5 mL), pressure (10 bar), time (24 h) and temp. (90 °C).
|
||||
| Fresh | >99 | 100 | NA | 99 |
| R-1 | 99 | 100 | NA | 99 |
| R-2 | 99 | 100 | NA | 99 |
| R-3 | 99 | 100 | 2 | 98 |
Characterization of regenerated catalyst
To check sustainability of the catalyst, the regenerated catalyst (R-Pd-PMA/ZrO2) was characterised by EDX, FT-IR, XPS and powder XRD.Elemental mapping (Fig. S7†) confirmed the presence of all the elements. The EDX values of Pd (0.44 wt%) and Mo (15.08 wt%) for regenerated Pd-PMA/ZrO2 are in good agreement with that of the fresh catalyst (0.72 wt% Pd and 15.19 wt% Mo), which confirms that there was no leaching of the Pd atoms from the catalyst during the reaction. The FT-IR spectra of the regenerated and fresh catalysts are displayed in Fig. S8,† which are almost identical without any significant shift in the bands. This indicates the retention of the catalyst structure even after regeneration of the catalyst. However, the regenerated catalyst showed bands with a slightly lower intensity compared to that of the fresh catalyst, which may be due to the sticking of the substrates on the catalyst, but it had no effect on its efficiency. Fig. 12 shows the XPS of the regenerated catalyst (R-Pd-PMA/ZrO2). It consist of all the characteristic peaks of Pd, Mo, Zr and O, which are identical to that obtained for the fresh catalyst (Fig. 4). This further confirms no reduction of Mo(VI) occurred and the retention of the active Pd SACs on the catalyst surface, thus confirming the sustainability of this catalyst. The recycled catalyst (R-Pd-PMA/ZrO2) showed a similar powder XRD pattern to that of the fresh catalyst (Fig. S9†). The obtained results show the retention of the highly dispersed nature of the catalyst, which further confirms the sustainability of this catalyst.
Mechanism
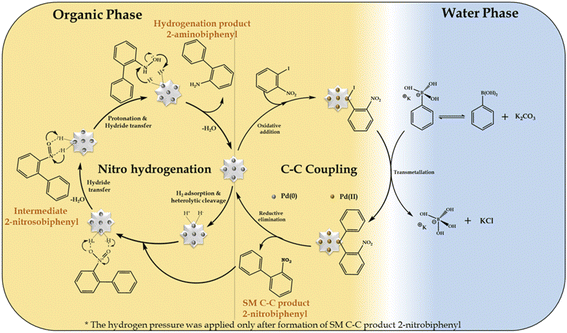
In the present work, we propose that the well-reported mechanism (Scheme 4) occurs for two mechanistically different catalytic transformation reactions, as follows: (i) SM C–C54,65 and (ii) nitro hydrogenation.66 The SM C–C reaction involves oxidative addition, transmetallation and reductive elimination, while in the case of the nitro hydrogenation reaction, we propose the universal hydride transfer via the heterolytic cleavage of H2.In the case of the reaction, as mentioned for the “on-water” effect on SM C–C, organopalladium(II) species is formed in the organic phase via the oxidative addition of the Pd SAC atom with 1-iodo-2-nitrobenzene. Alternatively, in the water phase, a boronate complex is formed by the ionization of phenyl boronic acid in a higher basic water phase (formed by K2CO3). Afterwards, at the water-organic interphase, the organopalladium species undergo transmetallation with the boronate complex to produce a new organopalladium complex by replacing the phenyl ring of phenylboronic acid with the halides of the organopalladium species. Finally, the product (2-nitrobiphenyl) is formed and Pd(O) SACs are regenerated for further hydrogenation reaction. For the hydrogenation reaction after applying H2 pressure, initially, hydrogen gets adsorbed on the Pd atom to form Pd–H by heterolytic cleavage of H2, followed by the adsorption of 2-nitrobiphenyl on the Pd–H surface of the catalyst by electrostatic interactions to form an anionic N,N-dihydroxylamine via hydride transfer. This is followed by protonation to yield an N,N-dihydroxylamine intermediate by eliminating a water molecule, which gets dehydrated to generate 2-nitrosobiphenyl. The nitroso group in 2-nitrosobiphenyl is further attacked by the hydride of Pd–H and protonated to yield N-hydroxylamine, which is further protonated, followed by hydride transfer to form 2-aminobiphenyl and the catalyst is regenerated for the next catalytic cycle.
Further, for the nitro hydrogenation reaction step, to confirm the formation of nitroso intermediates, a set of reactions was performed after the completion of the SM C–C reaction, where H2 pressure was applied for 2, 6 and 10 h and the obtained reaction mass was analysed by GC. The results showed 100% conversion with only 2%, 11% and 21% selectivity for 2-aminobiphenyl in 2, 6 and 10 h, respectively, and no other peak corresponding to 2-nitrosobiphenyl was found. This indicates that the formed 2-nitrosobiphenyl intermediate is unstable and difficult to isolate. To further confirm this, reaction mass obtained after 10 h was analysed by 1H NMR and the spectra show peaks corresponding to 2-nitrobiphenyl (Fig. S10†) and 2-aminobiphenyl (Fig. S11†) but no peak corresponding to 2-nitrosobiphenyl (Fig. S12†). The absence of a peak corresponding to nitroso intermediate shows that the intermediate is unstable and is immediately converted to an amine. If not, some additional peaks should be observed in the NMR spectra. Thus, this study clearly indicates that the intermediate is highly unstable, and hence difficult to isolate from the reaction mixture.
Conclusions
In the summary, the results of this work emphasized the successful development of a novel simple strategy for the fabrication of Pd SASc stabilized by phosphomolybdic acid supported on zirconia (Pd-PMA/ZrO2) by an ion-exchange method. A thorough systematic characterization was carried out via FT-IR spectroscopy, 31P MAS NMR, BET, and powder XRD, which confirmed that Pd exchanged only with the available protons of PMA/ZrO2 with the retention of its basic structure. The metallic state of Pd was confirmed by XPS and the presence of Pd SASc was revealed by HRTEM and HAADF-STEM analysis. The synthesised catalyst exhibited outstanding catalytic activity (100% conversion and 99% selectivity for 2-aminobyhenyl) in the tandem Suzuki–Miyaura cross-coupling/nitro hydrogenation reaction under mild reaction conditions using an ethanol–water biphasic system. The control experiment and hot filtration test confirmed the role of PMA in stabilising the Pd SASc, without aggregation. We also believe that the designed strategy can be extended for the design of other precious metal-based single-atom site catalysts for various organic transformations.Author contributions
Jay Patel: methodology, validation, formal analysis, investigation, writing – original draft. Anjali Patel: conceptualization, validation, writing – review & editing, visualization, supervision.Conflicts of interest
There are no conflicts to declare.Acknowledgements
JP and AP are thankful to Science and Engineering Research Board (SERB), Project No. EMR/2016/005718, New Delhi for the financial support. We are thankful to the DST-FIST, Department of chemistry, The Maharaja Sayajirao University of Baroda for BET surface area analysis. We are thankful to Rubamin Limited, Halol for the ICP analysis.Notes and references
- Y. Liu, X. Wu, Z. Li, J. Zhang, S. Liu, S. Liu, L. Gu, L. R. Zheng, J. Li, D. Wang and Y. Li, Nat. Commun., 2021, 12, 4205 CrossRef CAS PubMed.
- N. Zhang, C. Ye, H. Yan, L. Li, H. He, D. Wang and Y. Li, Nano Res., 2020, 13, 3165–3182 CrossRef CAS.
- C. Gao, J. Low, R. Long, T. Kong, J. Zhu and Y. Xiong, Chem. Rev., 2020, 120, 12175–12216 CrossRef CAS.
- C. Copéret, A. Comas-Vives, M. P. Conley, D. P. Estes, A. Fedorov, V. Mougel, H. Nagae, F. Núñez-Zarur and P. A. Zhizhko, Chem. Rev., 2016, 116, 323–421 CrossRef PubMed.
- X.-F. Yang, A. Wang, B. Qiao, J. Li, J. Liu and T. Zhang, Acc. Chem. Res., 2013, 46, 1740–1748 CrossRef CAS PubMed.
- H. Yang, L. Shang, Q. Zhang, R. Shi, G. I. N. Waterhouse, L. Gu and T. Zhang, Nat. Commun., 2019, 10, 4585 CrossRef PubMed.
- M. Flytzani-Stephanopoulos and B. C. Gates, Annu. Rev. Chem. Biomol. Eng., 2012, 3, 545–574 CrossRef CAS PubMed.
- V. Muravev, G. Spezzati, Y.-Q. Su, A. Parastaev, F.-K. Chiang, A. Longo, C. Escudero, N. Kosinov and E. J. M. Hensen, Nat. Catal., 2021, 4, 469–478 CrossRef CAS.
- L. Liu and A. Corma, Chem. Rev., 2018, 118, 4981–5079 CrossRef CAS PubMed.
- B. Zhang, H. Asakura, J. Zhang, J. Zhang, S. De and N. Yan, Angew. Chem., Int. Ed., 2016, 55, 8319 CrossRef CAS PubMed.
- B. Zhang, G. Sun, S. Ding, H. Asakura, J. Zhang, P. Sautet and N. Yan, J. Am. Chem. Soc., 2019, 141, 8185–8197 CrossRef CAS PubMed.
- R. Liu and C. Streb, Adv. Energy Mater., 2021, 11, 2101120 CrossRef CAS.
- L. Wang, M.-X. Chen, Q.-Q. Yan, S.-L. Xu, S.-Q. Chu, P. Chen, Y. Lin and H.-W. Liang, Sci. Adv., 2019, 5, eaax6322 CrossRef CAS PubMed.
- Y. Cheng, S. Zhao, B. Johannessen, J.-P. Veder, M. Saunders, M. R. Rowles, M. Cheng, C. Liu, M. F. Chisholm, R. Marco, H.-M. Cheng, S.-Z. Yang and S. P. Jiang, Adv. Mater., 2018, 30, 1706287 CrossRef PubMed.
- X. He, Q. He, Y. Deng, M. Peng, H. Chen, Y. Zhang, S. Yao, M. Zhang, D. Xiao, D. Ma, B. Ge and H. Ji, Nat. Commun., 2018, 10, 3663 CrossRef.
- S. Vajda and M. G. White, ACS Catal., 2015, 5, 7152–7176 CrossRef CAS.
- J. Wan, W. X. Chen, C. Y. Jia, L. R. Zheng, J. C. Dong, X. S. Zheng, Y. Wang, W. S. Yan, C. Chen, Q. Peng, D. S. Wang and Y. D. Li, Adv. Mater., 2018, 30, 1705369 CrossRef.
- H. Wei, K. Huang, D. Wang, R. Zhang, B. Ge, J. Ma, B. Wen, S. Zhang, Q. Li, M. Lei, C. Zhang, J. Irawan, L.-M. Liu and H. Wu, Nat. Commun., 2017, 8, 1490 CrossRef PubMed.
- S. Liu, J. M. Tan, A. Gulec, L. A. Crosby, T. L. Drake, N. M. Schweitzer, M. Delferro, L. D. Marks, T. J. Marks and P. C. Stair, Organometallics, 2017, 36, 818–828 CrossRef CAS.
- F. R. Lucci, J. Liu, M. D. Marcinkowski, M. Yang, L. F. Allard, M. Flytzani-Stephanopoulos and E. C. H. Sykes, Nat. Commun., 2015, 6, 8550 CrossRef PubMed.
- J. Jones, H. Xiong, A. T. DeLaRiva, E. J. Peterson, H. Pham, S. R. Challa, G. Qi, S. Oh, M. H. Wiebenga, X. I. P. Hernández, Y. Wang and A. K. Datye, Science, 2016, 353, 150–154 CrossRef CAS PubMed.
- Y. Chen, S. Ji, Y. Wang, J. Dong, W. Chen, Z. Li, R. Shen, L. Zheng, Z. Zhuang, D. Wang and Y. Li, Angew. Chem., Int. Ed., 2017, 56, 6937–6941 CrossRef CAS PubMed.
- L. Jiao, G. Wan, R. Zhang, H. Zhou, S.-H. Yu and H.-L. Jiang, Angew. Chem., Int. Ed., 2018, 57, 8525–8529 CrossRef CAS PubMed.
- J. Shan, M. Li, L. F. Allard, S. Lee and M. Flytzani-Stephanopoulos, Nature, 2017, 551, 605–608 CrossRef CAS PubMed.
- C. Zhao, X. Dai, T. Yao, W. Chen, X. Wang, J. Wang, J. Yang, S. Wei, Y. Wu and Y. Li, J. Am. Chem. Soc., 2017, 139, 8078–8081 CrossRef CAS PubMed.
- B. Qiao, A. Wang, X. Yang, L. F. Allard, Z. Jiang, Y. Cui, J. Liu, J. Li and T. Zhang, Nat. Chem., 2011, 3, 634–641 CrossRef CAS PubMed.
- Z. Zhang, Y. Zhu, H. Asakura, B. Zhang, J. Zhang, M. Zhou, Y. Han, T. Tanaka, A. Wang, T. Zhang and N. Yan, Nat. Commun., 2017, 8, 16100 CrossRef CAS PubMed.
- X. Guo, G. Fang, G. Li, H. Ma, H. Fan, L. Yu, C. Ma, X. Wu, D. Deng, M. Wei, D. Tan, R. Si, S. Zhang, J. Li, L. Sun, Z. Tang, X. Pan and X. Bao, Science, 2014, 344, 616–619 CrossRef CAS PubMed.
- P. Liu, Y. Zhao, R. Qin, S. Mo, G. Chen, L. Gu, D. M. Chevrier, P. Zhang, Q. Guo, D. Zang, B. Wu, G. Fu and N. Zheng, Science, 2016, 352, 797–800 CrossRef CAS.
- R. Lang, W. Xi, J.-C. Liu, Y.-T. Cui, T. Li, A. F. Lee, F. Chen, Y. Chen, L. Li, L. Li, J. Lin, S. Miao, X. Liu, A.-Q. Wang, X. Wang, J. Luo, B. Qiao, J. Li and T. Zhang, Nat. Commun., 2019, 10, 234 CrossRef PubMed.
- S. Sun, G. Zhang, N. Gauquelin, N. Chen, J. Zhou, S. Yang, W. Chen, X. Meng, D. Geng, M. N. Banis, R. Li, S. Ye, S. Knights, G. A. Botton, T.-K. Sham and X. Sun, Sci. Rep., 2013, 3, 1775 CrossRef.
- F. Huang, Y. Deng, Y. Chen, X. Cai, M. Peng, Z. Jia, J. Xie, D. Xiao, X. Wen, N. Wang, Z. Jiang, H. Liu and D. Ma, Nat. Commun., 2019, 10, 4431 CrossRef PubMed.
- L. Zhang, Y. Jia, G. Gao, X. Yan, N. Chen, J. Chen, M. T. Soo, B. Wood, D. Yang, A. Du and X. Yao, Chem, 2018, 4, 285–297 CAS.
- H. Wang, Q. Wang, Y. Cheng, K. Li, Y. Yao, Q. Zhang, C. Dong, P. Wang, U. Schwingenschlögl, W. Yang and X. X. Zhang, Nano Lett., 2012, 12, 141–144 CrossRef CAS.
- S. Cao, H. Li, T. Tong, H.-C. Chen, A. Yu, J. Yu and H. M. Chen, Adv. Funct. Mater., 2018, 28, 1802169 CrossRef.
- T. Sun, Y. Li, T. Cui, L. Xu, Y.-G. Wang, W. Chen, P. Zhang, T. Zheng, X. Fu, S. Zhang, Z. Zhang, D. Wang and Y. Li, Nano Lett., 2020, 20, 6206–6214 CrossRef CAS PubMed.
- J. Zhang, C. Zheng, M. Zhang, Y. Qiu, Q. Xu, W.-C. Cheong, W. Chen, L. Zheng, L. Gu, Z. Hu, D. Wang and Y. Li, Nano Res., 2020, 13, 3082–3087 CrossRef.
- S. Tian, M. Hu, Q. Xu, W. Gong, W. Chen, J. Yang, Y. Zhu, C. Chen, J. He, Q. Liu, H. Zhao, D. Wang and Y. Li, Sci. China Mater., 2021, 64, 642–650 CrossRef CAS.
- J. Gu, C. S. Hsu, L. Bai, H. M. Chen and X. Hu, Science, 2019, 364, 1091–1094 CrossRef CAS PubMed.
- Q. He, D. Liu, J. H. Lee, Y. Liu, Z. Xie, S. Hwang, S. Kattel, L. Song and J. G. Chen, Angew. Chem., Int. Ed., 2020, 59, 3033 CrossRef CAS PubMed.
- J. Wang, Z. Huang, W. Liu, C.-R. Chang, H. Tang, Z. Li, W. Chen, C. Jia, T. Yao, S. Wei, Y. Wu and Y. Li, J. Am. Chem. Soc., 2017, 139, 17281–17284 CrossRef CAS PubMed.
- Z. Liang, C. Qu, D. Xia, R. Zou and Q. Xu, Angew. Chem., Int. Ed., 2018, 57, 9604–9633 CrossRef CAS PubMed.
- T. Sun, L. Xu, D. Wang and Y. Li, Nano Res., 2019, 12, 2067–2080 CrossRef CAS.
- C. Wan, X. Duan and Y. Huang, Adv. Energy Mater., 2020, 10, 1903815 CrossRef CAS.
- M. Babucci, A. Guntida and B. C. Gates, Chem. Rev., 2020, 120, 11956–11985 CrossRef CAS PubMed.
- Y. Liu, Z. Li, Q. Yu, Y. Chen, Z. Chai, G. Zhao, S. Liu, W.-C. Cheong, Y. Pan, Q. Zhang, L. Gu, L. Zheng, Y. Wang, Y. Lu, D. Wang, C. Chen, Q. Peng, Y. Liu, L. Liu, J. Chen and Y. Li, J. Am. Chem. Soc., 2019, 141, 9305–9311 CrossRef PubMed.
- H.-S. Wang, Y.-C. Wang, Y.-M. Pan, S.-L. Zhao and Z.-F. Chen, Tetrahedron Lett., 2008, 49, 2634–2637 CrossRef CAS.
- A. Qazi and A. Sullivan, Dalton Trans., 2011, 40, 10637–10642 RSC.
- A. Kumar, K. Purkait, S. K. Dey, A. Sarkar and A. Mukherjee, RSC Adv., 2014, 4, 35233–35237 RSC.
- S. Rohilla, P. Pant and N. Jain, RSC Adv., 2015, 5, 31311–31317 RSC.
- B. S. Kumar, A. J. Amali and K. Pitchumani, J. Mol. Catal. A: Chem., 2016, 423, 511–519 CrossRef CAS.
- A. Kunfi, Z. May, P. Németh and G. London, J. Catal., 2018, 361, 84–93 CrossRef CAS.
- A. Patel and A. Patel, Catal. Lett., 2018, 148, 3534–3547 CrossRef CAS.
- A. Patel and A. Patel, Catal. Lett., 2019, 149, 1476–1485 CrossRef CAS.
- A. Patel and A. Patel, RSC Adv., 2021, 11, 8218–8227 RSC.
- A. Patel and J. Patel, Catal. Lett., 2021, 152, 2716–2728 CrossRef.
- A. Patel and J. Patel, Mol. Catal., 2021, 513, 111827 CrossRef CAS.
- N. Mizuno, J. S. Min and A. Taguchi, Chem. Mater., 2004, 16, 2819–2825 CrossRef CAS.
- X. Zhang, Q. Chen, D. C. Duncan, R. J. Lachicotte and C. L. Hill, Inorg. Chem., 1997, 36, 4381–4386 CrossRef CAS PubMed.
- Y. Zhu, W. D. Wang, X. Sun, M. Fan, X. Hu and Z. Dong, ACS Appl. Mater. Interfaces, 2020, 12, 7285–7294 CrossRef CAS PubMed.
- P. Singh, S. Mishra, A. Sahoo and S. Patra, Sci. Rep., 2021, 11, 9305 CrossRef CAS PubMed.
- Y. Fan, C. Zhuang, S. Li, Y. Wang, X. Zou, X. Liu, W. Huangd and G. Zhub, J. Mater. Chem. A, 2021, 9, 1110–1118 RSC.
- M. Liu, H. Yang, Z. Xu, W. Ma, F. Cui, G. Lu, L. Xud and T. Cui, New J. Chem., 2020, 44, 7035–7041 RSC.
- M. Wang, H. Xue, F. Ju and H. Yang, Sci. Rep., 2017, 7, 7006 CrossRef PubMed.
- P. Orecchia, D. S. Petkova, R. Goetz, F. Rominger, A. S. K. Hashmi and T. Schaub, Green Chem., 2021, 23, 8169–8180 RSC.
- S. I. El-Hout, S. M. El-Sheikh, H. M. A. Hassan, F. A. Harraz, I. A. Ibrahim and E. A. El-Sharkawy, Appl. Catal., A, 2015, 503, 176–185 CrossRef CAS.
Footnote |
| † Electronic supplementary information (ESI) available. See https://doi.org/10.1039/d2na00559j |
| This journal is © The Royal Society of Chemistry 2022 |


