 Open Access Article
Ag@Au bimetallic nanoparticles: an easy and highly reproducible synthetic approach for photocatalysis†
Esteban
Urzúa‡
a,
Fernando
Gonzalez-Torres‡
b,
Valentina
Beltrán
 b,
Pablo
Barrias
 c,
Sebastian
Bonardd
de,
A. M. R.
Ramírez
a and
Manuel
Ahumada
 *ab
*ab
aCentro de Nanotecnología Aplicada, Facultad de Ciencias, Ingeniería y Tecnología, Universidad Mayor, Camino La Piramide 5750, Huechuraba, Santiago, RM, Chile. E-mail: manuel.ahumada@umayor.cl
bEscuela de Biotecnología, Facultad de Ciencias, Ingeniería y Tecnología, Universidad Mayor, Camino La Piramide 5750, Huechuraba, Santiago, RM, Chile
cLaboratorio de Cinética y Fotoquímica, Facultad de Química y Biología, Universidad de Santiago de Chile, Av. Libertador Bernardo O'Higgins 3360, Santiago, RM, Chile
dDepartmento de Química Orgánica, Universidad de La Laguna, Avda. Astrofísico Francisco Sánchez 3, La Laguna 38206, Tenerife, Spain
eInstituto Universitario de Bio-Orgánica Antonio González, Universidad de La Laguna, Avda. Astrofísico Francisco Sánchez 2, La Laguna 38206, Tenerife, Spain
First published on 28th September 2022
Abstract
An Ag@Au bimetallic nanoparticle (BNP) formulation was developed in this work. The proposed formulation was developed using photochemical and chemical methods and non-toxic reagents, showing high reproducibility and homogeneity. The synthesized BNPs have an average size of 7 nm, a core–shell-like structure (silver core and gold shell), high colloidal and long-term stability, and superior catalytic activity under darkness and white light irradiation conditions when evaluating the reduction of 4-nitrophenol to 4-aminophenolate, with respect to the monometallic Ag and Au counterparts. Furthermore, BNP concentrations as low as 2 nM were required to reach 100% conversions in less than 30 minutes. Therefore, considering future applications, the high surface-to-volume ratio of the prepared BNPs coupled with their well-defined optical properties makes them a great candidate for developing heterogeneous catalyzer materials to be applicable under sunlight as an environmentally friendly catalytic system.
1. Introduction
The synthesis pathways of bimetallic nanoparticles (BNPs) have been extensively investigated for the development of new materials in applications such as environmental remediation,1 biomedical treatments,2 and catalysis,3 among others. Desired properties such as electronic, catalytic, magnetic, and optical have allowed overcoming some of the deficiencies shown by monometallic nanoparticles, which have been described as a product of the synergistic effect between two metals.4,5 Among the most common bimetallic pairs, Ag–Au nanomaterials constitute a significant part of the literature.Both individual metal (Ag and Au) nanoparticles have relevant features for developing materials. Several synthetic routes for monometallic gold and silver nanoparticles (AuNPs and AgNPs, respectively) have been reported, whereas parameters such as size, morphology, capping agent, etc., can be perfectly fine-tuned.6 Related to optical properties, their localized surface plasmon resonance (SPR) bands involve a broad spectrum range (UV, visible, and NIR sections), making them perfect candidates for optical applications, including industry, environment, and medicine.7 Nonetheless, differences are also observed in both metal NPs; Borah and Verbruggen (2020) have previously summarized the plasmon resonance advantage of Ag over Au NPs in terms of the interband transition energy (3.7 eV and 2.3 eV, respectively);8 meanwhile as for stability, AuNPs are considered chemically inert and less prone to oxidation in comparison to AgNPs.9 Since AuNPs and AgNPs have different advantages and disadvantages, their combination into a bimetallic nanoparticle formulation has increased researchers' attention.
Au–Ag bimetallic nanoparticles can be synthesized by physical energy application (top-down),10,11 chemical reduction,12–14 biological reduction,15,16 and photochemical methods,17 to mention some. Different Au–Ag NPs can be identified depending on their mixing pattern structure (core–shell, heterostructures, alloyed, and segregated structures).5 Furthermore, SPR bands observed in Au–Ag NPs present intermedium signals ranging from pure AgNPs to AuNPs, dependent on both metals' size and content ratio.18 Their plasmonic properties have prompted the interest in using them in the development of new catalytic materials, where such activity observed under light irradiation has become a fruitful research field, which has allowed the increase of the performance and the expansion of the boundaries of several chemical transformations, along with discovering new catalyzed-chemical paths.19 The catalytic effect showed by these nanostructures during light irradiation can be achieved through three different mechanisms, all arising from the same SPR phenomenon: first, the photothermal effect, identified as the abrupt increase of the local heat around NPs caused by the scattering and damping process of excited electrons, which is transduced in the generation of phonons that promote the heat dissipation to the surroundings where chemical transformation can take place.20 Secondly, the increment of the electromagnetic field occurs in the NP's vicinity due to oscillations and the accumulation of electrons on their surfaces. These entities, also called nanoantennae, can increase the local photonic density, confining the incident light and, therefore, raising the possibility of exciting molecular substrates.21 Finally, a third mechanism has been attributed to the ability of the SPR phenomenon to generate charge carriers (e.g., excited electrons and holes) able to participate in transferring processes between the metal surface and frontier orbitals belonging to chemical substrates.22 All these mechanisms can be developed simultaneously on a time scale; however, the contribution of each one would depend on the nature of molecular substrates involved and the catalyzed process itself.
However, besides their impact on research, the synthetic approaches used to obtain Ag–Au bimetallic nanoparticles found in the literature, in most cases, lack stability and homogeneity in both size distribution and plasmon signals (see Table S1†). Additionally, methods used to develop them use configurations that can negatively impact the environment and are not affordable for everyone. In this work, we have developed an easy synthetic route for preparing monodisperse Ag@Au bimetallic nanoparticles with an environment-friendly method characterized physically, chemically, and electrochemically. Furthermore, their potential photocatalytic activity was evaluated.
2. Experimental
2.1 Materials
Silver nitrate (AgNO3), gold(III) chloride trihydrate (HAuCl4), 2-hydroxy-1-[4-(2-hydroxyethoxy)phenyl]-2-methyl-1-propanone (I-2959), trisodium 2-hydroxypropane-1,2,3-tricarboxylate (sodium citrate), L-ascorbic acid, 4-nitrophenol, and sodium borohydride (NaBH4) were purchased from Sigma Aldrich. All the solutions were prepared using Milli-Q water obtained from a water purification system Adrona CB1901.2.2 Photochemical synthesis of Ag and Au nanoparticles
The synthesis of single metal (Ag and Au) nanoparticles was performed photochemically as previously described.23 Briefly, a solution containing 0.2 mM AgNO3, 0.2 mM I-2959, and 1 mM sodium citrate was purged with N2 for 30 min. Then, the solution was irradiated with lamps of 365 nm at 25 °C in a temperature-controlled Luzchem LZC-4 photoreactor (8 lamps, Luzchem Research Inc., Ottawa, Canada) for 30 min. A final yellow translucent citrate-capped silver nanoparticle (AgNP@citrate) solution was obtained. Similarly, citrate-capped gold nanoparticles (AuNP@citrate) were prepared by mixing 0.33 mM HAuCl4, 0.2 mM I-2959, and 1 mM sodium citrate, and following the same protocol described for the AgNPs, obtaining a red wine solution.24,25 Stock nanoparticle solutions were kept at room temperature and protected from light.2.3 Synthesis of Ag–Au bimetallic nanoparticles
Different combinations of Ag/Au monometallic nanoparticles, metal salt precursors, and reducing agents were tested to obtain stable Ag–Au bimetallic formulations (see Table S2†). However, based on their long-term stability, only three formulations were selected to proceed with the study, namely, a mixture of Ag and Au monometallic nanoparticles (Ag@Au-BNP), a mixture of Au nanoparticles with a silver precursor (Ag@Au–AgNO3), and a mixture of Ag nanoparticles with a gold precursor (Ag@Au–HAuCl4). Briefly, the formulation Ag@Au-BNP was obtained by mixing AgNP@citrate and AuNP@citrate in different ratios. The formulation of Ag@Au–AgNO3 was obtained by mixing AuNP@citrate and AgNO3 (0.2 mM) at several ratios. Similarly, the formulation of Ag@Au–HAuCl4 was obtained by mixing AgNP@citrate with HAuCl4 (0.33 mM) at different ratios. Unless otherwise indicated, in all cases, posteriorly to the component mixing, an aliquot of ascorbic acid (0.1 M final concentration) was added. For specifications on volumes and concentrations, please refer to the main text and Table S2.†2.4 Characterization of Ag–Au bimetallic nanoparticles
Changes in the surface plasmon resonance bands (SPR) were followed by UV-Vis spectroscopy using a UV-Vis spectrophotometer (Spectroquant Prove 300, Merck). The stability over time was established by measuring the SPR for up to 60 days. Several reducing agents were compared by following the changes in the SPR at final concentrations of 0.1 M. Galvanic reaction advance was followed for up to 12 days by evaluating the changes in the SPR. Similarly, the MNP ratio effect on the bimetallic nanoparticle synthesis was followed for 12 days.Fourier-transform infrared (FTIR) analyses were performed to evaluate the capping agent presence on the nanoparticle surface. Nanoparticle formulations were freeze-dried under vacuum using a lyophilizer (BK-FD10, Biobase) to obtain the samples in a powder form. IR measurements were performed on a Spectrum Two FTIR (PerkinElmer) equipped with an attenuated total reflectance (ATR) sample accessory.
Transmission electron microscopy (TEM) was performed on a Talos FF200C G2 (Thermo Scientific) at 120 kV. TEM grids were prepared by depositing 10 μL of the corresponding nanoparticle formulation on an ultrathin carbon film supported on a copper grid (400 mesh, Ted Pella, Inc.).
The hydrodynamic diameter and ζ-potential were determined by dynamic light scattering (DLS) and laser Doppler anemometry using a Zetasizer Nano ZS (Malvern Instruments, UK).
2.5 Electrochemical nanoparticle evaluation
The electrochemical study was carried out using a CH Instruments 750B potentiostat/galvanostat with a perturbation by cyclic voltammetry technique from a range of −1,0 to 1.0 V vs. SCE, at a scan rate, n, of 0.05 V s−1 and with a successive number, n, of 5. The electrochemical system consists of a three-compartment cell, and a working electrode of glassy carbon (GC) modified by adding 10 μL (in two aliquots of 5 μL) of the nanoparticle formulation to be evaluated. The reference electrode was constructed according to East and collaborators,26 by immersing a silver wire in a tetramethylammonium chloride solution (adjusted to the potential of a saturated calomel electrode (SCE)). Finally, a platinum wire with an area 20 times larger than the working electrode was used as the counter electrode. All electrochemical measurements were carried out in a solution of PBS 10 mM with a pH = 7.4 at 20 °C and under a high-purity argon atmosphere.2.6 Catalytic activity evaluation
The catalytic activity evaluation was performed by following the changes exhibited in the UV-Vis spectrum of 4-nitrophenol during its reduction to 4-aminophenolate, promoted by the presence of metal nanoparticles acting as a catalyst and an excess of NaBH4. Briefly, 10 mL of 4-nitrophenol solution (60 μM) were added to a water-jacketed glass container under continuous stirring (400 rpm) and kept at a constant 25 °C. Then, 700 μL of NaBH4 (20 mg mL−1) and 100 μL of the nanoparticle dispersion were added to evaluate (previously diluted in a ratio 1![[thin space (1/6-em)]](https://www.rsc.org/images/entities/char_2009.gif) :
:![[thin space (1/6-em)]](https://www.rsc.org/images/entities/char_2009.gif) 10 – NP stock: Milli-Q water). Experiments were carried out with and without white light irradiation. The evolution of the reaction was followed by UV-Vis spectroscopy at several time points until it reached 30 min.
10 – NP stock: Milli-Q water). Experiments were carried out with and without white light irradiation. The evolution of the reaction was followed by UV-Vis spectroscopy at several time points until it reached 30 min.
3. Results and discussion
3.1 Bimetallic nanoparticle synthesis
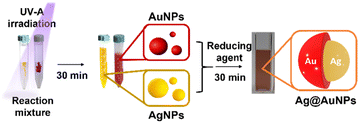
The Ag–Au bimetallic nanoparticle (Ag@Au BNP) formulations were obtained by mixing AgNP@citrate and AuNP@citrate (both previously photochemically synthesized) and by posterior addition of an aliquot of a known reducing agent, see Fig. 1. Similarly, we also tested several combinations for the synthesis (see Table S2†); nonetheless, as was mentioned before, only those prepared containing at least one type of MNP resulted in a stable Ag–Au nanoparticle. The formation of the BNPs was initially supported by examining the surface plasmon resonance bands (SPR) of the nanoparticles obtained by UV-Vis spectroscopy (see Fig. 2).3.2 Surface plasmon resonance band analysis
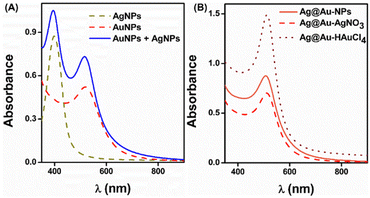
The UV-Vis spectra of mono- and bimetallic nanoparticle formulations (MNPs and BNPs, respectively), showing the changes in the SPR, are presented in Fig. 2. AgNPs and AuNPs showed typical SPRs at 395 nm and 520 nm, respectively. Regarding the Ag@Au-BNP formulation, at the initial time (t = 0), the 1![[thin space (1/6-em)]](https://www.rsc.org/images/entities/char_2009.gif) :
:![[thin space (1/6-em)]](https://www.rsc.org/images/entities/char_2009.gif) 1 combination gave two characteristic peaks associated with each MNP (Fig. 2A). Then, when an aliquot of 10 μL of ascorbic acid was added, the AgNP-associated SPR disappeared, and the AuNP SPR increased its measured absorbance and blue-shifted to 510 nm approximately. SPR's changes associated with BNP formation were also observed in those formulations prepared from mixtures between monometallic nanoparticles (either Ag or Au NPs) and the opposite metal precursor (AgNO3 and HAuCl4) (Fig. 2B).
1 combination gave two characteristic peaks associated with each MNP (Fig. 2A). Then, when an aliquot of 10 μL of ascorbic acid was added, the AgNP-associated SPR disappeared, and the AuNP SPR increased its measured absorbance and blue-shifted to 510 nm approximately. SPR's changes associated with BNP formation were also observed in those formulations prepared from mixtures between monometallic nanoparticles (either Ag or Au NPs) and the opposite metal precursor (AgNO3 and HAuCl4) (Fig. 2B).
Similar results in the SPR have been observed for other bimetallic Ag–Au nanoparticle formulations, see Table S1†. However, relevant differences are also noted that should be considered. For instance, Chung and collaborators (2019) have previously described that the position for the observed SPR peak of BNPs will depend upon the atom packaging on the surface, where a more significant presence of Ag promotes an SPR shift towards the values of pure AgNPs and the other way around for significant Au presence on the surface.27 Therefore, in our case, all BNP formulations are closely related to the pure AuNPs' SPR, indicating a higher presence of Au atoms on the surface. Furthermore, when comparing the SPR broadness obtained to those found in the literature,10,11,16,28 they are narrow, indicating low polydispersity within the sample (further demonstrated by TEM, see below). Another attractive characteristic is the high absorbance values observed for the main samples, making them good candidates for photocatalytic applications, which were further explored in this work (see Section 3).
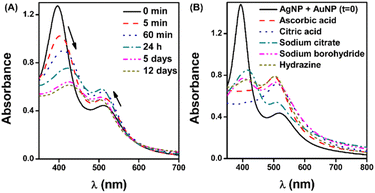
Additionally, the analysis of the changes in the SPR can be used to understand the underlying reaction/process that promotes the generation of the bimetallic nanoparticles in each formulation. Related to the formulations which consider the use of a monometallic nanoparticle and its metallic salt counterpart, it was clear that a spontaneous galvanic reaction drove the changes, i.e., a corrosion reaction that occurs when two different metal materials (with different redox potentials) come in contact is expected for the pair Ag–Au. The above is a challenge for developing Au–Ag nanoalloys, particularly for core-shell-like structures, mainly because the interaction of Ag and Au will promote holes within the nanostructure.29 Intriguing was the case of the formulation using both monometallic nanoparticles as a galvanic reaction is not expected to occur due to their redox state. To determine how the BNPs were formed, we followed the changes in the SPR when both monometallic nanoparticles (AuNPs and AgNPs) were together before the addition of the reducing agent, see Fig. 3A. Interestingly, relatively slow signs of conversion were observed, considering that after 12 days, total conversion to BNPs was not reached. In this regard, we could attribute this effect to two possible contributions:
(1) The presence of metal ion traces that were not reduced during the photochemical step: while no apparent changes in the UV-Vis spectra were observable even after two hours of irradiation (standard time is 30 min), the possible presence of unreduced metal ions could promote a galvanic reaction (GR, see eqn (1)). Another possibility, in contrast to galvanic reactions, is the occurrence of an antigalvanic replacement reaction that could promote the reduction of metal ions by noble metals (AGR, see eqn (2)).30 While this reaction could be less probable, it has been described that it is favored by metal nanoparticles of small size (≤4 nm) and weakly stabilized, as is our case.31
GR:
| Ag0 + Au+ → Au0 + Ag+ | (1) |
AGR:
| Aux + Agy → Agα + Auβ | (2) |
(2) Own nanoparticle's physical instabilities: it has been previously reviewed that metal nanoparticle stability could be expressed in terms of collision and DLVO theories and driven by thermodynamic processes.9,32 Such colloidal instabilities could lead to aggregation processes, ion release, etc., which will ultimately contribute to a galvanic reaction.
Nonetheless, when adding a reducing agent, the reaction reached conversion as fast as 1 min, depending on the used molecule. We tested several reducing agents at a final concentration of 0.1 M; the selection was made based on the ascorbic acid performance. As seen in Fig. 3B, after 24 h, only the formulations containing ascorbic acid and citric acid could promote BNP formation.
The addition of ascorbic acid enabled a total conversion within 1 min of reaction (see Fig. S1†). Previous studies have established that the addition of ascorbic acid, or another reducing agent, to an Ag–Au bimetallic formulation, will prompt the formation of a core–shell structure, avoiding the galvanic reaction, highlighting that the gold-coating around the silver core is usually thin (close to one to three Au atom layers).33–36 Furthermore, the use of mild/weaker reducing agents facilitates the secondary nucleation process of the growing NPs when starting from seeds.37 Therefore, the next experiments were conducted using ascorbic acid as a reducing agent.
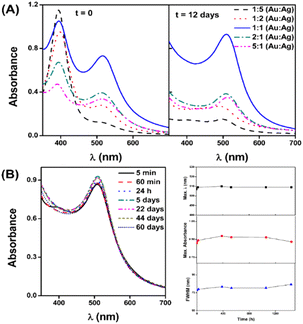
Also relevant was to determine which relation of NP proportion should be mixed to obtain the optimal parameters in the BNP formulation. In this work, we combined several ratios (see Fig. 4A) where the formulation with higher SPR and stability was that of a 1![[thin space (1/6-em)]](https://www.rsc.org/images/entities/char_2009.gif) :
:![[thin space (1/6-em)]](https://www.rsc.org/images/entities/char_2009.gif) 1 mixing ratio in volume. The lack of stability of the other tested ratios could be highly related to the excess of one of the metal species and that no additional reducing agent was added to the mixture, favoring the galvanic reaction and, therefore, promoting an uncontrolled ripening that led to instabilities.36 To explore the long-term stability of this 1
1 mixing ratio in volume. The lack of stability of the other tested ratios could be highly related to the excess of one of the metal species and that no additional reducing agent was added to the mixture, favoring the galvanic reaction and, therefore, promoting an uncontrolled ripening that led to instabilities.36 To explore the long-term stability of this 1![[thin space (1/6-em)]](https://www.rsc.org/images/entities/char_2009.gif) :
:![[thin space (1/6-em)]](https://www.rsc.org/images/entities/char_2009.gif) 1 formulation, we followed up the formulation for up to 60 days, finding that no apparent changes were observed after this time when stored covered from light and at room temperature (see Fig. 4B). Furthermore, by analyzing SPR's parameters, such as the wavelength at which the maximum absorbance appears (λmax), maximum absorbance, and the full width at half maximum (FWHM), no relevant modifications were observed. On the other hand, the rest of the tested formulations were not stable enough (data not shown). Therefore, we continue working only with the Ag@Au BNP formulation.
1 formulation, we followed up the formulation for up to 60 days, finding that no apparent changes were observed after this time when stored covered from light and at room temperature (see Fig. 4B). Furthermore, by analyzing SPR's parameters, such as the wavelength at which the maximum absorbance appears (λmax), maximum absorbance, and the full width at half maximum (FWHM), no relevant modifications were observed. On the other hand, the rest of the tested formulations were not stable enough (data not shown). Therefore, we continue working only with the Ag@Au BNP formulation.
3.3 Bimetallic nanoparticle TEM characterization
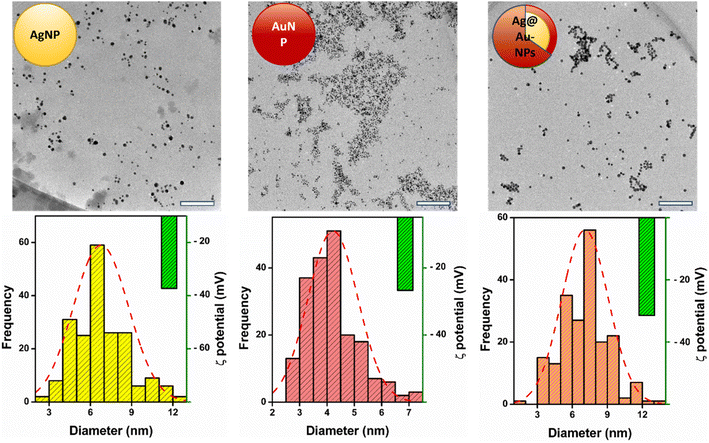
TEM images are presented in Fig. 5 top. Also, Fig. 5 bottom shows the diameter of the nanoparticles, estimated from the analysis of around 200 individual nanoparticles with Image J software. Additionally, ζ potential values are in the inset within the size analysis (green bar). The TEM images of AgNPs, AuNPs, and Ag@Au-NPs show that every nanoparticle formulation has an almost spherical shape, with measured sizes close to 6.8 nm, 4.2 nm, and 7.1 nm, respectively (see Table 1). When comparing our nanoparticle sizes to those found in the literature, it can be quickly concluded that our formulation generally shows smaller sizes (see Table S1†). These sizes are most probably correlated with using small seeds to construct the BNP's formulations.| NP formulation | Shape | Mean size (nm) | ζ potential (mV) | [NP] (nM) |
|---|---|---|---|---|
| AgNPs | Spherical | 6.8 | −37.8 | 15 |
| AuNPs | Spherical | 4.2 | −26.4 | 127 |
| Ag@Au-NPs | Spherical | 7.1 | −33.0 | 21 |
Related to their electrophoretic mobility, measured ζ potential values for the evaluated formulations have considerably high negative values (ranging from −23 to −38 mV), indicating that the prepared nanoparticles have good colloidal stability. The concept of nanoparticle stability is a relevant parameter, which alludes to the retention of its properties over time (such as size, morphology, and optical) when dispersed in a medium. Therefore, the lack of stability could lead to aggregation, agglomeration, or coalescence due to van der Waals or electrostatic interactions.38 While the ζ potential is not a direct measure of the stability, it measures the electric surface potential under a given environment,39 allowing a quick interpretation of DLVO theory, deriving the stability concept.40 Notably, the negative values and anionic behavior are correlated with the presence of citrate or ascorbic acid on the surface of the nanoparticles, which was further corroborated by FT-IR spectroscopy (see Fig. S2†).
TEM analysis allowed us to estimate the nanoparticle concentration by applying our previously published NANoPoLC algorithm (see eqn (3)).41 This equation considers the sample polydispersity of stable colloidal systems independent of their shape, size, or origin source.
 | (3) |
3.4 Nanoparticle electrochemical evaluation
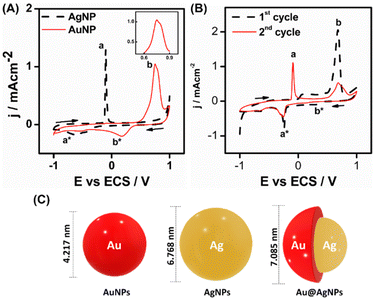
Fig. 6A shows the cyclic voltamperograms corresponding to the modified electrodes with AgNPs and AuNPs, respectively. Here, at a potential of −0.102 V, it is possible to observe the oxidation from Ag0 to Ag+ and its respective reduction process at −0.645 V. On the other hand, Au nanoparticles showed two peaks related to the oxidation process (see the inset), the first at 0.750 V and the second at 0.778 V (shoulder), corresponding to the oxidation from Au0 to Au+ and from Au+ to Au3+, respectively, while the reduction process is observable at 0.175 V approximately. In both cases, the oxidation–reduction processes are irreversible, similar to those reported in the literature.42,43 These differences could be attributable to the ion's diffusion dependence from the electrode/dissolution interphase posterior to the metallic ion oxidation. In this sense, the rate observed for the ions when migrated from the electrode to the bulk of the dissolution (oxidation) is different from that observed for the inverse process (reduction), when the scanning sense is inverted, promoting a signal decrease in each cycle (see Fig. S3†). Furthermore, the influence of nanometric sizes over the potential values obtained by cyclic voltamperometry had been previously described.43Cyclic voltamperograms related to the modified electrodes with the bimetallic formulation AgNP![[thin space (1/6-em)]](https://www.rsc.org/images/entities/char_2009.gif) :
:![[thin space (1/6-em)]](https://www.rsc.org/images/entities/char_2009.gif) AuNP (1
AuNP (1![[thin space (1/6-em)]](https://www.rsc.org/images/entities/char_2009.gif) :
:![[thin space (1/6-em)]](https://www.rsc.org/images/entities/char_2009.gif) 1) with ascorbic acid (0.1 M) (Ag@Au-NP) are shown in Fig. 6B. Signals related to the presence of Ag and Au are observable, where Au has an irreversible pair for the redox process with a value close to 0.536 V. Meanwhile, for Ag, there are peaks related to its oxidation/reduction process in an electrochemical quasi-reversible manner with values close to −0.081 V/−0.238 V, respectively. Furthermore, it can be observed that these signals are different from those exposed for AgNPs alone (Fig. 6A), which could be related to a conductivity increase of Ag in the presence of Au. Additionally, Fig. 6B shows that the oxidation peak associated with AgNPs appears only after the first voltamperometric cycle, being possible to observe the redox process for Au and reduction for Ag during the first cycle. This behavior could be explained by considering a core–shell structure for our formulation (see Fig. 6C), with an Ag-core and a thin Au-shell, which would be in concordance with previously published material.35,36
1) with ascorbic acid (0.1 M) (Ag@Au-NP) are shown in Fig. 6B. Signals related to the presence of Ag and Au are observable, where Au has an irreversible pair for the redox process with a value close to 0.536 V. Meanwhile, for Ag, there are peaks related to its oxidation/reduction process in an electrochemical quasi-reversible manner with values close to −0.081 V/−0.238 V, respectively. Furthermore, it can be observed that these signals are different from those exposed for AgNPs alone (Fig. 6A), which could be related to a conductivity increase of Ag in the presence of Au. Additionally, Fig. 6B shows that the oxidation peak associated with AgNPs appears only after the first voltamperometric cycle, being possible to observe the redox process for Au and reduction for Ag during the first cycle. This behavior could be explained by considering a core–shell structure for our formulation (see Fig. 6C), with an Ag-core and a thin Au-shell, which would be in concordance with previously published material.35,36
3.5 Catalytic activity
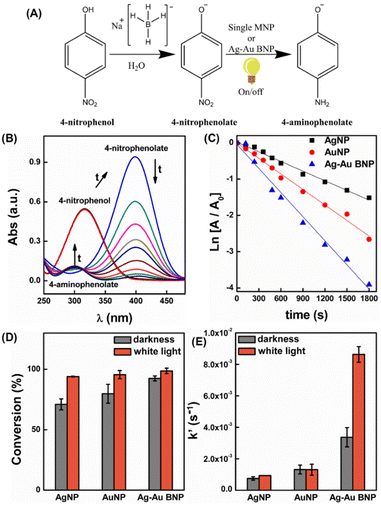
As was previously mentioned, Ag–Au BNPs had been widely used for catalytic transformations. At first sight, the formulation described in the present work allows the obtainment of nano-entities with suitable optical properties and optimal surface area-to-volume ratio values. Therefore, we proceeded to conduct their catalytic assessment using a well-known reaction, the reduction of 4-nitrophenol using an excess of NaBH4 as a reducing agent, under darkness and light irradiation conditions, see Fig. 7A. While the hydrogenation reaction of nitroaromatic compounds here evaluated is a gold standard for photocatalysis activity evaluation of nanoparticles, it is a reaction of interest for the pharmaceutical, agrochemical, and, generally, chemical industries.44 Additionally, several reports on the use of metallic nanoparticle formulations have also found catalytic applications in dye degradation, oxidation and reduction reactions, and hydroamination, to mention a few.45 Only the first case was tested in the present work, but we do not discard its applicability in other reactions.The photocatalytic activity was evaluated using white light from a LED source (sunlight mimicking) in the presence of the AgNP, AuNP, or Ag–Au BNP formulations. The reaction was fitted to a pseudo-first-order kinetic model expressed as eqn (4), considering the NaBH4 excess employed.
| ln[A/A0] = ln[C/C0] = −k′xt | (4) |
Related to the conversion of 4-nitrophenol, the reactions were followed for 30 minutes in darkness, a time at which the AgNPs reached a conversion close to 70%, AuNPs close to 80%, and Ag@Au BNPs 92%. However, when the above systems were exposed to white light, the measured conversion values experienced a noticeable increment, reaching values of 94%, 96%, and 100% in the same reaction time for the AgNPs, AuNPs, and Ag–Au BNP formulations, respectively. While in all the cases, the conversion percentages were relatively high, especially for those irradiated samples, these results do not reveal information about the kinetic process involved through which each formulation reaches such conversion values (Fig. 7D). Considering the above, Fig. 7E allows the visualizing of the differences in the average rate constants calculated for nanoparticle formulations in both darkness and under irradiation conditions. AgNPs' rate constants were 7.5 × 10⁻⁴ s−1 and 9.4 × 10⁻⁴ s−1 in darkness and under white light irradiation, respectively. In contrast, AuNP rate constants were close to 1.3 × 10⁻³ s−1 for both conditions. Surprisingly, for the Ag–Au BNPs, the rate constant in darkness was close to 3.4 × 10⁻³ s−1, and under white light irradiation it was 8.6 × 10⁻³ s−1, being approximately three times more efficient than the monometallic nanoparticles in darkness and eight times better photocatalyst. Previously, Satapathy and Si (2020) demonstrated that AuNPs have higher catalytic activity than AgNPs under similar conditions.46 In this study, they also showed that incorporating Au atoms into AgNP structures (alloys) increased the catalytic activity towards the reduction reaction of 4-nitrophenol. It has been previously reviewed that the light intensity, wavelength, particle size, and temperature are relevant parameters in using nanoparticles in photocatalysis.45 Thus, considering our results, light intensity and temperature were constant for every formulation, and while particle sizes were similar (Table 1), the remaining options could be related to the features of the SPR band along with the electronic changes occurring in the bimetallic systems arisen from the alloying process. One of the most accepted explanations for the synergy observed in this type of system had been related to the electronic changes that metal atoms experience after being surrounded by atoms of different natures. In this sense, these changes could be traduced as an electronic density enrichment over certain atomic entities, facilitating their participation in electron transfer processes.47 The above situation could be supported by our electrochemical measurements, where clear variations of the redox potentials ascribed to Au and Ag were observed in voltammograms recorded for mono- and bimetallic samples. Furthermore, it must be highlighted that the catalytic reactions were carried out at BNP concentrations close to 2 nM, as at the standard concentration (21 nM) obtained during the synthesis, the reaction was too fast to follow it. Therefore, the proposed Ag@Au BNP formulation is catalytically efficient in terms of the rate and the required amount of catalyst. Nonetheless, it should be noted that another important property in catalysis is the recyclability of the catalyst, a parameter that could not be measured under our homogeneous and high-diluted experimental conditions.
4. Conclusions
Using environmentally friendly chemicals, we synthesized and characterized a reproducible Ag–Au BNP formulation by photochemical and chemical reduction pathways. The Ag–Au BNPs showed an average size of 7 nm and high colloidal and long-term stability. Furthermore, electrochemical analysis suggested a core–shell structure with a silver core and a gold surface. The bimetallic nanoparticles showed high catalytic activity either in darkness or in the presence of white light (around three and eight times higher, respectively) compared to individual monometallic formulations of AgNPs and AuNPs. Therefore, these results give further options for developing novel photocatalytic materials. Future directions should focus on incorporating Ag–Au BNPs into solid supports (heterogeneous catalysis), which can lead to more efficient and environmentally friendly reaction catalysis.Author contributions
EU and FGT performed the comprehensive investigation (Experimental section) and helped with the formal analysis. VB and PB contributed to investigating the different parameters involved in the synthesis process. SB contributed to the catalysis methodology, formal analysis, and manuscript writing. AR contributed to the electrochemical methodology, investigation, formal analysis, and manuscript writing. MA contributed to the conceptualization, formal analysis, methodology, resources, supervision, and overall manuscript writing.Conflicts of interest
There are no conflicts to declare.Acknowledgements
MA thanks ANID – FONDECYT for Initiation grant No. 11180616 and Universidad Mayor for its support. AMRR thanks ANID-FONDECYT 11190995. SB thanks MINECO for a Juan de la Cierva – Formación contract (FJC2019-039515-I).References
- F. D. Guerra, M. F. Attia, D. C. Whitehead and F. Alexis, Molecules, 2018, 23, 1760 CrossRef.
- K. McNamara and S. A. M. Tofail, Phys. Chem. Chem. Phys., 2015, 17, 27981–27995 RSC.
- A. K. Singh and Q. Xu, ChemCatChem, 2013, 5, 652–676 CrossRef CAS.
- K. An and G. A. Somorjai, Catal. Lett., 2015, 145, 233–248 CrossRef CAS.
- N. Arora, K. Thangavelu and G. N. Karanikolos, Front. Chem., 2020, 8, 412 CrossRef CAS PubMed.
- K.-S. Lee and M. A. El-Sayed, J. Phys. Chem. B, 2006, 110, 19220–19225 CrossRef CAS PubMed.
- F. Frederix, J.-M. Friedt, K.-H. Choi, W. Laureyn, A. Campitelli, D. Mondelaers, G. Maes and G. Borghs, Anal. Chem., 2003, 75, 6894–6900 CrossRef CAS PubMed.
- R. Borah and S. W. Verbruggen, J. Phys. Chem. C, 2020, 124, 12081–12094 CrossRef CAS.
- H. Kang, J. T. Buchman, R. S. Rodriguez, H. L. Ring, J. He, K. C. Bantz and C. L. Haynes, Chem. Rev., 2019, 119, 664–699 CrossRef CAS.
- S. Albonetti, M. Blosi, F. Gatti, A. Migliori, L. Ortolani, V. Morandi, G. Baldi, A. Barzanti and M. Dondi, in Studies in Surface Science and Catalysis, ed. E. M. Gaigneaux, M. Devillers, S. Hermans, P. A. Jacobs, J. A. Martens and P. Ruiz, Elsevier, 2010, vol. 175, pp. 621–624 Search PubMed.
- Y. Oh, J. Lee and M. Lee, Appl. Surf. Sci., 2018, 434, 1293–1299 CrossRef CAS.
- I. Shmarakov, I. Mukha, N. Vityuk, V. Borschovetska, N. Zhyshchynska, G. Grodzyuk and A. Eremenko, Nanoscale Res. Lett., 2017, 12, 333 CrossRef PubMed.
- I. J. Godfrey, A. J. Dent, I. P. Parkin, S. Maenosono and G. Sankar, J. Phys. Chem. C, 2017, 121, 1957–1963 CrossRef CAS.
- K. Bankura, D. Maity, M. M. Mollick, D. Mondal, B. Bhowmick, I. Roy, T. Midya, J. Sarkar, D. Rana, K. Acharya and D. Chattopadhyay, Carbohydr. Polym., 2014, 107, 151–157 CrossRef CAS PubMed.
- A. Lagashetty, S. K. Ganiger and T. Shashidhar, Heliyon, 2019, 5, e02794 CrossRef PubMed.
- C. M. Ramakritinan, E. Kaarunya, S. Shankar and A. K. Kumaraguru, Solid State Phenom., 2013, 201, 211–230 Search PubMed.
- C. Fasciani, M. J. Silvero, M. A. Anghel, G. A. Argüello, M. C. Becerra and J. C. Scaiano, J. Am. Chem. Soc., 2014, 136, 17394–17397 CrossRef CAS PubMed.
- S. W. Verbruggen, M. Keulemans, J. A. Martens and S. Lenaerts, J. Phys. Chem. C, 2013, 117, 19142–19145 CrossRef CAS.
- E. Cortés, L. V. Besteiro, A. Alabastri, A. Baldi, G. Tagliabue, A. Demetriadou and P. Narang, ACS Nano, 2020, 14, 16202–16219 CrossRef.
- S. K. Cushing, J. Li, F. Meng, T. R. Senty, S. Suri, M. Zhi, M. Li, A. D. Bristow and N. Wu, J. Am. Chem. Soc., 2012, 134, 15033–15041 CrossRef CAS PubMed.
- H. A. Atwater and A. Polman, Nat. Mater., 2010, 9, 205–213 CrossRef CAS PubMed.
- C. Hu, T. Peng, X. Hu, Y. Nie, X. Zhou, J. Qu and H. He, J. Am. Chem. Soc., 2010, 132, 857–862 CrossRef CAS PubMed.
- K. Hosoyama, M. Ahumada, C. D. McTiernan, J. Bejjani, F. Variola, M. Ruel, B. Xu, W. Liang, E. J. Suuronen and E. I. Alarcon, RSC Adv., 2017, 7, 47704–47708 RSC.
- M. L. Marin, K. L. McGilvray and J. C. Scaiano, J. Am. Chem. Soc., 2008, 130, 16572–16584 CrossRef CAS PubMed.
- K. L. McGilvray, M. R. Decan, D. Wang and J. C. Scaiano, J. Am. Chem. Soc., 2006, 128, 15980–15981 CrossRef CAS PubMed.
- G. A. East and M. A. del Valle, J. Chem. Educ., 2000, 77, 97 CrossRef CAS.
- T. Chung, C. S. H. Hwang, M.-S. Ahn and K.-H. Jeong, Plasmonics, 2019, 14, 407–413 CrossRef CAS.
- H. M. Chen, R. S. Liu, L. Y. Jang, J. F. Lee and S. F. Hu, Chem. Phys. Lett., 2006, 421, 118–123 CrossRef CAS.
- X. Xia, Y. Wang, A. Ruditskiy and Y. Xia, Adv. Mater., 2013, 25, 6313–6333 CrossRef CAS PubMed.
- Z. Wu, Angew. Chem., Int. Ed., 2012, 51, 2934–2938 CrossRef CAS PubMed.
- D. K. Pattadar, R. A. Masitas, C. D. Stachurski, D. E. Cliffel and F. P. Zamborini, J. Am. Chem. Soc., 2020, 142, 19268–19277 CrossRef CAS PubMed.
- H. T. Phan and A. J. Haes, J. Phys. Chem. C, 2019, 123, 16495–16507 CrossRef CAS PubMed.
- R. G. Sanedrin, D. G. Georganopoulou, S. Park and C. A. Mirkin, Adv. Mater., 2005, 17, 1027–1031 CrossRef CAS.
- R. J. Cao and C. A. Mirkin, J. Am. Chem. Soc., 2001, 123, 7961–7962 CrossRef PubMed.
- Y. Ma, W. Li, E. C. Cho, Z. Li, T. Yu, J. Zeng, Z. Xie and Y. Xia, ACS Nano, 2010, 4, 6725–6734 CrossRef CAS PubMed.
- Y. Yang, J. Liu, Z.-W. Fu and D. Qin, J. Am. Chem. Soc., 2014, 136, 8153–8156 CrossRef CAS PubMed.
- B. Pinho, K. Zhang, R. L. Z. Hoye and L. Torrente-Murciano, Adv. Opt. Mater., 2022, 10, 2200524 CrossRef CAS.
- J. Polte, CrystEngComm, 2015, 17, 6809–6830 RSC.
- T. L. Doane, C.-H. Chuang, R. J. Hill and C. Burda, Acc. Chem. Res., 2012, 45, 317–326 CrossRef CAS PubMed.
- E. J. W. Verwey, J. Phys. Colloid Chem., 1947, 51, 631–636 CrossRef CAS PubMed.
- C. Lazurko, M. Ahumada, F. Valenzuela-Henriquez and E. I. Alarcon, Nanoscale, 2018, 10, 3166–3170 RSC.
- R. Herrero-Calvillo, A. Santoveña-Uribe, R. Esparza and G. Rosas, Mater. Res. Express, 2020, 7, 015019 CrossRef CAS.
- M. Giovanni and M. Pumera, Electroanalysis, 2012, 24, 615–617 CrossRef CAS.
- W. Li, X. Lin, J. Long, B. Zheng, Z. Pan, L. Lang and G. Liu, RSC Adv., 2021, 11, 37708–37712 RSC.
- S. Sarina, E. R. Waclawik and H. Zhu, Green Chem., 2013, 15, 1814–1833 RSC.
- S. S. Satapathy and S. Si, Appl. Nanosci., 2020, 10, 4139–4148 CrossRef CAS.
- N. Arora, A. Mehta, A. Mishra and S. Basu, Appl. Clay Sci., 2018, 151, 1–9 CrossRef CAS.
Footnotes |
| † Electronic supplementary information (ESI) available: Urzua et al. – Nanoscale. See https://doi.org/10.1039/d2na00539e |
| ‡ Equal contributions. |
| This journal is © The Royal Society of Chemistry 2022 |

