 Open Access Article
Composite Mn–Co electrode materials for supercapacitors: why the precursor's morphology matters!†
Ronan
Invernizzi
ab,
Alexia
Lemoine
c,
Lénaïc
Madec
 bc,
François
Weill
ab,
Marie-Anne
Dourges
d,
Céline
Tang
abe,
Domitille
Giaume
be,
Isabelle
Baraille
bc,
Pierre Louis
Taberna
bfg,
Delphine
Flahaut
bc,
Jacob
Olchowka
bc,
François
Weill
ab,
Marie-Anne
Dourges
d,
Céline
Tang
abe,
Domitille
Giaume
be,
Isabelle
Baraille
bc,
Pierre Louis
Taberna
bfg,
Delphine
Flahaut
bc,
Jacob
Olchowka
 *abf and
Liliane
Guerlou-Demourgues
*abf
aUniversité Bordeaux, CNRS, Bordeaux INP, ICMCB UMR 5026, F-33600 Pessac, France. E-mail: liliane.guerlou-demourgues@enscbp.fr; jacob.olchowka@icmcb.cnrs.fr
bRS2E, Réseau Français sur le Stockage Electrochimique de l’Energie, FR CNRS #3459, F-80039 Amiens Cedex 1, France
cCNRS/Univ. Pau & Pays Adour/E2S UPPA, Institut des Sciences Analytiques et de Physicochimie pour l’Environnement et les Matériaux – UMR 5254, 64000 Pau, France
dInstitut des Sciences Molaires, Univ. Bordeaux, UMR 5255, F-33405 Talence, France
eChimie-ParisTech, PSL Research University, CNRS Institut de Recherche de Chimie-Paris (IRCP), 75005 Paris, France
fALISTORE-ERI European Research Institute, FR CNRS #3104, Amiens, F-80039 Cedex 1, France
gCIRIMAT, Université de Toulouse, CNRS, Université Toulouse 3 – Paul Sabatier, 118 Route de Narbonne, 31062 Toulouse, Cedex 9, France
First published on 7th October 2022
Abstract
In the energy storage field, an electrode material must possess both good ionic and electronic conductivities to perform well, especially when high power is needed. In this context, the development of composite electrode materials combining an electrochemically active and good ionic conductor phase with an electronic conductor appears as a perfectly adapted approach to generate a synergetic effect and optimize the energy storage performance. In this work, three layered MnO2 phases with various morphologies (veils, nanoplatelets and microplatelets) were combined with electronic conductor cobalt oxyhydroxides with different platelet sizes (∼20 nm vs. 70 nm wide), to synthesize 6 different composites by exfoliation and restacking processes. The influence of precursors' morphology on the distribution of the Mn and Co objects within the composites was carefully investigated and correlated with the electrochemical performance of the final restacked material. Overall, the best performing restacked composite was obtained by combining MnO2 possessing a veil morphology with the smallest cobalt oxyhydroxide nanoplatelets, leading to the most homogeneous distribution of the Mn and Co objects at the nanoscale. More generally, the aim of this work is to understand how the size and morphology of the precursor building blocks influence their distribution homogeneity within the final composite and to find the most compatible building blocks to reach a homogeneous distribution at the nanoscale.
1 Introduction
Driven by the transition towards sustainable but intermittent energy production along with the emergence of electric vehicles, the development of safe, reliable and high-performance energy storage systems turns into one of the most important challenges facing the scientific community.1,2 For instance, many efforts are currently done to increase the energy density of batteries with the perspective of boosting the driving range of electric vehicles.3 Nevertheless, these high energy density batteries are not well-adapted to high power applications such as for energy recovery during braking or grid power buffering, due to the diffusion limited processes characteristic of these systems. Electrochemical double-layer capacitors (EDLC), thanks to their capacitive storage, are able to meet the needs in terms of time response for these power applications. However their capacity is too low for many practical purposes.4,5Thus, pseudocapacitive systems appear as an ideal alternative to achieve at the same time high power and suitable energy density.6 Their fast and reversible near-surface faradaic reactions to store charges allow surpassing the capacity limitation of EDLCs while keeping fast time responses.7,8 Among the various pseudocapacitive electrode materials, MnO2 is one of the most studied thanks to its abundance, high theoretical capacity, stability in aqueous electrolytes and low price.9–12 Nonetheless, the manganese oxide phases possess a poor electronic conductivity that, in practice, strongly limits their rate capability.13,14
To counterbalance this limiting aspect, two ways are mainly investigated in the literature. The first one targets the nanostructuration of MnO2 to increase both the specific surface area and thus, the number of surface redox active sites and to shorten the electron pathways to improve the kinetics.15 To do so, plenty of different synthesis approaches have been reported in the last few years such as coprecipitation, template assisted synthesis, hydro/solvothermal synthesis and chemical vapor deposition leading to original morphologies and often enhanced performance.16–21 The second approach widely studied consists in combining MnO2 with an electronic conductive material leading to hybrid or composite electrode materials.22,23 The development of hybrid compounds made of MnO2 with an electronic conductive carbon material such as graphene, carbon nanotubes or nanofibers or with a conductive polymer such as PEDOT or PPy appears as a well-adapted method as they are easy to synthesize, exhibit excellent chemical and electrochemical stability, and offer the possibility to obtain self-supported electrodes.21,24 Another efficient approach to boost the power ability is to synthesize MnO2 – conductive metal composites such as composites with transition metal oxides/carbides or with metallic nanoparticles.25–27 Following this idea, Tang et al. recently developed an original approach to combine lamellar manganese oxides (birnessite δ-MnO2) with layered non-stoichiometric cobalt oxyhydroxides (β3-CoOOH) by exfoliation/restacking processes.28 This cobalt phase displays indeed a very high electronic conductivity (∼1 S cm−1 at room temperature) due to the presence of Co4+ in the CoO2 slabs.29,30 The authors investigated the optimal molar ratio between the pseudocapacitive birnessite MnO2 and the electronic conductive β3-CoOOH phase to reach the best capacity retention at high rates. It was found that a Mn![[thin space (1/6-em)]](https://www.rsc.org/images/entities/char_2009.gif) :
:![[thin space (1/6-em)]](https://www.rsc.org/images/entities/char_2009.gif) Co ratio of 3
Co ratio of 3![[thin space (1/6-em)]](https://www.rsc.org/images/entities/char_2009.gif) :
:![[thin space (1/6-em)]](https://www.rsc.org/images/entities/char_2009.gif) 1 exhibits the greatest synergetic effect between both phases leading to a composite with better rate performance than simple manganese oxide or MnO2 mixed with carbon black.31 Based on these very promising results, we decided to study in more detail the distribution scale of MnO2 and β3-CoOOH within the composite as well as the influence of precursors' morphology on the homogeneity and electrochemical performance of the final restacked materials. More generally, the aim of this work is to understand how the size and morphology of the precursor building blocks influence their distribution homogeneity within the final composite and to find the most compatible building blocks to reach a homogeneous distribution at the nanoscale.
1 exhibits the greatest synergetic effect between both phases leading to a composite with better rate performance than simple manganese oxide or MnO2 mixed with carbon black.31 Based on these very promising results, we decided to study in more detail the distribution scale of MnO2 and β3-CoOOH within the composite as well as the influence of precursors' morphology on the homogeneity and electrochemical performance of the final restacked materials. More generally, the aim of this work is to understand how the size and morphology of the precursor building blocks influence their distribution homogeneity within the final composite and to find the most compatible building blocks to reach a homogeneous distribution at the nanoscale.
To do so, we synthesize birnessite precursors with three different morphologies (veils, big platelets and small platelets) and two cobalt oxyhydroxide precursors with platelets of different sizes (around 70 nm wide and 20 nm wide) to finally obtain 6 different composites with the same optimal Mn![[thin space (1/6-em)]](https://www.rsc.org/images/entities/char_2009.gif) :
:![[thin space (1/6-em)]](https://www.rsc.org/images/entities/char_2009.gif) Co ratio of 3
Co ratio of 3![[thin space (1/6-em)]](https://www.rsc.org/images/entities/char_2009.gif) :
:![[thin space (1/6-em)]](https://www.rsc.org/images/entities/char_2009.gif) 1. The distribution of the Mn and Co objects within the composites was thoroughly investigated by nitrogen adsorption, nano-Auger spectroscopy, and transmission electron microscopy and correlated with the specific surface area of the composites as well as their energy storage performance at high rates.
1. The distribution of the Mn and Co objects within the composites was thoroughly investigated by nitrogen adsorption, nano-Auger spectroscopy, and transmission electron microscopy and correlated with the specific surface area of the composites as well as their energy storage performance at high rates.
2 Experimental
2.1 Preparation of cobalt oxyhydroxide precursors
Method 1: the β(III) cobalt oxyhydroxide phase is prepared by precipitation at constant pH 14 (reverse precipitation). First, 3.18 g of Co(NO3)2·6H2O (Sigma Aldrich) are dissolved in 300 mL of distilled water. Then, the nitrate solution is slowly added into 11 mL of 2 M NaOH under stirring. Immediately after the addition of the nitrate solution, a blue (α-Co(OH)2) precipitate appears, it quickly turns pink (β(II)-Co(OH)2) and finally turns brown (partially oxidized cobalt hydroxide). To speed up the oxidation process of the freshly made cobalt hydroxide, 7.5 mL (3 times the required volume) of NaClO (48 °C l) are added dropwise to the solution that becomes black. The final solution is stirred during 36 hours at room temperature, centrifuged several times at 4000 rpm until neutral pH, and dried at 45 °C for one day.Method 2: the β(III) cobalt oxyhydroxide phase is synthesized by forward precipitation at increasing pH (the pH value increases from 6 to 10 during the precipitation): 11 mL of 2 M NaOH solution is slowly added into the nitrate solution (3.18 g in 300 mL of distilled water) before the same oxidation, centrifugation and drying steps as seen for method 1.29
The pure β(III) cobalt oxyhydroxides prepared by method 1 and by method 2 are denoted as β3-pH14 and β3-pH↗ respectively.
2.2 Preparation of manganese precursors
2.3 Exfoliation
The protonated Mn and Co oxides are separately suspended in a solution of water and tetrabutylammonium hydroxide (TBAOH). The TBAOH solution is added to obtain a H+![[thin space (1/6-em)]](https://www.rsc.org/images/entities/char_2009.gif) :
:![[thin space (1/6-em)]](https://www.rsc.org/images/entities/char_2009.gif) TBA+ molar ratio of 1
TBA+ molar ratio of 1![[thin space (1/6-em)]](https://www.rsc.org/images/entities/char_2009.gif) :
:![[thin space (1/6-em)]](https://www.rsc.org/images/entities/char_2009.gif) 10 for manganese phases and 1
10 for manganese phases and 1![[thin space (1/6-em)]](https://www.rsc.org/images/entities/char_2009.gif) :
:![[thin space (1/6-em)]](https://www.rsc.org/images/entities/char_2009.gif) 2 for cobalt ones. The suspensions are sonicated 3 times during 1 hour (with 0.5 s/0.5 s (pulse in/off)) and aged under stirring for 20–30 days. They are finally centrifuged at 4000 rpm during 5 minutes. As the outcome of the treatment, part of the material flocculates at the bottom of the recipient whereas the other part remains suspended in the supernatant part. The latter is recovered and the resulting colloidal suspension will be further used for the restacking step.
2 for cobalt ones. The suspensions are sonicated 3 times during 1 hour (with 0.5 s/0.5 s (pulse in/off)) and aged under stirring for 20–30 days. They are finally centrifuged at 4000 rpm during 5 minutes. As the outcome of the treatment, part of the material flocculates at the bottom of the recipient whereas the other part remains suspended in the supernatant part. The latter is recovered and the resulting colloidal suspension will be further used for the restacking step.
2.4 Synthesis of restacked materials
The molar ratio between the manganese and cobalt suspensions is set to 3, which according to the previous work of Tang et al., should be the optimal ratio for high rate performance.28 Each colloidal suspension of manganese and cobalt is adjusted to pH = 4.5 by gradual addition of nitric acid. The volume of the two suspensions is adjusted to 200 mL before the latter are slowly transferred with a peristaltic pump into a solution of 20 mL of nitric acid at pH = 4.5. When they come into contact, the different nano-objects should flocculate on top of each other considering that at pH = 4.5, the surface of Mn objects is negatively charged whereas that of Co particles is positively charged. The optimal pH conditions for the restacking step were determined by zeta potential measurements, as detailed in ESI Fig. S1.† Finally, the restacked materials are recovered by centrifugation after being washed several times until neutral pH.2.5 X-ray diffraction
The X-ray diffraction patterns of all samples were recorded on a Philips PANalytical X'Pert Pro equipped with a copper source (λKα1 = 0.1540 nm and λKα2 = 0.1544 nm). The powder diffraction patterns were recorded for about 2 h in the 10–80° (2θ) angular range, with a 0.02° (2θ) step size and a 2.022° (2θ) active width in the detector. The size of the coherent domains of the different phases was calculated using the Scherrer equation from (00l) reflections. The attribution and the purity of the phases were confirmed by comparison with reference peaks from PDF 00-042-1317 (MnO2 birnessite) and 07-0169 (HxCoO2).2.6 Specific surface area and porosity
Surface area and pore structure were explored by recording nitrogen adsorption isotherms at 77 K with Micromeritics 3Flex equipment. Before analysis, the samples were degassed at 60 °C under vacuum for 15 h to reach a pressure less than 10 μm Hg.The specific surface area was obtained using the BET equation applied between 0.01 and 0.25 relative pressure (p/p0).34
An Auger JEOL JAMP 9500F spectrometer was used for Scanning electron microscopy (SEM), Auger electron spectroscopy (AES) and scanning Auger microscopy (SAM). The SEM images of restacked materials were recorded under ultra high vacuum conditions (<2 × 10⁻⁷ Pa). An acceleration voltage of 20 kV and a current beam of 3 or 4 nA were used for both SEM and AES/SAM. Accordingly, the probe size is about 20 nm (which corresponds to a spatial resolution for SAM of about 30 nm) and the probing depth is about 3 nm. The analysis was performed at 30° tilt to prevent the charging effect.
The AES survey spectra were recorded between 25 and 1000 eV with a step of 1 eV. SAM images (elemental 2D distribution) have been represented using “peak minus background” (P − B) of the Auger intensity for a transition (dE/E = 0.5%).
For AES survey spectra and SAM images, an “auto probe tracking” was used to control any potential drift during analyzes.
2.7 Electrochemistry
The active material was mixed with carbon black and polytetrafluoroethylene in a weight ratio of 80/15/5 to prepare the working electrodes. The electrode was then pressed at 5 bars on a stainless steel grid for one minute. The mass loading of the electrodes is ∼10 mg cm−2. Electrochemical measurements were carried out in a solution of 0.5 M K2SO4 in a 3-electrode configuration at 25 °C. The reference electrode was an Ag/AgCl electrode and as the counter electrode, a platinum wire was used.2.8 EIS measurements
For EIS measurements, the electrodes were pressed on a stainless steel current collector which was gold coated-sputtering in order to suppress/minimize the contact impedance between the current collector and the active material. The EIS measurements of the composites were performed at potentials of 0.2, 0.3, 0.4, 0.5 and 0.6 V vs. Ag/AgCl, in 0.5 M K2SO4. For the measurements, a perturbation of 5 mV was used in a frequency range from 10 kHz down to 10 mHz.3 Results and discussion
3.1 Structural characterization of the restacked composites compared to the cobalt and manganese precursors
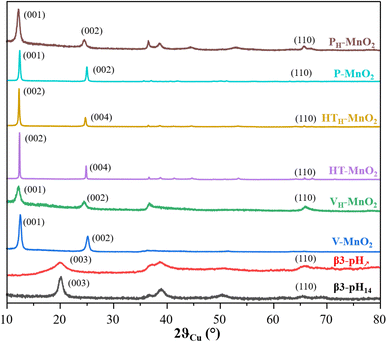
The diagrams of the two cobalt oxyhydroxides β3-pH14 and β3-pH↗ show the signature of pure β3-CoOOH phases.35 However, the XRD pattern of β3-pH↗ reveals smaller coherent domains as compared with β3-pH14 due to broader and less defined diffraction peaks. The size of the coherent domains is estimated along the [00l] direction to be around 10 nm for β3-pH14 against 3 nm for β3-pH↗.
V-MnO2, P-MnO2 and HT-MnO2 exhibit similar X-ray diffraction patterns that correspond to birnessite phase δ-MnO2. However, V-MnO2 shows less defined and larger diffraction peaks than the other two birnessite phases, suggesting a crystallinity loss. Indeed, V-MnO2 displays coherent domains of 12 nm, whereas those of P-MnO2 and HT-MnO2 are estimated with the (001) reflection to be around 58 nm and 119 nm respectively. The asymmetric profile of the (10l) and (11l) diffraction peaks for V-MnO2 is characteristic of a turbostratic stacking or the presence of several stacking polytypes as it is commonly observed in birnessite materials.36 The sodium birnessite P-MnO2 exhibits a larger interlayer distance than the two potassium birnessites (7.13 Å vs. 7.08 Å for HT-MnO2 and V-MnO2).32,37 Considering the ionic radius of sodium and potassium ions (0.99 Å and 1.51 Å respectively), this could first appear as counter intuitive.38 However, the higher polarizing effect of Na+versus K+ leads to a larger hydration shell for Na+, even for alkaline ions in the confined interlayer of birnessite, which thus, induces a higher interlayer space for P-MnO2.39,40 This is supported by the larger quantity of intercalated water molecules for P-MnO2 compared to the other two manganese oxides (Table S1†).
A comparison of the birnessite phases before and after protonation shows that the protonation step induces (i) a shift of the (00l) reflections towards lower angles, revealing an increase of the interlayer spacing (Fig. 1) and (ii) a drastic drop of alkaline concentration in parallel to an increase of the proton content (Table S1†). These evolutions confirm the successful exchange of alkaline ions for protons. The protonation step does not influence the coherent domains of HT-MnO2 and V-MnO2, which remain around 119 nm and 12 nm respectively. On the other hand, the size of the coherent domains decreases by more than a factor of 2 after protonation for P-MnO2 (from 58 nm to 25 nm), which suggests that the crystallites of P-MnO2 are already exfoliated during the protonation step, since the coherent domain calculated along the [00l] direction is directly related to the number of stacked metal oxide slabs in a crystallite.
![[thin space (1/6-em)]](https://www.rsc.org/images/entities/char_2009.gif) :
:![[thin space (1/6-em)]](https://www.rsc.org/images/entities/char_2009.gif) Co of 3
Co of 3![[thin space (1/6-em)]](https://www.rsc.org/images/entities/char_2009.gif) :
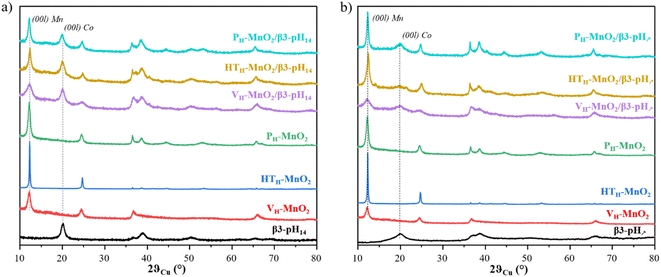
:![[thin space (1/6-em)]](https://www.rsc.org/images/entities/char_2009.gif) 1, as confirmed by ICP-OES measurements (Table S2†). The XRD patterns of the final restacked materials (purple, yellow and cyan curves) are shown in Fig. 2 along with the corresponding cobalt (black curve) and protonated manganese precursors (red, green and blue curves). Fig. 2a and b show restacked materials obtained with β3-pH14 and β3-pH↗ respectively.
1, as confirmed by ICP-OES measurements (Table S2†). The XRD patterns of the final restacked materials (purple, yellow and cyan curves) are shown in Fig. 2 along with the corresponding cobalt (black curve) and protonated manganese precursors (red, green and blue curves). Fig. 2a and b show restacked materials obtained with β3-pH14 and β3-pH↗ respectively.
The XRD patterns show that every restacked material is composed of two phases: a cobalt oxyhydroxide and a protonated manganese oxide. In order to better understand the phenomena that happened during the experimental procedure, the coherent domain sizes of cobalt and manganese phases were compared before and after the exfoliation/restacking step. Generally speaking, a decrease of coherent domains of a phase along the [00l] direction in the final material means that the number of stacked layers within a crystallite is reduced, which suggests that an exfoliation has occurred. If, by contrast, the sizes of coherent domains remain unchanged between the precursors and the restacked materials, it is highly likely that no exfoliation happened and that the crystallites and/or the primary particles might be just separated or dis-agglomerated.
According to the coherent domain values given in Table 1, whatever the restacked material, there is no significant change in the size of crystallites along the [00l] direction for the cobalt phases, meaning that the cobalt phases are probably not exfoliated. For manganese objects there are two types of behavior. The long-term stirring of PH-MnO2 in the TBAOH solution followed by a restacking step do not induce further exfoliation, and the coherent domains remain unchanged around 25 nm (Table 1). On the other hand, VH-MnO2 and HTH-MnO2 exhibit smaller coherent domains in the final restacked materials (12 nm and 119 nm for the precursors versus 8 nm and 28 or 37 nm after the restacking, respectively), meaning that in this case there is a real exfoliation of MnO2 crystallites.
| Sample | Size of the coherent domains of Mn oxide calculated from the (00l) reflection peak (nm) | Size of the coherent domains of Co oxyhydroxide calculated from the (00l) reflection peak (nm) |
|---|---|---|
| VH-MnO2/β3-pH14 | 8–(12) | 9–(10) |
| PH-MnO2/β3-pH14 | 25–(25) | 10–(10) |
| HTH-MnO2/β3-pH14 | 28–(119) | 9–(10) |
| VH-MnO2/β3-pH↗ | 8–(12) | 3–(3) |
| PH-MnO2/β3-pH↗ | 25–(25) | 3–(3) |
| HTH-MnO2/β3-pH↗ | 37–(119) | 3–(3) |
3.2 Specific surface area of the precursors and the restacked composites
These conclusions are supported by the evolution of materials' specific surface area (SSA) obtained from BET measurements (Fig. 3 and S2†). The increase of the SSA of restacked materials containing VH-MnO2 and HTH-MnO2 (VH-MnO2/β3-pH14, VH-MnO2/β3-pH↗, HTH-MnO2/β3-pH14 and HTH-MnO2/β3-pH↗) as compared to the SSA of initial precursors confirms the exfoliation of these two manganese precursors during the synthesis (Fig. 3). For instance, the SSA of VH-MnO2/β3-pH14 reaches 121 m2 g−1 whereas those of VH-MnO2 and β3-pH14 are only 85 m2 g−1 and 77 m2 g−1 respectively. Similarly, the restacked HTH-MnO2/β3-pH↗ composite displays a SSA of 106 m2 g−1 whereas a simple mixing of both precursors with a ratio HTH-MnO2![[thin space (1/6-em)]](https://www.rsc.org/images/entities/char_2009.gif) :
:![[thin space (1/6-em)]](https://www.rsc.org/images/entities/char_2009.gif) β3-pH↗ of 3
β3-pH↗ of 3![[thin space (1/6-em)]](https://www.rsc.org/images/entities/char_2009.gif) :
:![[thin space (1/6-em)]](https://www.rsc.org/images/entities/char_2009.gif) 1 would theoretically give a composite with SSA of only 53.5 m2 g−1 (¾ × 18 + ¼ × 160 = 53.5 m2 g−1). On the other hand, there is no significant and unexpected change in the specific surface area between PH-MnO2 and the restacked PH-MnO2/β3-pH14 and PH-MnO2/β3-pH↗ (Fig. 3) which supports that PH-MnO2 is not exfoliated. The larger SSA for PH-MnO2/β3-pH↗ compared to PH-MnO2 (82 m2 g−1vs. 60 m2 g−1) is due to the high specific surface area of the β3-pH↗ cobalt oxyhydroxide, present with a molar ratio of 25% in the composite material. Finally, by comparing the SSA of the different composites, it clearly appears that those built with manganese oxides possessing a veil morphology, VH-MnO2, exhibit the largest specific surface areas within the series and present higher mesoporosity (Fig. S3†).
1 would theoretically give a composite with SSA of only 53.5 m2 g−1 (¾ × 18 + ¼ × 160 = 53.5 m2 g−1). On the other hand, there is no significant and unexpected change in the specific surface area between PH-MnO2 and the restacked PH-MnO2/β3-pH14 and PH-MnO2/β3-pH↗ (Fig. 3) which supports that PH-MnO2 is not exfoliated. The larger SSA for PH-MnO2/β3-pH↗ compared to PH-MnO2 (82 m2 g−1vs. 60 m2 g−1) is due to the high specific surface area of the β3-pH↗ cobalt oxyhydroxide, present with a molar ratio of 25% in the composite material. Finally, by comparing the SSA of the different composites, it clearly appears that those built with manganese oxides possessing a veil morphology, VH-MnO2, exhibit the largest specific surface areas within the series and present higher mesoporosity (Fig. S3†).
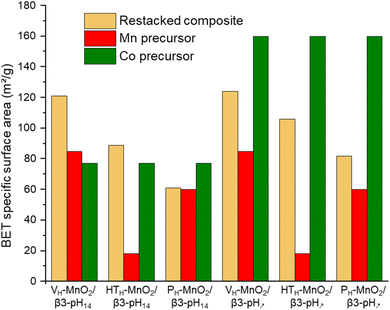 | ||
| Fig. 3 A comparison of the specific surface area of the six different composites (in beige) with their manganese and cobalt precursors (in red and green respectively). | ||
3.3 Morphology of the restacked materials compared to their precursors
In parallel to the structural investigation, a microscopic study was performed to characterize the particle shape and size of all the manganese and cobalt precursors (Fig. 4) and evaluate the impact of the different exfoliation/restacking processes on the obtained composites (Fig. 5).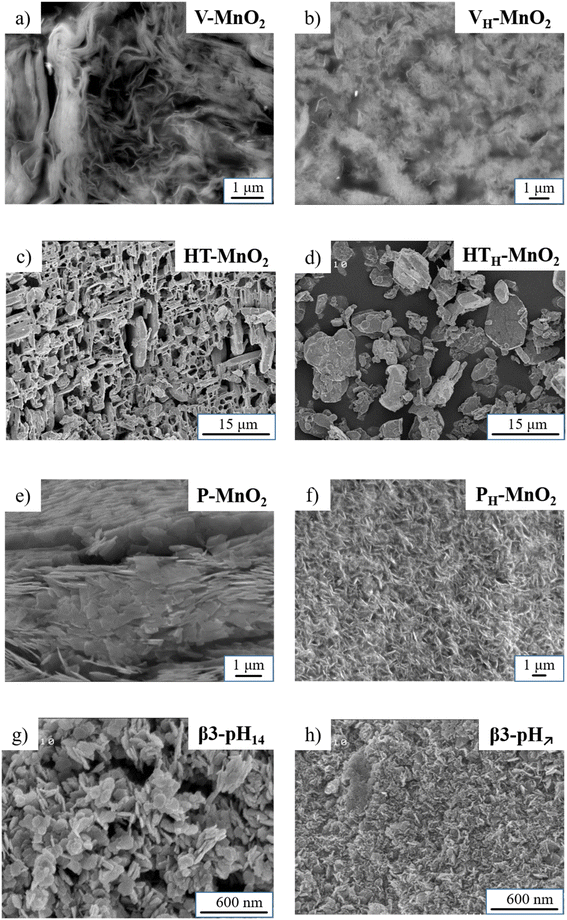 | ||
| Fig. 4 SEM images of the various manganese oxides (a) V-MnO2, (b) VH-MnO2, (c) HT-MnO2, (d) HTH-MnO2, (e) P-MnO2, and (f) PH-MnO2 and cobalt oxyhydroxide precursors (g) β3-pH14, and (h) β3-pH↗. | ||
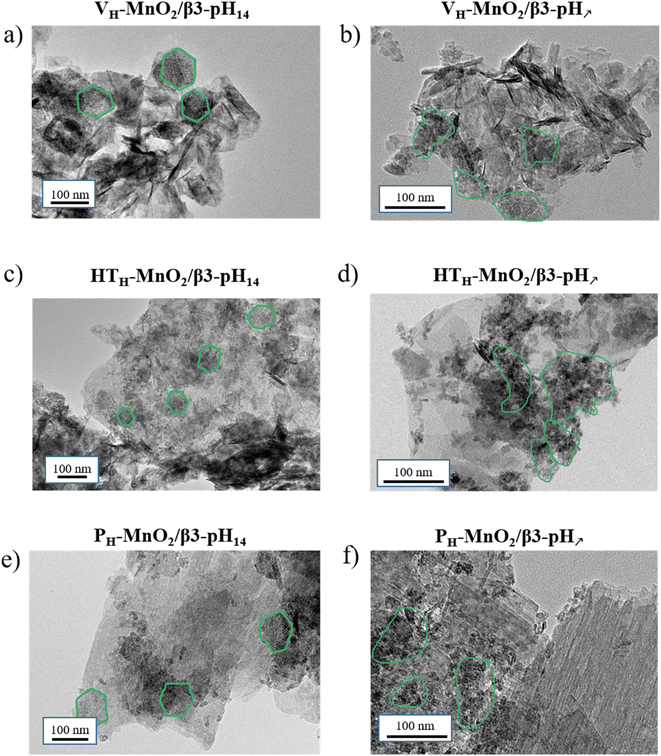 | ||
| Fig. 5 TEM images of the various restacked materials (a) VH-MnO2/β3-pH14, (b) VH-MnO2/β3-pH↗, (c) HTH-MnO2/β3-pH14, (d) HTH-MnO2/β3-pH↗, (e) PH-MnO2/β3-pH14, and (f) PH-MnO2/β3-pH↗. | ||
The SEM image of V-MnO2 (Fig. 4a) shows that the material is composed of randomly aggregated veils with a size estimated around few micrometers wide and a thickness of several tens of nanometers. After protonation, the veil morphology is preserved for VH-MnO2 but its size is reduced down to 1 μm (Fig. 4b). The acidic treatment probably leads to breakage and/or dispersion of the veils, which consequently decrease their size.
The other two birnessites HT-MnO2 and P-MnO2 are composed of platelets. HT-MnO2 is characterized by a 3D network of interconnected platelets that are 1–2 μm thick and 10 μm wide, leading to large cavities within the material (Fig. 4c). The protonation does not influence the platelet's size or morphology. On the other hand, the 3D network disappears and the platelets are found disconnected and isolated from each other (Fig. 4d). Finally, the SEM image of P-MnO2 (Fig. 4e) displays a stacking of platelets that are globally smaller and thinner than for HT-MnO2 and measuring around 1 μm wide. After the protonation step, the platelets of PH-MnO2 (Fig. 4f) appear smaller both in width and in thickness, which is in good agreement with the exfoliation deduced previously from the decrease of coherent domain sizes and the possible particle erosion in the acid medium.
The two cobalt oxyhydroxide precursors β3-pH14 and β3-pH↗ possess a platelet morphology but a different particle size. β3-pH14 is characterized by randomly aggregated and well-defined hexagonal platelets measuring 60–100 nm wide (Fig. 4g) whereas they are less defined and around 20–30 nm for β3-pH↗ (Fig. 4h).
After the exfoliation/restacking processes, transmission electron microscopy (TEM) images clearly demonstrate that all the composites are characterized by a mixture of particles presenting similar morphologies to those of their corresponding protonated precursors (Fig. 5). TEM images of the three composites obtained with β3-pH14 (Fig. 5a, c and e) clearly display the hexagonal platelets of β3-pH14 (surrounded in green) measuring approximately 60–90 nm. In parallel, clusters of small platelets measuring around 20–30 nm and characteristic of β3-pH↗ can also be identified (green color) for the three other composites in Fig. 5b, d and f. In Fig. 5a and b, veils of VH-MnO2 can be distinguished but the evaluation of their size is difficult especially because the veils are rolling up on themselves and are heterogeneous in size (from tens to several hundreds of nanometers wide). Nevertheless, the presence of very small and thin particles after restacking suggests that VH-MnO2 was exfoliated as previously mentioned.
Finally, platelet-shaped particles of HTH-MnO2 and PH-MnO2 precursors can be identified in HTH-MnO2/β3-pH14//HTH-MnO2/β3-pH↗ (Fig. 5c and d) and PH-MnO2/β3-pH14//PH-MnO2/β3-pH↗ (Fig. 5e and f) composites respectively. However, the primary particles of HTH-MnO2 appear thinner and smaller in the restacked composites compared to those observed for HTH-MnO2 before restacking (Fig. 4d), supporting that an exfoliation occurred. On the other hand, the platelets of PH-MnO2, which measure 500–600 nm wide, maintain the same size. To summarize, the morphology of the cobalt and manganese primary particle precursors is maintained within the restacked materials and the evolution of the particle size is in good agreement with the observations made from the evolution of coherent domains and specific surface areas. HTH-MnO2 and VH-MnO2 were exfoliated during the synthesis of composites whereas the primary platelets of PH-MnO2, β3-pH14 and β3-pH↗ were just dispersed.
3.4 Study of the distribution of the Mn and Co objects within the restacked composites using Auger spectroscopy
After evaluating the size and shape of primary particles before and after restacking, nano-Auger analyses were performed to get information on the distribution scale of the Mn and Co objects within the aggregates. For that, SEM images, AES spectra and SAM images (elemental 2D distribution) were acquired on cross sections of the composites as prepared by ion milling and are presented in Fig. 6 and S4–S6.† The nanometric probe size for AES (20 nm wide and 3 nm deep, i.e. about 30 nm spatial resolution for SAM images) gives the possibility to determine if the composites are assembled at the nanometric scale by the simultaneous presence of Mn and Co transitions in the Auger spectrum.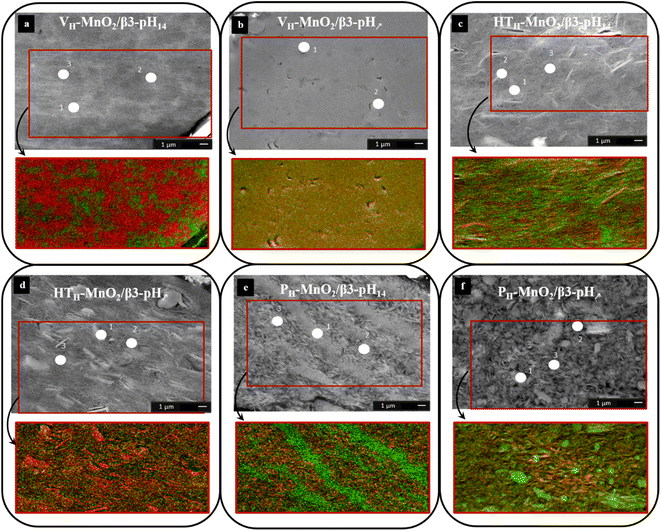 | ||
| Fig. 6 SEM image and SAM image (Mn in red and Co in green) of (a) VH-MnO2/β3-pH14, (b) VH-MnO2/β3-pH↗, (c) HTH-MnO2/β3-pH14, (d) HTH-MnO2/β3-pH↗, (e) PH-MnO2/β3-pH14 and (f) PH-MnO2/β3-pH↗. | ||
For the two composites based on the VH-MnO2 material (Fig. 6), the SEM images show a very different structure in the bulk of the aggregates. For the restacked VH-MnO2/β3-pH14 material (Fig. 6a), two shades of grey are observed while for the VH-MnO2/β3-pH↗ material (Fig. 6b) the bulk structure is more uniform. For both samples, the porosity seems low and relatively homogeneous while the manganese or cobalt particles are not visible.
For VH-MnO2/β3-pH14 (Fig. 6a), the analysis points performed in the brighter areas (points 1 and 2) show the presence of the Mn LMM and the Co LMM transitions (Fig. S4†). On the other hand, for the analysis point 3, there is only the Mn LMM transition. The SAM image (Fig. 6a) confirms the results obtained with the Auger spectra by the presence of Mn rich domains in red and Co rich domains in green. Each domain measures few micrometers and Mn-rich areas appear larger than Co ones due to the higher amount of manganese in the composite (molar ratio Mn![[thin space (1/6-em)]](https://www.rsc.org/images/entities/char_2009.gif) :
:![[thin space (1/6-em)]](https://www.rsc.org/images/entities/char_2009.gif) Co = 3). For VH-MnO2/β3-pH↗, the Auger spectra show the simultaneous presence of the Mn LMM and Co LMM transitions (points 1 and 2) (Fig. S4†). Concerning the SAM image (Fig. 6b), there is no visible domain and the totality of the image is yellow, which corresponds to the mixture of red (Mn) and green (Co) suggesting a very homogeneous distribution at the nanoscale.
Co = 3). For VH-MnO2/β3-pH↗, the Auger spectra show the simultaneous presence of the Mn LMM and Co LMM transitions (points 1 and 2) (Fig. S4†). Concerning the SAM image (Fig. 6b), there is no visible domain and the totality of the image is yellow, which corresponds to the mixture of red (Mn) and green (Co) suggesting a very homogeneous distribution at the nanoscale.
For the two composites obtained with HTH-MnO2, HTH-MnO2/β3-pH14 (Fig. 6c) and HTH-MnO2/β3-pH↗ (Fig. 6d), the manganese oxide platelets of several micrometers wide are clearly visible in the SEM images. Probably due to the huge difference in the particle size between Co and Mn objects leading to less compact stacking, the SEM images suggest a higher macroporosity within the composites than for those with VH-MnO2 (Fig. 6a and b). Auger spectra obtained for the HTH-MnO2/β3-pH14 composite on brighter areas/platelets at points 1 and 2 show the presence of mainly Mn LMM transitions while Co LMM transitions are barely visible or even absent (Fig. S5†). On the other hand, the analysis at point 3, performed on a dark grey area that looks like the β3-pH14 material, shows the simultaneous presence of Mn LMM and Co LMM transitions. Considering the analysis depth of 3 nm, it means that manganese oxide platelets can be probed below β3-pH14. The same observations/conclusions are obtained for the HTH-MnO2/β3-pH↗ composite from the SEM image and Auger spectra (Fig. S5†). SAM images for both composites clearly expose HTH-MnO2 platelets in red or with some yellow part corresponding to the presence of both manganese and cobalt (Fig. 6c and d). The cobalt represented by green color is also detected rather homogeneously on the whole samples.
For the last two composites obtained with PH-MnO2, the bulk structure is very different. PH-MnO2/β3-pH14 differs completely from the other restacked materials when focusing on the distribution of the Mn and Co objects that make the composites. The SEM image (Fig. 6e) shows “line shape” domains extending over several micrometers that correspond solely to PH-MnO2 or β3-pH14, as highlighted in the mapping with well-defined red and green areas. The Auger spectra support this heterogeneous distribution of Mn and Co objects. Only Co LMM transitions are detected at point 1 whereas the Auger spectra at points 2 and 3 highlight only the presence of Mn LMM transitions (Fig. S6†). SAM (Fig. 6e) reveals the absence of areas containing both Mn and Co objects (yellow color).
On the other hand, such consequent heterogeneities between cobalt and manganese phases are not observed for PH-MnO2/β3-pH↗ and the SEM image (Fig. 6f) shows only platelets arranged with random orientation. The AES spectra of points 1 and 2 show the simultaneous presence of the Mn LMM and Co LMM transitions with a higher intensity of the Co LMM transitions than for Mn LMM transitions (Fig. S6†). On the other hand, in the spectrum of point 3, only the Mn LMM transitions are visible. The SAM image of this sample highlights the fact that Mn and Co are not present in the whole sample (Fig. S6†).
To summarize, the six composites obtained and analysed have each a different arrangement between the Co and Mn objects depending on the morphology of the precursors. PH-MnO2/β3-pH14 clearly shows that the manganese and cobalt objects are not well mixed. It presents the worst distribution homogeneity within the series and is considered as a simple composite. Then, VH-MnO2/β3-pH14, PH-MnO2/β3-pH↗, HTH-MnO2/β3-pH14 and HTH-MnO2/β3-pH↗ seem to show similar distribution of the objects at both micro and nano scales. All these composites possess areas where both cobalt and manganese were simultaneously detected and other areas where only manganese is present. These four compounds are thus defined as micro-composites. Finally, VH-MnO2/β3-pH↗ definitely reveals the best distribution homogeneity between the Co and Mn objects at the nanoscale and is considered as a nano-composite. Thus, combining the BET surface area results with the observations made by nano-Auger analysis, VH-MnO2/β3-pH↗ stands out from the others due to its distribution of Co and Mn objects at the nanoscale, and its high mesoporosity and specific surface area. It will be thus very interesting to compare its energy storage performance to the other composites of the series.
3.5 Electrochemical behaviour and performances
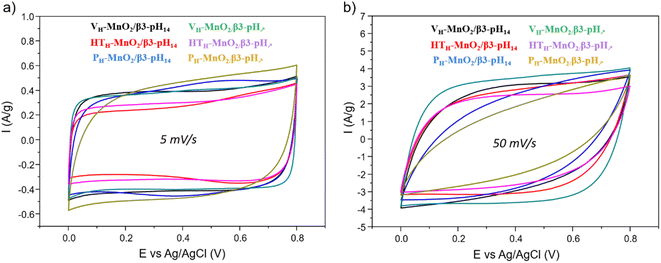
To investigate the impact of the precursor's morphology on the energy storage performance of restacked materials, cyclic voltammetry, galvanostatic charge/discharge and impedance spectroscopy measurements were performed on electrodes with an active mass loading of ∼10 mg cm−2. The voltammograms recorded at 5 mV s−1 for all composites (Fig. 7a) show a rectangular shape characteristic of a pseudocapacitive behavior, such as for protonated manganese oxides and contrary to the initial MnO2 compounds that show redox peaks (Fig. S7†), usually attributed to the intercalation/deintercalation of alkali ions. Those redox peaks disappear after protonation because most probably the H+ ions, localized in tetragonal sites near from the manganese oxide slabs, are not exchangeable and prevent the intercalation of the alkali ions.41,42At 50 mV s−1 (Fig. 7b), VH-MnO2/β3-pH↗ stands out from the other restacked materials by maintaining a very rectangular shape whereas the CV profile of the other composites becomes elliptic, especially for PH-MnO2/β3-pH↗ and PH-MnO2/β3-pH↗. These comparisons suggest that at high sweep rates, the VH-MnO2/β3-pH↗ nano-composite possesses the lowest resistivity among the composite series. This can be correlated with the observations made by microscopy and especially by nano-Auger, which reveal that, contrary to the other restacked materials that are composites or micro composites, only VH-MnO2/β3-pH↗ is a nanocomposite with a homogeneous distribution of Co and Mn objects at the nanoscale. The closer interaction between pseudocapacitive VH-MnO2 and electronic conductor β3-pH↗ in VH-MnO2/β3-pH↗ results in a more efficient synergy leading to a less resistive behavior at high scan rates (Fig. 7b).
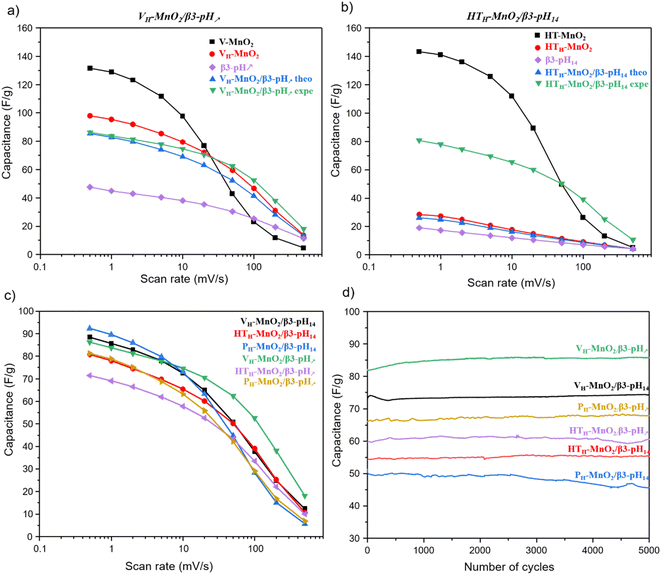
First, in order to show the interest of making restacked composite materials, it is relevant to compare their performance to those of their precursors. We can clearly see that in K2SO4 electrolyte, the electrochemical activity of MnO2 is much higher than that of HxCoO2. Additionally, in all composites MnO2 is 3 times more than HxCoO2. Thus, HxCoO2 is mainly likely to bring electrical conductivity while its contribution to charge storage is very limited in the composite. The whole manganese oxide precursors exhibit a similar variation of capacity as a function of rate (Fig. 8a, b and Fig. S7†). At low scan rates, the capacities overcome 100 F g−1 before strongly decreasing beyond 20 mV s−1. Indeed, the faradaic charge storage mechanism, predominant at low rates, is kinetically limited at higher rates, where capacitive storage is favored. Compared to these alkaline manganese oxide precursors, the composites including VH-MnO2, as well as for the HTH-MnO2/β3-pH14, exhibit at high rate a higher specific capacity (green curve), which justifies the interest in these composites. On the contrary, it is not the case for the composites based on the PH-MnO2 precursor with platelet morphology, nor for the HTH-MnO2/β3-pH↗ material, where all three exhibit a capacity lower than that of the Mn precursors, whatever the rate. Additionally, it is important to note that, whatever the rate, all the composites present better experimental capacities than the theoretical ones, calculated considering the weighted average capacity of Co and Mn precursors (see Fig. S8† for more details). These results clearly prove a real synergy effect between both phases within the composites.
The comparison of rate capability performance within the series of restacked materials (Fig. 8c) shows that, at the lowest scan rate, the capacities stay in the range 72–94 F g−1; the relative differences between the most performing materials, i.e. the composites based on a Mn precursor with veil morphology and PH-MnO2/β3-pH14, are not really significant. On the contrary, the behavior of VH-MnO2/β3-pH↗ is clearly outstanding at higher sweep rates, with a capacity that is twice that observed for the other composites at 200 mV s−1. In the performance order at high rates, VH-MnO2/β3-pH↗ is above VH-MnO2/β3-pH14 and the composites containing HTH-MnO2 precursors that are comparable and finally the composites based on the PH-MnO2 precursor with platelet morphology possess the worst performance. The decreasing order of the capacities seems to follow the decreasing evolution of the specific surface areas with the PH-MnO2/β3-pH14 and PH-MnO2/β3-pH↗ composites exhibiting the lowest SSA with 61 and 82 m2 g−1 respectively, and exhibiting the most inhomogeneous distribution of the 2 components. Although the different composites display various rate capabilities, no capacity loss is observed after 5000 cycles for all of them, which reveals that the association of cobalt oxyhydroxide and manganese oxide within a composite via an exfoliation/restacking process leads to stable materials during electrochemical cycling in K2SO4, thanks to a good cohesion between the objects, whose morphologies do not affect the stability (Fig. 8d). It should be noted that, as shown in a previous study reported by Tang et al.,28 a simple mixture between the precursors did not lead to an optimal cohesion, entailing thus a capacity drop from the first 100 cycles, which is completely avoided by using composites prepared by exfoliation/restacking.
It can therefore be concluded that the very homogeneous organization of the Mn and Co objects at the nanoscale, previously evidenced by nano-Auger analysis, its mesoporosity as well as its highest specific surface area allow VH-MnO2/β3-pH↗ to reach the best performance among the other studied composites.
In order to confirm the influence of the morphology and of the distribution scale homogeneity of the objects contained in the restacked materials, an electrochemical impedance spectroscopy study has been carried out on the VH-MnO2/β3-pH↗ nanocomposite, presenting the rate capability performance, in comparison with the HTH-MnO2/β3-pH14 microcomposite, whose capacity is just lower at high rates.
The spectra and fitted data according to the equivalent circuit presented Fig. S9† show similar values for all the working potentials as presented in ESI Fig. S10 and Table S3.† In the manuscript, only the spectra at 0.3 V are presented in Fig. 9 for clarity. The potential variation has no influence on the loop of the spectra at high frequencies (Fig. S10†), which allows the resistance R2 characterized by a semi-circle to be attributed to the electric percolation within the material. This weaker resistance observed for VH-MnO2/β3-pH↗ compared to HTH-MnO2/β3-pH14 (3.4 Ohm against 4.2 Ohm) reveals a better percolation between the grains for the former material, as it was expected due to a better homogeneity between Co and Mn objects. Indeed, the veil morphology of the Mn objects is likely to wrap up as much as possible the Co oxyhydroxide platelets, leading therefore to an optimal interaction promoting the electron transfer in VH-MnO2/β3-pH↗. Regarding the ionic diffusion, the S2 impedance is also lower for VH-MnO2/β3-pH↗.
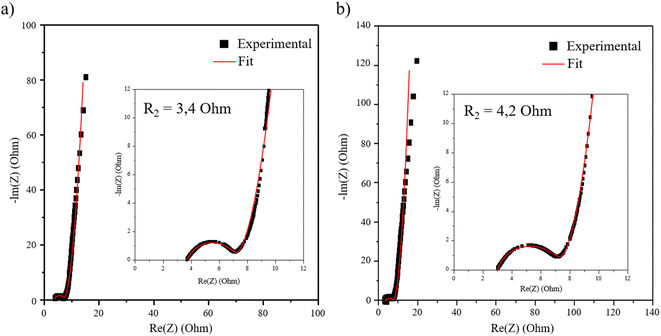 | ||
| Fig. 9 Nyquist plots of the restacked materials (a) VH-MnO2/β3-pH↗ and (b) HTH-MnO2/β3-pH14 at 0.3 V. | ||
4 Conclusion
This work was focused on the influence of the morphology of composites synthesized by exfoliation/restacking of cobalt oxyhydroxides and birnessite manganese dioxides on their electrochemical properties. Starting from birnessite phases with different morphologies (veils, nanoplatelets and microplatelets) and 2 cobalt oxyhydroxides (platelets with different sizes), 6 different composites are obtained, with the same Mn![[thin space (1/6-em)]](https://www.rsc.org/images/entities/char_2009.gif) :
:![[thin space (1/6-em)]](https://www.rsc.org/images/entities/char_2009.gif) Co ratio fixed to 3
Co ratio fixed to 3![[thin space (1/6-em)]](https://www.rsc.org/images/entities/char_2009.gif) :
:![[thin space (1/6-em)]](https://www.rsc.org/images/entities/char_2009.gif) 1.
1.
Nano-Auger analysis turned out to be a key tool to identify the distribution scale of the Mn and Co objects within the restacked composites, depending on the morphology of the precursors and their interaction. The materials that are based on manganese oxide with platelet morphology appear as composites at the micrometric scale, and even beyond, with significant inhomogeneities when the Mn platelets are nanometric. On the other hand, the materials containing the manganese oxide component with veil morphology exhibit a very intimate mixture between the Co and Mn-based objects. The combination of the veil Mn morphology with the smallest nanoplatelets of cobalt oxyhydroxide allows obtaining the best distribution of the objects, leading to a nanocomposite. This material has the highest specific surface area among the composites (124 m2 g−1) and leads to the best capacitance, 84 F g−1 at 1 A g−1 after 5000 cycles for the electrode with 10 mg cm−2 mass loading. The EIS measurements show a lower resistance and a better inter-grain percolation for this material. The synergy between the conductive cobalt oxyhydroxide platelets and the pseudocapacitive manganese oxide veils is effective in this material.
Conflicts of interest
There are no conflicts to declare.Acknowledgements
The authors would like to thank AID as well as Bordeaux INP for financial support (PhD funding of R. I. and research fees). The authors also thank Région Nouvelle Aquitaine and the French National Research Agency (STORE-EX Labex Project ANR-10-LABX-76-01) for financial support and fruitful discussions. Many thanks to Catherine Denage, Emmanuel Petit, and Eric Lebraud for their help in the characterization of the samples by ICP, MEB and XRD.References
- J. Ma, Y. Li, N. S. Grundish, J. B. Goodenough, Y. Chen, L. Guo, Z. Peng, X. Qi, F. Yang, L. Qie, C.-A. Wang, B. Huang, Z. Huang, L. Chen, D. Su, G. Wang, X. Peng, Z. Chen, J. Yang, S. He, X. Zhang, H. Yu, C. Fu, M. Jiang, W. Deng, C.-F. Sun, Q. Pan, Y. Tang, X. Li, X. Ji, F. Wan, Z. Niu, F. Lian, C. Wang, G. G. Wallace, M. Fan, Q. Meng, S. Xin, Y.-G. Guo and L.-J. Wan, J. Phys. D: Appl. Phys., 2021, 54, 183001 CrossRef CAS.
- J. Amici, P. Asinari, E. Ayerbe, P. Barboux, P. Bayle-Guillemaud, R. J. Behm, M. Berecibar, E. Berg, A. Bhowmik, S. Bodoardo, I. E. Castelli, I. Cekic-Laskovic, R. Christensen, S. Clark, R. Diehm, R. Dominko, M. Fichtner, A. A. Franco, A. Grimaud, N. Guillet, M. Hahlin, S. Hartmann, V. Heiries, K. Hermansson, A. Heuer, S. Jana, L. Jabbour, J. Kallo, A. Latz, H. Lorrmann, O. M. Løvvik, S. Lyonnard, M. Meeus, E. Paillard, S. Perraud, T. Placke, C. Punckt, O. Raccurt, J. Ruhland, E. Sheridan, H. Stein, J. Tarascon, V. Trapp, T. Vegge, M. Weil, W. Wenzel, M. Winter, A. Wolf and K. Edström, Adv. Energy Mater., 2022, 2102785 CrossRef CAS.
- J. Janek and W. G. Zeier, Nat. Energy, 2016, 1, 1–4 Search PubMed.
- S. Liu, L. Kang, J. Zhang, S. C. Jun and Y. Yamauchi, ACS Energy Lett., 2021, 6, 4127–4154 CrossRef CAS.
- M. Yassine and D. Fabris, Energies, 2017, 10, 1340–1351 CrossRef.
- Y. Jiang and J. Liu, Energy Environ. Mater., 2019, 2, 30–37 CrossRef.
- Y. Gogotsi and R. M. Penner, ACS Nano, 2018, 12, 2081–2083 CrossRef CAS PubMed.
- S. Fleischmann, J. B. Mitchell, R. Wang, C. Zhan, D. Jiang, V. Presser and V. Augustyn, Chem. Rev., 2020, 120, 6738–6782 CrossRef CAS.
- C. Julien and A. Mauger, Nanomaterials, 2017, 7, 396 CrossRef.
- M. Huang, F. Li, F. Dong, Y. X. Zhang and L. L. Zhang, J. Mater. Chem. A, 2015, 3, 21380–21423 RSC.
- T. Brousse, P.-L. Taberna, O. Crosnier, R. Dugas, P. Guillemet, Y. Scudeller, Y. Zhou, F. Favier, D. Bélanger and P. Simon, J. Power Sources, 2007, 173, 633–641 CrossRef CAS.
- A. Boisset, L. Athouël, J. Jacquemin, P. Porion, T. Brousse and M. Anouti, J. Phys. Chem. C, 2013, 117, 7408–7422 CrossRef CAS.
- S. Zhu, W. Huo, X. Liu and Y. Zhang, Nanoscale Adv., 2020, 2, 37–54 RSC.
- S. Liu, L. Kang and S. C. Jun, Adv. Mater., 2021, 33, 1–40 Search PubMed.
- E. Pomerantseva, F. Bonaccorso, X. Feng, Y. Cui and Y. Gogotsi, Science, 2019, 366, eaan8285 CrossRef CAS.
- Y. Fu, X. Gao, D. Zha, J. Zhu, X. Ouyang and X. Wang, J. Mater. Chem. A, 2018, 6, 1601–1611 RSC.
- E. Eustache, C. Douard, R. Retoux, C. Lethien and T. Brousse, Adv. Energy Mater., 2015, 5, 3–7 Search PubMed.
- H. Liu, W. Gu, B. Luo, P. Fan, L. Liao, E. Tian, Y. Niu, J. Fu, Z. Wang, Y. Wu, G. Lv and L. Mei, Electrochim. Acta, 2018, 291, 31–40 CrossRef CAS.
- C. C. H. Tran, J. Santos-Peña and C. Damas, J. Phys. Chem. C, 2018, 122, 16–29 CrossRef CAS.
- H. Xia, X. Zhu, J. Liu, Q. Liu, S. Lan, Q. Zhang, X. Liu, J. K. Seo, T. Chen, L. Gu and Y. S. Meng, Nat. Commun., 2018, 9, 5100 CrossRef.
- Z.-H. Huang, Y. Song, D.-Y. Feng, Z. Sun, X. Sun and X.-X. Liu, ACS Nano, 2018, 12, 3557–3567 CrossRef CAS.
- D. Wu, X. Xie, Y. Zhang, D. Zhang, W. Du, X. Zhang and B. Wang, Front. Mater., 2020, 7, 1–16 CrossRef.
- Q.-Z. Zhang, D. Zhang, Z.-C. Miao, X.-L. Zhang and S.-L. Chou, Small, 2018, 14, 1702883 CrossRef.
- Z. Su, C. Yang, C. Xu, H. Wu, Z. Zhang, T. Liu, C. Zhang, Q. Yang, B. Li and F. Kang, J. Mater. Chem. A, 2013, 1, 12432 RSC.
- J. Kang, A. Hirata, L. Kang, X. Zhang, Y. Hou, L. Chen, C. Li, T. Fujita, K. Akagi and M. Chen, Angew. Chem., Int. Ed., 2013, 52, 1664–1667 CrossRef CAS.
- R. B. Rakhi, B. Ahmed, D. Anjum and H. N. Alshareef, ACS Appl. Mater. Interfaces, 2016, 8, 18806–18814 CrossRef CAS.
- S. Zhu, Q. Shan, F. Dong, Y. Zhang and L. Zhang, Gold Bull., 2017, 50, 61–68 CrossRef CAS.
- C. Tang, D. Giaume, F. Weill, N. Penin, M.-A. Dourges, H. Saadaoui and L. Guerlou-Demourgues, ACS Appl. Energy Mater., 2019, 2, 7832–7842 CrossRef CAS.
- R. Invernizzi, L. Guerlou-Demourgues, F. Weill, A. Lemoine, M.-A. Dourges, I. Baraille, D. Flahaut and J. Olchowka, Materials, 2021, 14, 2325 CrossRef CAS PubMed.
- A. Lemoine, R. Invernizzi, G. Salvato Vallverdu, L. Madec, J. Olchowka, L. Guerlou-Demourgues, I. Baraille and D. Flahaut, J. Phys. Chem. C, 2021, 125, 8570–8581 CrossRef CAS.
- C. Tang, PhD thesis, Université de Bordeaux, 2017.
- S. H. Kim, S. J. Kim and S. M. Oh, Chem. Mater., 1999, 11, 557–563 CrossRef CAS.
- Y. Omomo, T. Sasaki, L. Wang and M. Watanabe, J. Am. Chem. Soc., 2003, 125, 3568–3575 CrossRef CAS PubMed.
- S. Brunauer, P. H. Emmett and E. Teller, J. Am. Chem. Soc., 1938, 60, 309–319 CrossRef CAS.
- J. Olchowka, T. Tailliez, L. Bourgeois, M. A. Dourges and L. Guerlou-Demourgues, Nanoscale Adv., 2019, 1, 2240–2249 RSC.
- E. Silvester, A. Manceau and V. A. Drits, Am. Mineral., 1997, 82, 962–978 CAS.
- A.-C. Gaillot, D. Flot, V. A. Drits, A. Manceau, M. Burghammer and B. Lanson, Chem. Mater., 2003, 15, 4666–4678 CrossRef CAS.
- R. D. Shannon, Acta Crystallogr., Sect. A: Cryst. Phys., Diffr., Theor. Gen. Crystallogr., 1976, 32, 751–767 CrossRef.
- A. G. Volkov, S. Paula and D. W. Deamer, Bioelectrochem. Bioenerg., 1997, 42, 153–160 CrossRef CAS.
- S. Boyd, K. Ganeshan, W.-Y. Tsai, T. Wu, S. Saeed, D. Jiang, N. Balke, A. C. T. van Duin and V. Augustyn, Nat. Mater., 2021, 20, 1689–1694 CrossRef CAS PubMed.
- A. Manceau, B. Lanson and V. A. Drits, Geochim. Cosmochim. Acta, 2002, 66, 2639–2663 CrossRef CAS.
- A.-C. Gaillot, PhD thesis, Université Joseph Fourier – Grenoble I, 2002.
Footnote |
| † Electronic supplementary information (ESI) available. See DOI: https://doi.org/10.1039/d2na00616b |
| This journal is © The Royal Society of Chemistry 2022 |

