Lowering the C–H bond activation barrier of methane by means of SAC@Cu(111): periodic DFT investigations†
Meema
Bhati
 ab,
Jignesh
Dhumal
a and
Kavita
Joshi
 *ab
*ab
aPhysical and Materials Chemistry Division, CSIR-National Chemical Laboratory, Dr Homi Bhabha Road, Pashan, Pune – 411008, India
bAcademy of Scientific and Innovative Research (AcSIR), India. E-mail: k.joshi@ncl.res.in; kavita.p.joshi@gmail.com
First published on 11th November 2021
Abstract
Methane has long captured the world's attention for being the simplest yet one of the most notorious hydrocarbons. Exploring its potential to be converted into value-added products has raised compelling interest. In the present work, we have studied the efficiency of single-atom catalysts (SACs) for methane activation employing density functional theory (DFT). The climbing image-nudged elastic band (CI-NEB) method is used in tandem with the improved dimer (ID) method to determine the minimum energy pathway for the first C–H bond dissociation of methane. Our study reported that the transition-metal doped Cu(111) surfaces enhance the adsorption, activate the C–H bond, and reduce the activation barrier for first C–H bond cleavage of methane. The results suggest Ru-/Co-/Rh-doped Cu(111) as promising candidates for methane activation with a minimal activation barrier and a less endothermic reaction. For these SACs, the calculated activation barriers for the first C–H bond cleavage are 0.17 eV, 0.24 eV, and 0.26 eV respectively, which is substantially lower than 1.13 eV, the activation barrier for Cu(111).
1 Introduction
The Earth is home to rich reserves of methane, making it an attractive feedstock and a foremost competitor for the production of green fuel.1 The myriad occurrence of methane can be attributed to its stable nature. Its higher symmetry (Td) along with its closed shell electronic configuration, wide HOMO–LUMO gap (∼8.9 eV), and four stable C–H bonds (Ebd ≈ 4.5 eV), make it thermodynamically and kinetically stable at room temperature. Given the significant mass percentage of hydrogen (25.13%) in methane, it is widely used for hydrogen production.2 Steam methane reforming (SMR) and Fischer–Tropsch (FT) synthesis are widely used processes for the conversion of methane to hydrogen as well as to value-added products like methanol, formic acid, formaldehyde, higher hydrocarbons, and FT fuels. However, the stability of methane makes it resistant to both electrophilic and nucleophilic attack. For most methane conversion reactions, cleavage of the first C–H bond is the primary and the rate-limiting step. This motivates the rational design of a catalyst aiming at reducing the activation barrier for C–H bond dissociation. Planar and stepped nickel surfaces are the go-to catalysts used industrially in the aforementioned processes, primarily because Ni is procured at cheap rates and portrays excellent reactivity towards methane. The drawback of Ni catalysts is that they can completely dehydrogenate methane into carbon and hydrogen, which causes coking. Nullifying or preventing coking in methane conversion reactions is a challenging area of current research.3–5 The literature cites multiple theoretical and experimental studies across various catalyst classes discussing potent methane activation. For example, methane activation has been investigated on supported metal clusters,6 transition metal surfaces,7–13 binary and mixed-metal alloys,14–16 zeolites,17 metal–organic frameworks (MOFs),18 metal oxides,19–21 perovskites,22 and supported single-atom catalysts (SACs)23 to name but a few. Lately, SACs have emerged as a focal point in active research surrounding methane activation.19,22,24 Doping the base metal with a single atom increases the number of active sites on the surface, thus reducing the use of precious metals as traditional catalysts. SACs as an interesting catalyst class subtly modify the electronic structure of the base metal and the dopant itself. This unique alteration of properties is a consequence of changing the atomic environment and dopant-doped interaction. The Pt-doped rutile TiO2(110) catalyst (Eads = −0.62 eV, Eact = 0.15 eV)19 and Ag-doped CeO2(100) (Eads = −1.01 eV, Eact = 0.21 eV)20 have shown considerable activity in terms of bond length activation, adsorption energy, and activation barrier. Some other prominent examples from the literature are IrO2(110), which activates methane at low temperatures,25 IrO2 nanoparticles, which activate it at temperatures as low as 110 °C,26 and Pt@SrBO3(100) surfaces (where B = Ti, V, and Cr transition metals), which chemisorb methane dissociatively.22The work presented here is focused on the study of methane activation, in particular the adsorption, C–H bond elongation, and C–H bond dissociation over several M@Cu(111) catalysts. Transition state (TS) analysis is performed for potent SACs where the maximum bond elongation and adsorption are observed, using the CI-NEB and ID methods. The metal atom interacts weakly with the CH4 molecule if its d-orbitals are filled, whereas a strong interaction occurs when the d-orbitals are partially filled. Ru, Co, and Rh/Cu(111) show the foremost chemical reactivity towards methane dissociation, where the activation barrier is found to be much lower than that of the Cu(111) surface. Our calculations provide atomic level insights into the mechanism of methane activation on SACs, and identify Ru-/Co-/Rh-doped Cu(111) as potent catalysts for dissociation of the first C–H bond.
2 Computational details
Kohn–Sham formalism of density functional theory (DFT) is employed to carry out all the calculations. The projector augmented wave potential is used,27,28 with the Perdew–Burke–Ernzerhof (PBE)29 approximation for the exchange–correlation and generalized gradient approximation30 as implemented in the plane-wave, pseudopotential-based code, Vienna ab-initio simulation package (VASP).31–33 Within our framework, the calculated value of the lattice constant for Cu is found to be 3.62 Å, which is in close agreement with the experimental value of 3.61 Å.34 The atomic simulation environment (ASE)35 is used to cleave the Cu(111) surface. We substituted one of the Cu surface atoms with the dopant to model the specific SAC under investigation. We used a 3 × 3 × 4 supercell with a 5 × 5 × 1 Monkhorst–Pack grid resulting in 13 k-points in the IBZ for the primary screening of twenty-two SACs towards methane adsorption. The k-point convergence exercise was carried out by increasing the Monkhorst–Pack grid for each system. It was observed that the difference in energies was less than 4 meV per atom for every system. Ten potential candidates are then investigated for cleavage of the first C–H bond, in a 4 × 4 × 4 supercell with a 3 × 3 × 1 Monkhorst–Pack grid. Our calculations reported that a change in the system setup is not associated with any observable changes in adsorption energies and bond length activation. A vacuum of 24 Å is found to be sufficient to avoid interaction between adjacent images of the planes along the z-direction. The criteria of a force cutoff of 0.01 eV Å−1 on the unfixed atoms and the total energy convergence below 10−5 eV for each SCF cycle are employed for geometry optimization. The van der Waals corrections are applied to all the calculations as implemented in the DFT-D2 method.36 The adsorption energy (Eads) is calculated as, Eads = Eslab+methane − (Eslab + Emethane); where Eslab+methane is the energy of the system when methane is placed on the slab, Eslab is the energy of the bare slab, and Emethane is the energy of the methane molecule. A negative value of Eads indicates an exothermic chemisorption process. The methane decomposition (CH4 → CH3 + H) reaction is studied using the climbing image–nudged elastic band (CI-NEB) method37 and the improved dimer (ID) method38,39 and activation barriers are reported. Three images are considered for TS calculations using a force convergence of 0.1 eV Å−1. The transition state structure is confirmed through vibrational frequency analysis, and zero point energy (ZPE) correction is applied in all the cases. The projected density of states (pDOS) values are calculated with a denser k-mesh using LOBSTER40–43 to understand the site-specific adsorption pattern. Finally, Mulliken charges are calculated for all the atoms on the surface, providing insight into the quantitative charge transfer.3 Results and discussions
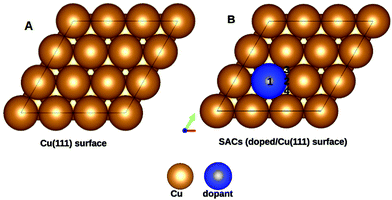
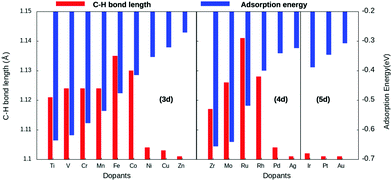
Copper is an economically viable resource, while its (111) facet is naturally abundant. Our choice of copper as the base metal largely revolved around the fact that it prevents over-oxidation of the products, shows improved selectivity, and is resistant to coking. Twenty-two dopants are doped on a Cu(111) model system. The dopants chosen are well studied and are known to form alloys with copper44. Therefore, the single-atom site was alloyed in the Cu(111) surface to create a single-atom catalyst (SAC). Eighteen of the dopants are transition metals, vis-a-vis, Ti, V, Cr, Mn, Fe, Co, Ni, and Zn of the 3d series; Zr, Mo, Tc, Ru, Rh, Pd, and Ag from the 4d series, and Ir, Pt, and Au belonging to the 5d series. The remaining four Al, Mg, Pb, and Bi are non-transition metals. SACs doped with non-transition metals do not show C–H bond activation and hence the results and discussions henceforth only include TM@Cu(111). Four unique adsorption sites are recognized for methane adsorption on the SACs, as shown in Fig. 1. The adsorption of methane on the SACs is analyzed based on elongation of the C–H bond, the variation in bond angles, alteration of the M–C bond length, and adsorption energies.The study revealed that the most stable adsorption site for methane on TM-doped SACs is on the top of the dopant atom. Furthermore, when placed at other sites, methane slides towards the dopant atom after structural optimization. Methane interacts with the partially filled d-bands of the dopant more effectively compared with the Cu atoms with a filled d-band. For all SACs, as we move from left to right on the periodic table, the adsorption energy decreases, as evident from Fig. 2. However, such a correlation is missing in the case of the C–H bond length elongation. Also, there is no visible one-to-one correlation between the adsorption energy and C–H bond elongation. On the other hand, the bond length elongation and activation energy are inversly proportional to each other. In physisorption, the electronic structure of the molecule is barely changed upon adsorption, and generally the adsorption energy is low (20 to 40 kJ mol−1 = 0.2 to 0.4 eV). Classification of the interaction of methane in terms of physisorption or chemisorption is carried out on the basis of its electronic structure upon adsorption as reflected in the pDOS along with its adsorption energy. For all the studied SACs, the range of adsorption energy varies from −0.32 eV to −0.74 eV, and the C–H bond length elongation scales from 1.101 Å to 1.141 Å as summarized in Table S1 (ESI†). Considering the metal–C bond length and the accompanying adsorption energy, we define physisorption within the energy range of −0.10 eV to −0.35 eV and chemisorption within an energy range from −0.35 eV and below, as shown in Fig. S1(A and B) (ESI†).
The adsorption energy decreases across the period with increasing metal–carbon bond length, as depicted in Fig. S1B (ESI†). Thus, methane–SAC interactions are dominated by the size, the electro-negativity, and the empty d-states of the dopant atom. Methane is physisorbed on late-transition metal-doped SACs, whereas it is chemisorbed on early-transition and mid-transition metal-doped SACs. Within this range of chemisorption, methane interacts relatively strongly with SACs doped with early-transition metals. This can be attributed to their lower electro-negativity, more empty d-bands, and the large atomic size of the dopant atom. Consequentially, the early-transition metals form metal carbides.45 Eight of the eighteen transition metal-doped SACs reported an elongation of about 3–5% for the C–H bond length compared with physisorption on the pure Cu(111) surface.
Next, we analyzed the pDOS of bare SACs and Cu(111) surfaces, explaining the increased charge transfer in the SACs for each of the dopant atoms. Copper, having its d-states filled, shifts towards a lower energy whereas the SACs with a partially empty d band lie near the Fermi level, as evident from the pDOS of the hybridized energy states shown in Fig. 3. Our observations are in line with the d-band center theory, which dictates that the systems with the d-band center lying near the Fermi level are catalytically more active.46 Once doped, there is charge redistribution on the surface atoms, reported via quantitative Mulliken charge analysis as mentioned in Table S2 (ESI†).
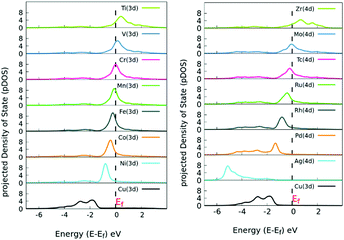 | ||
| Fig. 3 Site-specific pDOS of various TM-doped Cu(111) SACs. The pDOS for elements with a filled d band lie below the Fermi level, whereas the SACs with an incomplete d band lie near Fermi level. | ||
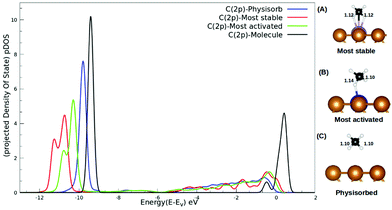
The interaction between methane and the SACs describing charge transfer from the surface to the methane molecule, as reported in Table S2 (ESI†), could be understood from the pDOS plotted with respect to the vacuum as shown in Fig. 4. For isolated methane, the C(2p) peak is sharp with a highest intensity. The C(2p) peak of physisorbed methane is similar in nature but with a reduced intensity. The C(2p) peak of chemisorbed methane is shown for two cases: the most activated one (Ru/Cu(111)) and the most stable one (Mo/Cu(111)). Not only does the peak intensity decrease in both the cases but broadening of the peak along with a secondary peak is evident in Fig. 4. In addition, our study reveals that the mid-transition doped SACs show more C–H bond activation.
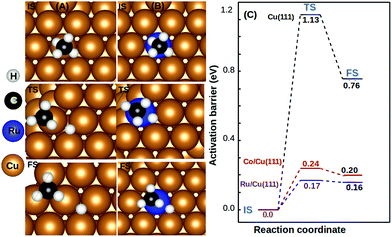
Cleavage of the first C–H bond in CH4 is the primary and rate-determining step for methane conversion towards more value-added products. The SACs which reported a bond elongation of about 3%–5% are selected to study the dissociative adsorption (DA) of methane. The dissociative adsorption of methane (CH3 + H) on the Cu(111) surface is found to be thermodynamically unfavorable, whereas it is favorable for the SACs. For all the cases studied, the dissociation of methane is an endothermic phenomenon, and the values are reported in Table 1.
| Dopant (TM1) | b C–H (Å) | b M–C (Å) | E ads (eV) | E act | E act (ZPC) | E rec (eV) |
|---|---|---|---|---|---|---|
| Cu | 1.103 | 3.0 | −0.34 | 1.32 | 1.13 | 0.73 |
| Ti | 1.121 | 2.51 | −0.63 | 0.51 | 0.32 | 0.06 |
| V | 1.124 | 2.46 | −0.61 | 1.33 | 1.14 | 0.22 |
| Fe | 1.135 | 2.45 | −0.47 | 0.67 | 0.48 | 0.11 |
| Co | 1.130 | 2.67 | −0.41 | 0.43 | 0.24 | 0.20 |
| Ni | 1.104 | 3.0 | −0.35 | 0.49 | 0.30 | 0.40 |
| Mo | 1.126 | 2.57 | −0.64 | 1.15 | 0.96 | 0.09 |
| Ru | 1.141 | 2.61 | −0.51 | 0.36 | 0.17 | 0.16 |
| Rh | 1.123 | 2.90 | −0.39 | 0.45 | 0.26 | 0.26 |
We observed that the lowest activation barrier is accompanied with the most elongated C–H bond. When methane adsorbed strongly, the activation barrier is higher as a result of the formation of a stable configuration (C–M–H sigma complex) as shown in Fig. 4A. Typical configurations of the IS, TS, and FS in the case of Cu(111) and TM@Cu(111) are shown in Fig. 5, and the relevant data are summarized in Table 1. The ZPE correction is important for the C–H bond due to its large vibrational frequency. The computed ZPE for all the SACs is in range of 0.187 to 0.191 eV, which is in agreement with the experimental (0.21 eV) value.47 Marcinkowski et al.48 reported the value for C–H bond activation on the Cu(111) surface of Eads −0.38 eV, with a reaction barrier of 1.4 eV, which is similar to our results Eads = −0.34 eV, Eact = 1.32 eV. Coiobica et al.49 reported that on the pure Ru(0001) surface the barrier for the first C–H bond dissociation is 0.88 eV (85 kJ mol−1) for physisorbed methane. Interestingly, we got a much smaller activation barrier 0.36 eV, for weakly chemisorbed methane on the Ru/Cu(111) SAC. The schematic representation of the methane dissociation reaction pathway, the bond length (C–H, Cu–H, Ru–C), activation energy, and reaction energy for the active catalyst is represented in Fig. 2 (ESI†). Taking into account the ZPE correction, Ru, Co, and Rh@Cu(111) have the lowest activation barrier. Furthermore, a fivefold reduction in the activation barrier is observed for these SACs compared with Cu(111). Thus, Ru, Co, and Rh/Cu(111) SACs are potent catalysts for the first C–H bond dissociation of methane.
4 Conclusion
Methane is one of the most sought after compounds as a rich source of hydrogen. However, for utilizing it effectively as a source of hydrogen one needs to tackle the C–H bond activation, which is the rate-limiting step. In this work, we have systematically investigated SACs doped with eighteen transition metals on a Cu(111) surface as potential candidates for methane activation. We found that on the eighth and ninth group transition-metal-doped surfaces, Fe, Co, Ru, and Rh possess strong C–H bond activation with a moderate adsorption energy and a low activation barrier. Interpreting our results, we infer no one-to-one relationship between the adsorption energy and the C–H bond elongation, whereas the inverse relationship is observed between bond elongation and the activation barrier. Our calculations suggest that Ru/Cu(111) is a potential SAC for methane activation, based on its overall structural stability, lower endothermic state, and lower activation barrier with a moderate adsorption energy. While Rh/Cu(111) stands as a promising candidate, we encourage further investigations into Co/Cu(111), given the cheaper cost of both the constituent metals than for the other SACs. The low chemical barrier can make methane molecules cleave at low temperatures. In light of practical applications, it would be desirable to investigate further steps for the integrated activation and conversion of methane, such as the source of hydrogen, the direct functionalization of methane, methanol formation, methylsulphonic acid (CH3SO3H) formation, halogenation, C–C coupling (higher hydrocarbons, aromatization) and various other unexplored avenues.Conflicts of interest
There are no conflicts to declare.Acknowledgements
The authors greatfully acknowledge CSIR-4PI for the computational facilities. MB thanks UGC for the research fellowship.References
- P. Schwach, X. Pan and X. Bao, Chem. Rev., 2017, 117, 8497–8520 CrossRef CAS
.
- H. F. Abbas and W. W. Daud, Int. J. Hydrogen Energy, 2010, 35, 1160–1190 CrossRef CAS
.
- M. D. Marcinkowski, M. T. Darby, J. Liu, J. M. Wimble, F. R. Lucci, S. Lee, A. Michaelides, M. Flytzani-Stephanopoulos, M. Stamatakis and E. C. H. Sykes, Nat. Chem., 2018, 10, 325 CrossRef CAS PubMed
.
- J. Niu, Y. Wang, S. E. Liland, S. K. Regli, J. Yang, K. R. Rout, J. Luo, M. Rønning, J. Ran and D. Chen, ACS Catal., 2021, 11, 2398–2411 CrossRef CAS
.
- N. Taccardi, M. Grabau, J. Debuschewitz, M. Distaso, M. Brandl, R. Hock, F. Maier, C. Papp, J. Erhard and C. Neiss, Nat. Chem., 2017, 9, 862–867 CrossRef CAS
.
- M.-S. Liao and Q.-E. Zhang, J. Mol. Catal. A: Chem., 1998, 136, 185–194 CrossRef CAS
.
- J. Harris, J. Simon, A. C. Luntz, C. B. Mullins and C. T. Rettner, Phys. Rev. Lett., 1991, 67, 652–655 CrossRef CAS
.
- B. S. Bunnik and G. J. Kramer, J. Catal., 2006, 242, 309–318 CrossRef CAS
.
- P. Bothra and S. K. Pati, Nanoscale, 2014, 6, 6738–6744 RSC
.
- S. Nave, A. K. Tiwari and B. Jackson, J. Chem. Phys., 2010, 132, 054705 CrossRef
.
- S. Nave and B. Jackson, J. Chem. Phys., 2009, 130, 054701 CrossRef PubMed
.
- T. Koitaya, A. Ishikawa, S. Yoshimoto and J. Yoshinobu, J. Phys. Chem. C, 2021, 125, 1368–1377 CrossRef CAS
.
- S. Roy, K. J. Nayanthara, N. Tiwari and A. K. Tiwari, Int. Rev. Phys. Chem., 2020, 39, 267–318 Search PubMed
.
- M. Ang, J. Miller, Y. Cui, L. Mo and S. Kawi, Catal. Sci. Technol., 2016, 6, 3394–3409 RSC
.
- J. Niu, J. Ran, X. Du, W. Qi, P. Zhang and L. Yang, Mol. Catal., 2017, 434, 206–218 CrossRef CAS
.
- S. Roy, S. Hariharan and A. K. Tiwari, J. Phys. Chem. C, 2018, 122, 10857–10870 CrossRef CAS
.
- A. A. Gabrienko, S. S. Arzumanov, A. V. Toktarev, I. G. Danilova, I. P. Prosvirin, V. V. Kriventsov, V. I. Zaikovskii, D. Freude and A. G. Stepanov, ACS Catal., 2017, 7, 1818–1830 CrossRef CAS
.
- A. S. Rosen, J. M. Notestein and R. Q. Snurr, ACS Catal., 2019, 9, 3576–3587 CrossRef CAS
.
- V. Fung, F. F. Tao and D.-E. Jiang, Phys. Chem. Chem. Phys., 2018, 20, 22909–22914 RSC
.
- G. Righi, R. Magri and A. Selloni, J. Phys. Chem. C, 2020, 124, 17578–17585 CrossRef CAS
.
- J. J. Varghese, Q. T. Trinh and S. H. Mushrif, Catal. Sci. Technol., 2016, 6, 3984–3996 RSC
.
- Q. Wan, V. Fung, S. Lin, Z. Wu and D.-E. Jiang, J. Mater. Chem. A, 2020, 8, 4362–4368 RSC
.
- X.-F. Yang, A. Wang, B. Qiao, J. Li, J. Liu and T. Zhang, Acc. Chem. Res., 2013, 46, 1740–1748 CrossRef CAS
.
- G. Righi, R. Magri and A. Selloni, J. Phys. Chem. C, 2020, 124, 17578–17585 CrossRef CAS
.
- Z. Liang, T. Li, M. Kim, A. Asthagiri and J. F. Weaver, Science, 2017, 356, 299–303 CrossRef CAS PubMed
.
- Y.-C. Liu, C.-H. Yeh, Y.-F. Lo, S. Nachimuthu, S. D. Lin and J.-C. Jiang, J. Catal., 2020, 385, 265–273 CrossRef CAS
.
- P. E. Blöchl, Phys. Rev. B: Condens. Matter Mater. Phys., 1994, 50, 17953 CrossRef PubMed
.
- G. Kresse and D. Joubert, Phys. Rev. B: Condens. Matter Mater. Phys., 1999, 59, 1758 CrossRef CAS
.
- J. P. Perdew, K. Burke and M. Ernzerhof, Phys. Rev. Lett., 1996, 77, 3865 CrossRef CAS
.
- J. P. Perdew, K. Burke and M. Ernzerhof, PRL, 1997, 78, 1396 CrossRef CAS
.
- G. Kresse and J. Hafner, Phys. Rev. B: Condens. Matter Mater. Phys., 1994, 49, 14251 CrossRef CAS
.
- G. Kresse and J. Furthmüller, Phys. Rev. B: Condens. Matter Mater. Phys., 1996, 54, 11169 CrossRef CAS
.
- G. Kresse and J. Furthmüller, Comput. Mater. Sci., 1996, 6, 15–50 CrossRef CAS
.
- M. Straumanis and L. Yu, Acta Crystallogr., Sect. A: Cryst. Phys., Diffr., Theor. Gen. Crystallogr., 1969, 25, 676–682 CrossRef CAS
.
- A. H. Larsen, J. J. Mortensen, J. Blomqvist, I. E. Castelli, R. Christensen, M. Dułak, J. Friis, M. N. Groves, B. Hammer and C. Hargus,
et al.
, J. Condens. Matter Phys., 2017, 29, 273002 CrossRef
.
- S. Grimme, J. Comput. Chem., 2006, 27, 1787–1799 CrossRef CAS
.
- G. Henkelman, B. P. Uberuaga and H. Jónsson, J. Chem. Phys., 2000, 113, 9901–9904 CrossRef CAS
.
- G. Henkelman and H. Jónsson, J. Chem. Phys., 2000, 113, 9978–9985 CrossRef CAS
.
- G. Henkelman and H. Jónsson, J. Chem. Phys., 1999, 111, 7010–7022 CrossRef CAS
.
- R. Dronskowski and P. E. Blöchl, J. Phys. Chem. A, 1993, 97, 8617–8624 CrossRef CAS
.
- V. L. Deringer, A. L. Tchougréeff and R. Dronskowski, J. Phys. Chem. A, 2011, 115, 5461–5466 CrossRef CAS PubMed
.
- S. Maintz, V. L. Deringer, A. L. Tchougréeff and R. Dronskowski, J. Comput. Chem., 2013, 34, 2557–2567 CrossRef CAS
.
- S. Maintz, V. L. Deringer, A. L. Tchougréeff and R. Dronskowski, J. Comput. Chem., 2016, 37, 1030–1035 CrossRef CAS
.
- F. Qin and W. Chen, Chem. Commun., 2021, 57, 2710–2723 RSC
.
- H. H. Hwu and J. G. Chen, Chem. Rev., 2005, 105, 185–212 CrossRef CAS PubMed
.
- J. K. Nørskov, F. Abild-Pedersen, F. Studt and T. Bligaard, Proc. Natl. Acad. Sci. U. S. A., 2011, 108, 937–943 CrossRef PubMed
.
-
G. Lendvay, in ed. S. H. Robertson, Classical trajectory studies of collisional energy transfer, Comprehensive Chemical Kinetics, Elsevier, 2019, vol. 43, pp. 109–272 Search PubMed
.
- M. D. Marcinkowski, M. T. Darby, J. Liu, J. M. Wimble, F. R. Lucci, S. Lee, A. Michaelides, M. Flytzani-Stephanopoulos, M. Stamatakis and E. C. H. Sykes, Nat. Chem., 2018, 10, 325–332 CrossRef CAS PubMed
.
- I. Ciobica, F. Frechard, R. Van Santen, A. Kleyn and J. Hafner, J. Phys. Chem., 2000, 104, 3364–3369 CrossRef CAS
.
Footnote |
| † Electronic supplementary information (ESI) available. See DOI: 10.1039/d1nj04525c |
| This journal is © The Royal Society of Chemistry and the Centre National de la Recherche Scientifique 2022 |

