
 Open Access Article
 This Open Access Article is licensed under a
 Creative Commons Attribution 3.0 Unported Licence
Silk fibroin films with embedded magnetic nanoparticles: evaluation of the magneto-mechanical stimulation effect on osteogenic differentiation of stem cells†
Lucia
Del Bianco‡
 *a,
Federico
Spizzo‡
a,
Yuejiao
Yang‡
b,
Gabriele
Greco
c,
Maria Laura
Gatto
d,
Gianni
Barucca
d,
Nicola M.
Pugno
ce and
Antonella
Motta
*b
*a,
Federico
Spizzo‡
a,
Yuejiao
Yang‡
b,
Gabriele
Greco
c,
Maria Laura
Gatto
d,
Gianni
Barucca
d,
Nicola M.
Pugno
ce and
Antonella
Motta
*b
aDepartment of Physics and Earth Science, University of Ferrara, I-44122 Ferrara, Italy. E-mail: lucia.delbianco@unife.it
bBIOtech Research Center, Department of Industrial Engineering, University of Trento, I-38123 Trento, Italy. E-mail: antonella.motta@unitn.it
cLaboratory for Bioinspired, Bionic, Nano, Meta, Materials & Mechanics, Department of Civil, Environmental and Mechanical Engineering, University of Trento, I-38123 Trento, Italy
dDepartment SIMAU, Università Politecnica delle Marche, I-60131 Ancona, Italy
eSchool of Engineering and Materials Science, Queen Mary University of London, Mile End Road, London E1 4NS, UK
First published on 23rd September 2022
Abstract
We report about a biomaterial in the form of film ∼10 μm thick, consisting of a silk fibroin matrix with embedded iron oxide superparamagnetic nanoparticles, for prospective applications as bioactive coating in regenerative medicine. Films with different load of magnetic nanoparticles are produced (nanoparticles/silk fibroin nominal ratio = 5, 0.5 and 0 wt%) and the structural, mechanical and magnetic properties are studied. The nanoparticles form aggregates in the silk fibroin matrix and the film stiffness, as tested by nanoindentation, is spatially inhomogeneous, but the protein structure is not altered. In vitro biological tests are carried out on human bone marrow-derived mesenchymal stem cells cultured on the films up to 21 days, with and without an applied static uniform magnetic field. The sample with the highest nanoparticles/silk fibroin ratio shows the best performance in terms of cell proliferation and adhesion. Moreover, it promotes a faster and better osteogenic differentiation, particularly under magnetic field, as indicated by the gene expression level of typical osteogenic markers. These findings are explained in light of the results of the physical characterization, combined with numerical calculations. It is established that the applied magnetic field triggers a virtuous magneto-mechanical mechanism in which dipolar magnetic forces between the nanoparticle aggregates give rise to a spatial distribution of mechanical stresses in the silk fibroin matrix. The film with the largest nanoparticle load, under cell culture conditions (i.e. in aqueous environment), undergoes matrix deformations large enough to be sensed by the seeded cells as mechanical stimuli favoring the osteogenic differentiation.
1. Introduction
The use of magnetic nanoparticles (NPs) in regenerative medicine is a thriving research field aimed at remotely manipulating cells and/or conditioning their behavior. For instance, cells labelled with magnetic NPs are efficiently seeded in scaffolds by applying magnetic forces that favor their adhesion, infiltration and distribution.1,2 Magnetic NPs attached to the cell membrane can be manipulated by an external magnetic field to deliver local forces to the cell itself and so activate specific mechanosensitive membrane receptors and ion channels, through a mechanotransduction process.3–5 The latter refers to the ability of cells to perceive mechanical stimuli from their physical environment and to convert them into biochemical signals that elicit specific cellular responses.6 Mechanical cues triggering a mechanotransduction mechanism can be mechanical forces imparted to the cells as well as the elasticity and topography of the substrate on which they are grown.7–10 Magnetically responsive materials, obtained by incorporating magnetic NPs in a biocompatible matrix, can be used as supports for cell transplantation, especially for bone tissue regeneration. It has been reported that scaffolds with magnetic functionality are able to attract, via magnetic driving, growth factors, stem cells or other bio-agents bound to magnetic carriers and can tune their release,11,12 possibly exploiting the ability of magnetic NPs to generate heat under an alternating magnetic field.13–15 Moreover, a beneficial influence of magnetic NPs-loaded scaffolds on adhesion, proliferation and differentiation of seeded cells has been observed.16–25 A proposed explanation relies on the positive effect of the magnetic field alone in stimulating the proliferation and differentiation of cells and thus suggests that a magnetic scaffold, subjected to an external magnetic field, produces a dipolar magnetic field that strengthens the action of the external one.19,21,25 However, this argument is invoked regardless of the NP concentration, which is highly variable (from less than 1 wt%19 to 50 wt%21), and of the value of the applied field, which can be very low (below 1 kA m−1![[thin space (1/6-em)]](https://www.rsc.org/images/entities/char_2009.gif) 16,19) or reach the order of magnitude of 102 kA m−1.21,22 Oddly, a similar explanation is also given when no magnetic field is applied and the NPs show superparamagnetic relaxation at room temperature.17,18,20,23 The superparamagnetic behavior implies that the NP magnetic moments align to a certain extent with an external magnetic field, depending on its intensity. However, in the absence of field, thermal fluctuations readily flip the moments along different orientations and therefore the NPs are not permanently magnetized.13,14,26 A different strategy aims at the creation of materials embedding magnetic NPs that respond to an external magnetic field causing alterations in the mechanical state of the hosting matrix. This activates a mechanotransduction mechanism and hence, in most cases, angiogenic and osteogenic processes.27–38 Usually, these composites are used for realizing three-dimensional scaffolds, but a strategic goal is also to model them in the form of films to coat the surface of bone and dental implants.39–41 The difficulty in precisely determining the mechanism of this magneto-mechanical stimulation is openly admitted in the current literature. This may be due to the fact that, in general, the stimulation effect is deduced only on the basis of the cellular response and not evaluated also based on the knowledge of the physical properties of the material. Indeed, magnetically responsive materials have been produced using a variety of matrices with different mechanical stiffness: synthetic polymers (polylactide, poly lactic-co-glycolic acid, polycaprolactone),27–32 biopolymers (chitosan, alginate, starch, collagen, silk),33–35,39,42 polymers in the form of hydrogels.36–38,43 Static27–29,32,36,37,39,40,41 or time-varying magnetic fields33,34 have been applied to test the behavior of the seeded cells, with intensity varying in the 100–102 kA m−1 range (the distinction between a uniform field and a field gradient is seldom pointed out). Experimental evidence of a magnetically actuated modulation of the mechanical properties of NPs-loaded materials has been obtained in just a few cases27,33,38,43 and the problem of numerically estimating the strength of the mechanical forces potentially acting on the seeded cells, following the material deformation, is very rarely addressed.33,43
16,19) or reach the order of magnitude of 102 kA m−1.21,22 Oddly, a similar explanation is also given when no magnetic field is applied and the NPs show superparamagnetic relaxation at room temperature.17,18,20,23 The superparamagnetic behavior implies that the NP magnetic moments align to a certain extent with an external magnetic field, depending on its intensity. However, in the absence of field, thermal fluctuations readily flip the moments along different orientations and therefore the NPs are not permanently magnetized.13,14,26 A different strategy aims at the creation of materials embedding magnetic NPs that respond to an external magnetic field causing alterations in the mechanical state of the hosting matrix. This activates a mechanotransduction mechanism and hence, in most cases, angiogenic and osteogenic processes.27–38 Usually, these composites are used for realizing three-dimensional scaffolds, but a strategic goal is also to model them in the form of films to coat the surface of bone and dental implants.39–41 The difficulty in precisely determining the mechanism of this magneto-mechanical stimulation is openly admitted in the current literature. This may be due to the fact that, in general, the stimulation effect is deduced only on the basis of the cellular response and not evaluated also based on the knowledge of the physical properties of the material. Indeed, magnetically responsive materials have been produced using a variety of matrices with different mechanical stiffness: synthetic polymers (polylactide, poly lactic-co-glycolic acid, polycaprolactone),27–32 biopolymers (chitosan, alginate, starch, collagen, silk),33–35,39,42 polymers in the form of hydrogels.36–38,43 Static27–29,32,36,37,39,40,41 or time-varying magnetic fields33,34 have been applied to test the behavior of the seeded cells, with intensity varying in the 100–102 kA m−1 range (the distinction between a uniform field and a field gradient is seldom pointed out). Experimental evidence of a magnetically actuated modulation of the mechanical properties of NPs-loaded materials has been obtained in just a few cases27,33,38,43 and the problem of numerically estimating the strength of the mechanical forces potentially acting on the seeded cells, following the material deformation, is very rarely addressed.33,43
In this context, here we report about silk fibroin films (thickness ∼ 10 μm) loaded with superparamagnetic iron oxide NPs, which are among the few inorganic nanosystems approved by the U.S. Food and Drug Administration for use in human patients.44 Tissue engineering using silk-based biomaterials is receiving increasing interest.45,46 This is because silk protein fibroin possesses high biocompatibility with low inflammatory and immunogenic responses, tunable biodegradability and mechanical strength, permeability to water and oxygen and can be modeled into various morphologies such as scaffolds, fibers, films, gels.10,47,48 Only a few studies have been reported about silk-based systems functionalized with magnetic NPs.12,24,25,35,42,49
Our study addresses three main objectives. The first is the preparation of a silk-based material with magnetic functionality – modeled in the form of film for prospective applications as bioactive coating – and the full characterization of the structural, mechanical and magnetic properties of samples with different concentration of magnetic NPs forming aggregates (NPs/silk fibroin nominal ratio = 5, 0.5 and 0 wt%). The second is the analysis of the in vitro behavior of stem cells grown on the films. The cellular activity has been probed both in a static uniform magnetic field and in no field, so as to single out the cellular response to the external field only, to the NPs only and that due to the synergy between magnetic NPs and applied field. The excellent performance of the sample with the highest NP concentration for promoting cellular proliferation and osteogenic differentiation is demonstrated. Finally, by combining the obtained experimental results with magnetic numerical calculations we discuss in which physical conditions the mechanism of magneto-mechanical stimulation of seeded cells can be triggered in the investigated samples, highlighting the key role of magnetic dipolar interactions between the NP aggregates. The insight gained in this study can serve as a guide for determining whether a cell stimulation effect may be active in other types of magnetically responsive biomaterials.
2. Results and discussion
2.1 Preparation of the silk fibroin films with magnetic NPs
Silk fibroin powder is produced by processing Bombyx mori silkworm cocoons as detailed in Materials and Methods (section 4.1). The powder is dissolved in formic acid (Honeywell, Fluka, USA) by stirring overnight at room temperature to obtain a solution at 12.5 mg mL−1. Iron oxide NPs (Iolitec GmbH, Germany), with size ∼10 nm (as determined by Transmission Electron Microscopy, TEM; Fig. S1a and b†), are added to the solution and suspended by sonication for 30 minutes. Two different concentrations of NPs are used: 0.625 mg mL−1 and 0.0625 mg mL−1.Samples in the form of films for structural, mechanical and magnetic characterization are obtained by casting 4 mL of the NPs/silk-formic_acid solutions and also of the solution without NPs onto 5 cm diameter Petri dishes and then drying overnight at room temperature in a laminar flow hood. Thus, three types of films are produced (Table 1): the film with the highest concentration of NPs is labeled as HC (NPs/silk fibroin = 5 wt%), LC is the film with the lowest concentration of NPs (NPs/silk fibroin = 0.5 wt%) and SF is the pure silk fibroin film (i.e. without NPs).
| Sample | Silk fibroin (mg) | NPs (iron oxide) (mg) | NPs/silk fibroin (wt%) | Estimated amount of NPs (mg) |
|---|---|---|---|---|
| HC | 50 | 2.5 | 5 | (1.8 ± 0.1) |
| LC | 50 | 0.25 | 0.5 | (0.17 ± 0.01) |
| SF | 50 | 0 | 0 | 0 |
The samples are transparent; due to the embedded NPs, HC has a dark orange color, which is strongly attenuated in LC (Fig. 1a). A batch of 10 samples for each type of film is prepared; the average thickness of the samples is (10 ± 2) μm, while the average weight is (57 ± 1) mg for HC and (54 ± 1) mg for SF and LC. The dried films are freestanding and, if handled, they easily resume their initial shape (Fig. 1b). On the contrary, the films in the wet state – which is obtained by soaking them in deionized water for a short time (to standardize the process, 1 hour) – adapt quite easily to coat any type of substrate regardless of the shape and material of which it is made (Fig. 1c–e). If left to dry in the open air for a few hours, the films regain their initial appearances.
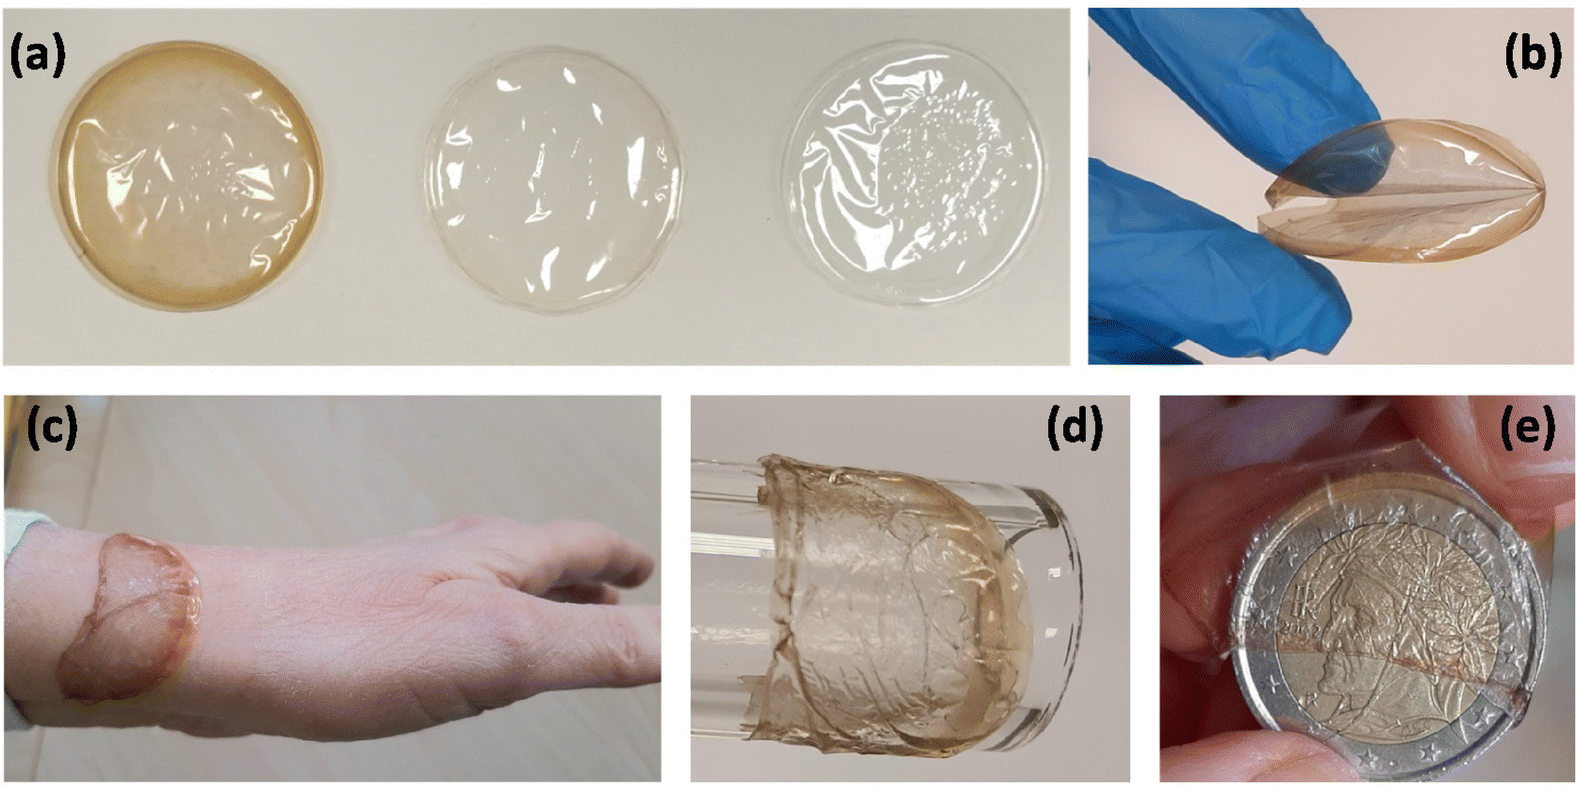 | ||
| Fig. 1 (a) From left to right: as-casted HC, LC and SF films. (b) The dried films are freestanding and can handled without permanent damage. (c–e) The wet films can adhere to substrates of different materials, such as skin, glass, metal (the HC film appears in the images). | ||
2.2 Structural and mechanical properties
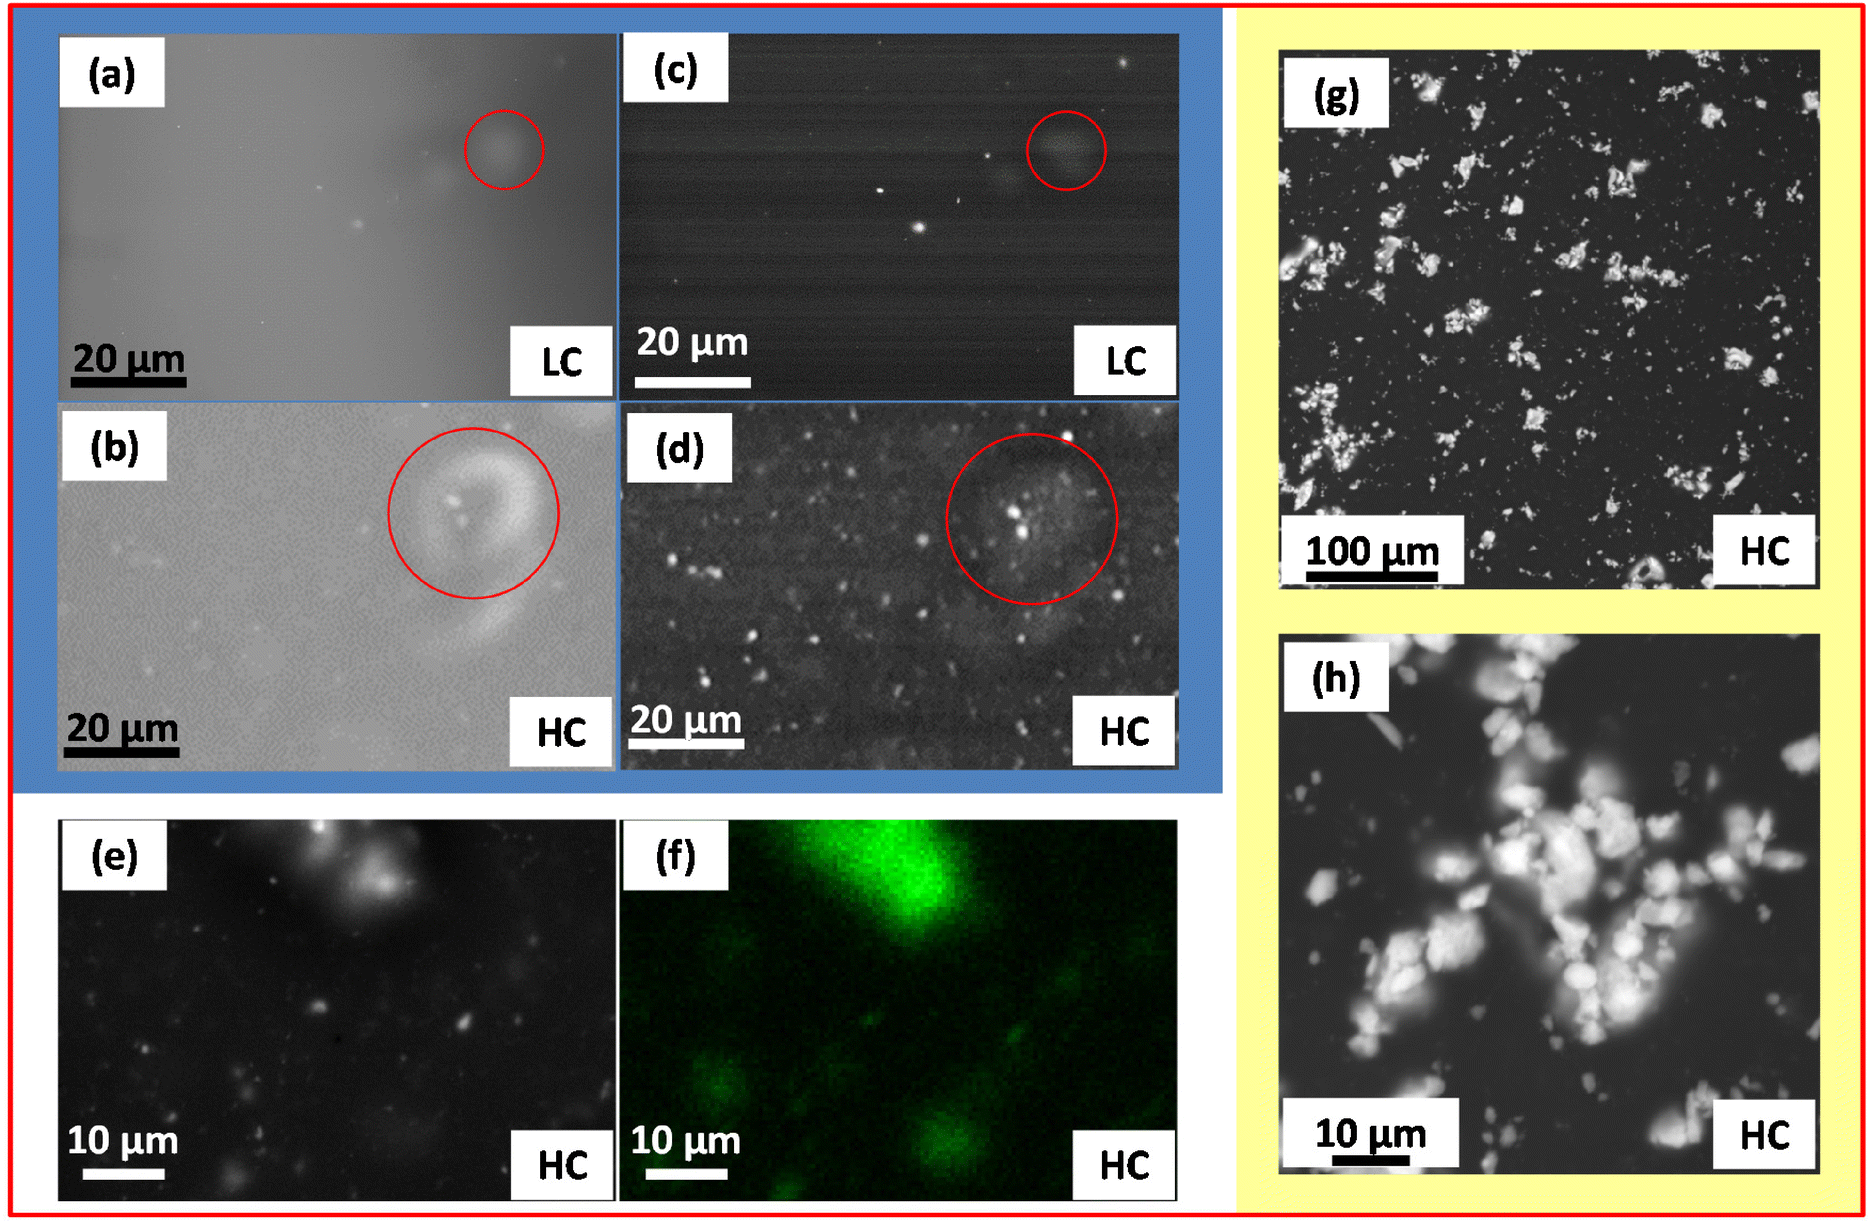 | ||
| Fig. 2 (a) and (b) SEM secondary electrons images of LC and HC; (c) and (d) SEM back-scattered electrons images of LC and HC. (e) and (f) SEM back-scattered image and corresponding Fe EDS compositional map of HC. (g) and (h) VPSEM back-scattered electrons images of the HC film. | ||
To gain more information on the arrangement of the NPs inside the silk fibroin matrix – in particular, when the films are wet, i.e. under cell culture conditions – the HC sample is analyzed by VPSEM, after being soaked in deionized water for 1 hour. Images produced by back-scattered electrons are shown in Fig. 2g and h. Agglomerates of NPs, widely distributed in size, are clearly visible as bright regions embedded in the fibroin matrix at different depths. Fig. 2h reveals that these agglomerates, similar to those visualized by SEM on the dried film (Fig. 2a–d, red circles), are typically composed of smaller aggregates of NPs, mostly sub-micrometric in size. TEM observations carried out on the HC film support this description and confirm the presence of NP aggregates intimately mixed with the fibroin component (Fig. S2†).
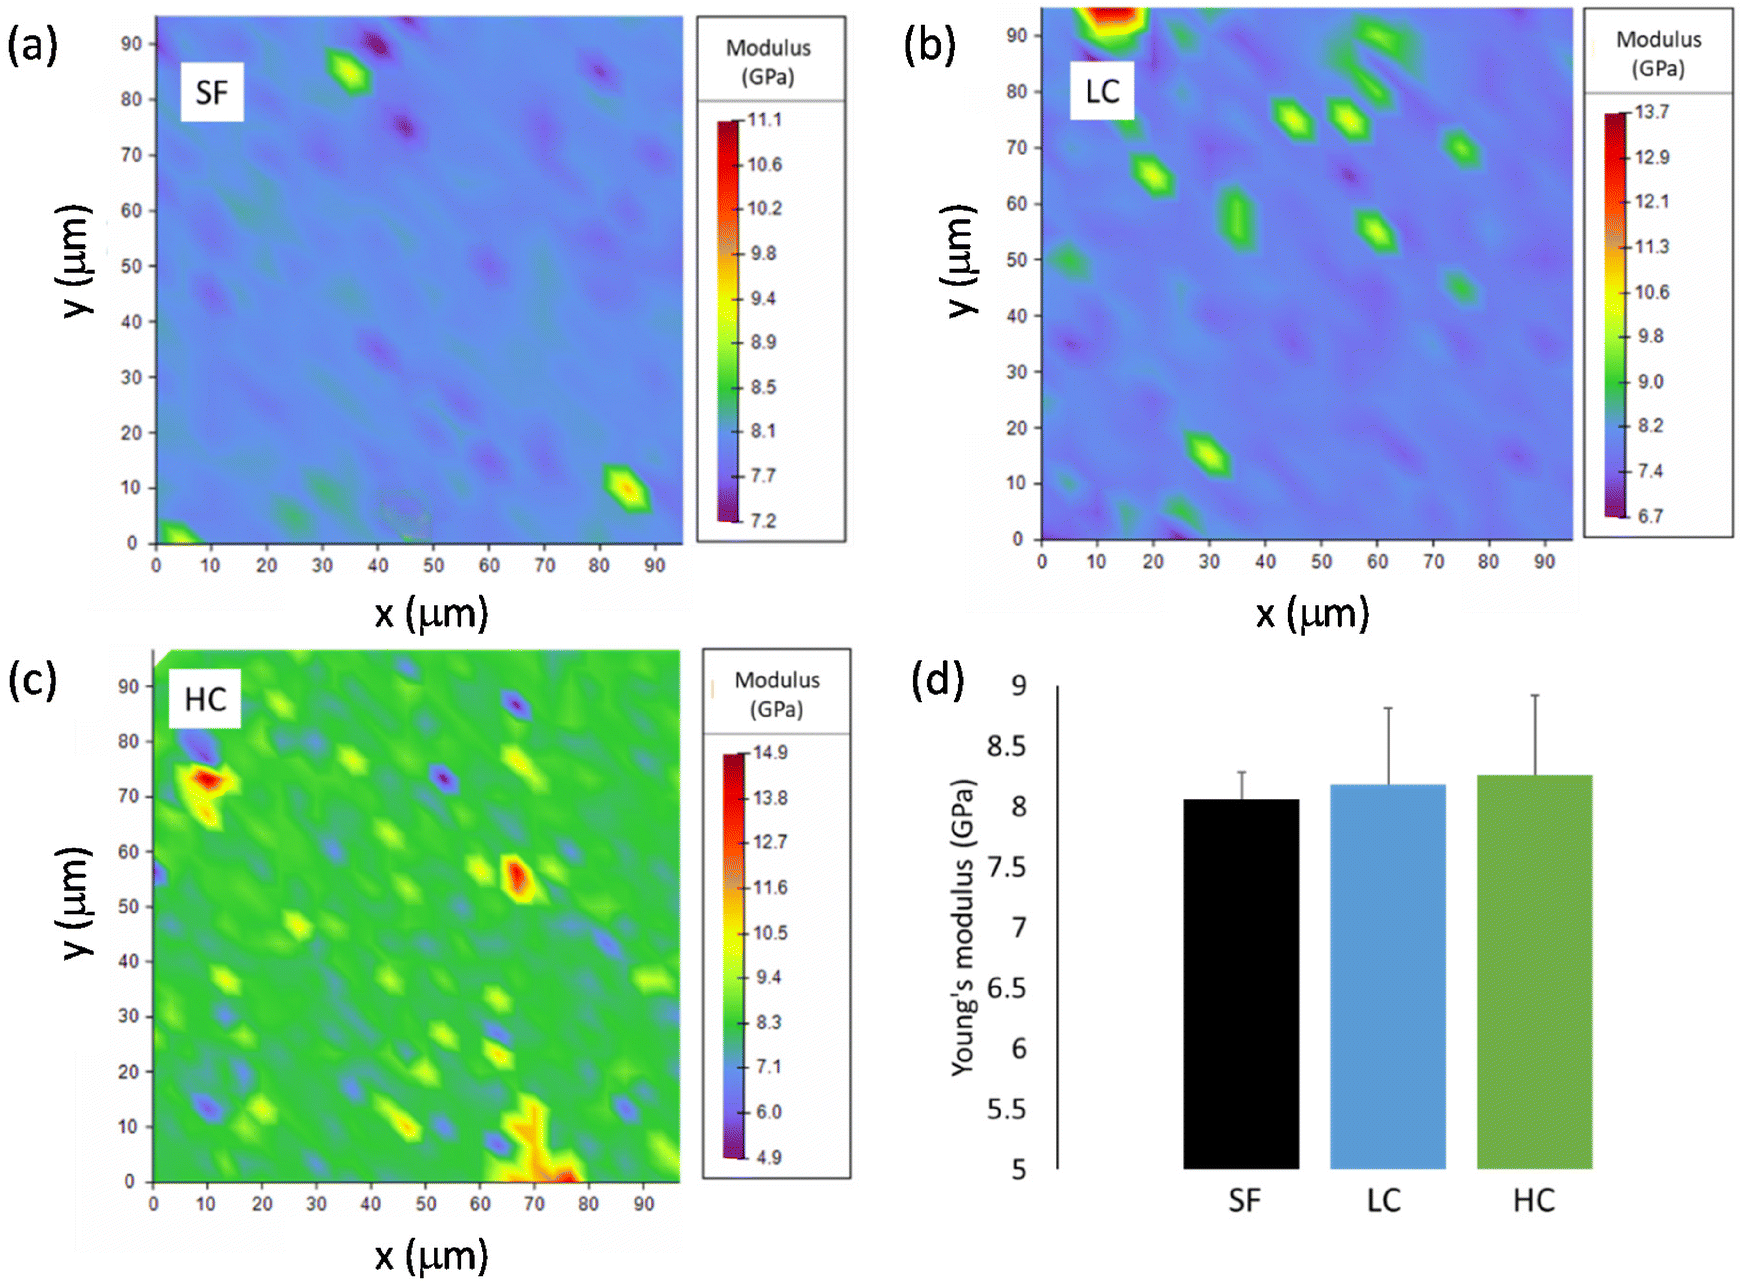 | ||
| Fig. 3 Young's modulus distribution maps obtained by nanoindentation of films (a) SF, (b) LC and (c) HC. (d) Average values of the Young's modulus for the three films. | ||
The investigated mechanical properties are quite homogenous in the SF film. The values of Young's modulus and hardness, obtained by averaging over the 9 maps, are (8.1 ± 0.2) GPa and (0.37 ± 0.02) GPa, respectively (Fig. 3d, Fig. S3d†). On the contrary, the existence of stiffer and harder regions is clearly visible in the maps of LC and particularly in those of HC. Reasonably, the presence of these local inhomogeneities is to be ascribed to the aggregates of iron oxide NPs. The mean values of Young's modulus and hardness slightly increase passing from SF to LC and then to HC, even if they are all similar within the experimental errors, actually (Fig. 3d and Fig. S3d†). Hence, the amount of NPs loaded in both LC and HC is not enough to significantly modify the average mechanical properties, as measured by nanoindentation, compared to those of SF.
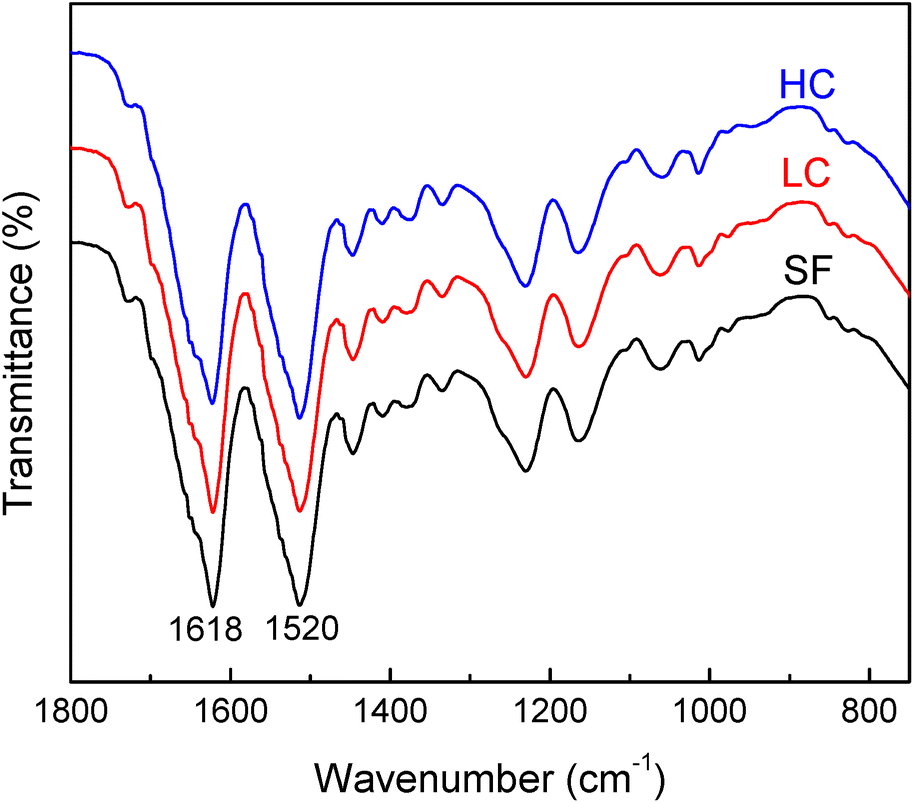 | ||
| Fig. 4 FTIR_ATR spectra of the as-casted HC, LC and SF samples. | ||
The stability of the samples is tested by incubating films in the cell culture medium and storing them at 37 °C for up to 21 days (coherent with cell culture time). Fig. S4† reports spectra of HC after casting and after 21 days of incubation. Their similarity indicates the stability of the samples in the aqueous environment. Only a slight change can be seen in the primary amide peak, which becomes sharper, indicating a random coil and beta-sheet intermediate structure degradation.
2.3 Magnetic properties
The saturation magnetization of the magnetic NPs, as measured by SQUID magnetometer in an applied field H = 4 × 10³ kA m−1, is MS = (66.7 ± 0.7) Am2 kg−1 at temperature T = 5 K and MS = (57.1 ± 0.6) Am2 kg−1 at T = 300 K (Fig. S5†). The SF film is predominantly diamagnetic (Fig. S6†).Hysteresis loops are measured on several dried samples of the HC and LC batches. Typical curves measured at T = 5 K and 300 K are shown in Fig. 5a and b. The loops for LC are manually corrected for the weak diamagnetic signal of the silk fibroin matrix, not appreciable in HC. In fact, a much larger ferromagnetic response is measured in HC, which is clearly consistent with the higher concentration of NPs. The amount of NPs in the films is estimated by comparing the saturation magnetization values with that measured on the NPs. The average NP content is ∼1.8 mg in HC and ∼0.17 mg in LC; these values are lower than the nominal ones, but their 10:1 ratio is substantially maintained (Table 1).
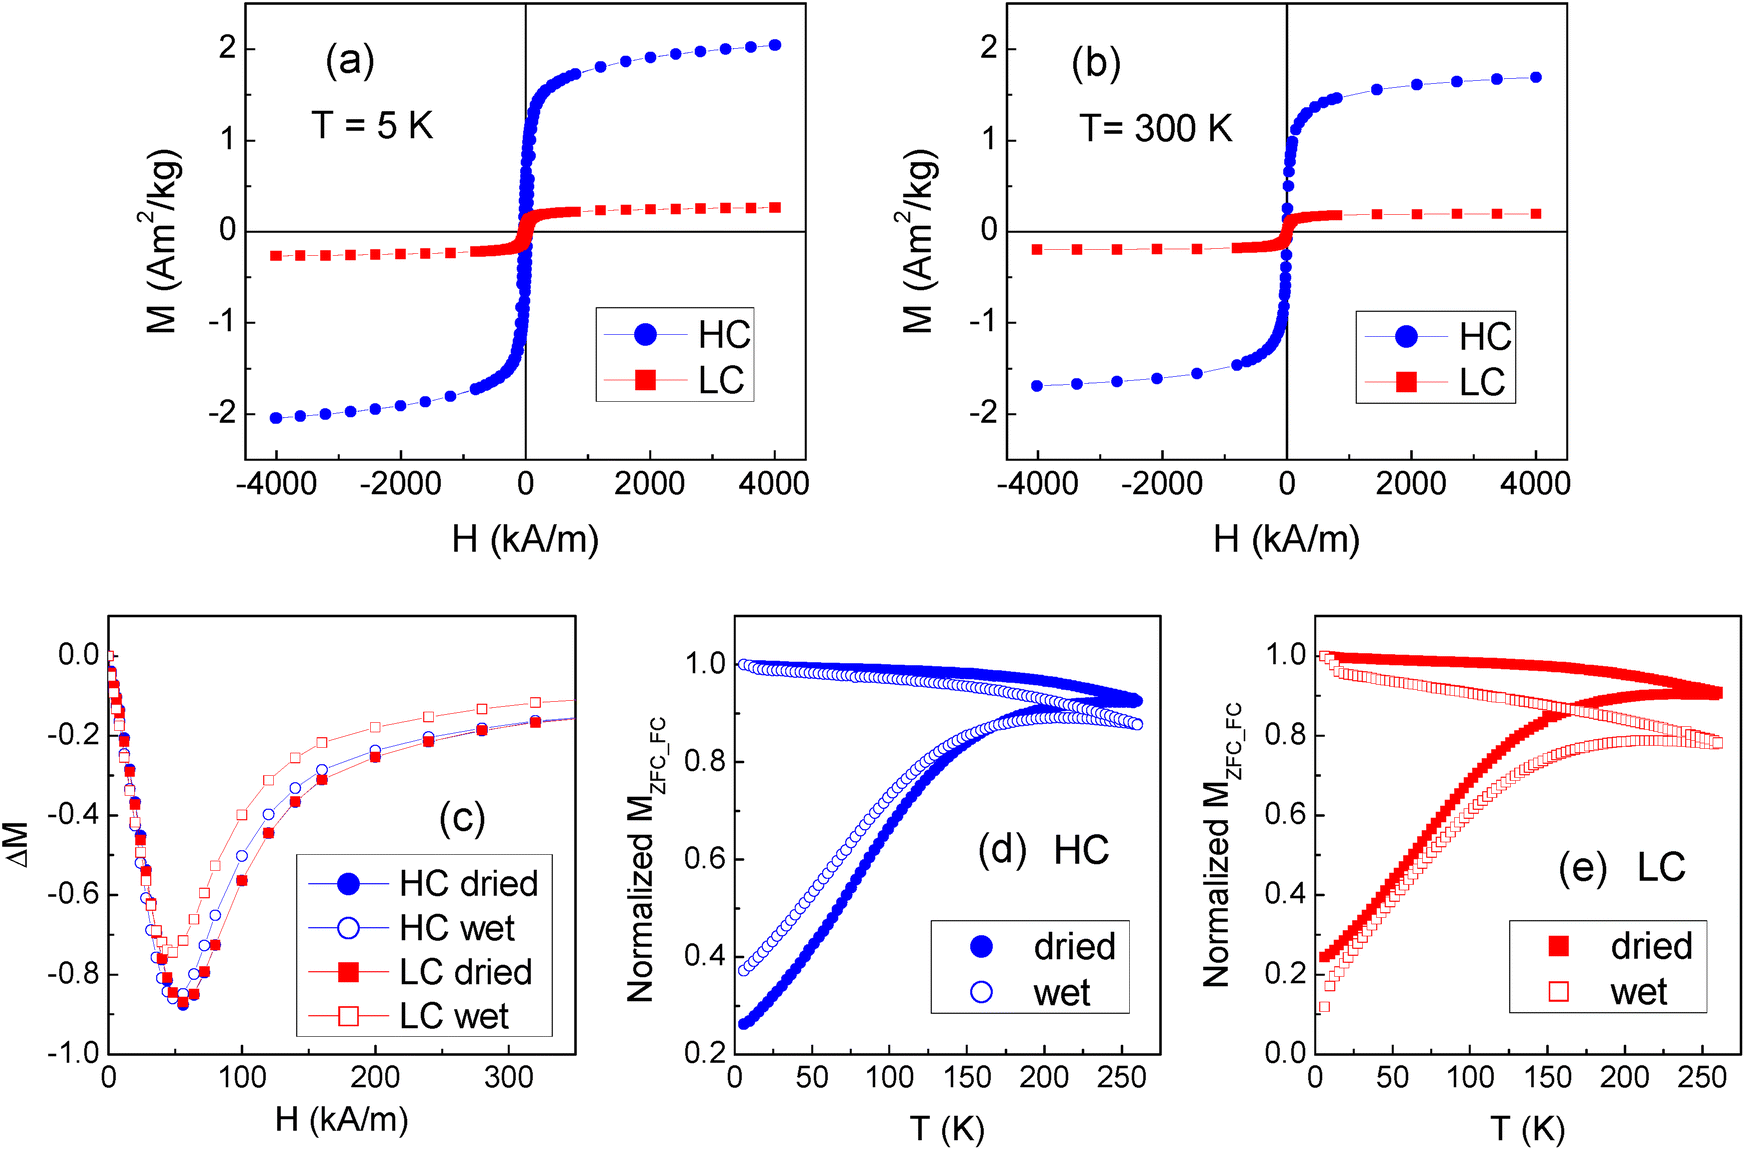 | ||
| Fig. 5 (a) and (b) Magnetic hysteresis loops of the dried HC and LC films, at T = 5 K and 300 K, respectively. (c) ΔM plots evaluated at T = 5 K on the dried and wet HC and LC films. (d) and (e) Magnetization measured on the dried and wet HC and LC films at Happl = 8 kA m−1, in zero-field-cooling mode (MZFC, lower branch of each displayed curve) and in field-cooling mode (MFC, upper branch); the curves are normalized to the value of MFC at T = 5 K. | ||
Measurements of magnetic moment vs. H are carried out at T = 5 K on the wet HC and LC films. More precisely, the same samples measured in the dried state are measured in the wet state and then measured again after allowing them to dry in air at room temperature for at least 24 hours. The process is repeated up to 3 times on each sample and, within the experimental error, the same magnetic moment is always measured. Hence, the NPs are stably entrapped into the fibroin matrix and the passage from the dried to the wet state does not cause any loss in the NP load. At T = 5 K, the coercivity is (26.4 ± 0.3) kA m−1 in the dried films; after wetting the samples, it decreases to (22.2 ± 0.4) kA m−1 in HC and (19.6 ± 0.4) kA m−1 in LC. At T = 300 K, the coercivity is null both in the dried and wet samples, which is in favor of a superparamagnetic behavior of the NPs.
Information on the regime of magnetic interaction between the NPs in the films is obtained through the analysis of the isothermal remanent magnetization (IRM) and dc demagnetization remanence (DCD) measured at T = 5 K and the construction of the ΔM plots. Fig. 5c shows the ΔM plots for both the dried and wet HC and LC films. In all the cases, negative ΔM values are measured, revealing the predominance of interparticle interactions of dipolar nature.15 The absolute peak value of ΔM is a measure of the strength of the magnetic interactions. The ΔM curves for the dried samples are perfectly superposed, in spite of the different concentration of NPs. This can be explained considering that both in HC and in LC the NPs tend to form aggregates and that the magnetic behavior of the samples, as probed by the ΔM plots analysis, is mainly influenced by the magnetic interactions between the NPs within the individual aggregates. The ΔM plots for wet HC and LC indicate a small reduction of the magnetic interaction degree compared to the dried samples, which is also consistent with the coercivity decrease. This suggests that the incorporated water molecules favor a slight separation of the NPs.
The curves of magnetization vs. T measured on the dried and wet HC and LC films in the zero-field-cooling (MZFC) and field-cooling (MFC) modes are shown in Fig. 5d and e. The difference between the MFC and MZFC branches is the hint of thermally induced relaxation processes undergone by the NP magnetic moments, culminating in a superparamagnetic behavior when the thermal energy overcomes the anisotropy energy barrier for the moment reversal. It is schematically considered that all the NPs of the assembly are in the full superparamagnetic regime at the temperature at which the MFC and MZFC branches join together.26 This is seen to occur around 230–250 K both in the dried and wet samples. It is known that interparticle dipolar interactions enhance the anisotropy energy barriers associated to magnetic NPs and therefore shift to higher temperature the entrance in the superparamagnetic regime.15,26 In spite of this, the NPs in HC and LC are superparamagnetic at room temperature, under the adopted measurement conditions. The superparamagnetic character of NPs is considered an important requisite for nanomedicine in vivo applications, for instance as drug carriers, nano-heaters for magnetic hyperthermia or contrast agents in diagnostic imaging techniques.13,14,51–53 In fact, as they do not retain magnetization after being exposed to a magnetic field, their use reduces the risk that they form large agglomerates that may be dangerous for the patient's health. In the HC and LC films, the magnetic NPs are embedded in the silk fibroin matrix and therefore this risk is less likely. However, the use of superparamagnetic NPs is recommended to exclude the possibility of any adverse effect due to the presence of permanently magnetized elements in the patient's body.54
2.4 In vitro biological study
Films of the three types (HC, LC and SF) for the biological tests are produced by casting the NPs/silk-formic_acid solutions into 48-well plates, with 0.6 mL for each well, and then drying overnight at room temperature in a laminar flow hood. For sterilization, the films are soaked into 75% ethanol overnight and washed by sterile Phosphate Buffered Saline (PBS) three times before biological evaluations. Human bone marrow-derived mesenchymal stem cells (hMSCs) are seeded and cultured up to 21 days in a static uniform magnetic field H = (128 ± 8) kA m−1 (indicated as MF mode; see section 4.6.1) and in no magnetic field (no-MF mode). Cell culture medium in all systems is changed every 2 days and therefore the exposure to the magnetic field is suspended for a few minutes to allow for this procedure.Proliferation of hMSCs seeded on the three types of films are probed on day 7, 14 and 21 by using PicoGreen DNA quantification assay. The results of cell proliferation are shown in Fig. 6a–c. The proliferation rate is upregulated by the presence and the concentration of NPs in all systems, if compared with SF. In fact, the number of cells cultured on HC is larger compared to that of cells on LC and almost double that of cells on SF. Regarding the influence of the applied magnetic field, it has a positive impact on the proliferation rate only on cells cultured on the SF film. We also observe that the number of cells grown on SF in no-MF mode increases with time, while the proliferation rate trend for cells cultured in the MF mode is characterized by a decrease at day 14. On the contrary, in groups HC and LC, the cell number remains almost constant during 21 days in the no-MF mode and it is not significantly different from that measured in the MF mode, particularly at day 7 and day 21.
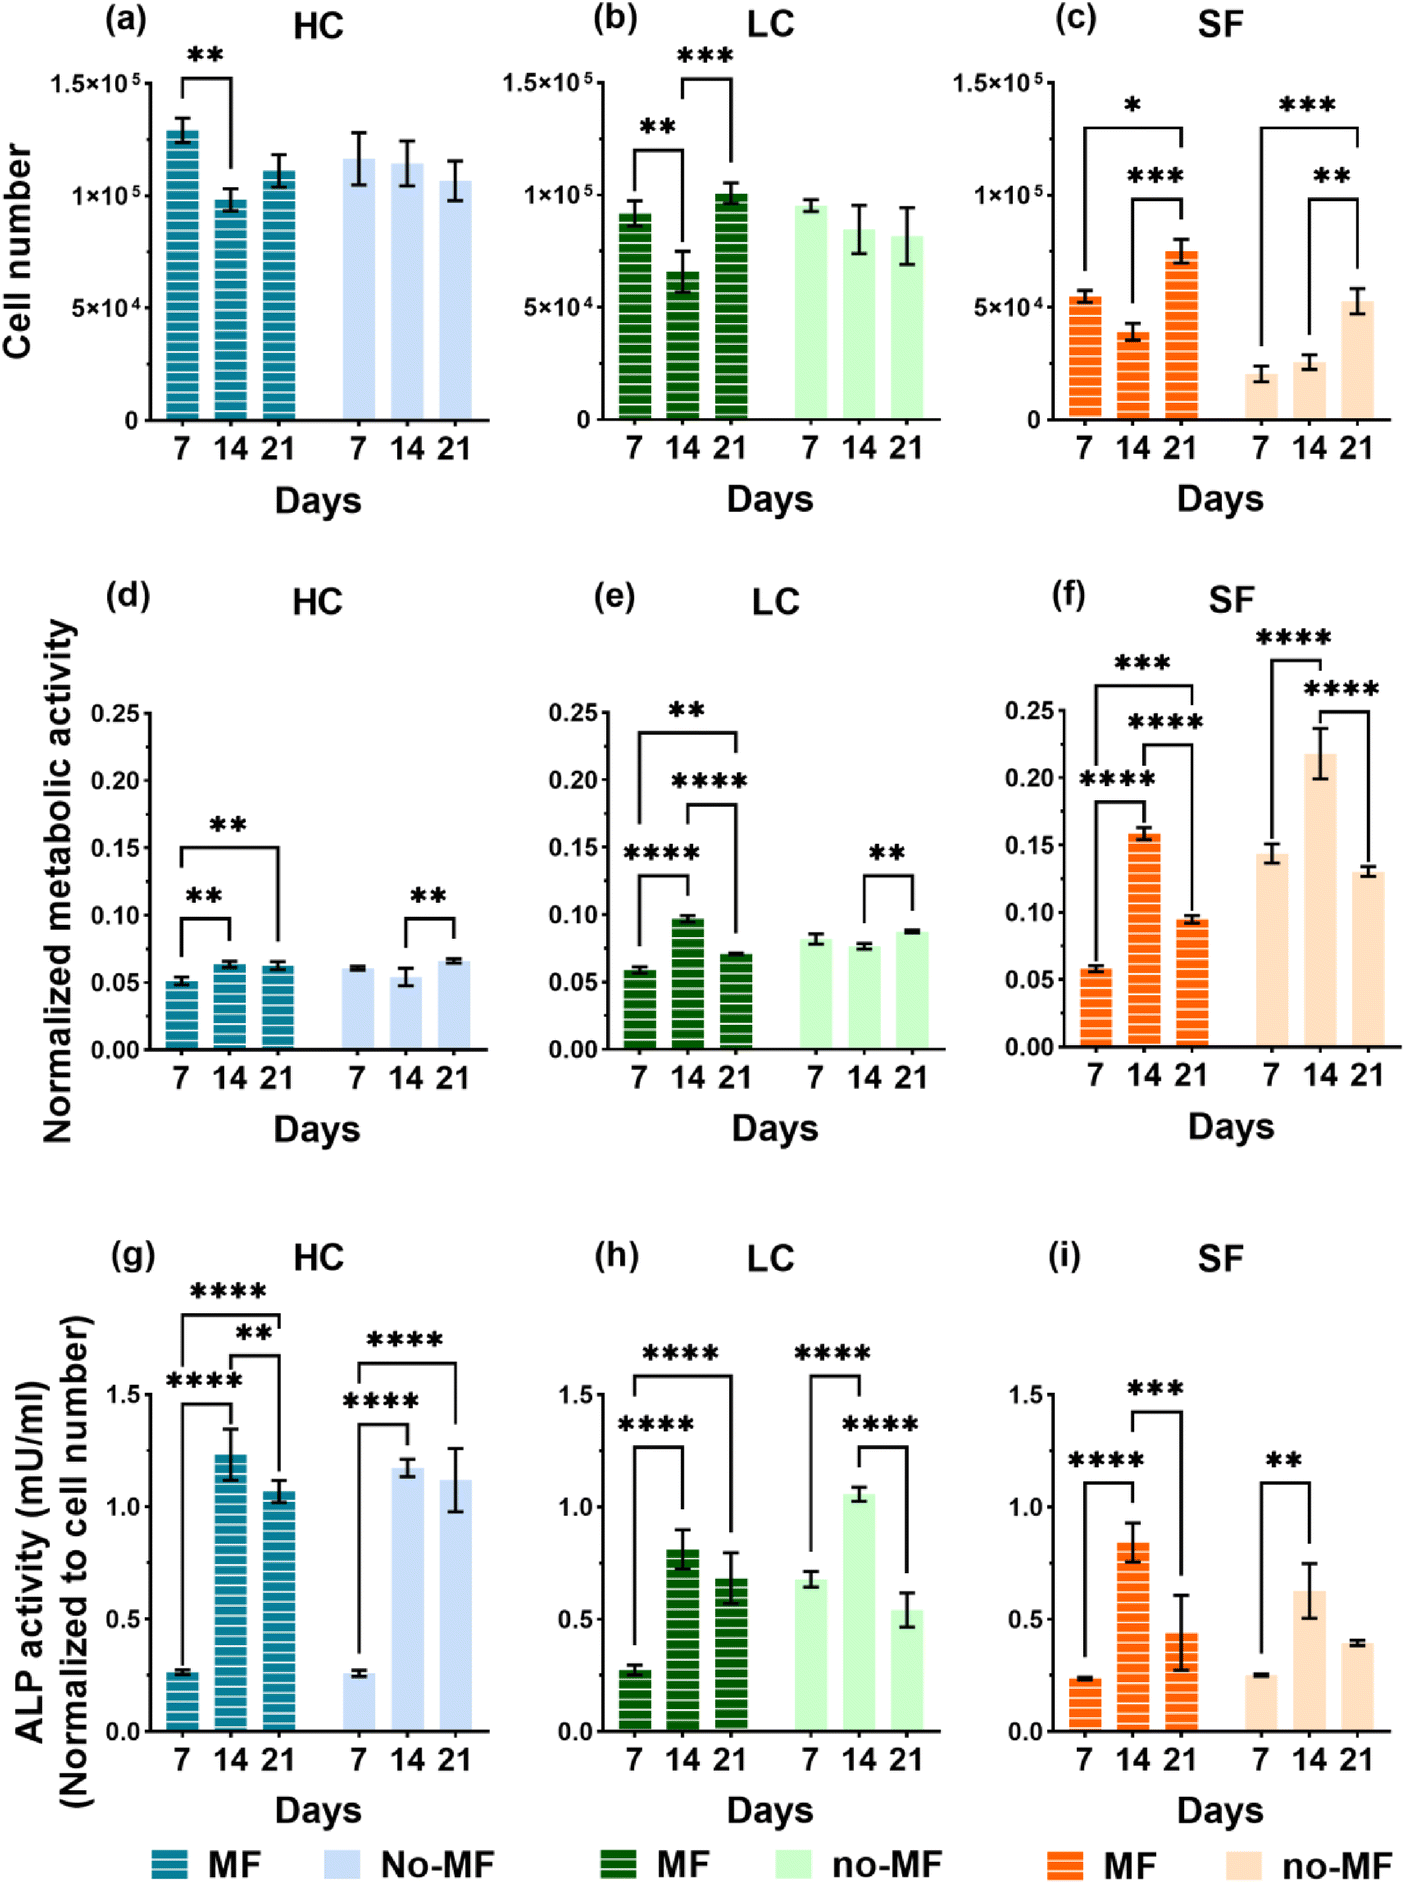 | ||
| Fig. 6 Number of hMSCs cultured on films (a) HC, (b) LC and (c) SF, under uniform magnetic field (MF mode) and without magnetic field (no-MF mode). Metabolic activity of hMSCs on films (d) HC, (e) LC and (f) SF, cultured in MF and no-MF modes; the data are normalized to the cell number. ALP activity of hMSCs cultured on films (g) HC, (h) LC and (i) SF, in MF and no-MF modes. | ||
The non-specific and bone-specific metabolic activity of hMSCs are performed by AlamarBlue assay and Alkaline phosphatase (ALP) activity, respectively. The results of the tests on non-specific metabolic activity are shown in Fig. 6d–f as normalized to the cell numbers for each group at each time point. A peak of metabolism on day 14 is observed in the SF group in the MF mode and even higher in the no-MF mode. On the contrary, the metabolic activity in the HC and LC groups is at a similar level and is not influenced by the magnetic field. Therefore, the comparison indicates that the NPs have an impact on cell general metabolism.
ALP activity, which is associated with osteoblastic differentiation is measured by the Alkaline Phosphatase assay kit and the results are shown in Fig. 6g–i. Different from general metabolic activity, during the 21 days’ culture all groups show a similar trend of the ALP activity level in both MF and no-MF modes, in which a strong increase is observed on day 14. The differences in the ALP activity level between LC and SF are not significant, while there is a clear increase in the ALP level of HC, especially in the second and the third week of culture. If compared with the general metabolic activity, these increases observed in the second week of HC and LC, indicate that the presence of NPs could induce the differentiation. The magnetic field exerts no strong impact on the ALP activity level in all the groups.
Cell morphology and distribution under different magnetic environments during the osteogenic differentiation are evaluated by the green staining of the cytoskeleton and observed by Confocal Microscope (Fig. 7). In general, there is no sensible difference among the groups, due to the good cytocompatibility of silk fibroin. All the films promote a good cell adhesion on day 7 and the cells are spread well in all the groups. At the early stage (day 7), the cells for all the groups are in typical fibroblast-like, spindle-shaped mesenchymal morphology. A slight increase in cell adhesion at day 7 in the HC sample and a more homogeneous distribution are observed. In all the groups, the adhered cell morphology starts to change from early stages becoming elongated and forming cell–cell interconnections, which suggests the start of the differentiation.
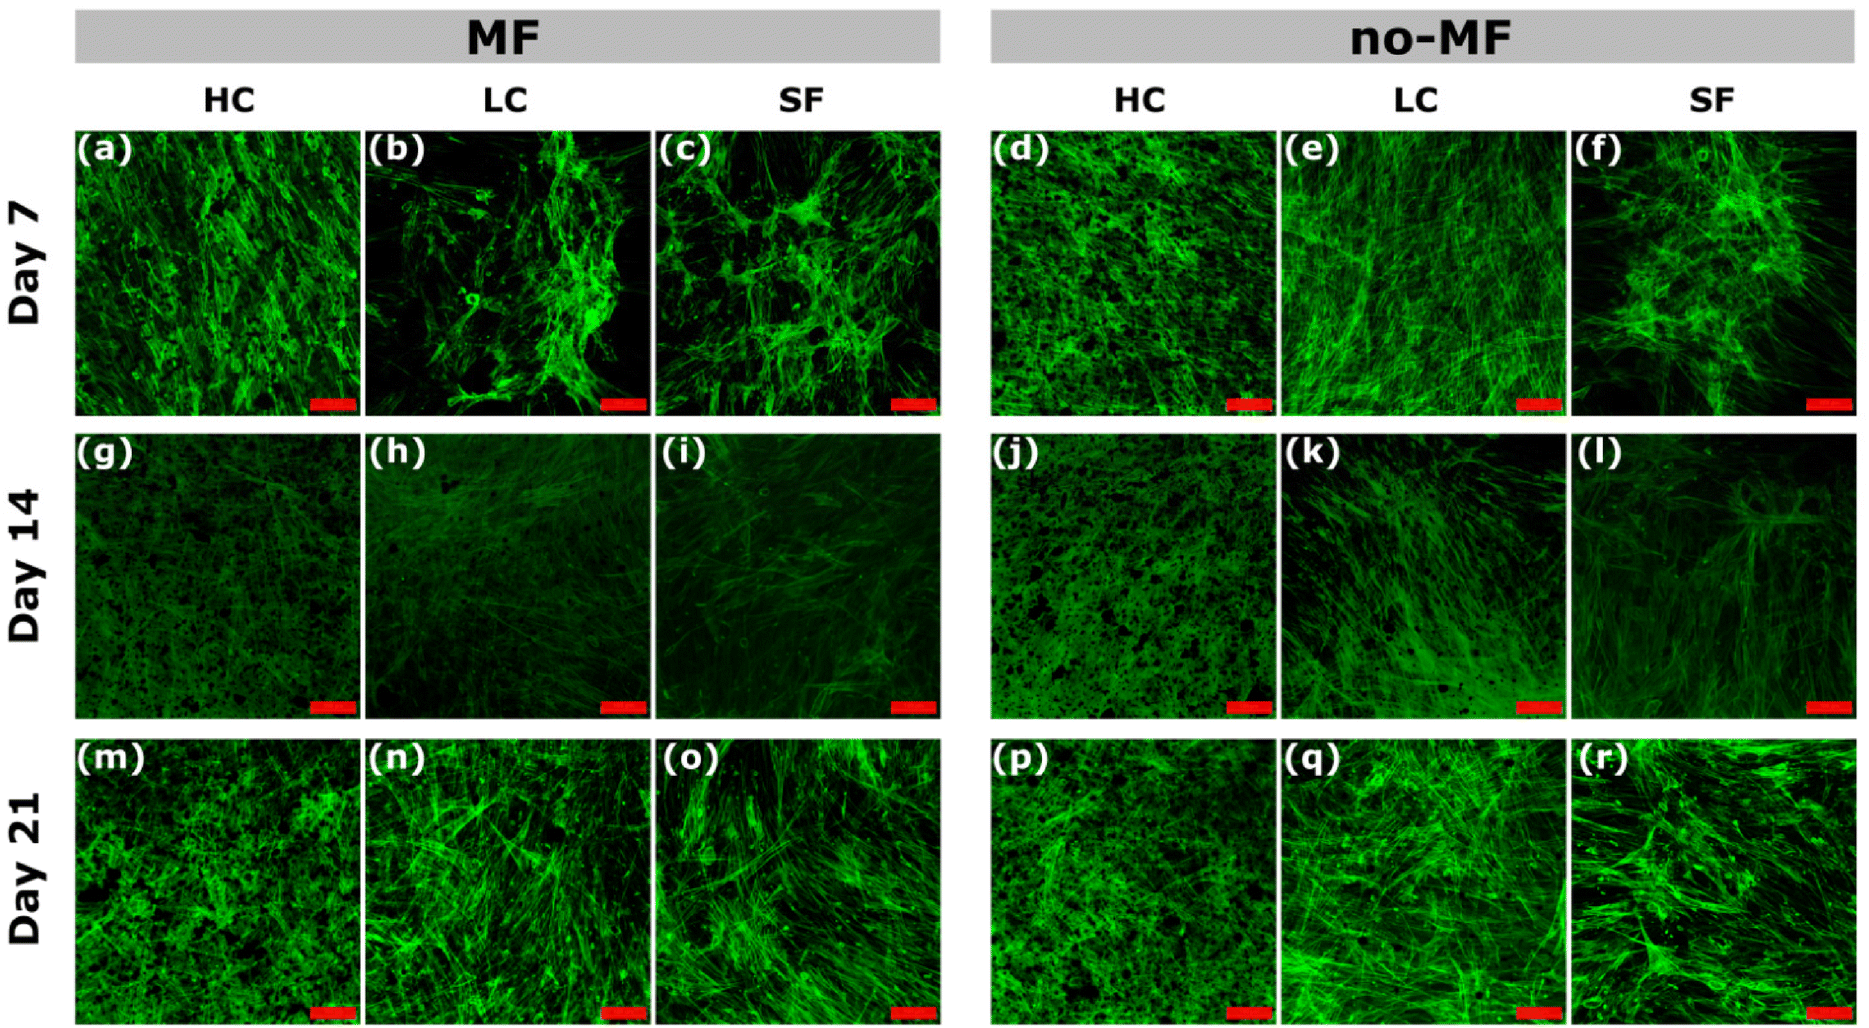 | ||
| Fig. 7 (a)–(r) Confocal images of hMSCs cultured under uniform magnetic field (MF) and without magnetic field (no-MF) on films HC, LC and SF, at day 7, 14 and 21. The scale bar is 100 μm. | ||
The relative mRNA expression levels of the osteogenic markers – alkaline phosphatase (ALP), collagen type I (COL 1), runt-related transcription factor 2 (RUNX2), and osteonectin (SPARC) – are monitored on day 7, 14, and 21 using RT-qPCR. The total RNA is isolated from cells that are seeded on films and cultured with and without magnetic field in the osteogenic medium. The results are presented in Fig. 8 and the heat map of the gene expression overview is presented in Fig. S7.†
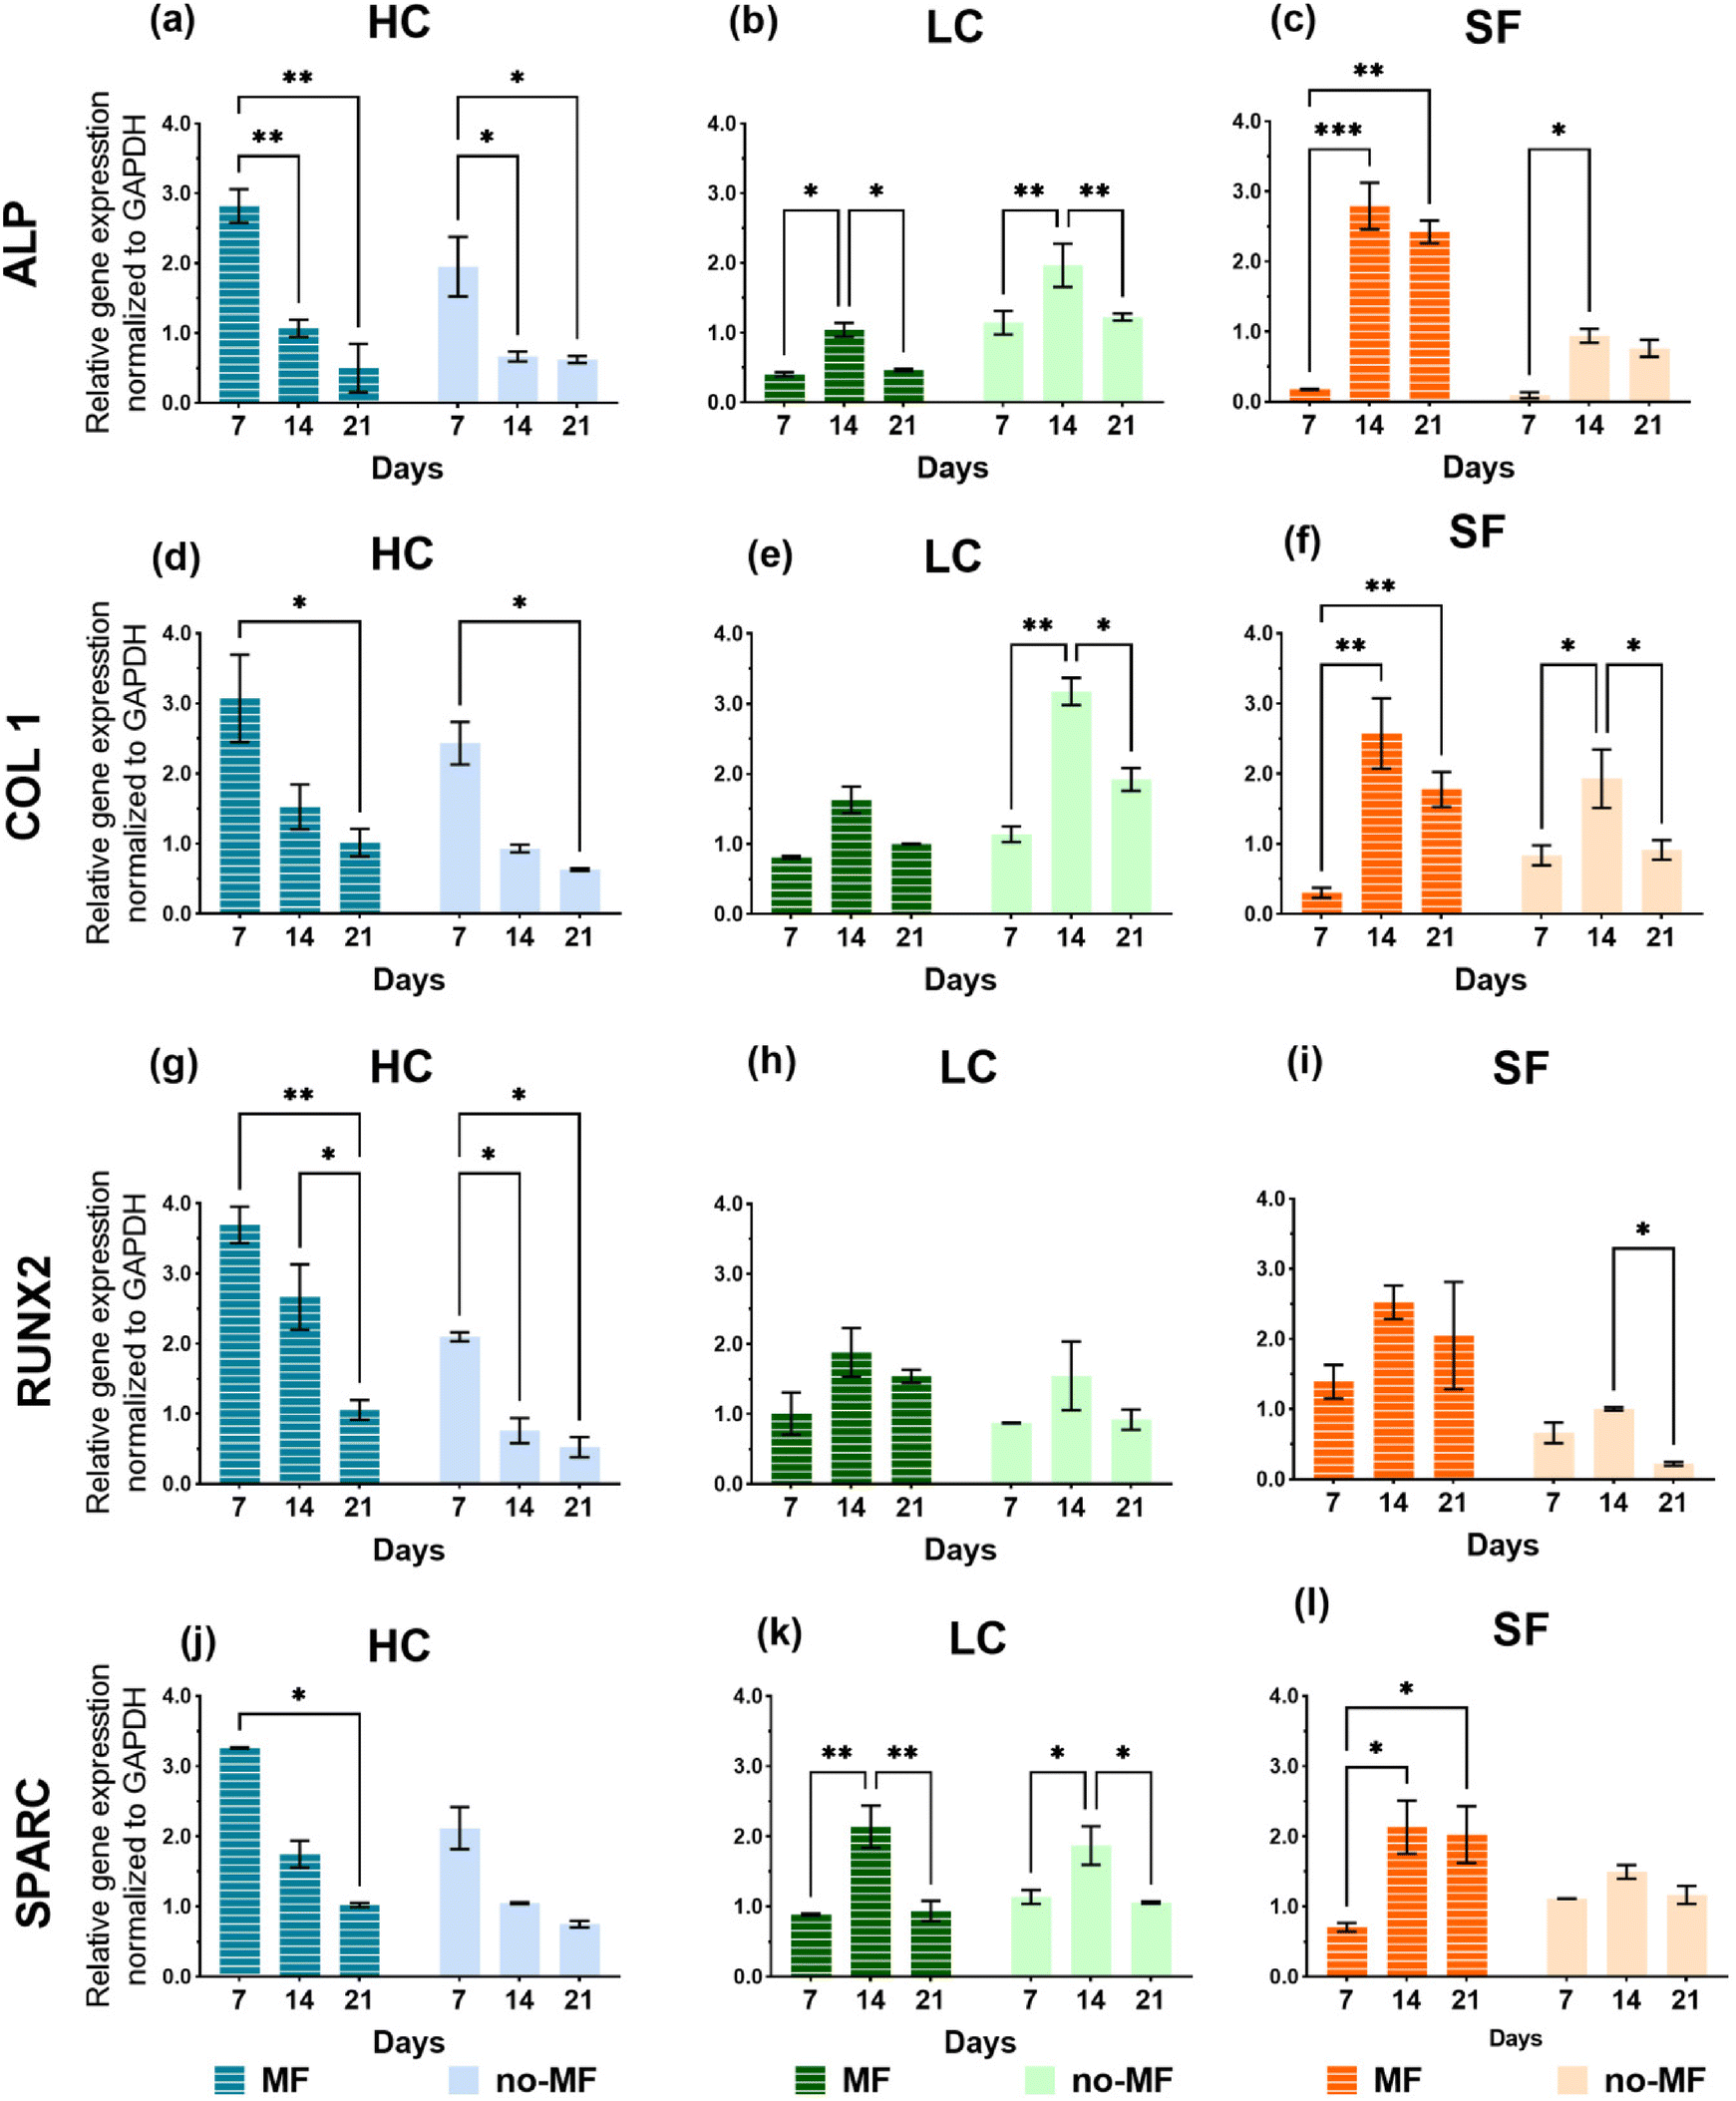 | ||
| Fig. 8 (a)–(l) Gene expression levels of osteogenic differentiation markers of hMSCs cultured on HC, LC and SF films, under uniform magnetic field (MF) and without magnetic field (no-MF) at day 7, 14 and 21. | ||
The gene expression trends of the selected markers are quite different among the groups. LC and SF groups exhibit similar trends of the gene expression, featuring a strong level increase on day 14. However, the magnetic field has a different impact on these two groups. In fact, as regard LC, slightly higher expression levels are measured in the no-MF mode, while for SF the magnetic field improves the expression level in all the selected markers. In the HC group, all the markers express a decreasing level over time, indicating that, compared to LC and SF, the cell differentiation has been stimulated at an earlier stage. Moreover, the cells cultured on HC in MF-mode always show a higher level of expression of all the genes compared to those cultured in no-MF mode, in particular at the first time point (day 7). Considering all the groups in Fig. 8, for all the markers, the highest peak values are obtained for HC in MF-mode.
The results of the biological tests indicate that adhesion, cell proliferation, general and bone-specific metabolic activity and morphology are positively affected by the presence of the iron oxide NPs in the silk fibroin films, particularly when they are present in high concentration, whereas the magnetic field does not seem to induce any particular influence on these phenomena (Fig. 6 and 7). It is just observed a slight increase in the proliferation of cells cultured on the SF film under magnetic field (Fig. 6c).
Since the NPs exhibit superparamagnetic relaxation at room temperature, which implies that they have no remanent magnetization, their magnetic nature is expected to play an irrelevant role in cellular behavior, in absence of an external magnetic field. Rather, we propose that the cells may be sensible to the local variations in the mechanical stiffness of the film on which are cultured, as revealed by the nanoindentation tests (Fig. 3). The stiffness inhomogeneity is expected to be even accentuated when the film is used in the wet state, which is the case of the cellular cultures. In fact, it is reported that the Young's modulus of wet silk fibroin can decrease by a factor of up to 102, with respect to the dried material.48,55,56 The reason is that water, being a polar solvent, plasticizes polymeric materials due to the interactions between water molecules and hydrogen bonds in the polymer.57 As a matter of fact, it is now well established that the stiffness of the substrate on which cells are cultured can determine their behavior and fate.58 Substrate stiffness influences the cytoskeletal organization of cells and hence the adhesion and the morphology;59,60 it also affects the growth and viability of cells61 as well as the migration and motility.62,63 Above all, the substrate stiffness is a potent regulator of the differentiation process of stem cells.64–66
A clear influence of the applied magnetic field on osteogenic cellular differentiation is revealed only by the analysis of the gene expression markers (Fig. 8). However, in this respect, the LC film shows the low-grade performance. In our opinion, only the existence of two different effects generated by the applied field on the osteogenic differentiation process can account for the results in Fig. 8. The first effect is revealed by the analysis on the SF film, which demonstrates that the expression of the markers is enhanced by the magnetic field (Fig. 8). Several studies have demonstrated that a static magnetic field of the same order of magnitude as the one we use, or even weaker, can accelerate the osteogenic differentiation of rat osteoblasts,67 human osteoblast-like MG63 cells,68,69 murine MC3T3-E1 cells,70 dental pulp cells,71 hMSCs.72 Indeed, the issue is controversial and literature articles also report no influence of a static magnetic field on the differentiation of osteoblast-like cells73 or even an adverse effect.74 In general, literature survey reveals that the effect of magnetic field on cellular cultures depends on cell type, magnetic field magnitude and application method and, as a consequence, the underlying mechanism is still largely unclear. In our case, this effect should be visible in cells cultured on all three films, in principle. On the contrary, it is not observed in cells grown on LC, for which the gene markers appear unaffected by the presence of the field or even worsened, as for ALP (Fig. 8b) and COL 1 (Fig. 8e). The reason may be related to the fact that, although the cultured cells are of the same type, they evolve differently over time on SF and LC, as indicated by the different proliferation rate and metabolic activity (Fig. 6). Therefore, it is inferred that the magnetic field alone exerts a beneficial effect on the osteogenic differentiation process of the cells that develop over time as in the SF film (as mentioned above, it actually affects the proliferation rate as well, Fig. 6c). However, the field does not play the same effective role on the cells cultured on film LC and, accordingly, on film HC.
For all the gene expression markers, the highest peak values are obtained for group HC in MF mode (Fig. 8). Indeed, the only presence of NPs in high concentration is sufficient to promote a faster and better osteogenic differentiation compared to what is observed for LC and SF groups, which once again confirms the positive influence of the NPs. However, the magnetic field further prompts the differentiation process. We propose that the beneficial effect of the magnetic field observed in HC is not the same detected in SF, but it is another effect. Unlike the first one, this second effect induced by the field depends strongly on the NP concentration. In fact, it is essentially irrelevant in the case of LC, which suggests that a certain number of NPs is actually needed to activate it. Hence, this second effect arises from the synergy between the applied magnetic field and the NPs incorporated in the film. Since there is no significant degradation of the films over the time period in which biological tests are conducted (Fig. S4†) and therefore no leakage of NPs, any mechanism involving a direct and intimate interaction between NPs and cells can be excluded. The effect can have a magneto-mechanical origin, namely it can be determined by a magnetically induced mechanical deformation of the silk matrix, which is sensed by the cells and influences their behavior. In the next section, in order to prove the reasonableness of this hypothesis from a physical point of view, we present numerical simulations relative to a simplified model of the set of NPs in HC and LC.
2.5 Numerical calculations
Literature articles report that shear stresses with an order of magnitude of 0.01 Pa applied on mesenchymal stem cells, using laminar flow bioreactors, are able to stimulate the osteogenic differentiation.75,76 Assuming that a cell can be sensitive to a normal stress σcell of the same order of magnitude, the deformation induced on it by σcell is given by the relation εcell = σcell/Ecell, where Ecell is the Young's modulus of the cell. Taking Ecell = 104 Pa as plausible value,77,78εcell = 1 × 10⁻⁶. We assume that a cell lying on a substrate has a typical thickness of a few microns, i.e. comparable to that of the investigated films. Thus, we model a cell in the simplest possible way, that is a cube with side of 10 μm. In order to produce the deformation εcell on a cell adhered on the top of the 10 μm-thick silk fibroin film, the film must be deformed to the same extent, namely εsilk = εcell = 1 × 10⁻⁶. Therefore, the film must be subjected to a stress perpendicular to its surface, with modulus σsilk = εsilk × Esilk, where Esilk is the Young's modulus of the film itself. In other words, the parameter σsilk, calculated for εsilk = 1 × 10⁻⁶, represents the threshold value of the stress that must be applied to the silk fibroin film to produce a deformation able to stimulate a cell lying on its top surface.As shown in Fig. 3d, the value of Esilk experimentally measured by nanoindentation technique on the dried SF film is ∼8 GPa. However, as already mentioned, the Young's modulus can decrease up to two orders of magnitude passing from the dried to the wet film.48,55,56 Therefore, we expect σsilk to vary between a maximum σsilk_max ∼ 8 kPa and a minimum σsilk_min ∼ 80 Pa.
It can be hypothesized that mechanical stresses comparable or larger than σsilk are produced in HC and LC as a result of the magnetic forces between the embedded NPs, more precisely between the NP aggregates. To assess the plausibility of this argument, numerical calculations are carried out for a simplified model of a set of NP aggregates of different size, which, under the applied magnetic field, are assumed to behave as magnetic dipoles. In particular, the simulation program we have implemented considers a set of magnetic dipoles enclosed in a cubic volume with a side of 10 μm. This volume simulates the portion of film, having a thickness of ∼10 μm, that lies below a cell. The program generates a fixed number of spherical elements – which represent the magnetic aggregates and therefore the magnetic dipoles – with volume randomly varying between 5.24 × 10⁻⁴ μm3 (corresponding to a radius of 50 nm) and 5.24 × 10⁻¹ μm3 (radius = 500 nm), with the constraint that they cannot be superposed and that their total mass is consistent with the amount of NPs in the HC and LC samples, as estimated by the magnetic analysis (Table 1; for this calculation, the mass density of bulk magnetite is used, i.e. ρ = 5 × 10³ kg m−3). The spherical elements are randomly dispersed into the cubic volume, as visible in Fig. 9a and b where the models for the HC and LC samples are shown. It is interesting to note that, in particular in the HC case, the simulated spherical elements can appear as a set of large micrometric agglomerates when seen projected in two dimensions, thus resembling some features in SEM images (Fig. 2).
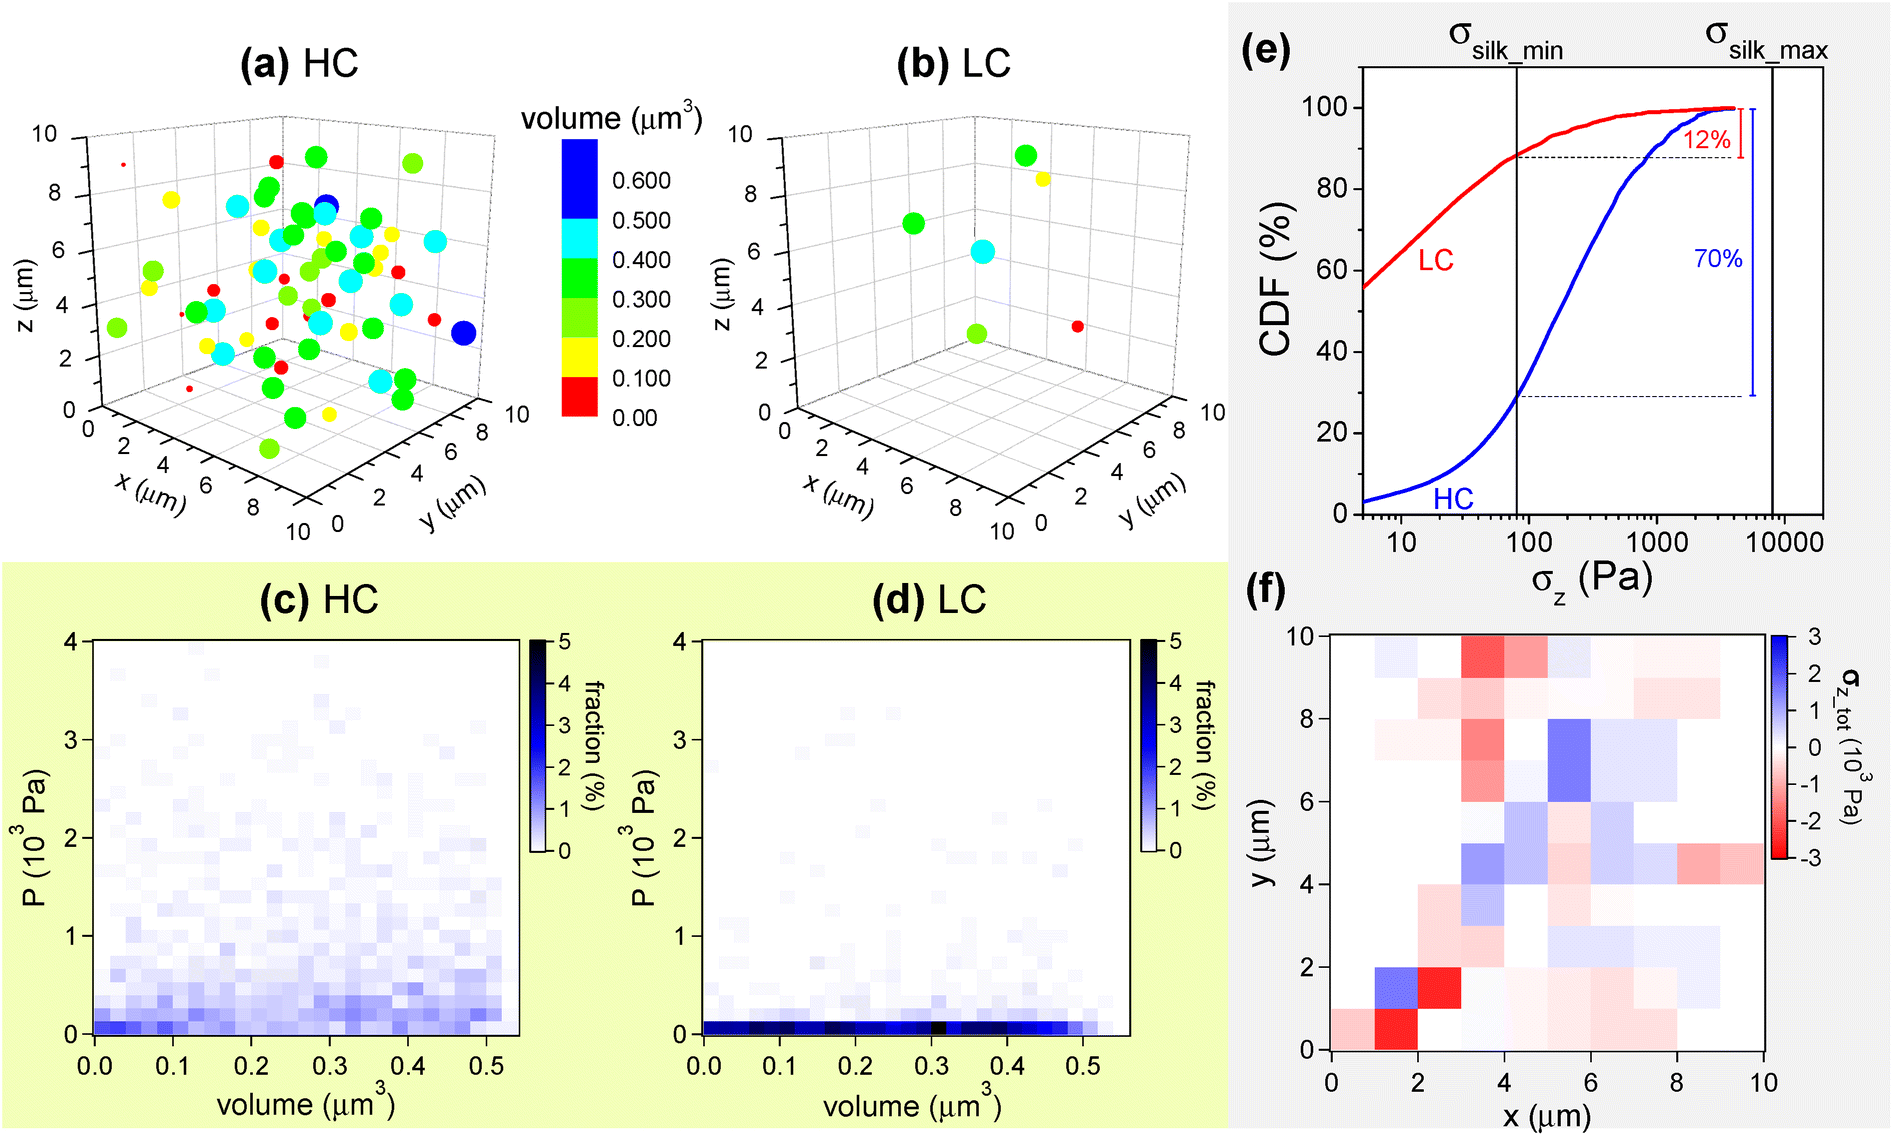 | ||
| Fig. 9 (a) and (b) Models of the sets of magnetic NPs in films HC and LC, respectively. The information on the volume of the aggregates is provided by the color. However, to suggest their different size, they are drawn with a radius roughly corresponding to that assigned by the simulation program. (c) and (d) Diagrams of the distribution of the values of pressure P as a function of the volume of the magnetic aggregates for HC and LC, respectively. (e) Cumulative distribution function (CDF) of σz (modulus) for the HC and LC cases. (f) Map related to the spatial distribution of effective σz vectors for the set of NP aggregates visible in frame (a). See text for explanation. | ||
To each spherical element in Fig. 9a and b a magnetic moment is assigned. This is directed along the z axis, i.e. in the same direction as the external applied field that produces it. The modulus m of the moment is calculated based on the saturation magnetization of the magnetic NPs at T = 300 K (i.e. MS ∼ 57.1 Am2 kg−1, Fig. S5†) and the magnetization level reached in HC and LC upon the application of the magnetic field (Fig. 5b). Once generated the set of magnetic aggregates/dipoles, the net magnetic force Fmagn acting on each of them, due to the magnetic interaction with all the others, is calculated (bold is used to represent a vector quantity). Consequently, each aggregate is also subjected to a pressure P obtained by dividing the modulus Fmagn by the cross-sectional area S of the aggregate itself, i.e. P = Fmagn/S. Thus, we obtain a number of values of Fmagn and P equal to the number of magnetic aggregates (the vector sum of all Fmagn is zero). To increase this number and thus improve the statistics, sets of aggregates for HC and LC, similar to those shown in Fig. 9a and b, are generated multiple times, i.e. 20 and 200 respectively, so that the total number of aggregates that are finally processed is approximately the same in both cases, of the order of 103.
Fig. 9c and d are diagrams reporting the distribution of P values as a function of the volume of the magnetic aggregates for the HC and LC cases, respectively. The color indicates the fraction of aggregates, with a given volume, that are subjected to a certain value of P. The P values are distributed over a wider range in the HC case than in the LC one.
According to the electron microscopy results (Fig. 2 and Fig. S2†), the magnetic aggregates are firmly embedded into the silk fibroin matrix. Therefore, the force Fmagn, which acts on each magnetic aggregate with cross-sectional area S, is transmitted to the matrix, producing an internal mechanical stress σ with modulus Fmagn/S (i.e. numerically equal to P). For simplicity of description, we consider only the z-component σz, i.e. the component normal to the surface of the film. In Fig. 9e the cumulative distribution function (CDF) of σz (i.e., the modulus of σz), is shown for the HC and LC cases. The CDF associates to each value of σz the percentage fraction of magnetic aggregates that produce a stress smaller than σz or equal. The black vertical lines visible in Fig. 9e mark the values σsilk_max = 8 kPa and σsilk_min = 80 Pa. It turns out that neither in HC nor in LC there are aggregates fulfilling the relation σz > σsilk_max, which therefore represents the least favorable condition, but also the least realistic, being referred to the dried SF film. Considering the other extreme situation, given by the relation σz > σsilk_min, the fraction of aggregates that contribute effectively to cell stimulation is ∼70% in the HC case and only ∼12% in the LC one. Considering that the amount of aggregates is ∼10 times lower for LC than for HC (Fig. 9a and b), the absolute number of effective aggregates does not scale proportionally to their concentration in the samples, but is drastically smaller in LC. Therefore, the magneto-mechanical stimulation effect could be far too weak to influence the osteogenic differentiation process of the cells cultured on the LC film, as indeed observed.
Fig. 9f is a x-y map of the spatial distribution of the σz vectors for the assembly of NP aggregates in Fig. 9a, which models the HC case. More precisely, the color intensity is related to the sum of the σz vectors acting on each portion of the map: the blue and red colors indicate that the resulting vector σz_tot is parallel or antiparallel to the z-axis, respectively. Hence, the map reveals that σz_tot varies in space both in modulus and sign. The map has been drawn excluding the σz vectors with modulus smaller than σsilk_min = 80 Pa, which certainly are not effective contributions. A similar map for the NP assembly in Fig. 9b (LC case) appears almost completely white (Fig. S8†).
Since we are investigating on the possible mechanism of mechanical stimulation of a cell adhered to the silk fibroin film, in our reasoning we have considered the value of Esilk measured by nanoindentation, which is a local probing technique. One may observe that some literature articles report significantly lower values of the Young's modulus of silk fibroin, measured using the tensile method.79,80 This point is addressed in the ESI file (Fig. S9†) and we demonstrate that, also considering the Young's modulus of SF measured by tensile tests – which in fact is about an order of magnitude smaller than that estimated by nanoindentation – the effective fraction of aggregates is proportionally larger in HC than in LC (Fig. S10†).
Some literature articles about polymeric biomaterials loaded with magnetic NPs report that a magneto-mechanical stimulation of seeded cells is produced by exposing the sample to a magnetic field gradient. The proposed explanation is that a net magnetic force drags the NPs along the gradient vector and this results in a deformation of the matrix that can be sensed by the cells.27,29,32,36 In these studies, the magnetic field gradient is usually produced by placing a permanent magnet in the proximity of the cell-seeded substrate. In this way, gradient values of the order of 10 T m−1 are typically obtained.3,81 In the case of HC and LC, it is easy to calculate that this mechanism would not produce a deformation of the silk fibroin matrix large enough to be sensed by the cells (see the ESI file†).
To conclude, it is worth explaining why our discussion has disregarded the hypothesis that the synergic effect influencing the osteogenic differentiation of the cells grown on the HC film may be due to a reinforcement of the applied magnetic field thanks to that generated by the NPs. We can compute the average value of the z-component of the dipolar magnetic field produced by the NPs in the cubic volume of side 10 μm placed just above the portion of film visualized in Fig. 9a. In our description, this region corresponds to the volume occupied by the cell. The obtained value is ∼32 A m−1, a value four orders of magnitude smaller than the magnetic field applied for the biological tests (∼128 kA m−1) and comparable to the Earth's magnetic field (see Fig. S11† for more details).
3. Conclusions
We have prepared a silk-based biomaterial in the form of film ∼10 μm thick embedding iron oxide NPs, superparamagnetic at room temperature under SQUID measurement conditions. Three types of films have been produced (NPs/silk fibroin nominal ratio = 5, 0.5 and 0 wt%) and characterized from the structural, mechanical and magnetic point of view. The NPs form aggregates in the silk fibroin matrix so that the film stiffness results spatially inhomogeneous. However, even in sample HC, with the highest NP load, the silk protein structure is not altered by the presence of the NPs and the average mechanical properties are similar to those of the pure silk fibroin film.In vitro biological tests have been carried out on hMSCs cultured on the three films, with and without an applied static uniform magnetic field. This study has allowed us to elucidate the separate role of the NPs and of the magnetic field in conditioning the cellular behavior and the role they play in synergy. Film HC exhibits high-grade performance in terms of proliferation rate, adhesion and phenotypic-specific metabolic activity of cells. Moreover, it promotes a faster and better osteogenic differentiation, particularly under magnetic field. We have focused on this last remarkable effect. To elucidate its origin, magnetic numerical calculations have been performed for a simplified model of the assembly of NP aggregates in samples HC and LC, respectively with high and low NP load. A magneto-mechanical mechanism has been revealed, in which the key factor is the magnetic force acting on each NP aggregate, due to the magnetic interaction with all the others, following the application of the magnetic field. These magnetic forces give rise to mechanical stresses in the silk fibroin matrix, which vary in space both in modulus and sign. Under cell culture conditions, i.e. when the film is wet, the stresses produced by some of the NP aggregates are able to induce deformations in the silk matrix, which can be sensed by the seeded cells as mechanical stimuli favoring the osteogenic differentiation. The amount of NP aggregates that produce stresses strong enough to trigger this magneto-mechanical stimulation is not proportional to their concentration in the HC and LC films, but is definitely larger in the former. This accounts for the superior efficiency of film HC in conditioning the cell fate upon exposure to the magnetic field, which opens to biomedical applications, in particular as bioactive coating.
Our study has contributed to shed light on the mechanism of magneto-mechanical stimulation of cells cultured on biomaterials loaded with magnetic NPs. Basic guidelines have been provided to determine whether and under what conditions the cellular stimulation effect can be active in other magnetically responsive biomaterials, starting from the knowledge of their physical properties.
4. Materials and methods
4.1 Preparation of the silk fibroin powder
Bombyx mori silkworm cocoons, kindly supplied by Chul Thai Silk (Petchaboon Province, Thailand) are degummed twice in 98 °C distilled water bath of Na2CO3 (Sigma, USA, 1.1 g L−1 and 0.4 g L−1, respectively) for 1.5 hours each. Then, they are rinsed thoroughly with warm distilled (DI) water to remove the salt and completely dried at room temperature in a laminar flow hood. Degummed silk samples are dissolved in 9.3MLiBr (Honeywell, Fluka, USA) water solution (2 g per 10 mL) at 65 °C for 3 hours, followed by dialysis against DI water with Slide-A-Lyzer Dialysis Cassettes (3500MWCO, Pierce, USA) for 3 days to remove LiBr. Then the silk fibroin solution is filtered by a 100–160 μm filter disc (DURAN, Mainz, Germany) to eliminate impurities. Purified solution is finally lyophilized (5Pascal, Milan, Italy) to obtain the silk fibroin powder.4.2 Scanning electron microscopy techniques
Scanning electron microscopy (SEM) observations are performed by a Zeiss Supra 40 field-emission microscope (Carl Zeiss Microscopy GmbH, Jena, Germany) equipped with a Bruker Quantax 200-Z10 microanalysis (Bruker Nano GmbH, Berlin, Germany) for the energy-dispersive spectroscopy (EDS) inspections and maps. Portions of the HC and LC films are attached on stubs for SEM and coated with a few nanometers gold layer by means of a sputter coater (Emitech K550) to make them conductive. Variable pressure scanning electron microscopy analysis (VPSEM) is performed on a TESCAN VEGA3 LMU microscope, equipped with a Peltier cooled sub-stage and able to operate at a low vacuum of 500 Pa. For VPSEM observations HC and LC samples are observed without any preparation in their hydrated form.4.3 Nanoindentation tests
The tested samples are prepared fixing with glue the film to an aluminum stab. This is mounted on an iNano®Nanoindenter (Nanomechanics Inc.). The declared sensitivity of the machine is 3 nN for the load and 0.001 nm for the displacement. First, we investigate the effect of the load on the measured quantities (Young's modulus and hardness) by using the mapping method (Nanoblitz 3d, Nanomechanics Inc.) with a 100 μm × 100 μm square with 400 indentation points inside (each for a maximum of 1 mN load with a decrease of 0.005 in max load per point). The same mapping method (without the decrease in max load) is used to investigate the distribution of the mechanical properties in a selected region. After this investigation, the mean Young's modulus and hardness are taken (with standard deviation). We use a Berkovich tip and we obtain the mechanical properties from load displacement curves by means of Oliver and Phar method.824.4 FTIR-ATR
Fourier transform infrared spectroscopy (FTIR) analysis in attenuated total reflectance (ATR) mode is performed using a Spectrum One spectrometer (PerkinElmer, USA) equipped with Zinc Selenide crystal on ATR. For each measurement, the spectrum is collected in the range from 650 to 4000 cm−1 with 64 scans at the resolution of 4 cm−1.4.5 Magnetic measurements
The magnetic study is carried out using a Quantum Design superconducting quantum interference device (SQUID) magnetometer. The instrument is used to measure the magnetic moment of a sample as a function of magnetic field (maximum applied field H = 4 × 10³ kA m−1) and temperature (5–300 K range). To calculate the magnetization M (magnetic moment/sample mass) the weight of the sample is measured with a precision of 10−5 g. To estimate the amount of NPs in the HC and LC films, the saturation magnetization values at T = 300 K are compared to that measured on the NPs at the same temperature ( values at T = 300 K are considered in order to minimize the influence of a low-temperature paramagnetic signal from the silk fibroin, superposed to the diamagnetic one; Fig. S6†). The IRM and DCD curves are measured using a standard procedure (see ESI file† and Fig. S12†).15 The ΔM plot is obtained by plotting the parameter ΔM(H) = DCD(H) − [1–2IRM(H)] as a function of H. The MZFC-FCvs. T curves are measured using the following procedure. The sample is cooled from T = 250 K down to T = 5 K; at this temperature a magnetic field Happl = 8 kA m−1 is applied and M is measured for increasing temperature up to 250 K at a heating rate of 3 K min−1 (ZFC mode). Then the sample is cooled to 5 K in Happl and M vs. T is recorded again (FC mode).4.6 In vitro biological tests
000 cells per mL.
000 cells per well) and on tissue culture plates (TCP), which are the control group (only cells without samples). The plates are incubated in a humidified atmosphere of 5% CO2 at 37 °C to promote cell adhesion. 24 hours after the seeding, the medium is switched into the differentiation medium: standard medium with 0.1μM dexamethasone (DEX), 0.1 mM ascorbic acid 2-phosphate (AP) and 10 mM β-Glycerophosphate (BGP). The differentiation medium is changed every two days until 21 days.
4.7 Numerical calculation methods
The simulation of the assembly of NP aggregates in the HC and LC films, shown in Fig. 9a and b, is performed through a program implemented using the C language. As previously explained, each NP aggregate is assumed to behave as a magnetic dipole. The modulus m of its magnetic moment is calculated based on the magnetic curves shown in Fig. 5b, namely normalizing them to their value at the maximum field Hmax = 4 × 10³ kA m−1 (MHmax) and considering the value of M/MHmax attained in the external field H = 128 kA m−1, which is ∼0.6 for both HC and LC. The value of m for an aggregate of volume V is m = [(MSρV)0.6], being MS the saturation magnetization of the NPs at T = 300 K and ρ the mass density of bulk magnetite. The force Fmagn acting on each aggregate is evaluated as follows. First, the energy U of the aggregate is calculated by summing the dipolar interaction energy values with all the other aggregates.26 Since the simulated system is a cubic volume of side 10 μm, to eliminate the appearance of finite size effects the calculation is performed by including also the contribution of 20 replicas of the system along both the positive and negative direction of x and y axes. Then, we compute the magnetic force on each aggregate as Fmagn = − gradU. The magnetic field generated by the NP aggregates in HC is computed as the sum of the dipolar magnetic fields produced by each of them.26Conflicts of interest
There are no conflicts of interest to declare.Acknowledgements
L. D. B. was supported by the University of Ferrara under project ‘Fondo di Ateneo per la Ricerca 2022-FIRD’. F. S. was supported by the University of Ferrara under project ‘Fondo per l'Incentivazione alla Ricerca’ (FIR–2021). G. G. was supported by Caritro Foundation (prot. U1277.2020/SG.1130). N. M. P. was supported by the Italian Ministry of Education, University and Research (MIUR) under the ‘Departments of Excellence’ grant L. 232/2016 and the PRIN-20177TTP3S grant.References
- K. Shimizu, A. Ito and H. Honda, J. Biomed. Mater. Res., Part B, 2006, 77, 265–272, DOI:10.1002/jbm.b.30443.
- R. Singh, A. Wieser, S. Reakasame, R. Detsch, B. Dietel, C. Alexiou, A. R. Boccaccini and I. Cicha, J. Biomed. Mater. Res., Part A, 2017, 105, 2948–2957, DOI:10.1002/jbm.a.36147.
- S. Hughes, S. McBain, J. Dobson and A. J. El Haj, J. R. Soc., Interface, 2008, 5, 855–863, DOI:10.1098/rsif.2007.1274.
- A. M. Matos, A. I. Gonçalves, A. J. El Haj and M. E. Gomes, Nanoscale Adv., 2020, 2, 140–148, 10.1039/c9na00615j.
- A. Tay and D. Di Carlo, Nano Lett., 2017, 17, 886–892, DOI:10.1021/acs.nanolett.6b04200.
- N. Wang, J. P. Butler and D. E. Ingber, Science, 1993, 260, 1124–1127, DOI:10.1126/science.7684161.
- P. Cai, B. Hu, W. R. Leow, X. Wang, X. J. Loh, Y. L. Wu and X. Chen, Adv. Mater., 2018, 30, 1800572, DOI:10.1002/adma.201800572.
- M. J. Dalby, N. Gadegaard, R. Tare, A. Andar, M. O. Riehle, P. Herzyk, C. D. W. Wilkinson and R. O. C. Oreffo, Nat. Mater., 2007, 6, 997–1003, DOI:10.1038/nmat2013.
- J. Huang, Y. Chen, C. Tang, Y. Fei, H. Wu, D. Ruan, M. E. Paul, X. Chen, Z. Yin, B. C. Heng, W. Chen and W. Shen, Cell. Mol. Life Sci., 2019, 76, 505–521, DOI:10.1007/s00018-018-2945-2.
- M. Xu, S. Pradhan, F. Agostinacchio, R. K. Pal, G. Greco, B. Mazzolai, N. M. Pugno, A. Motta and V. K. Yadavalli, Adv. Mater. Interfaces, 2019, 6, 1801822, DOI:10.1002/admi.201801822.
- N. Bock, A. Riminucci, C. Dionigi, A. Russo, A. Tampieri, E. Landi, V. A. Goranov, M. Marcacci and V. Dediu, Acta Biomater., 2010, 6, 786–796, DOI:10.1016/j.actbio.2009.09.017.
- S. K. Samal, M. Dash, T. Shelyakova, H. A. Declercq, M. Uhlarz, M. Bañobre-López, P. Dubruel, M. Cornelissen, T. Herrmannsdörfer, J. Rivas, G. Padeletti, S. De Smedt, K. Braeckmans, D. L. Kaplan and V. A. Dediu, ACS Appl. Mater. Interfaces, 2015, 7, 6282–6292, DOI:10.1021/acsami.5b00529.
- J. G. Ovejero, F. Spizzo, M. P. Morales and L. Del Bianco, Materials, 2021, 14, 6416, DOI:10.3390/ma14216416.
- J. G. Ovejero, F. Spizzo, M. P. Morales and L. Del Bianco, Nanoscale, 2021, 13, 5714–5729, 10.1039/d0nr09121a.
- L. Del Bianco, F. Spizzo, G. Barucca, M. R. Ruggiero, S. Geninatti Crich, M. Forzan, E. Sieni and P. Sgarbossa, Nanoscale, 2019, 11, 10896–10910, 10.1039/c9nr03131f.
- J. Meng, Y. Zhang, X. Qi, H. Kong, C. Wang, Z. Xu, S. Xie, N. Gu and H. Xu, Nanoscale, 2010, 2, 2565–2569, 10.1039/c0nr00178c.
- Y. Wu, W. Jiang, X. Wen, B. He, X. Zeng, G. Wang and Z. Gu, Biomed. Mater., 2010, 5, 015001, DOI:10.1088/1748-6041/5/1/015001.
- K. Lai, W. Jiang, J. Z. Tang, Y. Wu, B. He, G. Wang and Z. Gu, RSC Adv., 2012, 2, 13007–13017, 10.1039/c2ra22376g.
- X. B. Zeng, H. Hu, L. Q. Xie, F. Lan, W. Jiang, Y. Wu and Z. W. Gu, Int. J. Nanomed., 2012, 7, 3365–3378, DOI:10.2147/IJN.S32264.
- K. Dashnyam, R. A. Perez, R. K. Singh, E. J. Lee and H. W. Kim, RSC Adv., 2014, 4, 40841–40851, 10.1039/c4ra06621a.
- S. Panseri, C. Cunha, T. D'Alessandro, M. Sandri, A. Russo, G. Giavaresi, M. Marcacci, C. T. Hung and A. Tampieri, PLoS One, 2012, 7, e38710, DOI:10.1371/journal.pone.0038710.
- Q. Cai, Y. Shi, D. Shan, W. Jia, S. Duan, X. Deng and X. Yang, Mater. Sci. Eng., C, 2015, 55, 166–173, DOI:10.1016/j.msec.2015.05.002.
- J. J. Kim, R. K. Singh, S. J. Seo, T. H. Kim, J. H. Kim, E. J. Lee and H. W. Kim, RSC Adv., 2014, 4, 17325–17336, 10.1039/c4ra00040d.
- E. Tanasa, C. Zaharia, A. Hudita, I. C. Radu, M. Costache and B. Galateanu, Mater. Sci. Eng., C, 2020, 110, 110714, DOI:10.1016/j.msec.2020.110714.
- S. Aliramaji, A. Zamanian and M. Mozafari, Mater. Sci. Eng., C, 2017, 70, 736–744, DOI:10.1016/j.msec.2016.09.039.
- J. L. Dormann, D. Fiorani and E. Tronc, Adv. Chem. Phys., 1997, XCVIII, 283–494, DOI:10.1002/9780470141571.ch4.
- L. Hao, L. Li, P. Wang, Z. Wang, X. Shi, M. Guo and P. Zhang, Nanoscale, 2019, 11, 23423–23437, 10.1039/c9nr07170a.
- J. Meng, B. Xiao, Y. Zhang, J. Liu, H. Xue, J. Lei, H. Kong, Y. Huang, Z. Jin, N. Gu and H. Xu, Sci. Rep., 2013, 3, 2655, DOI:10.1038/srep02655.
- S. Hao, J. Meng, Y. Zhang, J. Liu, X. Nie, F. Wu, Y. Yang, C. Wang, N. Gu and H. Xu, Biomaterials, 2017, 140, 16–25, DOI:10.1016/j.biomaterials.2017.06.013.
- A. I. Gonçalves, M. T. Rodrigues, P. P. Carvalho, M. Bañobre-López, E. Paz, P. Freitas and M. E. Gomes, Adv. Healthcare Mater., 2016, 5, 213–222, DOI:10.1002/adhm.201500623.
- A. R. Tomás, A. I. Goncąlves, E. Paz, P. Freitas, R. M. A. Domingues and M. E. Gomes, Nanoscale, 2019, 11, 18255–18271, 10.1039/c9nr04355a.
- H. M. Yun, S. J. Ahn, K. R. Park, M. J. Kim, J. J. Kim, G. Z. Jin, H. W. Kim and E. C. Kim, Biomaterials, 2016, 85, 88–98, DOI:10.1016/j.biomaterials.2016.01.035.
- Y. Sapir-Lekhovitser, M. Y. Rotenberg, J. Jopp, G. Friedman, B. Polyak and S. Cohen, Nanoscale, 2016, 8, 3386–3399, 10.1039/c5nr05500h.
- Z. Liu, L. Huang, L. Liu, B. Luo, M. Liang, Z. Sun, S. Zhu, X. Quan, Y. Yang, T. Ma, J. Huang and Z. Luo, Int. J. Nanomed., 2014, 10, 43–61, DOI:10.2147/IJN.S74332.
- Y. Xue, K. Jackson, N. Page, X. Mou, S. Lofland and X. Hu, Mater. Today Chem., 2021, 22, 100570, DOI:10.1016/j.mtchem.2021.100570.
- M. Filippi, B. Dasen, J. Guerrero, F. Garello, G. Isu, G. Born, M. Ehrbar, I. Martin and A. Scherberich, Biomaterials, 2019, 223, 119468, DOI:10.1016/j.biomaterials.2019.119468.
- Z. Yuan, K. Memarzadeh, A. S. Stephen, R. P. Allaker, R. A. Brown and J. Huang, Sci. Rep., 2018, 8, 16270, DOI:10.1038/s41598-018-33455-2.
- A. A. Abdeen, J. Lee, N. A. Bharadwaj, R. H. Ewoldt and K. A. Kilian, Adv. Healthcare Mater., 2016, 5, 2536–2544, DOI:10.1002/adhm.201600349.
- J. Zhuang, S. Lin, L. Dong, K. Cheng and W. Weng, Acta Biomater., 2018, 71, 49–60, DOI:10.1016/j.actbio.2018.03.009.
- B. Tang, X. Shen, Y. Yang, Z. Xu, J. Yi, Y. Yao, M. Cao, Y. Zhang and H. Xia, Colloids Surf., B, 2021, 198, 111473, DOI:10.1016/j.colsurfb.2020.111473.
- Z. Huang, Y. He, X. Chang, J. Liu, L. Yu, Y. Wu, Y. Li, J. Tian, L. Kang, D. Wu, H. Wang, Z. Wu and G. Qiu, Adv. Healthcare Mater., 2020, 9, 2000318, DOI:10.1002/adhm.202000318.
- D. Chouhan, S. Mehrotra, O. Majumder and B. B. Mandal, ACS Biomater. Sci. Eng., 2019, 5, 92–105, DOI:10.1021/acsbiomaterials.8b00240.
- W. Chen, Y. Zhang, J. Kumari, H. Engelkamp and P. H. J. Kouwer, Nano Lett., 2021, 21, 6740–6747, DOI:10.1021/acs.nanolett.1c00371.
- C. L. Ventola, P T, 2017, 42, 742–755 Search PubMed.
- B. B. Mandal, A. Grinberg, E. S. Gil, B. Panilaitis and D. L. Kaplan, Proc. Natl. Acad. Sci. U. S. A., 2012, 109, 7699–7704, DOI:10.1073/pnas.1119474109.
- P. Bhattacharjee, B. Kundu, D. Naskar, H. W. Kim, T. K. Maiti, D. Bhattacharya and S. C. Kundu, Acta Biomater., 2017, 63, 1–17, DOI:10.1016/j.actbio.2017.09.027.
- Y. Wang, D. D. Rudym, A. Walsh, L. Abrahamsen, H. J. Kim, H. S. Kim, C. Kirker-Head and D. L. Kaplan, Biomaterials, 2008, 29, 3415–3428, DOI:10.1016/j.biomaterials.2008.05.002.
- L. D. Koh, Y. Cheng, C. P. Teng, Y. W. Khin, X. J. Loh, S. Y. Tee, M. Low, E. Ye, H. D. Yu, Y. W. Zhang and M. Y. Han, Prog. Polym. Sci., 2015, 46, 86–110, DOI:10.1016/j.progpolymsci.2015.02.001.
- R. Brito-Pereira, D. M. Correia, C. Ribeiro, A. Francesko, I. Etxebarria, L. Pérez-Álvarez, J. L. Vilas, P. Martins and S. Lanceros-Mendez, Composites, Part B, 2018, 141, 70–75, DOI:10.1016/j.compositesb.2017.12.046.
- G. Greco, J. O. Wolff and N. M. Pugno, Front. Mater., 2020, 7, 138, DOI:10.3389/fmats.2020.00138.
- C. S. S. R. Kumar and F. Mohammad, Adv. Drug Delivery Rev., 2011, 63, 789–808, DOI:10.1016/j.addr.2011.03.008.
- L. Del Bianco, F. Spizzo, P. Sgarbossa, E. Sieni, G. Barucca, M. R. Ruggiero and S. Geninatti Crich, J. Phys. Chem. C, 2019, 123, 30007–30020, DOI:10.1021/acs.jpcc.9b09146.
- L. Lartigue, P. Hugounenq, D. Alloyeau, S. P. Clarke, M. Lévy, J. C. Bacri, R. Bazzi, D. F. Brougham, C. Wilhelm and F. Gazeau, ACS Nano, 2012, 6, 10935–10949, DOI:10.1021/nn304477s.
- X. Li, W. Li, M. Wang and Z. Liao, J. Controlled Release, 2021, 335, 437–448, DOI:10.1016/j.jconrel.2021.05.042.
- N. Minoura, M. Tsukada and M. Nagura, Biomaterials, 1990, 11, 430–434, DOI:10.1016/0142-9612(90)90100-5.
- C. Zhang, D. Song, Q. Lu, X. Hu, D. L. Kaplan and H. Zhu, Biomacromolecules, 2012, 13, 2148–2153, DOI:10.1021/bm300541g.
- H. Levine and L. Slade, in Water Science Reviews 3, Cambridge University Press, 2010, pp. 79–185. DOI:10.1017/cbo9780511552083.002.
- P. A. Janmey, D. A. Fletcher and C. A. Reinhart-King, Physiol. Rev., 2020, 100, 695–724, DOI:10.1152/physrev.00013.2019.
- D. E. Discher, P. Janmey and Y. L. Wang, Science, 2005, 310, 1139–1143, DOI:10.1126/science.1116995.
- R. G. M. Breuls, T. U. Jiya and T. H. Smit, Open Orthop. J., 2008, 2, 103–109, DOI:10.2174/1874325000802010103.
- C. B. Khatiwala, S. R. Peyton and A. J. Putnam, Am. J. Physiol.: Cell Physiol., 2006, 290, C1640–C1650, DOI:10.1152/ajpcell.00455.2005.
- W. J. Hadden, J. L. Young, A. W. Holle, M. L. McFetridge, D. Y. Kim, P. Wijesinghe, H. Taylor-Weiner, J. H. Wen, A. R. Lee, K. Bieback, B. N. Vo, D. D. Sampson, B. F. Kennedy, J. P. Spatz, A. J. Engler and Y. S. Cho, Proc. Natl. Acad. Sci. U. S. A., 2017, 114, 5647–5652, DOI:10.1073/pnas.1618239114.
- B. Cortese, G. Gigli and M. Riehle, Adv. Funct. Mater., 2009, 19, 2961–2968, DOI:10.1002/adfm.200900918.
- A. J. Engler, S. Sen, H. L. Sweeney and D. E. Discher, Cell, 2006, 126, 677–689, DOI:10.1016/j.cell.2006.06.044.
- M. Yamazaki, S. Kidoaki, H. Fujie and H. Miyoshi, Anal. Sci., 2021, 37, 447–453, DOI:10.2116/analsci.20SCP02.
- N. D. Evans, C. Minelli, E. Gentleman, V. LaPointe, S. N. Patankar, M. Kallivretaki, X. Chen, C. J. Roberts and M. M. Stevens, Eur. Cells Mater., 2009, 18, 1–13, DOI:10.22203/ecm.v018a01.
- Y. Yamamoto, Y. Ohsaki, T. Goto, A. Nakasima and T. Iijima, J. Dent. Res., 2003, 82, 962–966, DOI:10.1177/154405910308201205.
- K. H. Chiu, K. L. Ou, S. Y. Lee, C. T. Lin, W. J. Chang, C. C. Chen and H. M. Huang, Ann. Biomed. Eng., 2007, 35, 1932–1939, DOI:10.1007/s10439-007-9370-2.
- S. W. Feng, Y. J. Lo, W. J. Chang, C. T. Lin, S. Y. Lee, Y. Abiko and H. M. Huang, Med. Biol. Eng. Comput., 2010, 48, 793–798, DOI:10.1007/s11517-010-0639-5.
- X. Ba, M. Hadjiargyrou, E. DiMasi, Y. Meng, M. Simon, Z. Tan and M. H. Rafailovich, Biomaterials, 2011, 32, 7831–7838, DOI:10.1016/j.biomaterials.2011.06.053.
- S. H. Hsu and J. C. Chang, Cytotechnology, 2010, 62, 143–155, DOI:10.1007/s10616-010-9271-3.
- E. C. Kim, R. Leesungbok, S. W. Lee, H. W. Lee, S. H. Park, S. J. Mah and S. J. Ahn, Bioelectromagnetics, 2015, 36, 267–276, DOI:10.1002/bem.21903.
- C. Cunha, S. Panseri, M. Marcacci and A. Tampieri, Am. J. Biomed. Eng., 2013, 2, 263–268, DOI:10.5923/j.ajbe.20120206.05.
- V. Denaro, A. Cittadini, S. A. Barnaba, L. Ruzzini, L. Denaro, A. Rettino, B. De Paola, N. Papapietro and A. Sgambato, Spine, 2008, 33, 955–959, DOI:10.1097/BRS.0b013e31816c90b8.
- K. M. Kim, Y. J. Choi, J. H. Hwang, A. R. Kim, H. J. Cho, E. S. Hwang, J. Y. Park, S. H. Lee and J. H. Hong, PLoS One, 2014, 9, e92427, DOI:10.1371/journal.pone.0092427.
- S. K. Dash, V. Sharma, R. S. Verma and S. K. Das, Biomicrofluidics, 2020, 14, 054107, DOI:10.1063/5.0024437.
- M. H. Yen, Y. H. Chen, Y. S. Liu and O. K. S. Lee, Biochem. Biophys. Res. Commun., 2020, 526, 827–832, DOI:10.1016/j.bbrc.2020.03.146.
- S. Y. Tee, J. Fu, C. S. Chen and P. A. Janmey, Biophys. J., 2011, 100, L25–L27, DOI:10.1016/j.bpj.2010.12.3744.
- K. Tsuchiya, H. Masunaga and K. Numata, Biomacromolecules, 2017, 18, 1002–1009, DOI:10.1021/acs.biomac.6b01891.
- L. Wang, C. Lu, B. Zhang, B. Zhao, F. Wu and S. Guan, RSC Adv., 2014, 4, 40312–40320, 10.1039/c4ra04529g.
- E. P. Furlani and X. Xue, Microfluid. Nanofluid., 2012, 13, 589–602, DOI:10.1007/s10404-012-0975-x.
- W. C. Oliver and G. M. Pharr, J. Mater. Res., 1992, 7, 1564–1583, DOI:10.1557/JMR.1992.1564.
Footnotes |
| † Electronic supplementary information (ESI) available. See DOI: https://doi.org/10.1039/d2nr03167a |
| ‡ These authors contributed equally. |
| This journal is © The Royal Society of Chemistry 2022 |