Mo6+–P5+ co-doped Li2ZnTi3O8 anode for Li-storage in a wide temperature range and applications in LiNi0.5Mn1.5O4/Li2ZnTi3O8 full cells†
Zhongxue
Zhang
a,
Lianjing
Feng
a,
Huanhuan
Liu
a,
Lijuan
Wang
 *a,
Song
Wang
*a and
Zhiyuan
Tang
b
aCollege of Petroleum and Chemical Technology, Liaoning Petrochemical University, Fushun, 113001, Liaoning, China. E-mail: lijuanw123@163.com; wsong01@126.com
bDepartment of Applied Chemistry, School of Chemical Engineering and Technology, Tianjin University, Tianjin, 300072, China
First published on 22nd October 2021
Abstract
A one-step solid-state method has been used to synthesize Li2ZnTi3O8 (LZTO) co-doped with Mo6+ and P5+ ions (LZM7TP3O). The structural stability, pore size and specific surface area have been improved via this strategy. In addition, LZM7TP3O has high ionic and electronic conductivities, and small transfer resistance. So, this co-doping strategy tremendously enhances the electrochemical performance of LZM7TP3O in a wide temperature range. No capacity fading occurs for LZM7TP3O after cycling for 600 cycles at 25 °C, based on the 2nd cycle at 1 A g−1. 180.5 mA h g−1 is still kept at 3 A g−1 for the 120th cycle. No capacity decay occurs for LZM7TP3O after cycling for 100 cycles at 55 °C, relative to the 2nd cycle at 1 A g−1. At 0 °C, there is no capacity lost after cycling for 1000 cycles at 0.5 A g−1, relative to the 2nd cycle. At 0.5 C, the initial discharge specific capacity of the LiNi0.5Mn1.5O4/LZM7TP3O full cell can reach 214.3 mA h g−1 in 2–4.55 V, when LZM7TP3O is used as the anode of the full cell. Moreover, the full cell can power red, green and blue light emitting diode (LED) bulbs. The results indicate that LZM7TP3O is an appealing anode for lithium-ion batteries.
Introduction
Various electrochemical energy storage devices have been developed due to the increasing demand for sustainable, environmental and efficient energy supplies. Among these devices, lithium-ion batteries (LIBs) have been widely researched and applied owing to their exceptional performance.1–3 Graphite is the typical anode in traditional LIBs. However, the application of graphite is limited in high-power LIBs due to its poor safety and rate capability.4,5 Subsequently, Li4Ti5O12 (LTO), with a spinel structure, has been developed as a candidate because it can overcome the shortcomings of graphite. However, the energy densities of LIBs are limited when LTO with a low specific capacity in the 1–3 V range is used as the anode.6,7 Although a higher capacity can be obtained for LTO in the 0–3 V range, the cycling performance and coulombic efficiency (CE) at the 1st cycle will be worsened.8,9 Therefore, the electrochemical performance of LTO has mainly been researched in the 1–3 V range.10,11Li2ZnTi3O8 (LZTO), with a spinel structure, has been researched as an anode material for LIBs since 2010.12 Zn ions occupy the tetrahedral sites, and the octahedral sites are occupied by Li and Ti ions with 1![[thin space (1/6-em)]](https://www.rsc.org/images/entities/char_2009.gif) :
:![[thin space (1/6-em)]](https://www.rsc.org/images/entities/char_2009.gif) 3 cation ordering in the LZTO crystal structure. LZTO has aroused great interest from researchers as a new Ti-based anode as it has many advantages:12–22 (1) the insertion potential of Li+ ions is high for LZTO, which can guarantee the good safety of the LIBs; (2) compared with LTO, a relatively high theoretical specific capacity can be obtained for LZTO; (3) the zero-strain characteristic of LZTO guarantees the good cycling performance; (4) LZTO has wide channels for the migration of Li+ ions; (5) generally speaking, the sintering temperature of LTO is 800–900 °C and the sintering time is ca. 10 h in a solid-state route.23–25 The successful synthesis of LZTO is usually below 800 °C and the synthetic time is short, at 3–5 h.12,13 So, compared with LTO, the synthetic technology is simple and easy to industrialize for LZTO.
3 cation ordering in the LZTO crystal structure. LZTO has aroused great interest from researchers as a new Ti-based anode as it has many advantages:12–22 (1) the insertion potential of Li+ ions is high for LZTO, which can guarantee the good safety of the LIBs; (2) compared with LTO, a relatively high theoretical specific capacity can be obtained for LZTO; (3) the zero-strain characteristic of LZTO guarantees the good cycling performance; (4) LZTO has wide channels for the migration of Li+ ions; (5) generally speaking, the sintering temperature of LTO is 800–900 °C and the sintering time is ca. 10 h in a solid-state route.23–25 The successful synthesis of LZTO is usually below 800 °C and the synthetic time is short, at 3–5 h.12,13 So, compared with LTO, the synthetic technology is simple and easy to industrialize for LZTO.
Even so, the low electrical conductivity is the main drawback of LZTO.26,27 Coating with conductive materials, metal ion doping and morphology designing are the major modification methods.28–33 Among these strategies, doping can not only enhance the electrical conductivity but can also stabilize the structure of LZTO. For LZTO, the whole electrochemical performance has been highly enhanced via Mo6+-,34 Fe3+-,35 Ce4+-,36 or Ti3+-doping.13 Chen et al. synthesized Ce-doped LZTO via a solid-state route.36 The doping strategy significantly improved the overall electrochemical performance. When the current density was 20 C, 178.4 mA h g−1 was maintained for Ce-doped LZTO. Compared with LZTO, the value improved by 27.5 mA h g−1 for Ce-doped LZTO. At 10 C cycling for 500 cycles, the capacity retention reached 75% relative to the 2nd cycle for Ce-doped LZTO. However, the value was only 22.6% for LZTO, which was remarkably lower than that of Ce-doped LZTO. To some extent, the rate capability or cycling performance of LZTO have been improved via Zr4+-,37 Ag+-,38 Cu2+-,39 Al3+-,40 or Na+-doping.41 Yang et al. synthesized Zr-doped LZTO (LZTO/LZO) via a two-step route.37 The cycling performance was significantly improved. At 0.5 A g−1, 199.2 mA h g−1 was retained after 600 cycles with a retention of 99.1% for Zr-doped LZTO. However, when LZTO/LZO was cycled at 1.6 A g−1, only 109.8 mA h g−1 was maintained. The rate capability of LZTO/LZO was not perfect. Chen et al. synthesized Na-doped LZTO via a solid-state method.41 The discharge specific capacities of LZTO at high current densities were greatly enhanced via the strategy. When the current density was 2 C, 103.2 and 162.3mA h g−1 were obtained for LZTO and Na-doped LZTO after 80 cycles, respectively. At 0.1 A g−1, 571.9 and 616.3 mA h g−1 were delivered at the initial cycle for LZTO and Na-doped LZTO, respectively. Nevertheless, after 50 cycles, the values were only 171.2 and 267.2 mA h g−1 for LZTO and Na-doped LZTO, respectively. The capacity losses were severe for the two samples. Therefore, the selection of dopants is important. It has been reported that the substitution of ions with high valences for ions with low valences will introduce some Ti3+ ions due to the charge balance. The electronic conductivity of LZTO will increase, owing to the existence of the mixed Ti4+/Ti3+ states. Substitution of Mo6+ for Zn2+ improved the whole electrochemical performance of LZTO in our previous reports.34 It is feasible to replace Ti4+ with P5+ due to the high valence of P5+. Yan et al. synthesized P5+-doped Li4Ti5O12.42 Li4Ti4.8P0.2O12 showed good cycling performance with an increase in the electronic conductivity due to the presence of the mixed Ti3+/Ti4+ states. Long et al. successfully introduced P into a Si anode for LIBs.43 At 0.2 A g−1, the P-doped Si anode delivered a large specific capacity of 2460.4 mA h g−1. 911 mA h g−1 was still delivered even at a high current density of 16 A g−1. In addition, after cycling for 100 cycles at 2 A g−1, 1564 mA h g−1 was obtained. P-doping improved the redox kinetics of the Si anode.
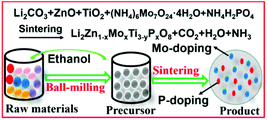
The radii of Mo6+ and P5+ are smaller than those of Zn2+ and Ti4+, respectively. Therefore, Mo6+ and P5+ ions will easily enter the crystal lattice of LZTO. Moreover, the substitution of Mo6+ and P5+ with high valences for Zn2+ and Ti4+ with low valences will introduce some Ti3+ ions due to the charge balance, which will then increase the electronic conductivity of LZTO. Therefore, it is expected that Mo6+-P5+ co-doped LZTO will show a remarkably improved electrochemical performance. However, the application of Mo6+–P5+ co-doped LZTO in LIBs has not been seen in previous reports. In this work, a Mo6+–P5+ co-doping strategy was explored to enhance the overall electrochemical performance of LZTO (Scheme 1) for the first time. In addition, the Li-storage of Mo6+–P5+ co-doped LZTO was researched in half and full cells.
Experimental
Materials synthesis
Li2Zn1−xMoxTi3O8 (x = 0, 0.05, 0.07, 0.09), Li2ZnTi3−yPyO8 (y = 0.01, 0.03, 0.05) and Li2Zn1−xMoxTi3−yPyO8 (x = 0.07, y = 0.03) anodes were fabricated via a one-step solid-state route. The synthetic details are given in the ESI†.Physical and electrochemical measurements
The synthetic details are given in the ESI†.Results and discussion
The rate capabilities of LZTO and Mo-doped LZTO are shown in Fig. 1a. 129.3, 154.7, 174.0 and 132.3 mA h g−1 (the 110th cycle) are obtained at 3 A g−1 for LZTO, LZM5TO, LZM7TO and LZM9TO, respectively. Therefore, LZM7TO has the best rate capability. At 1 A g−1, the cycling results of LZTO and P-doped LZTO (Fig. 1b) show that P-doping enhances the discharge specific capacity of LZTO. At the 200th cycle, 159.8, 168.2, 186.6 and 178.6 mA h g−1 are maintained for LZTO, LZTP1O, LZTP3O and LZTP5O, respectively. LZTP3O has the highest values in the whole cycling process. So, the optimal amounts of the Mo element and P element are selected as 0.07 and 0.03, respectively, in the Mo–P co-doped LZTO (LZM7TP3O). The theoretical fractions of Mo and P are 1.90 wt% and 0.26 wt% in LZM7TP3O, respectively. The actual values are 1.77 wt% and 0.25 wt%, respectively, tested by the ICP (inductively coupled plasma emission spectroscopy) technique. The actual fractions are close to the theoretical values for the Mo and P elements. Fig. S1† shows the thermogravimetric and differential thermogravimetric (TG-DTG) curves of the precursors for LZTO and Mo–P co-doped LZTO. No weight loss occurs over 530 °C, suggesting that the LZTO or LZM7TP3O phase forms at this temperature. So, 700 °C is selected as the calcination temperature in the work.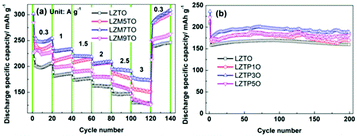 | ||
| Fig. 1 (a) Rate capability of LZTO and Mo-doped LZTO. (b) Cycling performance of LZTO and P-doped LZTO. | ||
Fig. 2a shows the X-ray diffraction (XRD) patterns of LZTO and LZM7TP3O. All the diffraction peaks belong to LZTO (JCPDS# 86-1512) for the two samples. No other phases are detected from the spectrum of LZM7TP3O, indicating that Mo and P elements have entered the crystal lattice of LZTO. X-ray photoelectron spectroscopy (XPS) results show that Mo and P in the states of Mo6+ and P5+ exist in LZM7TP3O, respectively, and there are some Ti3+ ions on the surface of LZM7TP3O (Fig. S2†). Therefore, the extra charges of Mo6+ and P5+ should be compensated by the existence of Ti3+, indicating that Mo and P elements have been doped into LZTO. It has been reported that the mixed valences of Ti4+/Ti3+ can enhance the electron conduction of LZTO.13,30,44 On one hand, for LZTO, the lattice parameters will shrink via the substitution of the ions with small radii for the ions with large radii. The radii of Mo6+, Zn2+, P5+ and Ti4+ are 62, 74, 34 and 61 nm, respectively. On the other hand, for LZTO, the parameters will increase due to the appearance of some Ti3+ ions. The radius of Ti3+ (r = 67 nm) is larger than that of Ti4+ (r = 61 nm). The enlarged (311) plane slightly shifts to a lower angle (Fig. 2b), indicating that the lattice constants increase, and that the latter is the main factor. In order to investigate the sites of Mo and P in LZTO, the X-ray diffraction pattern of LZM7TP3O was refined using the Rietveld refinement method. The refinement results (Tables 1 and 2, and Fig. 2d) indicate that the substitution of Mo6+ ions into the 8c site for some Zn2+ ions and of P5+ into the 12d site for some Ti4+ ions are the best and most reasonable. In addition, the refinement results further show the increase of the lattice constants (Table 2). Moreover, the dopants of Mo and P are uniformly dispersed in LZM7TP3O (Fig. S3†).
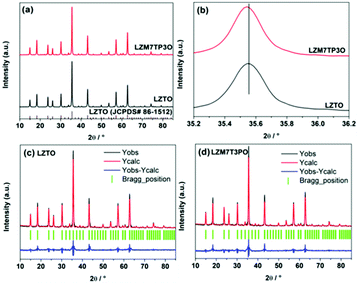 | ||
| Fig. 2 (a) XRD patterns of LZTO and LZM7TP3O, and (b) magnified (111) peaks of LZTO and LZM7TP3O. XRD refinement profiles of (c) LZTO and (d) LZM7TP3O. | ||
| Site | Atom | x | y | z | Occupancy |
|---|---|---|---|---|---|
| 4b | Li | 0.625 | 0.625 | 0.625 | 1 |
| 8c | Li | −0.00160 | −0.00160 | −0.00160 | 0.5 |
| 8c | Zn | −0.00160 | −0.00160 | −0.00160 | 0.465 |
| 8c | Mo | −0.00160 | −0.00160 | −0.00160 | 0.035 |
| 8c | O | 0.39203 | 0.39203 | 0.39203 | 1 |
| 12d | Ti | 0.36759 | 0.88241 | 0.125 | 0.99 |
| 12d | P | 0.36759 | 0.88241 | 0.125 | 0.01 |
| 24e | O | 0.10668 | 0.12222 | 0.39118 | 1 |
| Sample | a = b = c (Å) | V (Å3) | R wp (%) | R p (%) | χ 2 |
|---|---|---|---|---|---|
| LZTO | 8.369 | 586.176 | 11.8 | 8.75 | 2.00 |
| LZM7TP3O | 8.369(2) | 586.203 | 11.6 | 8.41 | 1.89 |
The morphologies of LZTO and LZM7TP3O are shown in Fig. 3a and b. It can be seen that the two samples consist of nanoparticles and no obvious difference in the morphologies is found between the two samples. The particle sizes are 38 and 28 nm for LZTO and LZM7TP3O (Fig. 3c and d), respectively. Therefore, Mo–P co-doping can reduce the particle size and increase the pore size, as well as the specific surface area (Fig. S4 and Table S1†), which will provide many active sites for the insertion and de-insertion of Li+ ions and promote the fast diffusion of Li+ ions. Heterogeneous Mo and P in the LZTO lattice may inhibit the overgrowth of the LZTO crystals and then the particle size of LZM7TP3O is reduced. In addition, the two samples have good crystallinity according to the high-resolution transmission electron microscopy (HR-TEM) images (Fig. 3e and f), which is advantageous to the electrochemical performance.
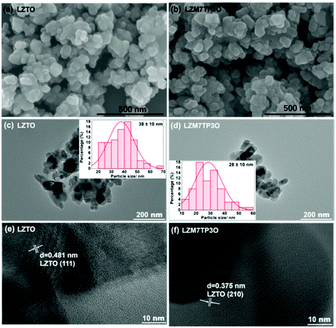 | ||
| Fig. 3 SEM images of (a) LZTO and (b) LZM7TP3O. TEM images of (c) LZTO and (d) LZM7TP3O (insets: histograms of the particle size distribution). HR-TEM images of (e) LZTO and (f) LZM7TP3O. | ||
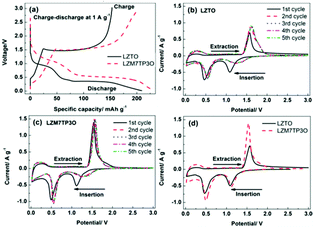
Charge–discharge and cyclic voltammetry (CV) techniques were used to research the electrochemical reaction mechanism (Fig. 4). During the insertion of Li+ ions, two discharge plateaus appear in each discharge curve at ca. 1.06 and 0.46 V, and accordingly, two cathodic peaks appear in every CV curve. During the de-insertion process of Li+ ions, a charge plateau appears in each charge curve at ca. 1.47 V, and accordingly, one anodic peak appears in every CV curve. The insertion and de-insertion of Li+ ions are assigned to the redox couple of Ti4+/Ti3+. The plateau/peak at ca. 0.5 V may be related to the multiple restorations of Ti4+.45,46 From the 2nd cycle, it is obvious that the two cathodic peaks move to high potentials, which may originate from the irreversible lithiation at the 1st cycle.47,48Fig. 4d makes comparisons of CV curves between LZTO and LZM7TP3O for the initial cycle. It is obvious that Mo–P co-doping can improve the reversibility of insertion and de-insertion for Li+ ions (Fig. 4d and Table 3).
| Sample | φ pa (V) | φ pc (V) | φ p (V) = φpa − φpc |
|---|---|---|---|
| LZTO | 1.561 | 1.087 | 0.474 |
| LZM7TP3O | 1.537 | 1.118 | 0.419 |
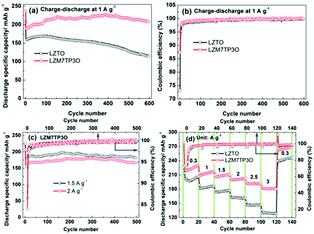
The cycling performance of LZTO and LZM7TP3O at 1 A g−1 is shown in Fig. 5a. For LZTO and LZM7TP3O, 113.8 and 208.1 mA h g−1 are still obtained for the 600th cycle, respectively. The capacity retention is only 69% for LZTO relative to the specific capacity of the 2nd cycle. However, there is no capacity fading for LZM7TP3O. Obviously, the cycling performance is greatly improved for LZTO via Mo–P co-doping. 209.3 and 237.7 mA h g−1 are delivered and the CE reaches 73.2% and 87.3% for LZTO and LZM7TP3O during the initial cycle, respectively. For the two samples, the CE is close to 100% after three cycles, and is higher for LZM7TP3O (Fig. 5b), indicating the high reversibility of insertion and de-insertion for Li+ ions. For the two electrodes, the high irreversible initial capacity losses originate from the formation of a solid electrolyte interface (SEI) layer, which will reduce the side reactions between LZTO/LZM7TP3O and the electrolyte, and then help the subsequent cycling performance. When the current densities are increased, LZM7TP3O still exhibits good cycling performance. After 500 cycles at 1.5 A g−1, no capacity loss occurs relative to the 2nd cycle. After cycling for 500 cycles at 2 A g−1, 98.2% of the specific capacity at the 2nd cycle is retained (Fig. 5c). For LZM7TP3O, its cycling performance exceeds those of many reports in literatures (Table S2†). It has been found in previous reports that the capacities of LZTO electrodes continuously increase during the initial several cycles, owing to the continuous decomposition of the electrolyte.44,47 A similar phenomenon appears in other Ti-based anodes, such as the LTO anode.49,50 As previously reported, coating can reduce the decomposition of the electrolyte on the Ti-based anodes. Therefore, it is expected that the combination of coating and doping can further enhance the cycling performance of Ti-based anodes. In addition, when the current densities are increased, the initial CE of LZM7TP3O slightly decreases, owing to the increase of the polarization for the electrode. After several cycles, the CE is close to 100%.
The rate capabilities of LZTO and LZM7TP3O were measured at 0.3–3 A g−1, and the results are shown in Fig. 5d. It is obvious that the rate capability of LZM7TP3O is greatly improved via Mo–P co-doping. At 2, 2.5 and 3 A g−1, 201.8, 191.9 and 180.5 mA h g−1 are delivered, respectively. The performance is better than that of LZTO and some other anodes reported in the literature (Tables S3 and 4†). The enhanced rate capability and cycling performance of LZM7TP3O may be ascribed to the following reasons: (1) the internal resistance can be greatly reduced via Mo–P co-doping (Fig. S5†); (2) the structural stability of LZM7TP3O can be improved via Mo–P co-doping (Fig. S6†). At 1 A g−1, the LZTO and LZM7TP3O electrodes were cycled for 200 cycles and the XRD patterns were collected for the two electrodes. The diffraction peaks of the LZM7TP3O electrode are still sharp after cycling, suggesting that the structure of LZM7TP3O retains remarkable stability during the insertion and de-insertion of Li+ ions. However, some of the diffraction peaks for the LZTO electrode are blurry after cycling, indicating that the structure of LZTO is partly changed during the cycling process; (3) surface integrity and good electrical contact are obtained in the cycling process for the LZM7TP3O electrode (Fig. S7†); (4) more active sites for the insertion and de-insertion of Li+ ions will be provided due to the large specific surface area of LZM7TP3O (Fig. S4 and Table S1†). The specific surface areas are 21.4 and 23.4 m2 g−1 for LZTO and LZM7TP3O, respectively; (5) the large pore size of LZM7TP3O can quicken the diffusion of Li+ ions (Fig. S4 and Table S1†); (6) small Rct and high DLi+ and electronic conductivity (Fig. S8 and Table S5†) can be in favour of the rate capability of LZM7TP3O. The Rct are 155 and 28.73 Ω for the LZTO and LZM7TP3O electrodes cycling for cycles at different current densities (Fig. 5d), respectively. The DLi+ are 1.12 × 10⁻¹⁰ and 1.47 × 10⁻⁹ cm2 s−1 for the LZTO and LZM7TP3O electrodes, respectively.
It is important for a cathode or an anode to have good electrochemical performance in wide temperature range. However, only few studies have reported the electrochemical performance of LZTO at high and low temperatures. Fig. 6a shows the cycling performance of LZTO and LZM7TP3O at 55 °C. At the 100th cycle, the capacity retention of LZTO and LZM7TP3O reaches 89.6% and 115.8% relative to the 2nd cycle, respectively. It is well known that the side reactions between electrolytes and active materials will intensify at high temperatures, and then the cycling performance of the electrodes will worsen. However, LZM7TP3O shows excellent cycling performance at 55 °C, which can exceed that of the previous reports,47,51 indicating that Mo–P co-doping has greatly stabilized the structure of LZTO. In addition, at a low temperature of 0 °C, LZM7TP3O still has excellent cycling performance and rate capability. At 0.6 A g−1, 196.2 mA h g−1 is maintained at the 60th cycle (Fig. 6b). Even after 1000 cycles at 0.5 A g−1, no capacity fading occurs for LZM7TP3O (Fig. 6c). When the temperature increases, the side reactions intensify and then the CE decreases. Therefore, LZTO and LZM7TP3O have higher initial CE at the low temperature of 0 °C than at 55 °C.
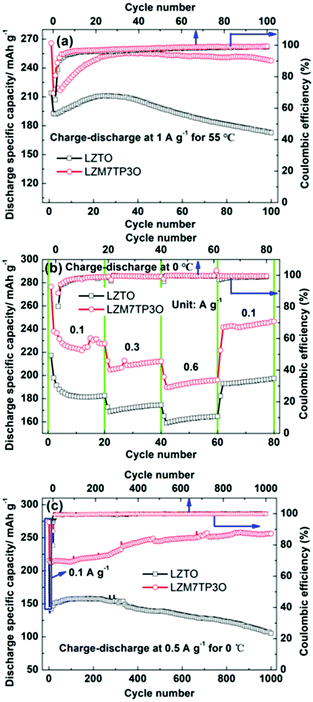 | ||
| Fig. 6 Cycling performance of LZTO and LZM7TP3O at (a) 1 A g−1 at 55 °C and (b) 0.5 A g−1 at 0 °C, and (c) rate capability of LZTO and LZM7TP3O at 0 °C and the corresponding coulombic efficiency. | ||
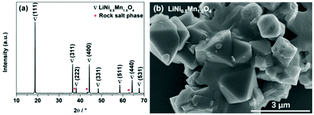
If LZM7TP3O is to be commercialized, it should have good electrochemical performance in full cells, which is evaluated in LiNi0.5Mn1.5O4/LZM7TP3O using LiNi0.5Mn1.5O4 as the cathode. In this study, LiNi0.5Mn1.5O4 was purchased from Shenzhen Biyuan Electronics Co., Ltd. As is usually reported, there is a very small amount of rock salt phase in LiNi0.5Mn1.5O4 (Fig. 7a). LiNi0.5Mn1.5O4 shows an irregular morphology (Fig. 7b).
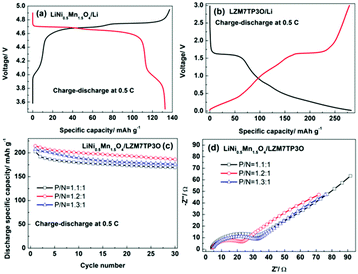
Usually, the design of a full cell is according to the capacities of the cathode and anode electrodes at 0.5 C. So, the discharge specific capacities were tested for the LiNi0.5Mn1.5O4 cathode and the LZM7TP3O anode at 0.5 C, and the values are ca. 130 and 280 mA h g−1, respectively (Fig. 8a and b). It is noted that the discharge specific capacity of LZM7TP3O is over the theoretical value. This may be related to the side reactions between LZM7TP3O and the electrolyte.44,47 It is well known that the capacity of the carbon anode is slightly in excess to prevent lithium deposition in commercial LIBs. That is to say, the capacity of the cell is limited by the positive electrode. When the lithiation potential is high for an anode, the limiting of the cell capacity by the positive electrode is unnecessary. As for the LiNi0.5Mn1.5O4/LTO full cell, it is necessary to design the cell with excess positive capacity to alleviate the decomposition of the electrolyte at the high potential region by keeping a relatively large value of x in LixNi0.5Mn1.5O4 when the cell is near or at its fully charged state.52,53 The lithiation potential is high for the LZTO anode. Therefore, the capacity of the positive electrode should be slightly in excess when the full cell consists of a LiNi0.5Mn1.5O4 cathode and LZTO anode. The electrochemical performance of the LiNi0.5Mn1.5O4/LZM7TP3O full cells was assessed in the range of 2.0–4.55 V. The selection of the voltage range was based on the CV results (Fig. S9†). Fig. S9† shows the CV curves of LiNi0.5Mn1.5O4/Li, LZM7TP3O/Li and LiNi0.5Mn1.5O4/LZM7TP3O in 3.5–5.0 V, 0.02–3 V and 2–4.55 V, respectively. For LiNi0.5Mn1.5O4/Li (Fig. S9a†), the peaks at 4.03/3.97 V are from the redox couple of Mn4+/Mn3+, and the peaks at 4.75 (4.80)/4.61 V originate from the redox couples of Ni3+/Ni2+ and Ni4+/Ni3+, respectively. For LZM7TP3O/Li (Fig. S9b†), the pair of redox peaks at 1.24/1.55 V is due to the redox couple of Ti4+/Ti3+. In addition, a cathodic peak at 0.5 V is detected. There are three oxidation peaks at 2.67, 3.46 and 4 V, and one sharp reduction peak at 3.24 V for the LiNi0.5Mn1.5O4/LZM7TP3O full cell (Fig. S9c†). Li+ ions can be inserted/de-inserted to the maximum extent in the range of 2.0–4.55 V for the LiNi0.5Mn1.5O4/LZM7TP3O full cell. In addition, the potential window will not cause many side reactions between the electrolyte and active materials.
When the capacity ratios of the cathode to the anode (P/N) are 1.1![[thin space (1/6-em)]](https://www.rsc.org/images/entities/char_2009.gif) :
:![[thin space (1/6-em)]](https://www.rsc.org/images/entities/char_2009.gif) 1, 1.2
1, 1.2![[thin space (1/6-em)]](https://www.rsc.org/images/entities/char_2009.gif) :
:![[thin space (1/6-em)]](https://www.rsc.org/images/entities/char_2009.gif) 1 and 1.3
1 and 1.3![[thin space (1/6-em)]](https://www.rsc.org/images/entities/char_2009.gif) :
:![[thin space (1/6-em)]](https://www.rsc.org/images/entities/char_2009.gif) 1 in the LiNi0.5Mn1.5O4/LZM7TP3O full cells, the discharge specific capacities of the full cells are 202.8, 214.3 and 207.4 mA h g−1 at the initial cycle, respectively. When cycled for 30 cycles, the capacity retention is 83.4%, 86.8 and 85%, respectively. Therefore, when the capacity ratio of the cathode to the anode is 1.2
1 in the LiNi0.5Mn1.5O4/LZM7TP3O full cells, the discharge specific capacities of the full cells are 202.8, 214.3 and 207.4 mA h g−1 at the initial cycle, respectively. When cycled for 30 cycles, the capacity retention is 83.4%, 86.8 and 85%, respectively. Therefore, when the capacity ratio of the cathode to the anode is 1.2![[thin space (1/6-em)]](https://www.rsc.org/images/entities/char_2009.gif) :
:![[thin space (1/6-em)]](https://www.rsc.org/images/entities/char_2009.gif) 1, the LiNi0.5Mn1.5O4/LZM7TP3O full cell possesses the largest discharge capacity and best cycling performance (Fig. 8c) at 0.5 C. Fig. 8d shows the impedance spectra of the LiNi0.5Mn1.5O4/LZM7TP3O full cells with different P/N ratios after cycling for 30 cycles at 0.5 C. The semicircles are attributed to the charge transfer resistances of the full cells. It is known that a small charge transfer resistance is advantageous to the electrochemical performance of a cell. Among the three types of full cells, the LiNi0.5Mn1.5O4/LZM7TP3O full cell with the P/N of 1.2
1, the LiNi0.5Mn1.5O4/LZM7TP3O full cell possesses the largest discharge capacity and best cycling performance (Fig. 8c) at 0.5 C. Fig. 8d shows the impedance spectra of the LiNi0.5Mn1.5O4/LZM7TP3O full cells with different P/N ratios after cycling for 30 cycles at 0.5 C. The semicircles are attributed to the charge transfer resistances of the full cells. It is known that a small charge transfer resistance is advantageous to the electrochemical performance of a cell. Among the three types of full cells, the LiNi0.5Mn1.5O4/LZM7TP3O full cell with the P/N of 1.2![[thin space (1/6-em)]](https://www.rsc.org/images/entities/char_2009.gif) :
:![[thin space (1/6-em)]](https://www.rsc.org/images/entities/char_2009.gif) 1 has the smallest charge transfer resistance, which guarantees the large specific capacity and good cycling performance of the full cell. However, the cycling performance of the full cells need be further improved in our subsequent work.
1 has the smallest charge transfer resistance, which guarantees the large specific capacity and good cycling performance of the full cell. However, the cycling performance of the full cells need be further improved in our subsequent work.
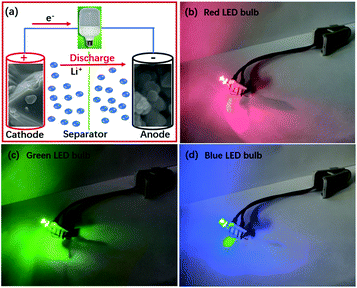
When the driving voltages are 1.8–2.2, 2.9–3.1 and 3.0–3.2 V, light emitting diode (LED) bulbs can emit red, green and blue lights, respectively. The working voltage is over 3.0 V for the LiNi0.5Mn1.5O4/LZM7TP3O full cell. So, it can successfully power LED bulbs that emit different colors of light (Fig. 9).
Conclusions
Mo6+–P5+ co-doped Li2ZnTi3O8 (LZM7TP3O) has been successfully structured via a one-step solid-state route. The modification enhances the structural stability, pore size and specific surface area, and gives LZM7TP3O a high ionic conductivity and small transfer resistance. The electrochemical performance of LZM7TP3O is greatly improved in a wide temperature range via the co-doping strategy. No capacity fading occurs for LZM7TP3O after cycling for 600 cycles at 25 °C, relative to the 2nd cycle at 1 A g−1. 180.5 mA h g−1 is still maintained at 3 A g−1 for the 120th cycle. No capacity decay occurs for LZM7TP3O after cycling for 100 cycles at 55 °C, relative to the 2nd cycle. When the current density is 0.5 A g−1, there is no capacity loss after 1000 cycles at 0 °C (relative to the 2nd cycle). When LZM7TP3O is used as the anode of the LiNi0.5Mn1.5O4/LZM7TP3O full cell, the discharge specific capacity of the full cell can reach 214.3 mA h g−1 at 0.5 C in the voltage range of 2–4.55 V for the 1st cycle. The working voltage of the full cell is over 3 V and it can power red, green and blue light emitting diode (LED) bulbs. In view of the good electrochemical performance in the wide temperature range and simple synthetic route, it is likely that the Mo6+–P5+ co-doped LZTO structure can be used as the anode of LIBs.Conflicts of interest
There are no conflicts to declare.Acknowledgements
This work was supported by the National Natural Science Foundation of China (U1504532), the Liaoning Revitalization Talents Program (XLYC1907025), the Liaoning Province Project Education Fund (LJKZ0408) and the Natural Science Foundation of Liaoning Shihua University (2018XJJ-012).References
- J. Xie and Y. C. Lu, A retrospective on lithium-ion batteries, Nat. Commun., 2020, 11, 2499 CrossRef CAS PubMed.
- F. Wu, J. Maier and Y. Yu, Guidelines and trends for next-generation rechargeable lithium and lithium-ion batteries, Chem. Soc. Rev., 2020, 49, 1569–1614 RSC.
- J. Hou, M. Yang, D. Wang and J. Zhang, Fundamentals and challenges of lithium ion batteries at temperatures between −40 and 60 °C, Adv. Energy Mater., 2020, 10, 1904152 CrossRef CAS.
- J. P. Pender, G. Jha, D. H. Youn, J. M. Ziegler, I. Andoni, E. J. Choi, A. Heller, B. S. Dunn, P. S. Weiss, R. M. Penner and C. B. Mullins, Electrode degradation in lithium-ion batteries, ACS Nano, 2020, 14, 1243–1295 CrossRef CAS PubMed.
- L. Zhang, X. Zhang, G. Tian, Q. Zhang, M. Knapp, H. Ehrenberg, G. Chen, Z. Shen, G. Yang, L. Gu and F. Du, Lithium lanthanum titanate perovskite as an anode for lithium ion batteries, Nat. Commun., 2020, 11, 3490 CrossRef CAS.
- R. Wang, X. Cao, D. Zhao, L. Zhu, L. Xie, J. Li and Y. Miao, Enhancing lithium storage performances of the Li4Ti5O12 anode by introducing the CuV2O6 phase, ACS Appl. Mater. Interfaces, 2020, 12, 39170–39180 CrossRef CAS PubMed.
- W. Qin, H. Liu, J. An and X. Wen, Enhanced Li-ion battery performance of TiO2 nanoparticle-loaded Li4Ti5O12 nanosheet anode using carbon coated copper as current collector, J. Power Sources, 2020, 479, 229090 CrossRef CAS.
- H. Liu, Z. Zhu, J. Huang, X. He, Y. Chen, R. Zhang, R. Lin, Y. Li, S. Yu, X. Xing, Q. Yan, X. Li, M. J. Frost, K. An, J. Feng, R. Kostecki, H. Xin, S. P. Ong and P. Liu, Elucidating the limit of Li insertion into the spinel Li4Ti5O12, ACS Mater. Lett., 2019, 1, 96–102 CrossRef CAS.
- Y.-R. Jhan and J.-G. Duh, Electrochemical performance and low discharge cut-off voltage behavior of ruthenium doped Li4Ti5O12 with improved energy density, Electrochim. Acta, 2012, 63, 9–15 CrossRef CAS.
- J. Liu, A. Wei, G. Pan, S. Shen, Z. Xiao, Y. Zhao and X. Xia, Self-supported hierarchical porous Li4Ti5O12/carbon arrays for boosted lithium ion storage, J. Energy Chem., 2021, 54, 754–760 CrossRef.
- S. Fu, X. Yu, Q. Wu, X. Yang, Z. Liu, X. Li, S. He, D. Wang, Y. Li, S. Tong and M. Wu, Ultrathin [110]–confined Li4Ti5O12 nanoflakes for high rate lithium storage, Adv. Energy Mater., 2021, 11, 2003270 CrossRef CAS.
- Z. Hong, M. Wei, X. Ding, L. Jiang and K. Wei, Li2ZnTi3O8 nanorods: A new anode material for lithium-ion battery, Electrochem. Commun., 2010, 12, 720–723 CrossRef CAS.
- C. Chen, C. Ai and X. Liu, Ti(III) self-doped Li2ZnTi3O8 as a superior anode material for Li-ion batteries, Electrochim. Acta, 2018, 265, 448–454 CrossRef CAS.
- Y. Ren, P. Lu, X. Huang, J. Ding and H. Wang, Synthesis and high cycle performance of Li2ZnTi3O8/C anode material promoted by asphalt as a carbon precursor, RSC Adv., 2016, 6, 49298–49306 RSC.
- W. Chen, H. Liang, W. Ren, L. Shao, J. Shu and Z. Wang, Complex spinel titanate as an advanced anode material for rechargeable, lithium-ion batteries, J. Alloys Compd., 2014, 611, 65–73 CrossRef CAS.
- K. Mukai, Reversible movement of Zn(2+) Ions with zero-strain characteristic: Clarifying the reaction mechanism of Li2ZnTi3O8, Inorg. Chem., 2019, 58, 10377–10389 CrossRef CAS PubMed.
- J.-L. Qin, H.-L. Zhu, N. Lun, Y.-X. Qi and Y.-J. Bai, Li2ZnTi3O8/C anode with high initial Coulombic efficiency, long cyclic life and outstanding rate properties enabled by fulvic acid, Carbon, 2020, 163, 297–307 CrossRef CAS.
- H. Tang, Q. Weng and Z. Tang, Chitosan oligosaccharides: A novel and efficient water soluble binder for lithium zinc titanate anode in lithium-ion batteries, Electrochim. Acta, 2015, 151, 27–34 CrossRef CAS.
- L. Wang, L. Wu, Z. Li, G. Lei, Q. xiao and P. Zhang, Synthesis and electrochemical properties of Li2ZnTi3O8 fibers as an anode material for lithium-ion batteries, Electrochim. Acta, 2011, 56, 5343–5346 CrossRef CAS.
- X. Li, L. Wang, C. Li, B. Chen, Q. Zhao and G. Zhang, Rational design of high-rate lithium zinc titanate anode electrode by modifying Cu current collector with graphene and Au nanoparticles, J. Power Sources, 2016, 308, 65–74 CrossRef CAS.
- L. Qiu, X.-Q. Lai, F. Wang, J. Pan, Y.-R. Zhu, P. Cui and T.-F. Yi, Promoting the Li storage performances of Li2ZnTi3O8@Na2WO4 composite anode for Li-ion battery, Ceram. Int., 2021, 47, 19455–19463 CrossRef CAS.
- X. Li, Q. Xiao, B. Liu, H. Lin and J. Zhao, One-step solution-combustion synthesis of complex spinel titanate flake particles with enhanced lithium-storage properties, J. Power Sources, 2015, 273, 128–135 CrossRef CAS.
- D. Li, X. Zhang, X. Miao, Y. Liu, S. Chen, Y. Chen, W. Wang and Y. Zhang, Solid-state synthesized Li4Ti5O12 for ultrafast lithium ion storage enabled by carbon-coating induced particle size tailoring, J. Alloys Compd., 2019, 797, 1258–1267 CrossRef CAS.
- G. Yang and S.-J. Park, Single-step solid-state synthesis and characterization of Li4Ti5−xFexO12−y (0 ≤ x ≤ 0.1) as an anode for lithium-ion batteries, J. Mater. Chem. A, 2020, 8, 2627–2636 RSC.
- B. Vikram Babu, K. Vijaya Babu, G. Tewodros Aregai, L. Seeta Devi, B. Madhavi Latha, M. Sushma Reddi, K. Samatha and V. Veeraiah, Structural and electrical properties of Li4Ti5O12 anode material for lithium-ion batteries, Results Phys., 2018, 9, 284–289 CrossRef.
- S. Yıldız and H. Şahan, In situ synthesis of reduced graphite oxide-Li2ZnTi3O8 composite as a high rate anode material for lithium-ion batteries, J. Electrochem. Soc., 2019, 166, A2002 CrossRef.
- Z. Hong and M. Wei, Layered titanate nanostructures and their derivatives as negative electrode materials for lithium-ion batteries, J. Mater. Chem. A, 2013, 1, 4403–4414 RSC.
- Y. Xu, Z. Hong, L. Xia, J. Yang and M. Wei, One step sol–gel synthesis of Li2ZnTi3O8/C nanocomposite with enhanced lithium-ion storage properties, Electrochim. Acta, 2013, 88, 74–78 CrossRef CAS.
- C. Chen, Z. Li and B. Xu, Surface modification of Li2ZnTi3O8 with the C&N layer for lithium-ion batteries, Mater. Chem. Phys., 2020, 245, 122718 CrossRef CAS.
- N. Firdous, N. Arshad, S. B. Simonsen, P. Kadirvelayutham and P. Norby, Advanced electrochemical investigations of niobium modified Li2ZnTi3O8 lithium ion battery anode materials, J. Power Sources, 2020, 462, 228186 CrossRef CAS.
- T.-F. Yi, J.-Z. Wu, J. Yuan, Y.-R. Zhu and P.-F. Wang, Rapid lithiation and delithiation property of V-doped Li2ZnTi3O8 as anode material for lithium-ion battery, ACS Sustainable Chem. Eng., 2015, 3, 3062–3069 CrossRef CAS.
- Z. Hong, X. Zheng, X. Ding, L. Jiang, M. Wei and K. Wei, Complex spinel titanate nanowires for a high rate lithium-ion battery, Energy Environ. Sci., 2011, 4, 1886–1891 RSC.
- J. Wang, W. Zhang, J. Li, B. Wang, C. Xu and C. Lai, In situ self-assembly assisted synthesis of N-doped mesoporous hierarchical carbon aerogels-wrapped Li2ZnTi3O8 composite for high-rate lithium ion batteries, J. Materiomics, 2021, 7, 1083–1093 CrossRef.
- S. Wang, Y. Bi, L. Wang, Z. Meng and B. Luo, Mo-doped Li2ZnTi3O8@graphene as a high performance anode material for lithium-ion batteries, Electrochim. Acta, 2019, 301, 319–324 CrossRef CAS.
- H. Li, Z. Li, X. Liang, J. Ouyang, Y. Ma, Y. Cui, C. Ma and Z. Tang, High rate performance Fe doped lithium zinc titanate anode material synthesized by one-pot co-precipitation for lithium ion battery, Mater. Lett., 2017, 192, 128–132 CrossRef CAS.
- C. Chen, C. Ai, X. Liu and Y. Wu, Advanced electrochemical properties of Ce-modified Li2ZnTi3O8 anode material for lithium-ion batteries, Electrochim. Acta, 2017, 227, 285–293 CrossRef CAS.
- H. Yang, J. Park, C.-S. Kim, Y.-H. Xu, H.-L. Zhu, Y.-X. Qi, L.-W. Yin, H. Li, N. Lun and Y.-J. Bai, Boosted electrochemical performance of Li2ZnTi3O8 enabled by ion-conductive Li2ZrO3 concomitant with superficial Zr-doping, J. Power Sources, 2018, 379, 270–277 CrossRef CAS.
- 1. H. Tang, Z. Tang, C. Du, F. Qie and J. Zhu, Ag-doped Li2ZnTi3O8 as a high rate anode material for rechargeable lithium-ion batteries, Electrochim. Acta, 2014, 120, 187–192 CrossRef.
- F. Qie and Z. Tang, Cu-doped Li2ZnTi3O8 anode material with improved electrochemical performance for lithium-ion batteries, Mater. Express, 2014, 4, 221–227 CrossRef CAS.
- H. Tang, J. Zhu, Z. Tang and C. Ma, Al-doped Li2ZnTi3O8 as an effective anode material for lithium-ion batteries with good rate capabilities, J. Electroanal. Chem., 2014, 731, 60–66 CrossRef CAS.
- W. Chen, Z. Zhou, R. Wang, Z. Wu, H. Liang, L. Shao, J. Shu and Z. Wang, High performance Na-doped lithium zinc titanate as anode material for Li-ion batteries, RSC Adv., 2015, 5, 49890–49898 RSC.
- G. Yan, X. Xu, W. Zhang, Z. Liu and W. Liu, Preparation and electrochemical performance of P(5+)-doped Li4Ti5O12 as anode material for lithium-ion batteries, Nanotechnology, 2020, 31, 205402 CrossRef CAS PubMed.
- B. Long, Y. Zou, Z. Li, Z. Ma, W. Jiang, H. Zou and H. Chen, Effect of phosphorus doping on conductivity, diffusion, and high rate capability in silicon anode for lithium-ion batteries, ACS Appl. Energy Mater., 2020, 3, 5572–5580 CrossRef CAS.
- Z. Zhang, R. Xun, L. Wang and Z. Meng, Construction of pseudocapacitive Li2-xLaxZnTi3O8 anode for fast and super-stable lithium storage, Ceram. Int., 2021, 47, 662–669 CrossRef CAS.
- H. Tang, J. Zhu, C. Ma and Z. Tang, Lithium cobalt oxide coated lithium zinc titanate anode material with an enhanced high rate capability and long lifespan for lithium-ion batteries, Electrochim. Acta, 2014, 144, 76–84 CrossRef CAS.
- H. Yang, X.-H. Wang, Y.-X. Qi, N. Lun, Y.-M. Cao and Y.-J. Bai, Improving the electrochemical performance of Li2ZnTi3O8 by surface KCl modification, ACS Sustainable Chem. Eng., 2017, 5, 6099–6106 CrossRef CAS.
- Z. Zhang, R. Xun, Z. Shen, L. Wang, S. Wang and Z. Meng, Synthesis of Nb-doped Li2ZnTi3O8 anode with long cycle life and applications in the LiMn2O4/Li2ZnTi3O8 full cell, ACS Sustainable Chem. Eng., 2020, 8, 2763–2771 CrossRef CAS.
- R. Li, Y. Pu, J. Xu, Q. Fu, G. Liang, X. Zhu, L. Luo, Y. Chen and C. Lin, Novel GaNb49O124 microspheres with intercalation pseudocapacitance for ultrastable lithium-ion storage, Ceram. Int., 2019, 45, 12211–12217 CrossRef CAS.
- Y.-B. He, F. Ning, B. Li, Q.-S. Song, W. Lv, H. Du, D. Zhai, F. Su, Q.-H. Yang and F. Kang, Carbon coating to suppress the reduction decomposition of electrolyte on the Li4Ti5O12 electrode, J. Power Sources, 2012, 202, 253–261 CrossRef CAS.
- Y. B. He, B. Li, M. Liu, C. Zhang, W. Lv, C. Yang, J. Li, H. Du, B. Zhang, Q. H. Yang, J. K. Kim and F. Kang, Gassing in Li4Ti5O12-based batteries and its remedy, Sci. Rep., 2012, 2, 913 CrossRef PubMed.
- Z. Shen, Z. Zhang, S. Wang, Z. Liu, L. Wang, Y. Bi and Z. Meng, Mg2+–W6+ co-doped Li2ZnTi3O8 anode with outstanding room, high and low temperature electrochemical performance for lithium-ion batteries, Inorg. Chem. Front., 2019, 6, 3288–3294 RSC.
- H. F. Xiang, X. Zhang, Q. Y. Jin, C. P. Zhang, C. H. Chen and X. W. Ge, Effect of capacity matchup in the LiNi0.5Mn1.5O4/Li4Ti5O12 cells, J. Power Sources, 2008, 183, 355–360 CrossRef CAS.
- W.-C. Chien, Z.-H. Wu, Y.-C. Hsieh, Y.-S. Wu, S.-H. Wu and C.-C. Yang, Electrochemical performance of Li4Ti5O12 anode materials synthesized using a spray-drying method, Ceram. Int., 2020, 46, 26923–26935 CrossRef CAS.
Footnote |
| † Electronic supplementary information (ESI) available. See DOI: 10.1039/d1qi01077h |
| This journal is © the Partner Organisations 2022 |

