DOI:
10.1039/D1RA06431B
(Paper)
RSC Adv., 2022,
12, 2262-2269
The sensing mechanism of a flavone-based ESIPT fluorescent chemodosimeter for selective recognition towards fluoride: a theoretical†
Received
25th August 2021
, Accepted 22nd December 2021
First published on 14th January 2022
Abstract
The sensing mechanism of 3-hydroxyflavone-based (3-HF) fluorescent chemodosimeter 3-triisopropylsilylflavone (3-TPSF) for detecting fluoride (F−) has been theoretically investigated. The calculated Laplacian bond order confirms that the Si–O bond of 3-TPSF is the reaction site of F−. The free energy barrier of 18.33 kcal mol−1 indicates that F-triggered desilylation reaction can occur and then form the anionic state of 3-HF (3-HF−) with a fluorescence peak at 545 nm. 3-HF− captures H+ of the mixed aqueous medium to be transformed into 3-HF with an intramolecular hydrogen bond (O1–H⋯O2). The energy barrier of 1.86 kcal mol−1 in the S1 state obtained from the constructed potential energy curves confirms that the excited state intramolecular proton transfer (ESIPT) in 3-HF occurs to form a tautomer structure, which produces a long-wavelength emission of 549 nm. The fluorescence emitted from both 3-HF− and 3-HF agrees with the experimental value of 530 nm appearing after adding F−. Charge transfer analyses indicate that the extent of intramolecular charge transfer in 3-HF− is more intense than that of 3-TPSF, which induces a large Stokes shift of 180 nm. Therefore, the sensing mechanism is attributed to the combination of a large charge transfer feature and ESIPT that are caused by desilylation reaction. The significant fluorescence change makes 3-TPSF a chemodosimeter for detecting F−.
1. Introduction
Fluoride (F−), as the smallest anion, has attracted extensive attention because of its great role in chemical sciences, medicine and the biological processes.1–4 It has a high electronegativity and widely exists in the natural environment, industry and biology. A proper intake of this element is beneficial to dental health and bone growth.5–8 The World Health Organization recommends that the acceptable intake level of F− in drinking water is 1.5 mg L−1.9–11 Ingestion above this level can be hazardous to living organisms, which may lead to fluoride poisoning, urinary stones and even death.7,12–14 Furthermore, the discharge of industrial wastewater containing F− can not only cause water and soil pollution, but also damage the ecological environment and even threaten human health.15–17 Consequently, the development of analytical methods for efficient recognition and quantitative detection of F− in environment and organism is required.
In recent years, researchers have invested a great deal of efforts to develop various analytical techniques for F−, including electrochemical methods, atomic absorption spectroscopy, fluorescent chemosensors and so on.18,19 Among these techniques, the fluorescent chemosensors have attracted great attention because of their simplicity, reliability and non-invasive detection.20–24 To date, a large number of chemosensors have been developed for detecting of F−.25–28 These chemosensors are designed by using three main strategies, including hydrogen bonding between F− and NH groups (amide, pyrrole, indole, urea and so on), B–F complexation, and F−-triggered desilylation.29–41 The chemosensors based on a hydrogen-bond strategy are usually disturbed by other basic anions such as H2PO4− and AcO− because they have similar surface charge density and basicity to F−.42 In addition, the increase of the ionic strength and hydration enthalpy of F− in water often makes the hydrogen bond ineffective in aqueous medium.43 The chemosensors based on B–F complexation can detect F− in drinking water and fluorine-containing chemical agents, but their cytotoxicity limits their biological applications.44 While F-triggered desilylation-based chemosensors can alleviate the problems faced by the first two strategies, so it has attracted more and more attention.
Recently, a novel flavone-based fluorescent chemodosimeter 3-triisopropylsilylflavone (3-TPSF) has been designed and synthesized to selective identify F−1.45. 3-TPSF is produced by a triisopropylsilyl group masking the hydroxyl group of 3-hydroxyflavone (3-HF). As one of flavone derivatives, 3-HF can exhibit the excited state intramolecular proton transfer (ESIPT) process and has favorable fluorescence properties. In addition, fluorescent sensors with ESIPT can avoid the self-absorption due to the large Stokes shift in ESIPT process, which has been studied theoretically.46–53 3-TPSF interacts with F− to induce a unique fluorescence response. Zhang et al. believed that the fluorescence change is ascribed to ESIPT triggered by F− cleaving the Si–O bond. In experiment, they measured the changes of the absorption and emission spectra after the addition of F− by the titration experiments. However, the detailed sensing process cannot be directly obtained. In addition, the ESIPT process and the evolution of structure in the recognition process need to be further theoretically verified.
In this work, the sensing mechanism of the chemodosimeter 3-TPSF is explored by utilizing density functional theory (DFT) and time-dependent density functional theory (TD-DFT) methods. The structural changes and electronic characters of 3-TPSF and its products in the ground (S0) and excited (S1) states are investigated. Laplacian bond order (LBO) of all bonds in 3-TPSF is calculated to predict reaction sites of F−. The potential energy curves in the S0 and S1 states are constructed to investigate the tautomerization process from the normal (N) form to the proton-transferred (T) form. The absorption and emission spectra in a mixed solvent are simulated and compared with experimental measurements. The work is intended to provide a theoretical verification of the fluorescence sensing mechanism and an in-depth understanding of the sensing process.
2. Computational details
In this study, the DFT and TDDFT methods are applied to optimize the structures in the S0 and S1 states, respectively.54,55 The mPW1PW91 functional and TZVP basis set is used for all calculations due to the consistency with the experimental results.56,57 There are no constraints on the optimization of these structures. The transition state is searched by using the keyword opt = TS. Frequency analyses are performed to confirm that the optimized structures are corresponding to the local minima. The searched transition state is confirmed to have only one imaginary frequency by frequency analyses and further confirmed by the intrinsic reaction coordinate (IRC) calculation. Since the experiments were conducted in a mixed solvent of acetonitrile (ACN) and water, the mixed solvent effects of ACN and water are introduced through the integral equation formalism variant of the polarizable continuum model (IEFPCM).58,59 The potential energy curves in the S0 and S1 states are constructed by fixing the hydroxyl bond length. The absorption spectra are simulated by the vertical excitation energy on the S0-structure and the emission spectra are calculated based on the S1-structure. All calculations above are performed by Gaussian 16 package.60 Bond order and the component percentage of electron density are analyzed by Multiwfn package.61
3. Results and discussion
3.1. Optimized geometric structures
The optimized geometric structures of the fluorescent chemodosimeter 3-TPSF and its products at the mPW1PW91/TZVP theoretical level have been shown in Fig. 1. The vibrational frequencies of these structures are calculated and confirmed that these structures are all local minima. 3-TPSF is a novel fluorescent chemodosimeter, which is based on the flavonol. For 3-TPSF, the hydroxyl group is masked by a triisopropylsilyl group to recognize F−, which prevents proton transfer in both the S0 and S1 states. As seen in the Fig. 1, the dihedral angles δ(C1–C2–O1–Si) and δ(C2–C3–C4–C5) of 3-TPSF in the S0 state are −5.38° and 33.27°, respectively. Upon photo-excitation, they change to 1.28° and 14.87° separately. The changes of the two dihedral angles indicate that the structure of 3-TPSF has been twisted during the photo-excitation. The addition of F− triggers the desilylation reaction to form the anionic state of 3-HF (named 3-HF−). 3-HF− is almost a planar structure with the dihedral angle δ(C2–C3–C4–C5) of −0.14° and 3.28° in the S0 and S1 states, respectively, and then capture H+ of the mixed aqueous medium to be transformed into 3-HF. For 3-HF, the hydroxyl group is recovered and forms an intramolecular hydrogen bond O1–H⋯O2 with the adjacent O2 atom. The lengths of the O1–H and H⋯O2 bonds of the N form in the S0 state are 0.976 Å and 1.980 Å, respectively. After photo-excitation to the S1 state, the bond length of O1–H is lengthened to 1.000 Å and that of H⋯O2 is shortened to 1.797 Å. In addition, the bond angle θ(O1–H⋯O2) is increased from 119.55° in the S0 state to 125.27° in the S1 state. These changes can indicate that the strength of the intramolecular hydrogen bond O1–H⋯O2 increases in the S1 state, which will promote the proton transfer process. The benzene ring is not coplanar with the chromone moiety and the dihedral angle δ(C2–C3–C4–C5) is reduced from 19.99° in the S0 state to 2.43° in the S1 state, indicating that the N form of 3-HF tends to be more planar after photo-excitation. For the T form, the bond length of O1⋯H is lengthened from 1.785 (S0) to 2.012 Å (S1) and that of H–O2 is shortened from 1.000 (S0) to 0.977 Å (S1) with a concomitant decrease of the bond angle θ(O1⋯H–O2) from 125.50° (S0) to 117.23° (S1), confirming that the hydrogen bond O1⋯H–O2 is more stable in the S0 state. The dihedral angles δ(C2–C3–C4–C5) in the S0 and S1 states are −0.01° and 2.35°, respectively, meaning that the T form has a relatively planar structure.
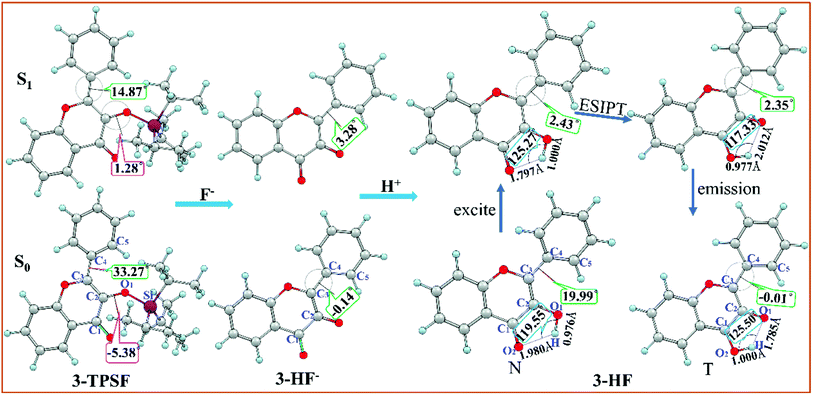 |
| | Fig. 1 Optimized structures of the fluorescent chemodosimeter 3-TPSF and its products at the mPW1PW91/TZVP theoretical level. Light blue: H; gray: C; yellow: S; red: O; fuchsia: Si. | |
3.2. Reaction site and Si–O cleavage process
In order to predict the reaction site of F−, Laplacian bond order (LBO) of all bonds in 3-TPSF is calculated and shown in Fig. 2. LBO is defined according to the Laplacian electron density in the fuzzy overlap space, which is proposed by Lu et al.62 LBO can exhibit bonding strength because it has a good correlation with the bond dissociation energy. In general, the larger LBO value of a bond, the stronger the bonding strength is. As can be seen from the Fig. 2(a), the calculated LBO of Si–O bond is 0.195, which is smallest among all bonds in 3-TPSF, indicating that the bonding strength of Si–O bond is the weakest. Therefore, it can be determined that the Si–O bond is the cleavage site of F−. In order to explore the dynamics characteristics of the desilylation reaction, the free energy profile of the desilylation process is calculated. The energy of the reagent is chosen as zero for reference and other calculated energies are relative energies. The energy diagram is shown in Fig. 2(b). It can be seen from the Fig. 2(b) that the formation of intermediate requires absorbing an energy of 5.69 kcal mol−1. A transition state in this desilylation reaction is searched at the position of the Si–O bond cleavage and the F–Si bond formation, which is further confirmed by IRC (shown in Fig. S1†). The calculated free energy barrier between the transition state and the reactant is 18.33 kcal mol−1, which is a moderate reaction barrier, indicating that 3-TPSF has a rapid response speed to F−. The Si–O bond of 3-TPSF is cleaved by F− to form 3-HF− and fluorotriisopropylsilane (FTPS), whose energy is 27.77 kcal mol−1 lower than that of the reactant. 3-HF− has strong electron-donating ability and can capture H+ from the mixed aqueous medium to be transformed into 3-HF.
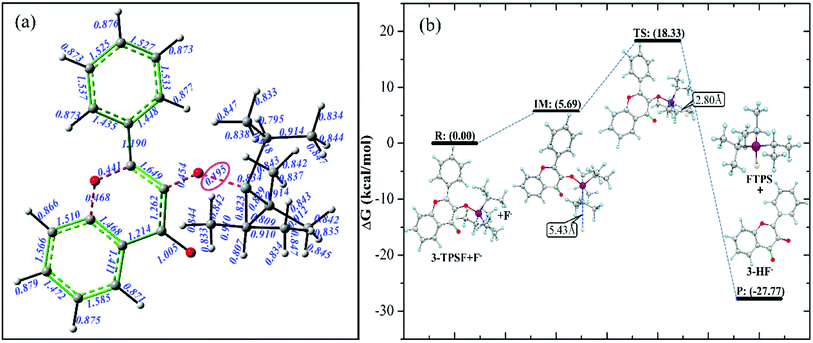 |
| | Fig. 2 Laplacian bond order (LBO) for all bonds (a) and the free energy profile of the desilylation process (b) of 3-TPSF. | |
3.3. Excited state intramolecular proton transfer in 3-HF
3-HF is transformed from 3-HF− by combining with H+ of the mixed aqueous medium, which has the hydrogen-bonding donor group. The phenoxy anion combines with one H+ to form the phenolic hydroxyl group, which can form an intramolecular hydrogen bond (O1–H⋯O2) with the adjacent O2 atom. Structural parameters in the Section of 3.1 have confirmed that the intramolecular hydrogen bond O1–H⋯O2 is enhanced in the S1 state, which can provide a driving force for proton transfer. To explore the detailed process of proton transfer, the potential energy curves of 3-HF in the S0 and S1 states are scanned by keeping the O1–H bond length fixed at a series of values, which can describe energetic pathways of proton transfer qualitatively. Fig. 3 displays the potential energy curves of the S0 and S1 states and the energy of the initial structure in the S0 state is selected as a zero reference. It can be seen from the Fig. 3 that the energy barrier for the isomerization of the N form into the T form in the S0 state is 11.96 kcal mol−1, which is too high for the isomerization to occur. While for the S1 state, only an energy barrier of 1.86 kcal mol−1 exists between the N form and the T form, which is relatively low to overcome easily. Therefore, proton transfer process is more likely to occur in the S1 state and then to form the T structure, which is relatively stable due to the lower energy.
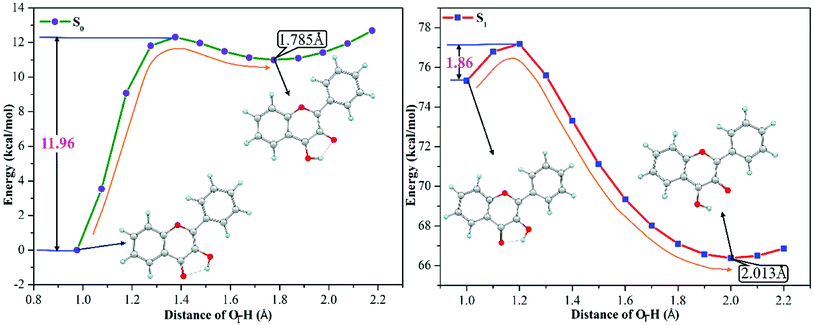 |
| | Fig. 3 The calculated potential energy curves of 3-HF in the S0 and S1 states at the mPW1PW91/TZVP theoretical level. | |
3.4. Electronic spectra
The UV-vis absorption technique is used to examine the recognition behavior of chemodosimeter 1 towards various anions including F−, Cl−, Br−, I−, ClO4−, AcO− and HSO4−.45 The experiment found that only F− induces the decrease of the absorption bands at 305 nm and 335 nm as well as the appearance of a new absorption band at 455 nm.45 In order to attribute these absorption bands, the absorption spectra of 3-TPSF, 3-HF− and 3-HF are calculated according to the optimized geometries of the S0 state at the TD-DFT/mPW1PW91/TZVP theoretical level. The calculated vertical excitation energies, the corresponding transition oscillator strengths and compositions of the first six absorbing transitions are shown in Table 1 and the simulated absorption spectra are exhibited in Fig. 4. It can be known from the Table 1 that the S0 → S1 transition of 3-TPSF is at 343 nm with the oscillator strength of 0.3535, which corresponds to the absorption peak of 335 nm measured in the experiment.45 The S0 → S3 transition is at 282 nm, which agrees with the experimental value of 305 nm.45 For 3-HF−, the calculated absorption peak of 455 nm corresponding to the S0 → S1 transition reproduces the experimental data of 455 nm.45 Therefore, the new absorption band appearing after adding F− is assigned to the anionic state of 3-HF, which is confirmed that the anion state of 3-HF is first formed after adding F− and then formed 3-HF by combining with H+. While for 3-HF, three permitted singlet transitions (S0 → S1, S0 → S3 and S0 → S6) are at 338 nm 286 nm and 246 nm, respectively, which are all not consistent with the measured values after the addition of F−, further confirming the formation of 3-HF− first.
Table 1 The calculated vertical excitation energies (nm), the corresponding transition oscillator strengths and compositions of the first six absorbing transitions for 3-TPSF, 3-HF− and 3-HF
| |
Transition |
λ (nm) |
f |
Composition |
CI (%) |
Expt (nm) |
| 3-TPSF |
S0 → S1 |
343 |
0.3535 |
H → L |
98.21% |
335 |
| S0 → S3 |
282 |
0.1385 |
H−2 → L |
80.17% |
305 |
| H−1 → L |
3.26% |
| H → L+1 |
11.37% |
| S0 → S6 |
266 |
0.1407 |
H−5 → L |
7.85% |
|
| H−4 → L |
7.28% |
| H−3 → L |
28.00% |
| H−2 → L |
7.75% |
| H → L+1 |
40.37% |
| S0 → S1 |
455 |
0.3824 |
H → L |
99.59% |
455 |
| 3-HF− |
S0 → S4 |
307 |
01171 |
H → L+1 |
32.43% |
|
| H → L+3 |
64.21% |
| S0 → S1 |
338 |
0.4911 |
H → L |
97.92% |
| S0 → S3 |
286 |
0.1565 |
H−4 → L |
12.41% |
| H−1 → L |
80.22% |
| H−1 → L |
3.24% |
| 3-HF |
S0 → S6 |
246 |
0.1607 |
H → L+1 |
3.04% |
|
| H−5 → L |
64.10% |
| H−3 → L+1 |
19.88% |
| H → L+2 |
7.03% |
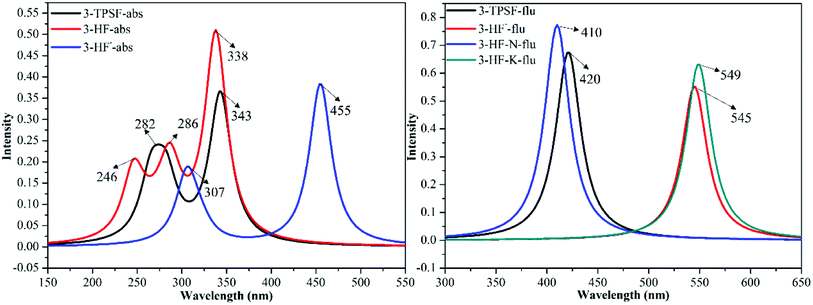 |
| | Fig. 4 The calculated absorption and fluorescence emission spectra of 3-TPSF, 3-HF− and 3-HF at the mPW1PW91/TZVP theoretical level. | |
The fluorescence emission experiment in the mixed aqueous medium explores the recognition characteristics of 3-TPSF. The experiment shows that the weak emission peak at 400 nm decreases with the addition of F− and is accompanied by an enhanced fluorescent peak at 530 nm, which has a large Stokes shift of 180 nm. To investigate the optical properties of 3-TPSF, 3-HF− and 3-HF, the emission spectra are calculated according to the optimized structures of the S1 state and shown in Fig. 4. The calculated emission band of 3-TPSF is centered at 420 nm, which matches the experimental result of 400 nm. For 3-HF−, the emission peak is calculated at 545 nm, which coincides with the newly observed emission peak (530 nm) upon addition of F−. While for 3-HF, the emission peaks of the N and T structures are calculated at 410 nm and 549 nm, respectively. The long-wavelength fluorescence of the T structure that is induced by ESIPT is tally with the newly emerged fluorescence peak of 530 nm after the addition of F−. Thus, the new fluorescence of 530 nm measured in experiment is contributed by 3-HF− and the T structure of 3-HF.
3.5. Frontier molecular orbitals (FMOs)
In order to understand the properties of the reactants and products in the S1 state deeply, the charge distributions should be investigated. Frontier molecular orbitals can give a clear picture of charge transfer and charge distribution. For 3-TPSF, 3-HF− and 3-HF, the highest occupied molecular orbital (HOMO) and the lowest unoccupied molecular orbital (LUMO) that are only involved in the S0 → S1 transition are calculated and displayed in Fig. 5. For 3-TPSF, the electron density of the HOMO and LUMO is mainly distributed on the flavone skeleton and the electronic transition from HOMO to LUMO is a ππ*-type transition. In addition, it can be noted that the contribution of the triisopropylsilyl moiety and the benzene ring of the chromone moiety to LUMO is less than that to HOMO, meaning that the charge on the triisopropylsilyl moiety and the benzene ring of the chromone moiety is transferred during the transition from HOMO to LUMO. For 3-HF−, it can be seen that the electron density of the HOMO and LUMO are distributed on different parts. For HOMO, the electron density is mainly localized on the pyridone ring and the benzene ring in the right side. While for LUMO, the electron density distributed on the chromone moiety is increased. For 3-HF, the electron density of the HOMO and LUMO is located over the entire molecular framework and the S0 → S1 transition is also a ππ*-type transition. In the transition from HOMO to LUMO, the electron density on the hydroxide radical moiety is significantly reduced and that on the O2 atom of the carbonyl group is increased. The changes of the charge distribution on the atoms involved in the intramolecular hydrogen bond O1–H⋯O2 can be used to explore the proton transfer process. The natural bond orbital analyses show that the negative distribution on the O1 atom is decreased from −0.645 to −0.639 and that on the O2 atom is increased from −0.627 to −0.645. The decrease of the electron density on the hydroxide radical moiety can affect the intramolecular hydrogen bond O1–H⋯O2, and the increase of the electron density on the O2 atom can strengthen hydrogen bond and facilitate proton transfer. These charge density changes indicate that the S1 state involves charge transfer.
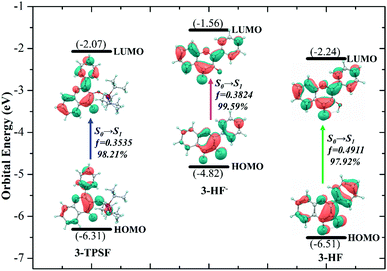 |
| | Fig. 5 Frontier molecular orbitals involved in the first singlet transition of 3-TPSF, 3-HF− and 3-HF. | |
In order to quantitatively study the electron density variation of 3-TPSF, 3-HF− and 3-HF during the electron excitation, we divide 3-TPSF, 3-HF− and 3-HF into two parts, respectively, and calculate the component percentage of electron density on each part by Multiwfn package. Fig. 6 shows the division of molecular systems and the part 1 of 3-TPSF component percentage of electron density. For 3-TPSF, it can be seen from the Fig. 6 that part 1 and part 2 have 9.28% and 90.72% electron density on the HOMO, respectively. While on the LUMO, the electron density of part 1 is increased to 28.16% and that of part 2 is decreased to 71.84%. This means that about 18.88% electron density is transferred from part 2 to part 1 in the transition process. For 3-HF−, the electron density of part 1 is increased from 8.27% on the HOMO to 36.41% on the LUMO and that of part 2 is decreased from 91.73% on the HOMO to 63.59% on the LUMO, indicating about 28.14% electron density transferring from part 2 to part 1. While for 3-HF, the electron density of part 1 and part 2 changes from 10.34% and 89.66% on the HOMO to 28.02% and 71.98% on the LUMO, respectively, implying that about 17.68% electron density is transferred from part 2 to part 1. This discussion results are consistent with the frontier molecular orbital analysis and further provide a quantitative description of the electron density change. In addition, it can conclude that the intramolecular charge transfer degree in 3-HF− is stronger than in 3-TPSF, which will induce a long-wavelength absorption or emission.
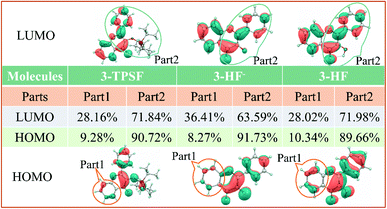 |
| | Fig. 6 The divided part 1 and part 2 of 3-TPSF, 3-HF− and 3-HF as well as the components percentages of electron density. | |
3.6. Fluorescence sensing mechanisms
According to our theoretical analysis above, the sensing mechanism scheme is described in Fig. 7. The fluorescent chemodosimeter 3-TPSF exhibits different photophysical behavior before and after the addition of F−. The triisopropylsilyl group in 3-TPSF is used as a sensing group to detect F−. The calculation results show that the added F− cleaves the Si–O bond of 3-TPSF to form 3-HF−, which makes the fluorescence peak shift from 400 nm to 530 nm. 3-HF− with a calculated emission at 545 nm captures H+ of the mixed aqueous medium to be transformed into 3-HF. The hydroxyl group in 3-HF is recovered and forms an intramolecular hydrogen bond O1–H⋯O2 with the adjacent O2 atom. Upon photo-excitation, ESIPT occurs in 3-HF and form a T structure with an emission at 549 nm. Therefore, the fluorescence of 530 nm measured after the addition of F− is attributed to 3-HF− and the T structure of 3-HF, which is red-shifted compared to the original fluorescence emission of 3-TPSF. The different fluorescence behaviors make 3-TPSF act as a fluorescent chemodosimeter to recognize F−.
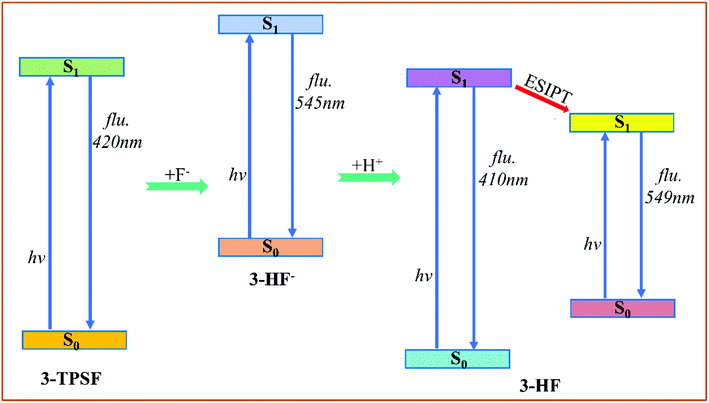 |
| | Fig. 7 The sensing mechanism scheme of 3-TPSF for F−. | |
4. Conclusions
In this work, the detection mechanisms of 3-hydroxyflavone-based (3-HF) fluorescent chemodosimeter 3-triisopropylsilylflavone (3-TPSF) for fluoride (F−) have been investigated by the DFT and TDDFT calculations. The calculated Laplacian bond order (LBO) shows that the Si–O bond in 3-TPSF is the cleavage site of F− due to the weakest bonding strength of Si–O bond. The free energy barrier of 18.33 kcal mol−1 indicates that F-triggered desilylation reaction can occur and then form the anionic state of 3-HF (3-HF−) with a fluorescence peak at 545 nm. 3-HF− capture H+ of the mixed aqueous medium to be transformed into 3-HF with an intramolecular hydrogen bond (O1–H⋯O2). The calculated structural parameters confirm that the hydrogen bond O1–H⋯O2 is enhanced in the S1 state, which facilitates the excited state intramolecular proton transfer (ESIPT). The energy barrier of 1.86 kcal mol−1 in the S1 state obtained from the constructed potential energy curves indicates that ESIPT in 3-HF occurs to form a T structure, which produces a long-wavelength emission of 549 nm. The fluorescence emitted from 3-HF− and 3-HF both agree with the experimental value of 530 nm appearing after adding F−. Charge transfer analyses indicate that the extent of intramolecular charge transfer in 3-HF− is more intense than in 3-TPSF, which induces a large Stokes shift of 180 nm. Therefore, the sensing mechanism is attributed to the combination of a large charge transfer feature and ESIPT that are caused by desilylation reaction. The significant fluorescent change makes 3-TPSF a chemodosimeter for detecting F−.
Conflicts of interest
We declare that the work does not have any financial or personal relationships with other people or organizations.
Acknowledgements
This work is supported by High Performance Computing Center of Henan Normal University, National Natural Science Foundation of China (grant no. 11604083).
References
- M. Cametti and K. Rissanen, Chem. Soc. Rev., 2013, 42, 2016–2038 RSC.
- V. A. Soloshonok, Current fluoroorganic chemistry: new synthetic directions, technologies, materials, and biological applications, 2006 Search PubMed.
- P. A. Gale, Chem. Commun., 2010, 47, 82–86 RSC.
- J. S. Chen, P. W. Zhou, Z. Li and T. S. Chu, RSC Adv., 2013, 4, 254–259 RSC.
- E. Newbrun, J. Public Health Dent., 2010, 70, 227–233 CrossRef PubMed.
- M. Kleerekoper, Endocrinol. Metab. Clin., 1998, 27, 441–452 CrossRef CAS.
- K. L. Kirk, Biochemistry of the Elemental Halogens and Inorganic Halides, 1991 Search PubMed.
- J. S. Chen, P. Zhou, G. Li, T. S. Chu and G. He, J. Phys. Chem. B, 2013, 117, 5212–5221 CrossRef CAS PubMed.
- S. W. Zhang and T. M. Swager, J. Am. Chem. Soc., 2003, 125, 3420–3421 CrossRef CAS PubMed.
- K. K. Majumdar, Indian J. Public Health, 2011, 55, 303–308 CrossRef PubMed.
- WHO, Guidelines for drinking-water quality, 2004, vol. 38, pp. 104–108 Search PubMed.
- S. Herschel and J. Horowitz, Public Health Dent., 1991, 51, 60–63 CrossRef PubMed.
- P. P. Singh, M. K. Barjatiya, S. Dhing, R. Bhatnagar, S. Kothari and V. Dhar, Urol. Res., 2001, 29, 238–244 CrossRef CAS PubMed.
- Y. Ogawa, M. Morozumi, T. Tanaka and K. Yamaguchi, J. Urol., 1986, 135, 178–181 CrossRef CAS PubMed.
- O. Barbier, L. Arreola-Mendoza and L. M. Del Razo, Chem. Biol. Interact., 2010, 188, 319–333 CrossRef CAS PubMed.
- T. S. Snowden and E. V. Anslyn, Curr. Opin. Chem. Biol., 1999, 3, 740–746 CrossRef CAS PubMed.
- P. A. Gale, N. Busschaert, C. J. Haynes, L. E. Karagiannidis and I. L. Kirby, Chem. Soc. Rev., 2014, 43, 205–241 RSC.
- Y. Zhou, J. F. Zhang and J. Yoon, Chem. Rev., 2014, 114, 5511–5571 CrossRef CAS PubMed.
- R. Gulaboski, V. Mireski and F. Scholz, Electrochem. Commun., 2002, 4, 277–283 CrossRef CAS.
- G. G. V. Kumar, M. P. Kesavan, G. Sivaraman and J. Rajesh, Sens. Actuators, B, 2018, 255, 3194–3206 CrossRef CAS.
- Z. Yang, J. Cao, Y. He, J. H. Yang and J. S. Kim, Chem. Soc. Rev., 2014, 43, 4563–4601 RSC.
- X. Li, X. Gao, W. Shi and H. Ma, Chem. Rev., 2013, 114, 590–659 CrossRef PubMed.
- Z. Guo, S. Park, J. Yoon and I. Shin and, Chem. Soc. Rev., 2014, 43, 16–29 RSC.
- T. W. Bell and N. M. Hext, Chem. Soc. Rev., 2004, 589–598 CAS.
- J. Han, J. Zhang, M. Gao, H. Hao and X. Xu, Dyes Pigm., 2018, 162, 412–439 CrossRef.
- L. Gai, J. Mack, L. Hua, T. Nyokong and S. Zhen, Coord. Chem. Rev., 2015, 285, 24 CrossRef CAS.
- E. J. Jun, Z. Xu, M. Lee and J. Yoon, Tetrahedron Lett., 2013, 54, 2755–2758 CrossRef CAS.
- Z. Xu, N. J. Singh, S.
K. Kim, D. R. Spring, K. S. Kim and J. Yoon, Chem.–Eur. J., 2011, 17, 1163–1170 CrossRef CAS PubMed.
- T. W. Hudnall and F. P. Gabbaie, Chem. Commun., 2008, 44, 4596–4597 RSC.
- Y. Kim and F. P. Gabbaie, J. Am. Chem. Soc., 2009, 131, 3363–3369 CrossRef CAS PubMed.
- K. J. Chang, D. Moon, M. S. Lah and K. S. Jeong, Angew. Chem., 2005, 117, 8140–8143 CrossRef.
- K. Dokyoung, S. Subhankar, W. Taejun, S. Eunseok and H. Jun, Chem. Commun., 2012, 48, 10243–10245 RSC.
- S. Y. Kim, J. Park, M. Koh, S. B. Park and J. I. Hong, Chem. Commun., 2009, 31, 4735–4737 RSC.
- M. Cametti and K. Rissanen, Chem. Commun., 2009, 2809–2829 RSC.
- F. Han, Y. Bao, Z. Yang, T. Fyles, J. Zhao, X. Peng, J. Fan, Y. Wu and S. Sun, Chem.–Eur. J., 2007, 26, 2880–2892 CrossRef PubMed.
- P. Bose, B. N. Ahamed and P. Ghosh, Org. Biomol. Chem., 2011, 9, 1972–1979 RSC.
- J. Wang, Y. Hou, L. Chao, B. Zhang and X. Wang, Sens. Actuators, B, 2011, 157, 586–593 CrossRef CAS.
- Y. Zhou, J. F. Zhang and J. Yoon, Chem. Rev., 2014, 114, 5511–5571 CrossRef CAS PubMed.
- Y. Bao, B. Liu, H. Wang, T. Jiao and R. Bai, Chem. Commun., 2011, 47, 3957–3959 RSC.
- Q. Wang, D. Li, N. Rao, Y. Zhang and L. Yan, Dyes Pigm., 2021, 188, 109166 CrossRef CAS.
- Z. Q. Liu, M. Shi, F. Y. Li, Q. Fang, Z. H. Chen, T. Yi and C. H. Huang, Org. Lett., 2005, 7, 5481–5484 CrossRef CAS PubMed.
- S. K. Patil and D. Das, ChemistrySelect, 2017, 2, 6178–6186 CrossRef CAS.
- S. D. Alapati, M. A. Alam, R. Saha, S. Jana and N. Guchhait, CrystEngComm, 2012, 14, 1527–1530 RSC.
- K. Swamy, Y. Lee, H. Lee, J. Chun, Y. Kim, S. Kim and J. Yoon, J. Org. Chem., 2006, 71, 8626–8628 CrossRef CAS PubMed.
- Y. Zhang, Y. Deng, N. Ji, J. Zhang, C. Fan, T. Ding, Z. Cao, Y. Li and Y. Fang, Dyes Pigm., 2019, 166, 473–479 CrossRef CAS.
- B. Cao, J. Han, Q. Zhou, C. Sun and Y. Shi, J. Mol. Liq., 2020, 303, 112627 CrossRef.
- J. Han, B. Cao, X. Zhang, X. Su, L. Diao, H. Yin and Y. Shi, J. Mol. Liq., 2020, 306, 112894 CrossRef CAS.
- S. Yang, Y. Zhang and K. Han, J. Lumin., 2019, 206, 46–52 CrossRef CAS.
- P. W. Zhou and K. L. Han, Acc. Chem. Res., 2018, 51, 1681–1690 CrossRef CAS PubMed.
- X. Lu, Y. Zhai, P. Song and M. Zhang, Struct. Chem., 2018, 29, 1655–1661 CrossRef CAS.
- Y. Dai, M. Zhang, M. Zhang, L. Sun, J. Meng and P. Song, Spectrochim. Acta. A., 2018, 200, 345–350 CrossRef CAS PubMed.
- J. Han, X. Liu, C. Sun, L. You, Y. Hang and S. Ying, RSC Adv., 2018, 8, 29589–29597 RSC.
- M. Zhang, Q. Zhou, C. Du, Y. Ding and P. Song, RSC Adv., 2016, 6, 59389–59394 RSC.
- C. Lee, W. Yang and R. G. Parr, Phys. Rev. B: Condens. Matter Mater. Phys., 1988, 37, 785–789 CrossRef CAS PubMed.
- D. A. Becke, J. Chem. Phys., 1992, 96, 2155–2160 CrossRef.
- C. Adamo and V. Barone, J. Chem. Phys., 1998, 108, 664–675 CrossRef CAS.
- A. Schäfer, C. Huber and R. Ahlrichs, J. Chem. Phys., 1994, 100, 5829–5835 CrossRef.
- V. Barone, R. Improta and N. Rega, Theor. Chem. Acc., 2004, 111, 237–245 Search PubMed.
- L. Hui and J. H. Jensen, J. Comput. Chem., 2004, 25, 1449–1462 CrossRef PubMed.
- M. J. Frisch, G. W. Trucks, H. B. Schlegel, G. E. Scuseria, M. A. Robb, J. R. Cheeseman, G. Scalmani, V. Barone, G. A. Petersson, H. Nakatsuji, X. Li, M. Caricato, A. V. Marenich, J. Bloino, B. G. Janesko, R. Gomperts, B. Mennucci, H. P. Hratchian, J. V. Ortiz, A. F. Izmaylov, J. L. Sonnenberg, D. Williams-Young, F. Ding, F. Lipparini, F. Egidi, J. Goings, B. Peng, A. Petrone, T. Henderson, D. Ranasinghe, V. G. Zakrzewski, J. Gao, N. Rega, G. Zheng, W. Liang, M. Hada, M. Ehara, K. Toyota, R. Fukuda, J. Hasegawa, M. Ishida, T. Nakajima, Y. Honda, O. Kitao, H. Nakai, T. Vreven, K. Throssell, J. A. Montgomery Jr, J. E. Peralta, F. Ogliaro, M. J. Bearpark, J. J. Heyd, E. N. Brothers, K. N. Kudin, V. N. Staroverov, T. A. Keith, R. Kobayashi, J. Normand, K. Raghavachari, A. P. Rendell, J. C. Burant, S. S. Iyengar, J. Tomasi, M. Cossi, J. M. Millam, M. Klene, C. Adamo, R. Cammi, J. W. Ochterski, R. L. Martin, K. Morokuma, O. Farkas, J. B. Foresman and D. J. Fox, Gaussian 16, Revision B.01, Gaussian, Inc., Wallingford CT, 2016 Search PubMed.
- T. Lu and F. Chen, J. Comput. Chem., 2012, 33, 580–592 CrossRef CAS PubMed.
- T. Lu and F. Chen, J. Phys. Chem. A, 2013, 117, 3100–3108 CrossRef CAS PubMed.
Footnote |
| † Electronic supplementary information (ESI) available. See DOI: 10.1039/d1ra06431b |
|
| This journal is © The Royal Society of Chemistry 2022 |
Click here to see how this site uses Cookies. View our privacy policy here.  Open Access Article
 *,
Xueli Jia and
Hongsheng Zhai*


